 Zhengquan Guo
 Xingping Zhang3,4*
 Haonan Zhang
- 1School of Economics and Management, North China University of Technology, Beijing, China
- 2Beijing Urban Governance Research Center, North China University of Technology, Beijing, China
- 3School of Economics and Management, North China Electric Power University, Beijing, China
- 4Beijing Key Laboratory of New Energy and Low-Carbon Development, North China Electric Power University, Beijing, China
This paper develops a hybrid computable general equilibrium model to explore the impacts of reducing renewable energy subsidies on China's energy transition in various scenarios. The results of the benchmark scenario indicate that China can realize its regulatory goals in energy consumption and structure and carbon emission intensity in 2030. This paper sets various policy scenarios to simulate the impacts of reducing renewable subsidies between 2021 and 2030. The analytical results of the scenarios indicate that the government's 2030 target for total energy and natural gas consumption and carbon emission intensity can be achieved. However, the target for non-fossil energy is hard to fulfill when the renewable energy subsidy is reduced. The empirical results also indicate that a moderate renewable energy subsidy associated with significant technical progress in renewable energy is a crucial way for China to fulfill government targets and energy transition in 2030.
Introduction
In recent years, under the challenge of environmental degradation and climate change, the global renewable energy has made great progress with the strong support of government policies (Ji et al., 2019; Xu et al., 2019; Zhang and Ji, 2019). In order to effectively promote the development of renewable energy, such as wind power and solar power, China has also established a complete policy support system for renewable energy (Ji and Zhang, 2019). China has formulated a series of policies to promote renewable energy since 2006, especially the benchmark feed-in tariff (listed in Tables 1, 2) and tax incentives. The added-value tax is levied by half, and the enterprise income tax is exempted from the first year to the third year and is halved from the fourth year to the sixth year when the projects of wind and solar power receive income. Those policies have effectively improved the economic benefits of wind and solar power enterprises and broaden renewable energy prospects in China.
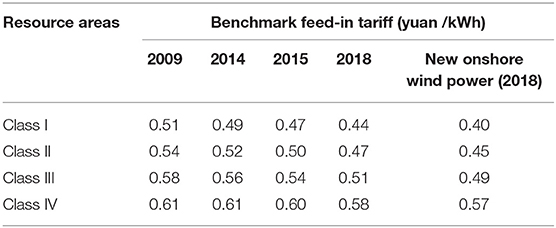
Table 1. Benchmark feed-in tariff of wind power.
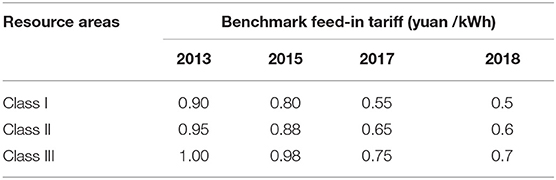
Table 2. Benchmark feed-in tariff of solar power.
China has experienced rapid development in renewable energy and has been the biggest generator of wind and solar power in the world. By the end of 2018, the installed capacity of wind and solar power reached 360 GW. The generation of wind and solar power totaled 600 TWh, comprising nearly 9% of total electricity generation. Moreover, China has set an ambitious target for non-fossil fuel energy in the Energy Production and Consumption Revolution Strategy (2016–2030): the ratio of non-fossil fuel energy will be 20% and more than half the total energy consumption in 2030 and 2050, respectively. Recently, subsidies for renewable energy in China have declined with the expansion in the scale and technical progress in renewable energy. In particular, the government wants to achieve grid parity in wind and solar power in 2020. In 2019, the government stipulated that the price of new centralized onshore and offshore wind power projects permitted should be determined through market competition. Because the subsidy policy in China is crucial for promoting renewable energy development, it is important to assess the impacts of a reduction in subsidies on renewable energy and energy transition.
The computable general equilibrium (CGE) model incorporates all economy components and all economic links into a unified framework based on the general equilibrium theory of Walras. It describes sectoral interactions in the economy and can simulate the impacts and feedback from energy and environmental policy shocks on energy, the economy, and the environment. Therefore, it is widely used in energy and environmental policy evaluation (Pui and Othman, 2017; Li et al., 2018; Tran et al., 2019). As a top-down macro-model, CGE has the advantage of simulating the impact of policy on macroeconomic activities, but it has difficulty describing microcharacteristics in energy, emissions reduction technology, cost, and so on. The bottom-up microtechnology model can describe the technical and economic characteristics of energy and emission reduction technology. To achieve the advantages of both top-down and bottom-up models, a hybrid CGE model emerged that integrates the ideas of the two models (Xie et al., 2018).
The first kind of the hybrid CGE model combines a bottom-up energy partial equilibrium model that reflects energy information and a top-down CGE model. Tuladhar et al. (2009) analyzed the macroeconomic impacts of US climate change policies for three different emissions pathways using a top-down (multiregion national model, MRN) bottom-up (North American electricity and environment model, NEEM) integrated model. The MRN is a forward-looking, dynamic CTE model of the United States. The NEEM is a flexible, partial equilibrium model of the North American electricity market, taking into account demand growth, available generation, environmental technologies, and both current and future environmental regulations. Martinsen (2011) introduced energy technology learning in a national CGE model through soft links to a global technology rich energy systems model and a national energy systems model (Markal Norway) and analyzed the influence of global policy scenarios, particularly spillover of technology learning, on the energy demand of non-energy sectors of the economy. Arndt et al. (2016) developed a sequential approach to link a bottom-up energy sector model (South African TIMES Model, or SATIM) with a detailed dynamic general equilibrium model of South Africa, which is an intertemporal bottom-up partial equilibrium optimization model of South Africa's energy sector. The approach is designed to simultaneously address the shortcomings and maintain the benefits of detailed energy sector and general equilibrium models. Helgesen et al. (2018) linked a bottom-up energy system model1 and a top-down CGE model to analyze both the energy system impacts and the economic impacts of reducing greenhouse gas emissions in transportation. Wu et al. (2019) adopted a hybrid of these approaches, which employed a soft link between the Asia-Pacific integrated model/CGE for Taiwan (top-down) and the Taiwan 2050 Calculator (bottom-up), to evaluate the effects of energy efficiency improvements in Taiwan. Related hybrid CGE models include Lanz and Rausch (2011) and Igos et al. (2015).
The second kind of the hybrid CGE model is a submodule of energy technology functions, which reflects the characteristics of energy technology and the economy, embedded in a top-down CGE model. Sue (2006, 2008) constructed an energy social accounting matrix, which embodied the subdivision of different power technology characteristics. Then, a hybrid CGE model was established, which included a bottom-up power technology functions module and a top-down CGE model. A dynamic CGE model for global carbon emission prediction and policy assessment (EPPA) was established by the MIT Joint Program on the Science and Policy of Global Change (Jacoby et al., 2004, 2014; Paltsev et al., 2005), which includes the submatrix and production function submodule reflecting the technical and economic characteristics of energy and power technology and the economy. Böhringer and Rutherford (2006, 2008) established a hybrid model combining an energy sector segmentation model with a CGE model based on an idea in the EPPA model and analyzed energy and environmental policies, such as gradually abolishing nuclear energy, a green quota, and a carbon tax. Using the method of subdividing the energy sector in the MIT EPPA model, Zhang et al. (2012, 2013) developed a CGE model with global coverage that disaggregated China's 30 provinces, including details on the energy system, and applied it to assess the impact of the current binding provincial carbon dioxide (CO2) emission intensity targets. Wu et al. (2016, 2017) established a CGE model of China's multiregional energy–environment–economy with 30 regions and 17 sectors based on the MIT EPPA model. Meng et al. (2018) used a CGE model that integrates an electricity supply model, in which the electricity industry was disaggregated into eight sectors, to measure the effects of an emission trading scheme (ETS) on the energy sector and economy in Australia. Relevant hybrid CGE models also include Proença and Aubyn (2013), Cai and Arora (2015), Yun et al. (2016), Tabatabaei et al. (2017), and Lou (2017).
The most important difference between the two kinds of hybrid CGE models is the interconnection between the bottom-up model of energy information and the top-down macro-CGE model. The first kind of model, a microlocal equilibrium model and a macro-CGE model, is constructed under different economic assumptions. Researchers mainly integrate the results of the core variables in the two models and adjust the relevant exogenous parameters through external artificial operations, and the core variables in the two models achieve uniform convergence by a soft-link mechanism. Sometimes it is difficult to obtain the optimal solution.
The second kind of model connects the two models through specific functions. The information processing and interaction between the two models are automatically completed by programming, so the optimal solution to the two models can achieve uniform convergence. Many hybrid CGE models have been developed based on the second model.
This paper develops a hybrid CGE model of China's energy and environmental policy evaluation following the approach in this second model. The model disaggregates China's energy sectors into 11 subsectors to reflect the technical and economic characteristics of various energy sources with the biproportional scaling method and the method used in preparing China's input–output table for 2012 (Department of National Economic Accounting National Bureau of Statistics, 2014), and then construct the energy factors input functions module. Lastly, we develop a hybrid CGE model by embedding the energy factors input functions module into the production functions module. Using a hybrid CGE model, this paper determines the impacts of a policy to reduce subsidies for renewable energy and energy transformation in China in various scenarios.
The rest of this paper is as follows. The section Methodology proposes a hybrid CGE model, the section Sectoral Setting and Data Sources describes the sector setting and data sources, the section Setting Policy Scenarios describes different scenarios of the policy to reduce subsidies, the section Empirical Results and Discussion analyzes and discusses the results, and the section Conclusions and Policy Implications concludes this paper.
Methodology
The Proposed Hybrid CGE Model
We develop a hybrid CGE model of China's energy and environmental policy evaluation including five functional modules, production, trade, income and expenditure, carbon emissions and social welfare, and market clearing and model closure. Figure 1 illustrates the structure of the proposed model, and the main functions of each module are explained in the Supplemental Material.
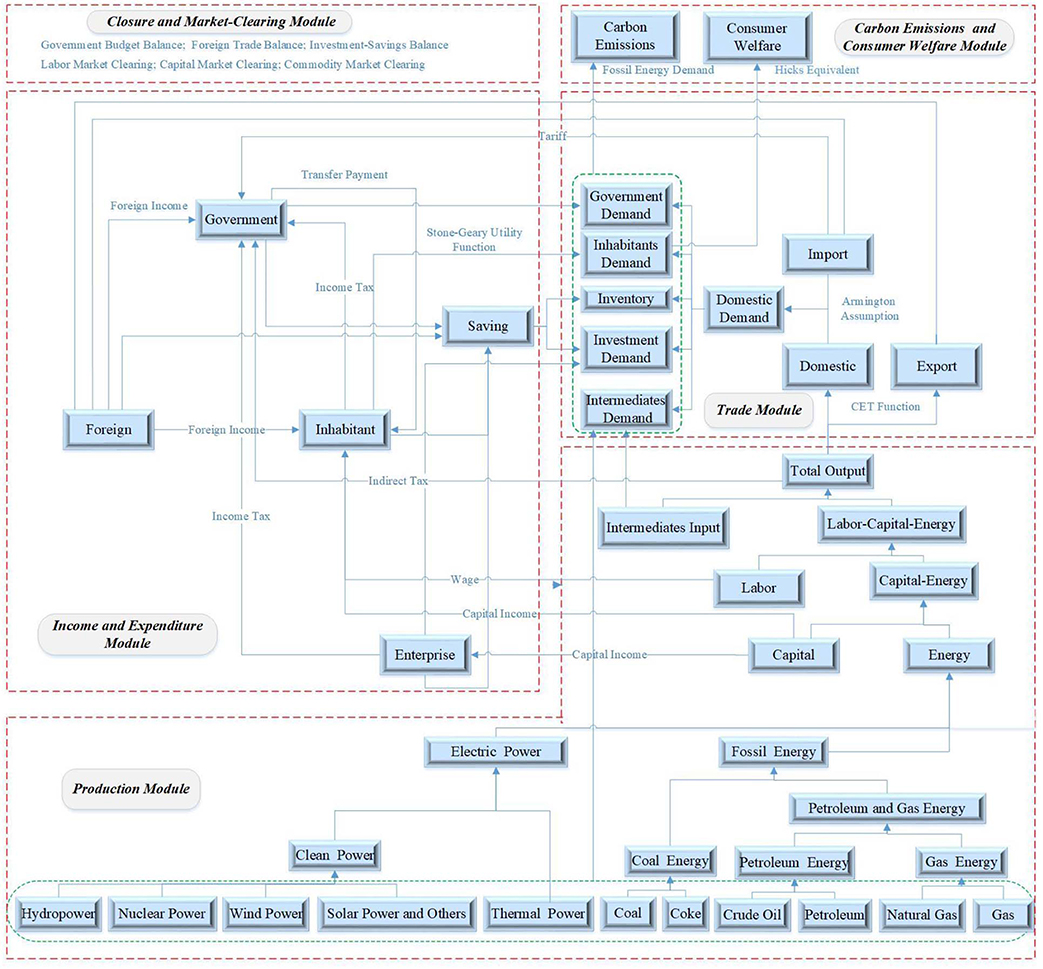
Figure 1. Framework of the hybrid CGE model.
Production Module
About the structure of the input factors in terms of production functions, we first combine capital and energy input as capital–energy composition, then combine capital–energy input with labor input as labor–capital–energy composition. Lastly, a sector's final output is produced by labor–capital–energy composition input and intermediate input. This paper uses a Leontief function to combine labor–capital–energy composition with intermediate input and the constant elasticity of substitution (CES) function to combine other input factors.
This paper explores the impact of a reduction in subsidies on China's energy transition and renewable energy development. To embody the technological and economic characteristics of various types of energy and get robust simulation results, we disaggregate the energy sector in detail as shown in the production module of Figure 1. First, the coal sector comprises coal and coke, the petroleum sector includes crude oil and petroleum energy, the gas energy sector includes natural gas and gas, and clean energy comprises hydroelectricity, nuclear, wind power, solar power, and others. Second, according to the substitution relationship among energy sources, petroleum energy and gas energy are combined as petroleum and gas energy, then the fossil fuel-based energy is disaggregated into coal and composite petroleum and gas. At the same time, electrical power is further divided into thermal and clean power. Lastly, energy input consists of fossil fuel-based energy and electricity. Ultimately, the energy sector is disaggregated into 11 subsectors listed at the bottom of Figure 1.
Trade Module
In this module, the constant elasticity transformation (CET) function is employed to allocate the sectors' domestic products, and the producers determine the optimal allocation strategy among various markets in the given production technology constraints. The sectors' demand function for domestic production follows the “Armington hypothesis,” and consumers minimize costs by optimizing the mix of domestic and imported products.
Income and Expenditure Module
This module encompasses income and expenditure of residents, enterprises, and government. The resident revenue is derived from labor factor income, capital factor income, government and enterprise transfer payment to residents, as well as overseas income. The resident expenditure includes consumption and savings, wherein the resident expenditure function is demonstrated by the Stone–Geary utility function. The enterprise income is mainly from the capital factor revenue, and its expenditure comprises the transfer payment to residents, savings, and stock. Government owes its income from taxes and foreign, and government expenditure is intended for government consumption and savings, transfer payments to residents, and assistance to foreign countries.
Carbon Emissions and Consumer Welfare Module
The carbon emissions in this paper refer to the ones from energy use. Hicks equivalent variation is applied to measure the impact of external policy change on the resident welfare. That is, we evaluate the changes in resident utility levels before and after the policy implementing on the basis of commodity price.
Closure and Market-Clearing Module
The market-clearing functions module involves equilibrium of labor market, capital market, and commodity market. This paper assumes that: (a) the wage level is an endogenous variable, and the labor market realizes full employment; (b) the capital return rate is an endogenous variable, and the capital can be fully utilized through the free flow of capital; and (c) the commodity price is an endogenous variable, and the balance between supply and demand of departmental commodities is capable of emerging.
The closure functions module includes saving–investment balance, government budget balance, and international payment balance. In this paper, the exchange rate is set endogenously while the foreign savings are set exogenously. The import and export are adjusted by the change of the exchange rate, ultimately to achieve the balance of payments.
Model Equations and Endogenous Variable
Table 3 shows the number of functions and endogenous variables of each module in this model and indicates that the number of equations equals the number of endogenous variables. Therefore, the model proposed in this paper is computable and has a solution.
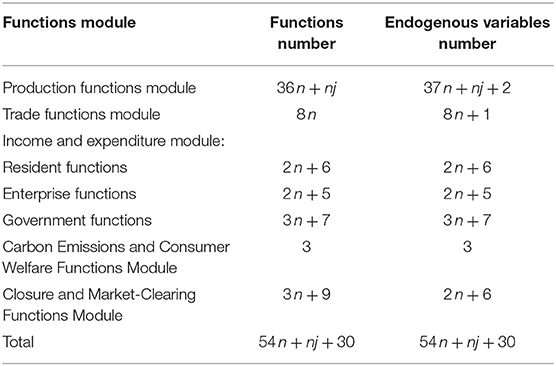
Table 3. Statistical number of model function and endogenous variables.
Model Dynamic
The dynamic process of the model involves labor growth, technological progress (total factor productivity, TFP), and capital accumulation and allocation. In this paper, the labor growth and technological progress are given exogenously. The capital allocation among sectors is determined by the return rate of the sector capital, the average return, and the supply of the social capital based on a CET function.
where the subscript t is time. Lt denotes the labor supply. lagt is the labor growth. TFPi, t is the total factor productivity, tfpgi,t is the growth of the total factor productivity, and Ki,t is the capital demand of sector i. KSt is the total supply of the social capital. TINVt is the total social investment. Ri,t is the return on capital of sector i. ARt is the average return on the social capital. depri is the capital depreciation, and αi is the capital demand share of sector i. ρ denotes the alternative elasticity correlation coefficient of capital demand between sectors.
Sectoral Setting and Data Sources
Sectoral Setting
In order to measure the impacts of policy change on clean energy and carbon emissions, the energy sector is disaggregated into 11 subsectors as shown in Figure 1. Consequently, 31 industries are compiled based on China's 2012 Input/Output table, as listed in Table 4.
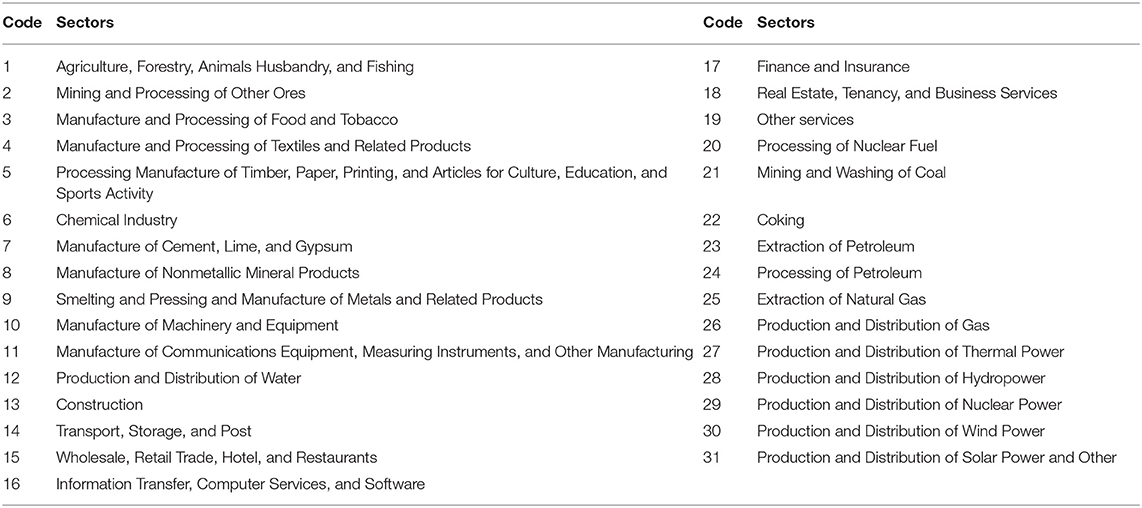
Table 4. Sectoral classification.
This paper disaggregates the petroleum and natural gas extraction sector in China's 2012 IO tables into two subsectors, the petroleum extraction sector and the natural gas extraction sector, because the input structure of the production processes and the allocation of the outputs of petroleum extraction and natural gas extraction differ significantly using the biproportional scaling method. Similarly, in the method of preparing China's 2012 IO table (Department of National Economic Accounting National Bureau of Statistics, 2014), the production and supply of electricity are subdivided into the production and distribution of thermal power, the production and distribution of hydropower, the production and distribution of nuclear power, the production and distribution of wind power, the production and distribution of solar power, and others.
In the IO tables published in China, the “oil exploitation” and “natural gas exploitation” are statistically managed as two different sectors only in 1997, while they are termed as a single department of “oil and gas exploitation” in other years. So this paper splits the “oil and gas exploitation” into two subsectors of “oil exploitation” and “natural gas exploitation” in the 2012 IO table by the following steps: (1) We firstly merge the basic flow chart of the 1997 IO table into 26 sectors then adjust the 2012 IO table to 25 sectors, which are consistent with those in 1997 (excluding the “oil and gas exploitation” sector). (2) According to the comparison of “China energy balance table (standard quantity)” in China Energy Statistics Yearbook 2013 and the 2012 IO table, this paper determines the sum of rows and columns of the intermediate input and demand of “oil exploitation” and “natural gas exploitation” in the 2012 IO table. (3) Taking the sum of rows and columns of intermediate input and demand in the 2012 IO table as the target control variables (26 sectors), we update the structure data of the intermediate input and demand in 1997 IO table through the biproportional scaling technique. (4) The intermediate input and demand data of the “oil and gas exploitation” sector in the 2012 IO table (25 sectors) are disaggregated based on the ratio coefficient of intermediate input and demand of “oil exploitation” and “natural gas exploitation” in the updated 1997 IO table. (5) The data of household consumption, government consumption, capital investment, stock import, export, and added value in the “oil exploitation” sector and the “natural gas exploitation” sector are determined according to the 2012 IO table and the “China energy balance table (standard quantity)” in China Energy Statistics Yearbook 2013.
The specific splitting procedure of the power generating and supply sector is depicted as follows: (1) According to the rules of The Method of Preparing the China Input–Output Table 2012, we format the share of intermediate input and added value of various power sectors based on the data such as cost statement and profit statement of various power generating, transmission, and supply enterprises in 2012. (2) Fossil energy is fully consumed by the thermal power sector, and nuclear fuel is used for generating nuclear power during the power generation process. (3) The input demand for power of thermal power, hydropower, nuclear power, wind power, solar power, and other power sectors comes from their own sectors. (4) The power generating and supply sector (input structure) is divided into the thermal power, hydropower, nuclear power, wind power, solar power, and other electric power according to the row sum of generation and average feed-in-tariff of all kinds of electric power in 2012 as the control variable. (5) The product allocation (output structure) between the intermediate input and the final demand of the power production and supply sectors is determined by the output value of each sector.
Data Sources
The basic data are from the 2012 IO table, 2012 Statistical Yearbook, 2013 China Power Yearbook, China Energy Statistics Yearbook 2013 of the National Bureau of Statistics of the People's Republic of China, and annual statistics from the China Electricity Council.
The elasticity coefficients of production and trade functions are calibrated and set in the model referring to the relevant researches including Xuan (2002), Wang (2003), Tan (2008), Guo et al. (2014, 2019), and Chi et al. (2014). Table S2 is the elasticity of substitution coefficients.
The model necessitates the calculation of the carbon emission coefficient for fossil energy. The calculating process is demonstrated as follows: (1) The fossil energy is divided into six categories including raw coal, crude oil, oil processing products, coke, natural gas, and gas, which are obtained from the “energy balance table” in China Energy Statistics Yearbook 2013. (2) The carbon emissions from coking and gas producing are eliminated from the total emissions of raw coal and crude oil. (3) The carbon emissions of oil processing products comprise from gasoline, kerosene, diesel, fuel oil, liquefied petroleum gas, refinery dry gas, and other petroleum products. (4) The average low-heat value of diverse fossil energy refers to China Energy Statistics Yearbook 2013. (5) The carbon emission factors of fossil energy come from the 2006 IPCC Guidelines for National Greenhouse Gas Inventories. (6) To obtain the carbon emission coefficients of fossil energies, the carbon emissions of six different fossil energies are calculated and divided by the corresponding energy value in the IO table. The coefficients of carbon emissions are in Table S3.
Setting Policy Scenarios
First, we forecast energy consumption, carbon emissions, and the structure during the period 2012−2030 in a benchmark scenario against which the other policy scenarios can be compared. Following Li (2010) and Chi et al. (2014), this benchmark scenario includes parameters such as the growth rate of the labor, the total factor productivity (TFP), the input and output structure of intermediate goods, the consumer savings rate, and the trade surplus. The benchmark scenario assumes that the labor growth rate decreases gradually in the primary industry, first increases and then decreases after 2020 in the secondary industry, and increases gradually in the tertiary industry. The TFP is assumed to be 2.00% in the primary industry, 1.80% in the secondary industry, and 2.00% in the tertiary industry. In addition, the TFP is 2.50% in wind power and 3.00% in solar power. We assume that the intermediate input rate will continue to increase in agriculture but will be slightly lower in energy and resources, and during the simulation period, labor-intensive sectors will decrease. The consumer savings rate and the trade surplus are assumed to gradually decrease with economic development and social progress.
Then we discuss China's energy transition with an assumption of a decline in subsidies for renewable energy. Subsidies for wind and solar power in China are based on the FIT, so smaller subsidies significantly decrease the rate of return on power generation enterprises producing them. Based on changes in the rate of return, we design three scenarios with a reduction in subsidies.
Policy Scenario 1: Compared with the benchmark scenario, the rate of return on wind and solar power production falls by 20% as a result of a reduction in subsidies beginning in 2021.
Policy Scenario 2: Compared with the benchmark scenario, the rate of return on wind and solar power production falls by 30% as a result of a reduction in subsidies beginning in 2021.
Policy Scenario 3: Compared with the benchmark scenario, in 2021, subsidies on wind and solar power are eliminated. Comparing the FIT of wind and solar power in 2012 and desulfurized coal power in 2017, the average FIT of wind and solar power declined by 36 and 65%, respectively. By calculating the IO structure of wind and solar power, the rate of return on wind and solar power generation decreases by 40 and 70%, respectively, which we hypothesize will remain the predominant tendency.
China has been the biggest generator of wind and solar power. Because of technical progress in wind and solar power, their costs will continuously decrease, which in turn will promote the development of wind and solar power. Therefore, to explore the energy transition in the future, we design various scenarios involving reductions in subsidies for renewable energy linked with technical progress.
Policy Scenario 4: Based on scenario 3, we assume that the TFP in the generation of wind and solar power is 3.0 and 3.5%, respectively, which is 0.5 percentage points higher than in the benchmark scenario.
Policy Scenario 5: Based on scenario 3, we assume that the TFP in the generation of wind power reaches 3.5% (1.00% higher than the benchmark) and in solar power reaches 5.25% (2.25% higher than the benchmark).
Policy Scenario 6: Based on scenario 2, we assume that the TFP in the generation of wind and solar power is 0.5% higher than the benchmark, reaching 3.00 and 3.50%, respectively.
Policy Scenario 7: Based on scenario 2, we assume that the TFP in the generation of wind and solar power reaches 3.30 and 3.85%, respectively.
Empirical Results and Discussion
Table 5 shows the impacts of a reduction in renewable energy subsidies on electricity generation and its structure. Table 6 shows the impacts on energy consumption, carbon emissions, and carbon intensity. Table 7 shows the impacts on the structure of energy, and Table 8 reports the feasibility of meeting government targets.
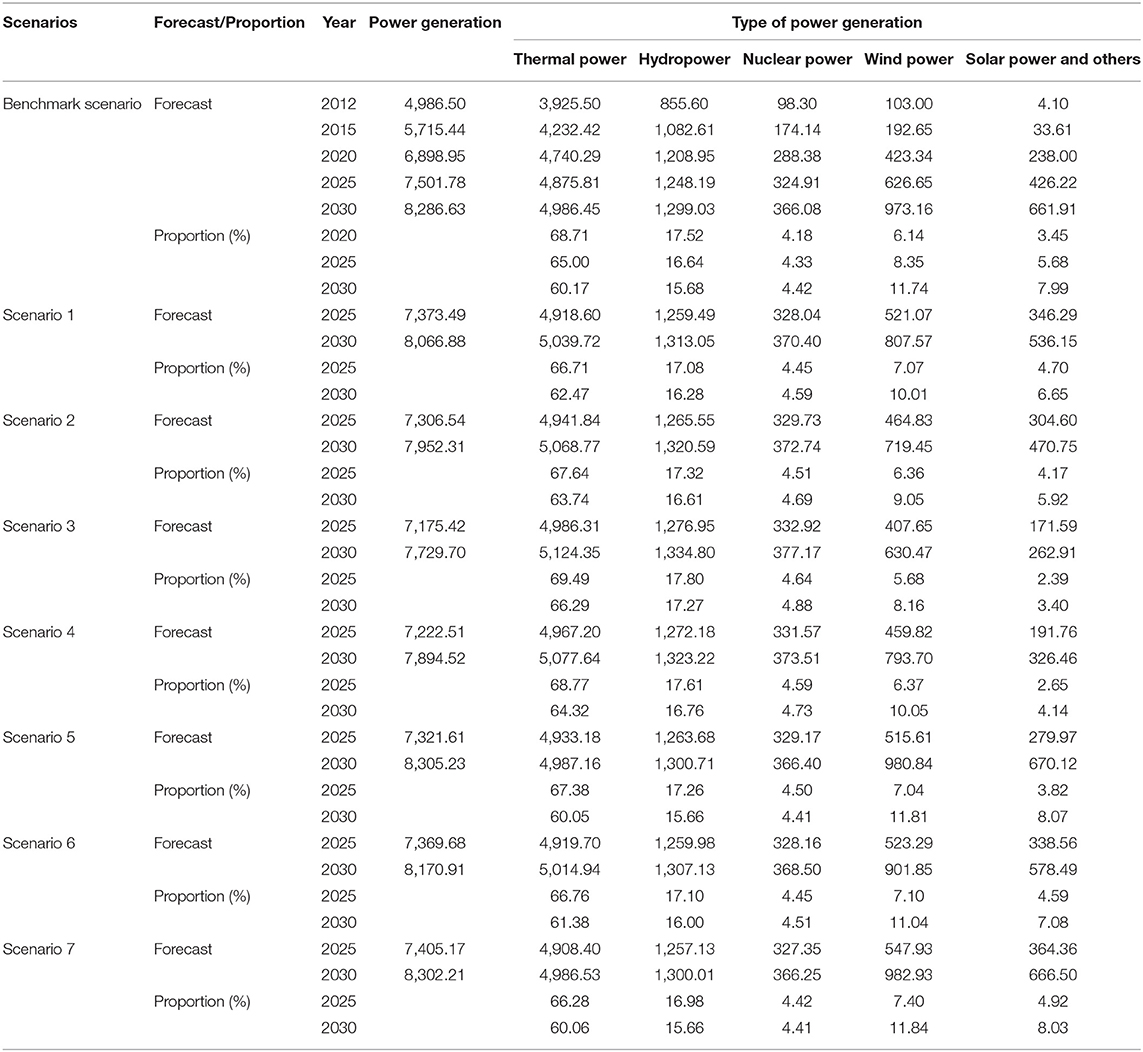
Table 5. Power generation and its structure (in TWh).
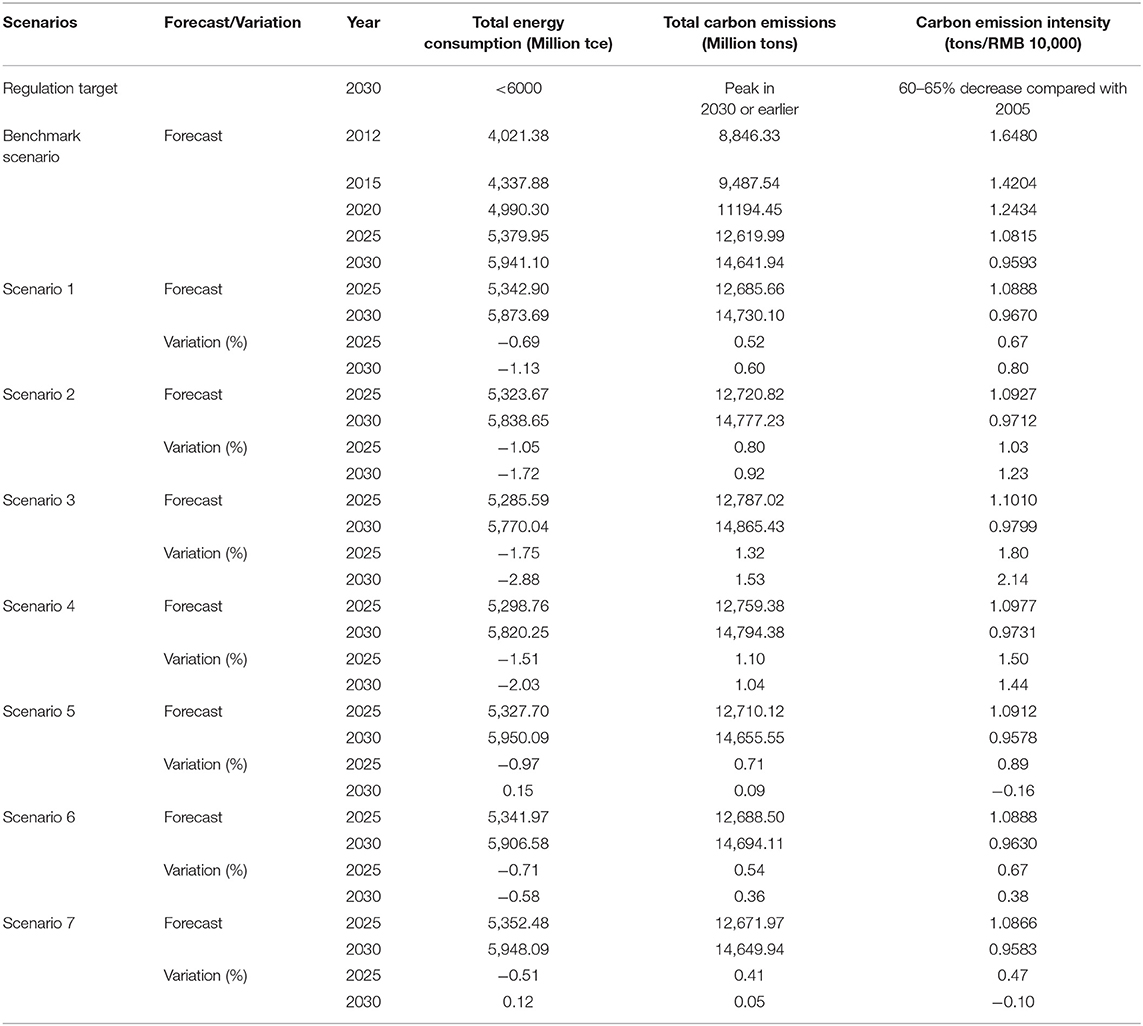
Table 6. Energy Consumption and Carbon Emissions.
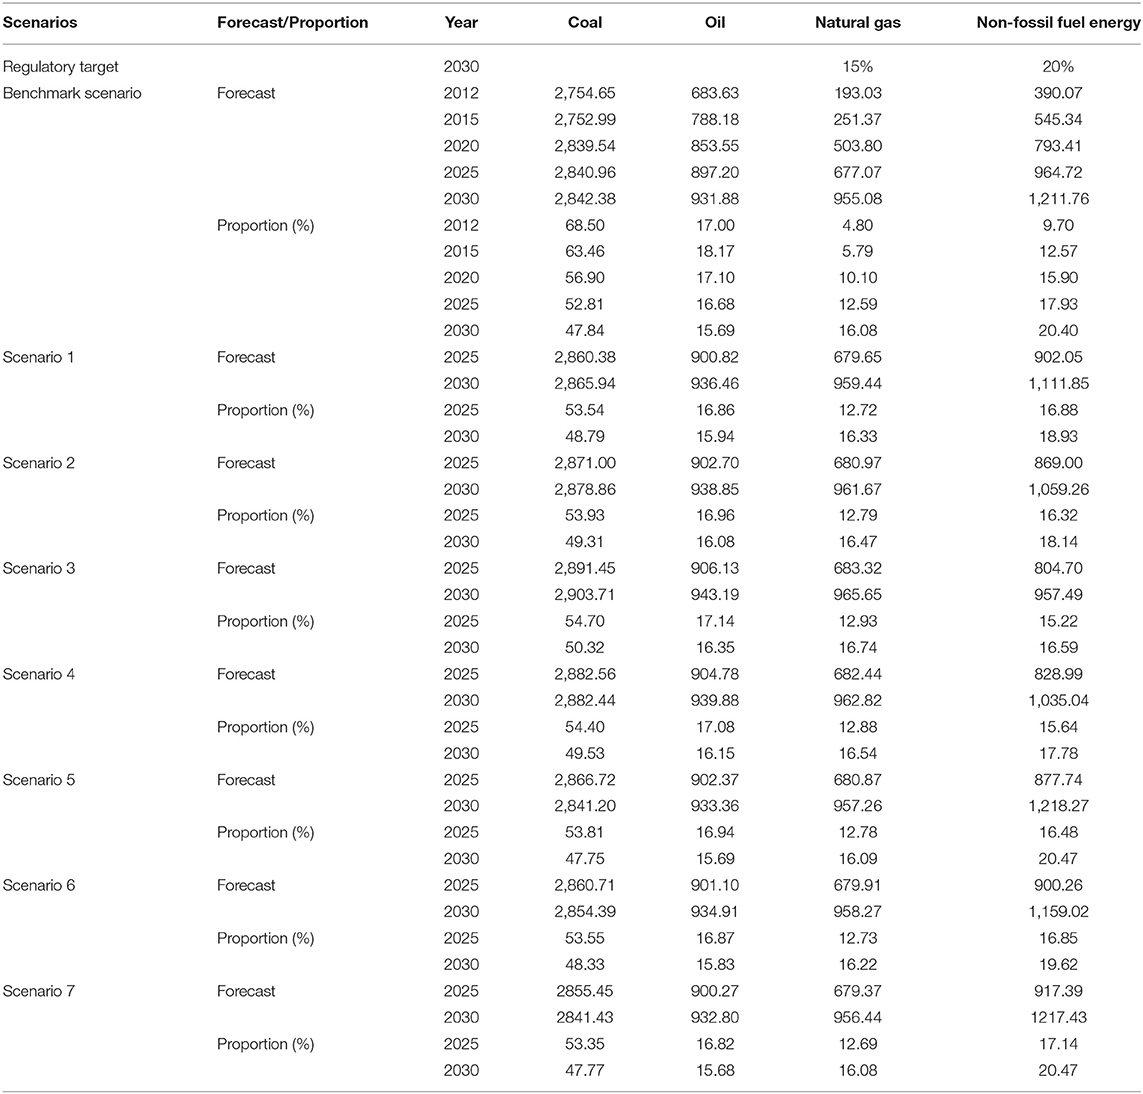
Table 7. Subsector primary energy consumption (in million tce).
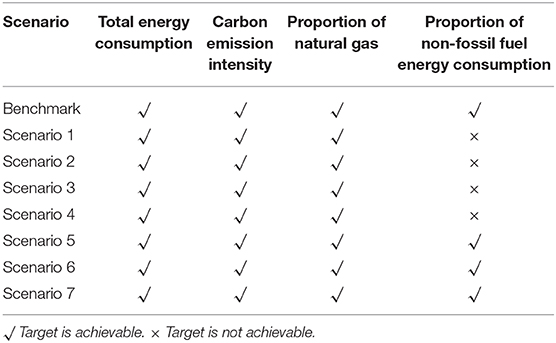
Table 8. The feasibility of government regulatory targets in 2030.
Discussion Based on the Benchmark Scenario
According to a document issued by the Chinese National Development and Reform Commission (NDRC), China's Intended Nationally Determined Contributions (INDC), China pledged to a target around 2030 or earlier of a peak in carbon emissions and a decline in carbon emission intensity by 60–65% compared with the level in 2005. In addition, non-fossil fuel energy is targeted to comprise about 20% of primary energy consumption in 2030. According to the Energy Production and Consumption Revolution Strategy (2016–2030) issued by the NDRC, the target for total energy consumption is about 5 billion tons of standard coal equivalent (tce) in 2020 and about 6 billion tce in 2030. Non-fossil fuel energy will comprise 15% of primary energy consumption in 2020 and about 20% in 2030. Natural gas will comprise about 15% of primary energy consumption in 2030. According to the thirteenth 5-Year Plan for Energy Development issued by the NDRC, total energy consumption will be about 5 billion tce of which coal is 4.1 billion tons; electricity consumption is expected to be 6,800–7,200 TWh in 2020. Non-fossil fuel energy consumption will increase to more than 15% of total energy consumption, natural gas consumption will comprise 10%, and coal will decrease to <58% in 2020.
In the benchmark scenario, China's total electricity generation will increase significantly and reach 8,286.63 TWh in 2030. Although thermal power generation will steadily increase, its proportion of total power generation will decrease. Hydroelectric power will increase slightly, and its proportion will remain stable. Nuclear, wind, solar, and other types of power will increase significantly with an increasing share of total power generation. The structure of power generation is further optimized with the share of thermal power generation dropping to 60.17%, while the share of wind and solar power will increase to 11.74 and 7.99% of total electricity generation, respectively.
Total energy consumption will continuously increase and reach 5.941 billion tce, less than the government target of 6 billion tce in 2030. The proportion of non-fossil fuel energy will increase to 20.40% in 2030 and so will natural gas. Although coal consumption will still increase, its share of total energy consumption will decrease significantly and fall to 47.84% in 2030. Oil consumption will increase slightly at a stable proportion of total energy consumption and reach 16.08% in 2030, which is higher than the government target of 15%. Carbon emissions will increase continuously up to 146.42 billion tons, but carbon emission intensity will decrease significantly and fall to 0.9593 ton/RMB 10,000 in 2030. That is, carbon emission intensity, total energy consumption, and the energy structure can meet the government targets. The results of the benchmark scenario provide a baseline for the policy scenarios.
The Results in the Energy Subsidy Reduction Scenario (Scenarios 1–3)
As shown in Table 5 and Figure 2, after reductions in subsidies for renewable energy, wind and solar power generation will significantly decline compared with the benchmark scenario, while thermal and total power generation will increase. Meanwhile, as subsidies are reduced further, wind, solar, and total power generation will fall rapidly. When the subsidy is eliminated in 2030, total electricity generation will be 6.72% lower than the benchmark scenario. With respect to the structure of power generation, compared with the benchmark scenario, the proportion of wind and solar power generation will shrink after subsidies are further reduced. After elimination of the subsidy in 2030, the ratio of wind and solar power to total electricity generation will fall to 8.16 and 3.40%, which is 3.58 and 4.59% lower than the benchmark scenario, respectively. By comparison, thermal power, hydropower, and nuclear power generation will increase because of their substitution effects on wind and solar power generation.
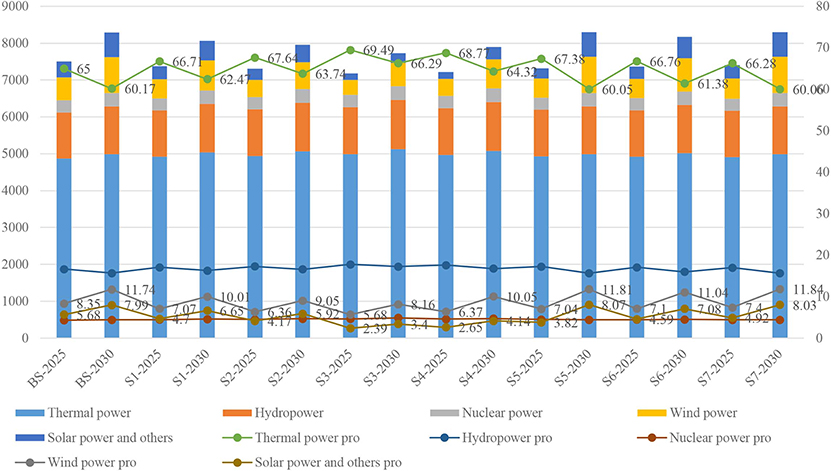
Figure 2. Power generation and its structure in 2025 and 2030. Unit: TWh/%.
As shown in Table 6 and Figures 3, 4, compared with the benchmark scenario, total energy consumption will decrease in 2021 because of reductions in the subsidies. The elimination of renewable energy subsidies in 2030 will reduce the total energy consumption to 5,770.04 billion tce, lower than both the benchmark and the government target. However, in 2030, total carbon emissions will rise to 14.86 billion tons, 1.53% higher than the benchmark scenario. In addition, carbon emission intensity of the gross domestic product will reach 0.9799 tons/RMB10, 000, which is 2.14% higher than the benchmark scenario. The INDC reveals that carbon emission intensity in 2014 fell by 33.80% compared with the level in 2005. Impressively, the results of this study show that carbon emission intensity is 41.79% lower in 2030 than in 2012. Hence, the carbon emission intensity in policy scenarios 1–3 is lower than the government target.
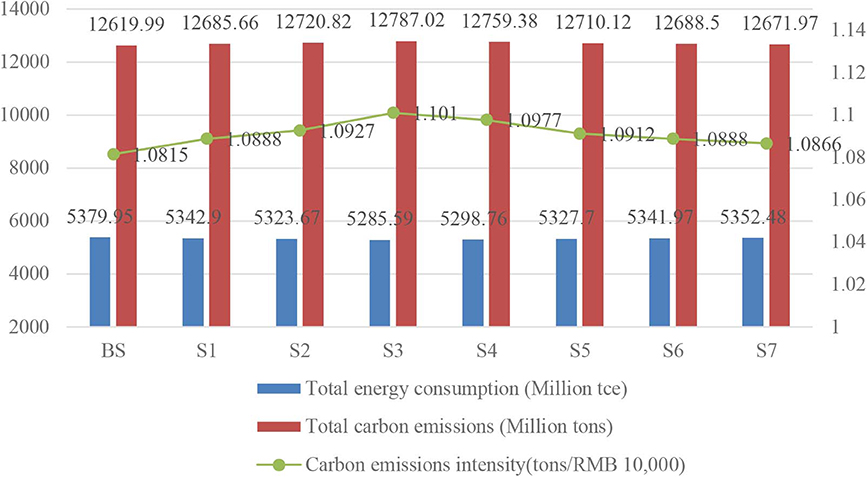
Figure 3. Energy Consumption and Carbon Emissions in 2020.
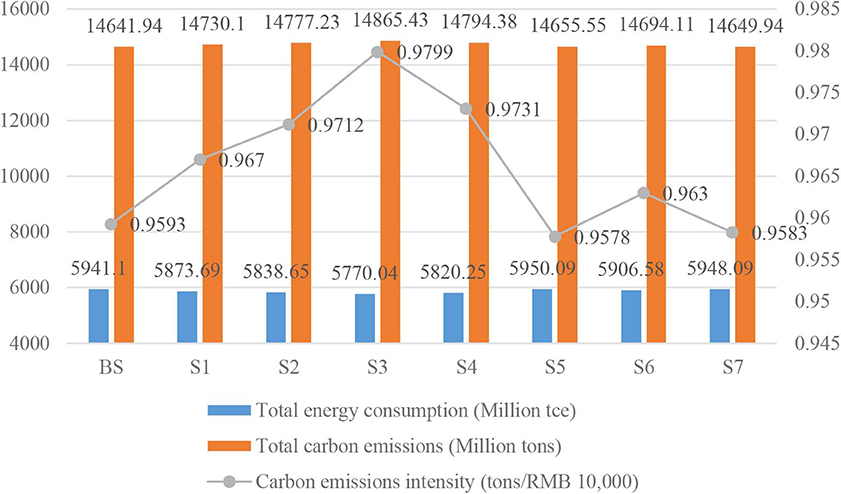
Figure 4. Energy Consumption and Carbon Emissions in 2030.
As shown in Table 7 and Figure 5, consumption of non-fossil fuel energy will decline gradually as a result of the substitution effect among energy sources, and the consumption of coal, oil, and natural gas will increase as this occurs. In particular, in the subsidy-free scenario (scenario 3), consumption of non-fossil fuel energy in 2030 will fall to 16.59%, lower than both the benchmark scenario and the government target of 20%. In addition, the proportion of coal in total energy consumption in 2030 will rise to as much as 50.32%, which is 2.48 percentage points higher than the benchmark scenario as well as higher than the government target of <48%.
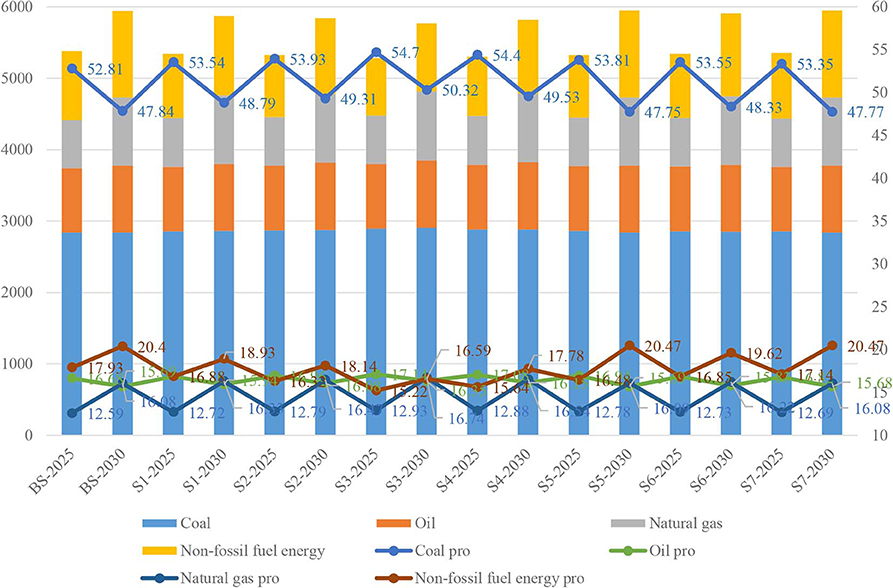
Figure 5. Subsector primary energy consumption and structure in 2030 Unit: TWh/%.
As a whole, if the subsidies for renewable energy are eliminated, the government target for total energy consumption and carbon emission intensity would be achieved, but it will fail to achieve the target for non-fossil energy in 2030.
The Results of Renewable Energy Subsidy Elimination Associated With Technical Progress (Policy Scenarios 4–5)
In policy scenario 5, wind and solar power generation will increase significantly because of technical progress, whereas thermal power, hydropower, and nuclear power will slightly decrease. Consequently, total consumption of electrical power and total energy will slightly increase, while carbon emissions will decrease slightly. Like policy scenarios 1–3, the government target for non-fossil fuel energy in 2030 is not attained.
To achieve the non-fossil fuel energy target in 2030, we raise the technical progress in wind and solar power in policy scenario 5, enabling them to significantly increase compared with scenario 4. Wind, solar, and other types of power will account for 19.88% of total power generation, and the proportion of non-fossil fuel energy in total energy consumption will be 20.47% in 2030, which means that the government target for non-fossil fuel energy can be achieved in policy scenario 5. Thermal power, hydropower, and nuclear power generation will slightly increase; consequently, total power generation slightly increases compared with scenario 4. Because of a decline in fossil fuel energy consumption and a significant increase in non-fossil fuel energy consumption in 2030, carbon emissions will decrease, but total energy consumption will increase.
Although the government target can be achieved in scenario 5, doing so requires a technological leap in wind and solar power generation because this level of technical progress is too high for China to achieve. Therefore, in the next section, we consider scenarios with a moderate subsidy and technical progress in renewable energy.
The Results of Renewable Energy Subsidy Reduction Associated With Technical Progress (Policy Scenarios 6–7)
In scenario 6, the only difference is the level of renewable energy subsidies, which is moderate rather than zero as in scenario 4. Compared with scenario 4, wind and solar power generation will increase significantly and account for 18.12% of total power generation, while the generation of other types of power will decrease slightly. Consequently, total power generation will increase to 8,170.91 TWh in 2030. Because of the decrease in fossil fuel energy such as coal, oil, and natural gas, carbon emissions will decrease to 14,694.11 million tons, though total energy consumption will increase to 5,906.58 million tec in 2030. In 2030, non-fossil fuel energy will comprise 19.62% of total energy consumption, which indicates that the government target for non-fossil fuel energy can be basically achieved in scenario 6. If a relatively high level of renewable energy technical progress is achieved in scenario 7, then non-water renewable power will increase significantly and account for 19.87% of total power generation. Moreover, in 2030, non-fossil fuel energy consumption will increase and comprise 20.47% of total energy consumption, which is slightly higher than the government target of 20%. In addition, the consumption fossil fuel energy and carbon emissions will decrease compared with those in scenario 4. Although total energy consumption will slightly increase to 5,948.09 million tec, it will be lower than the government target of 6,000 million tec.
As a whole, Table 8 indicates that government targets except in non-fossil fuel energy can be achieved in every policy scenario, and the target for non-fossil fuel energy will fail to be achieved if the subsidies for renewable energy are withdrawn. In addition, in scenario 4 (no subsidy), the government target for non-fossil fuel energy will not be achieved even though technical progress is improved. High technical progress in renewable energy is required to achieve the government target for non-fossil fuel energy, but the level in scenario 5 is too high for China to attain. Therefore, a moderate subsidy associated with feasible technical progress in renewable energy (scenarios 6 and 7) is an effective way to meet government targets in 2030 and is helpful for energy transition in China.
Conclusions and Policy Implications
This paper develops a hybrid CGE model of China's energy and environment policy evaluation, which disaggregates China's energy sectors into 11 subsectors in order to reflect the technical and economic characteristics of various energy sources by the biproportional scaling method and the Method of Preparing the China Input–Output Table 2012. Then we explore the impacts of reducing and eliminating subsidies on renewable energy development and energy transition in China using this hybrid dynamic CGE model. In the benchmark scenario, this paper estimates energy consumption and its structure, carbon emissions, and carbon intensity from 2012 to 2030. The forecast results are consistent with the Chinese government's target. Thus, the benchmark scenario provides a comparative baseline for policy simulations.
The elimination of subsidies for wind and solar power will result in a significant drop in the generation and proportion of wind and solar power in 2030. Particularly in the subsidy-free scenario, the consumption of non-fossil fuel energy falls, while the proportion of coal will rise significantly, exceeding the government's goal. Consequently, it is impossible to achieve the government's target.
In a renewable energy subsidy-free scenario, China could achieve its targets in energy transition and carbon emissions if the TFP of wind and solar power reaches 3.50 and 5.25%, respectively. However, doing so requires a leap in technological progress, especially in solar power, which is a huge challenge for China. In the scenario of a 30% reduction in the returns on wind and solar power based on the benchmark scenario, if China wants to achieve its targets in energy transition and carbon emissions, the TFP of wind and solar power must reach 3.30 and 3.85%, respectively, which are feasible goals for technical progress in wind and solar power in China.
In conclusion, the analytical results of the scenarios indicate that the government's 2030 target for total energy and natural gas consumption and carbon emission intensity can be achieved in each scenario. However, the government's target for non-fossil fuel energy is hard to achieve without subsidies for renewable energy. The empirical results also indicate that a moderate subsidy for renewable energy linked to significant technical progress in renewable energy is a crucial way for China to achieve its energy target and transition in 2030.
Technological progress is the crucial factor in reducing the generation cost and promoting the subsidies retreat of wind and solar power in China. Therefore, the government should actively encourage technological progress in wind and solar power generation and strengthen the policy support for this progress. The government should encourage relevant enterprises to strengthen technological innovation and its transformation and application and at the same time, according to the industry's technological progress, scientifically and reasonably gradually reduce wind and solar power subsidies.
Data Availability Statement
The datasets generated for this study are available on request to the corresponding author.
Author Contributions
ZG and XZ completed model design, simulation analysis, and discussion. HZ and SF completed English writing.
Conflict of Interest
The authors declare that the research was conducted in the absence of any commercial or financial relationships that could be construed as a potential conflict of interest.
Acknowledgments
The authors thank the National Social Science Fund of China for supporting this research (Grant No. 15ZDB165).
Supplementary Material
The Supplementary Material for this article can be found online at: https://www.frontiersin.org/articles/10.3389/fenrg.2020.00025/full#supplementary-material
Footnotes
1. ^Norway Integrated Markal Efom System model, which gives a detailed description of the entire energy system, including all resources, energy production technologies, energy carriers, demand devices, and sectoral demand for energy services.
References
Arndt, C., Davies, R., Gabriel, S., Makrelov, K., Merven, B., Hartley, F., et al. (2016). A sequential approach to integrated energy modeling in South Africa. Appl. Energy 161, 591–599. doi: 10.1016/j.apenergy.2015.06.053
Böhringer, C., and Rutherford, T. F. (2006). “Combining top-down and bottom-up in energy policy analysis: a decomposition approach,” ZEW Leibniz Centre for European Economic Research Discussion Paper, No. 06–007 (Mannheim).
Böhringer, C., and Rutherford, T. F. (2008). Combining bottom-up and top-down. Energy Econ. 30, 574–596. doi: 10.1016/j.eneco.2007.03.004
Cai, Y., and Arora, V. (2015). Disaggregating electricity generation technologies in CGE models: a revised technology bundle approach with an application to the U.S. Clean Power Plan. Appl. Energy 154, 543–555. doi: 10.1016/j.apenergy.2015.05.041
Chi, Y., Guo, Z., Zheng, Y, and Zhang, X. (2014). Scenarios analysis of the energies' consumption and carbon emissions in China based on a dynamic CGE model. Sustainability 6, 487–512. doi: 10.3390/su6020487
Department of National Economic Accounting and National Bureau of Statistics (2014). The Method of Preparing the China Input-Output Table 2012. Beijing: China Statistics Press.
Guo, Z., Zhang, X., Ding, Y., and Zhao, X. (2019). A forecasting analysis on China's energy use and carbon emissions based on a dynamic computable general equilibrium model. Emerg. Markets Finance Trade. doi: 10.1080/1540496X.2019.1597704. [Epub ahead of print].
Guo, Z., Zhang, X., Zheng, Y., and Rao, R. (2014). Exploring the impacts of a carbon tax on the Chinese economy using a CGE model with a detailed disaggregation of energy sectors. Energy Econ. 45, 455–462. doi: 10.1016/j.eneco.2014.08.016
Helgesen, P. I., Lind, A., Ivanova, O., and Tomasgard, A. (2018). Using a hybrid hard-linked model to analyze reduced climate gas emissions from transport. Energy 156, 196–212. doi: 10.1016/j.energy.2018.05.005
Igos, E., Rugani, B., Rege, S., Benetto, E., Drouet, L., and Zachary, D. S. (2015). Combination of equilibrium models and hybrid life cycle-input-output analysis to predict the environmental impacts of energy policy scenarios. Appl. Energy 145, 234–245. doi: 10.1016/j.apenergy.2015.02.007
Jacoby, H. D., Reilly, J. M., McFarland, J. R., and Paltsev, S. (2004). Technology and technical change in the MIT EPPA Model. Energy Econ. 28, 610–631. doi: 10.1016/j.eneco.2006.05.014
Jacoby, H. D., Reilly, J. M., McFarland, J. R., and Paltsev, S. (2014). Technology and Technical Change in the MIT EPPA Model. MIT Joint Program on the Science and Policy of Global Change, Report No. 111. MIT.
Ji, Q., Li, J., and Sun, X. (2019). New challenge and research development in global energy financialization. Emerg. Markets Finance Trade 55, 2669–2672. doi: 10.1080/1540496X.2019.1636588
Ji, Q., and Zhang, D. (2019). How much does financial development contribute to renewable energy growth and upgrading of energy structure in China? Energy Policy 128, 114–124. doi: 10.1016/j.enpol.2018.12.047
Lanz, B., and Rausch, S. (2011). General equilibrium, electricity generation technologies and the cost of carbon abatement: a structural sensitivity analysis. Energy Econ. 3, 1035–1047. doi: 10.1016/j.eneco.2011.06.003
Li, S. (2010). The Chinese economic growth prospect and outlook from 2011 to 2030. Rev. Econ. Res. 43, 2–27.
Li, W., Zhang, Y., and Lu, C. (2018). The impact on electric power industry under the implementation of national carbon trading market in China: a dynamic CGE analysis. J. Clean. Prod. 200, 511–523. doi: 10.1016/j.jclepro.2018.07.325
Lou, F. (2017). The Dynamics Computable General Equilibrium Model of Science and Technology in China: Theory and Applications. Beijing: China Social Sciences press.
Martinsen, T. (2011). Introducing technology learning for energy technologies in a national CGE model through soft links to global and national energy models. Energy Policy 39, 3327–3336. doi: 10.1016/j.enpol.2011.03.025
Meng, S., Siriwardana, M., Mcneill, J., and Nelson, T. (2018). The impact of an ETS on the Australian energy sector: an integrated CGE and electricity modelling approach. Energy Econ. 69, 213–224. doi: 10.1016/j.eneco.2017.11.017
Paltsev, S., Reilly, J. M., Jacoby, H. D., Eckaus, R. S., Mcfarland, J., Sarofim, M. C., et al. (2005). The MIT Emissions Prediction and Policy Analysis (EPPA) Model: Version 4. MIT Joint Program on the Science and Policy of Global Change, Report No. 125. MIT Center for Global Change Science, Cambridge, MA, USA.
Proença, S., and Aubyn, M. S. (2013). Hybrid modeling to support energy-climate policy: effects of feed-in tariffs to promote renewable energy in Portugal. Energy Econ. 38, 176–185. doi: 10.1016/j.eneco.2013.02.013
Pui, K. L., and Othman, J. (2017). Economics and environmental implications of fuel efficiency improvement in Malaysia: a computable general equilibrium approach. J. Clean. Prod. 156, 459–469. doi: 10.1016/j.jclepro.2017.04.067
Sue, W. I. (2006). The synthesis of bottom-up and top-down approaches to climate policy modeling: electric power technologies and the cost of limiting US CO2 emissions. Energy Policy 34, 3847–3869. doi: 10.1016/j.enpol.2005.08.027
Sue, W. I. (2008). The synthesis of bottom-up and top-down approaches to climate policy modeling: electric power technology detail in a social accounting framework. Energy Econ. 30, 547–573. doi: 10.1016/j.eneco.2006.06.004
Tabatabaei, S. M., Hadian, E., Marzban, H., Marzban, H., and Zibaei, M. (2017). Economic, welfare and environmental impact of feed-in tariff policy: a case study in Iran. Energy Policy 102, 164–169. doi: 10.1016/j.enpol.2016.12.028
Tan, X. D. (2008). Modeling and application of electric power computable general equilibrium model (Ph.D. dissertation). North China Electric Power University, Beijing, China.
Tran, T. M., Siriwardana, M., Meng, S., and Nong, D. (2019). Impact of an emissions trading scheme on Australian households: a computable general equilibrium analysis. J. Clean. Prod. 221, 439–456. doi: 10.1016/j.jclepro.2019.02.273
Tuladhar, S. D., Yuan, M., Bernstein, P., Montgomery, W. D., and Smith, A. (2009). A top-down bottom-up modeling approach to climate change policy analysis. Energy Econ. 31(Suppl. 2), S223–S234. doi: 10.1016/j.eneco.2009.07.007
Wang, C. (2003). Climate change policy simulation and uncertainty analysis: a dynamic CGE model of China (Ph.D. dissertation), Tsinghua University, Beijing, China.
Wu, J., Albrecht, J., Fan, Y., and Xia, Y. (2016). The design of renewable support schemes and CO2 emissions in China. Energy Policy 99, 4–11. doi: 10.1016/j.enpol.2016.09.045
Wu, J., Fan, Y., and Xia, Y. (2017). How can China achieve its nationally determined contribution targets combining emissions trading scheme and renewable energy policies? Energies 10:1166. doi: 10.3390/en10081166
Wu, Y., Liu, C., Hung, M., Liu, T., and Masui, T. (2019). Sectoral energy efficiency improvements in Taiwan: evaluations using a hybrid of top-down and bottom-up models. Energy Policy 132, 1241–1255. doi: 10.1016/j.enpol.2019.06.043
Xie, W., Xiong, W., Pan, J., Ali, T., Cui, Q., Cui, D., et al. (2018). Decreases in global beer supply due to extreme drought and heat. Nat. Plants 4, 964–973. doi: 10.1038/s41477-018-0263-1
Xu, X., Wei, Z., Ji, Q., Wang, C., and Gao, G. (2019). Global renewable energy development: influencing factors, trend predictions and countermeasures. Resour. Policy 63:101470. doi: 10.1016/j.resourpol.2019.101470
Xuan, X. W. (2002). Analysis the effect of sulfur-tax on the Chinese economy based on CGE model (Ph.D. dissertation), Peking University, Beijing, China.
Yun, T., Cho, G. L., and Kim, J. (2016). Analyzing economic effects with energy mix changes: a hybrid CGE model approach. Sustainability 8:1048. doi: 10.3390/su8101048
Zhang, D., and Ji, Q. (2019). Energy finance: frontiers and future development. Energy Econ. 83, 290–292. doi: 10.1016/j.eneco.2019.07.003
Zhang, D., Rausch, S., Karplus, V. J., and Zhang, X. (2013). Quantifying regional economic impacts of CO2 intensity targets in China. Energy Econ. 40, 687–701. doi: 10.1016/j.eneco.2013.08.018
Keywords: energy transition, hybrid dynamic computable general equilibrium model, renewable energy, reducing subsidies, policy scenarios
Citation: Guo Z, Zhang X, Feng S and Zhang H (2020) The Impacts of Reducing Renewable Energy Subsidies on China's Energy Transition by Using a Hybrid Dynamic Computable General Equilibrium Model. Front. Energy Res. 8:25. doi: 10.3389/fenrg.2020.00025
Received: 28 December 2019; Accepted: 10 February 2020;
Published: 10 March 2020.
Edited by:
Qiang Ji, Chinese Academy of Sciences, ChinaReviewed by:
Wei Xie, Peking University, ChinaLianyong Feng, China University of Petroleum, China
Feng Lou, Institute of Quantitative and Technical Economics (CASS), China
Copyright © 2020 Guo, Zhang, Feng and Zhang. This is an open-access article distributed under the terms of the Creative Commons Attribution License (CC BY). The use, distribution or reproduction in other forums is permitted, provided the original author(s) and the copyright owner(s) are credited and that the original publication in this journal is cited, in accordance with accepted academic practice. No use, distribution or reproduction is permitted which does not comply with these terms.
*Correspondence: Xingping Zhang, enhwQG5jZXB1LmVkdS5jbg==