 Guruprasad V. Talekar
 Srikanth Mutnuri
- Applied Environmental Biotechnology Laboratory, Department of Biological Sciences, Birla Institute of Technology and Science, Sancoale, India
The development of economically feasible and efficient decentralized onsite treatment of septic tank water or blackwater is the need of the hour. In recent years, Electrochemical oxidation (EO) has been proven to be an efficient alternative treatment technology for use in small-scale, onsite wastewater treatment operations. Recently, the electrochemical treatment of wastewater in membrane divided cells has been reported to be of superior efficiency with regards to chemical oxygen demand (COD) removal while producing fewer disinfection by-products. In this study, a reduction of all the major wastewater defining parameter in both the anode and cathode chambers of an Anionic exchange membrane divided electrochemical reactor (AEM-ECR) and a Cationic exchange membrane divided electrochemical reactor (CEM-ECR) were obtained after the electrolysis of real septage and septage that had passed a vertical flow constructed wetland (VFCW), respectively. The results of these batch electrolysis experiments in AEM-ECR and CEM-ECR using septage as feed concluded that among the two studied membranes, AEM usage in ECR is optimal. The reduction in COD, Total Organic Carbon (TOC), and Total ortho-phosphate (TP) after electrolysis in AEM based ECR was found to be double that achieved in CEM-ECR. The charge supplied and power required were 7794 ± 10 coulombs L−1 and 48 ± 6.7 Wh L−1. Further, the results of the batch electrolysis experiments in AEM-ECR with VFCW treated septage as feed concluded that the optimum feed to the AEM-ECR is VFCW treated septage since the charge and power requirement for treatment of VFCW treated septage is 42.5 and 35% lower, respectively, to that required for septage for similar percentage reductions in COD, TOC, and TP. The charge supplied and power required was 4482 ± 846 coulombs L−1 and 31 ± 1.6 Wh L−1. Finally, the continuous flow experiments ACAEM and CAAEM concluded that, regarding the double-chambered membrane ECR, a feed flow mode from anode to cathode results in maximum reduction in COD, TOC, TP, and coliforms in a double-chambered membraned ECR. The power required for treatment was 21.2 Kwh/m3.
Introduction
The development of economically feasible and efficient decentralized onsite treatment of septic tank water or blackwater is the need of the hour for many upper and lower middle-income countries due to a lack of centralized treatment infrastructure. In India, according to the Central Pollution control board (CPCB), existing centralized treatment facilities can treat only 38% (22963 MLD) of the total generated sewage (61754 MLD). About 62% of the generated sewage (38791 MLD) is discharged untreated, directly into nearby water bodies causing immense degradation of the ecosystem and environmental health. Globally, as reported by UNESCO in 2017, over 80% of all wastewater is discharged without treatment.
More than 70 different onsite systems exist which have been practiced over the century (Science and Ho, 2016). Media filters (Intermittent sand filters and Rotating sand filters), Lagoons (Facultative, aerated, aerobic, and anaerobic lagoons), Sequential batch reactors and constructed wetlands are some examples. However, none of them have been specifically used for blackwater treatment (Massoud et al., 2009). Simultaneously, electrochemical technologies have also been investigated as effluent treatment processes (Chen, 2004). Electrochemical treatment has shown to lower the Biochemical oxygen demand (BOD), chemical oxygen demand (COD), and nitrogen concentration (Huang et al., 2016), and has been extensively described for industrial and domestic wastewater treatment by processes like electrocoagulation, electrooxidation, electrodisinfection, electroflotation, and electrosorption (Tennakoon et al., 1996; Grimm et al., 1998; Vlyssides and Israilides, 1998; Feng et al., 2003; Tartakovsky et al., 2011; Kim et al., 2013; Samir and Abbas, 2013; Hong et al., 2014).
In recent years, Electrochemical oxidation (EO), has proven to be an efficient alternative treatment technology for use in small-scale onsite wastewater treatment operations. EO of wastewater can be carried out in single cells, membrane separated cells or porous disc separated cells. Membrane separated cells or divided cells consist of a membrane between the anode and cathode chamber. The membrane is either an Anion Exchange membrane (AEM) or a Cation Exchange membrane (CEM), depending on the type of nutrients to be recovered from the wastewater. Membrane separated cells are preferred over single cells when nutrient recovery from the waste streams is the additional objective apart from treating the wastewater in terms of COD, BOD, and Ammonium (). The CEM divided cell electrolytic reactors have been reported to separate and concentrate from synthetic wastewater (Gildemyn et al., 2015; Ren et al., 2017), urine (Luther et al., 2015), and anaerobic digestate (Desloover et al., 2015). The AEM divided cell reactors have been reported for phosphate () recovery (Zhang et al., 2013; Chen et al., 2017; Ledezma et al., 2017; Ren et al., 2017). and recoveries up to 90% have been demonstrated. Further, the use of AEM and CEM divided cells to treat latrine wastewater and recovery of and has been reported very recently (Yang et al., 2019). The study also reports that 39% less chlorate () and 92% less chlorinated organic by-products are produced in a membrane divided cell than in a membrane-free reactor. In another study by Drennan et.al., higher COD removal during greywater treatment with less energy demand was reported in a membrane divided cell compared to the undivided cell. The study also reported no formation of perchlorate but removal of Halo acetic acids(HAAs) and Trihalomethanes(THAs) on the cathode side (Drennan et al., 2019). Hence the membrane divided cell provides a promising sustainable electrochemical process when optimized, for onsite treatment of wastewater. Resource recovery is among the primary objectives in many studies reported on membrane divided cells. This, however, requires a recovery solution in one of the chambers during recirculation. The use of such a recovery solution will increase the operational costs of the process. Avoiding the use of a recovery solution by passing the feed from one chamber of the electrochemical cell to another, could prove to be advantageous if wastewater treatment is the sole purpose of the process. Our previous research demonstrated the use of a CEM divided cell for electrochemical treatment and disinfection of constructed wetland treated septage without the use of any recovery solution (Talekar et al., 2018). The COD, Total Kjeldahl Nitrogen (TKN), Total Ammoniacal Nitrogen (TAN), Total orthophosphates (TP) removal percentages were 75 ± 3, 30 ± 4, 20 ± 4, and 14 ± 3%, respectively. The log10 reduction of coliform was 5 ± 1.2. The power requirement was 16 ± 3 KWh/m3 for septage disinfection.
The aim of this study is to further investigate and optimize the aforementioned electrochemical process. We evaluated the performance efficiency of the AEM divided cell in comparison to the CEM divided cell, to select an optimal membrane. The performance efficiency of the AEM divided cell with two types of feed (septage and septage partially treated by a Vertical flow constructed wetland) were studied to optimize the electrolysis process to achieve a maximum reduction of COD, TOC, TN, TAN, coliform and the chlorine production at the anode. This was in contrast to our previous study where the electrolysis process in the CEM divided cell was optimized for a maximum coliform removal.
Materials and Methods
Laboratory Scale Double Chambered Membraned Electrochemical Reactor
The Electrochemical reactor (ECR) was a plate and frame type as described earlier (Rabaey et al., 2005; Talekar et al., 2018). It had two chambers, an anode, and a cathode chamber, separated by an ion-exchange membrane (Figure 1). Two types of ion-exchange membranes were used, a CEM during the first set of experiments and an AEM in the second set of experiments. Both the CEM (CMI-7000) and the AEM (AMI-7001) were procured from Membrane International Inc. NJ, USA. The volumes of the anode and cathode chambers were 128 ml (8 × 8 × 2 cm3) each, while the active volume of both the chambers was 96 ml (8 × 6 × 2 cm3). An IrOx Mixed Metal Oxide (MMO) mesh (Magneto, The Netherlands) (8 × 8 cm2) was used as the Anode and a stainless-steel mesh (SS 304, 600 Micron, 8 × 8 cm2) was used as the cathode. A DC power supply unit (GW-Instek, SPS 606) was used. The feed was fed and/or recirculated into the reactor using peristaltic pumps (NFP-01, Flowtech, India) with variable flow rates ranging from 0.6 to 100 ml/min. This ECR configuration was employed for all the lab-scale experiments conducted during this study.
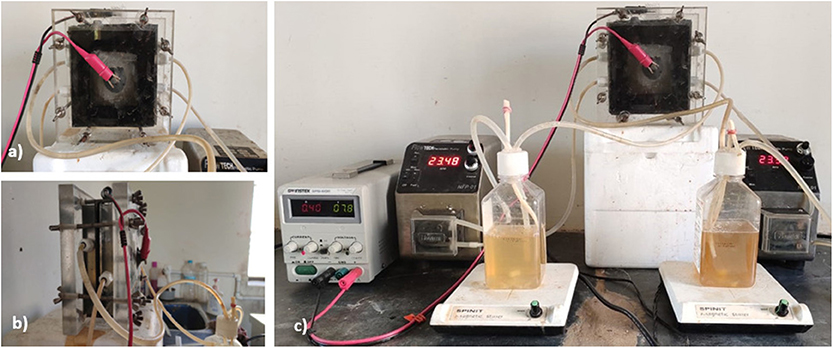
Figure 1. (a) Front view of the double chamber electrochemical cell assembly. (b) Side view of the assembly showing anodic chamber with inlet at the bottom and cathodic chamber with outlet at the top. (c) Complete experimental setup for batch electrolysis experiments.
Influent and Effluent Wastewater Parameter Analysis
In all the experiments conducted, the septage used was obtained from the septic tank (6 m3). The wetland passed water was obtained from a reservoir that collects the effluent of the second stage VFCW, which is a component of a community-scale integrated treatment system described earlier (Talekar et al., 2018). The influent and effluent samples generated during the lab-scale experiments were analyzed for COD, Total Nitrogen (TN), TAN, TP, TOC, Total Carbon (TC), Inorganic Carbon (IC), chloride, total chlorine, and Coliform Forming Unit (CFU). The concentration of COD, TP, TAN, and chloride were measured by the closed reflux—colorimetric method, the vanado—molybdophosphoric acid colorimetric method, the titrimetric method, and Mohr's titration, respectively. The TN, TOC, TC, and IC were obtained using a TOC analyzer with a detection limit of 4 μg/L (TOC-L PC controlled model, Shimadzu). The total chlorine was measured by using a commercially available chlorine test kit (Merck, Germany) based on the DPD photometric method. The CFU was obtained by the spread plate method using MacConkey Agar.
The precipitate from the surface of the MMO anode and the stainless-steel cathode in the EC collected after batch electrolysis was analyzed by Scanning electron microscopy (SEM). The SEM images and elemental analysis were done by a field emission gun scanning microscope (Quanta FEG-250) coupled with energy dispersive spectroscopy (EDAX, Ametek 174422 Smart Insight) operated at 10 kV.
Electrolysis Experiments
All the experiments conducted during the study, using the above described ECR are described in Table 1. Batch electrolysis experiments, using real septage/blackwater as the feed, were conducted employing the CEM divided ECR (CEM-ECR) and AEM divided ECR (AEM-ECR). The analysis of the results from these experiments dictated the choice of the membrane employed in further experiments. Subsequently, batch electrolysis experiments were conducted using the VFCW treated septage as feed in the divided ECR with the selected membrane (AEMW). The results of this experiment dictated the choice of feed to the ECR and the necessity of pre-treatment of the septage before electrochemical treatment. Following the choice of the membrane in the ECR and the type of feed to the ECR, continuous flow electrolysis experiments were conducted. Two continuous feed flow electrolysis experiments were conducted: (i) Anode to cathode flow via. reservoir (AEMW-AC), and (ii) Cathode to Anode flow via. reservoir (AEMW-CA).
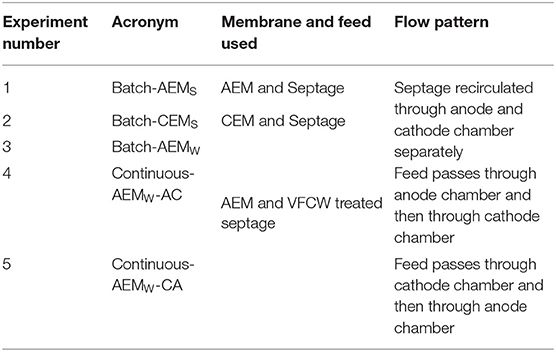
Table 1. List of electrolysis experiments conducted in the divided ECR.
During the batch experiments, 500 ml of feed was circulated through each chamber simultaneously via a reservoir of 1 L capacity, as shown in the schematic diagram (Figure 2). The recirculation rate was 20 ml/min. The content in the reservoirs was mixed using a magnetic stirrer to avoid the settling of solids. Once the flow reached a steady state, the voltage supply was switched on to start electrolysis. The DC supply was operated in constant current mode with the current set to 0.8 A. The electrolysis was carried out for 120 min and sampling was carried out from both the reservoirs every 30 min. The samples were analyzed for the above-mentioned wastewater parameters. The power and charge requirements per liter of feed for a desired level of treatment were calculated. All batch experiments were conducted in triplicates.
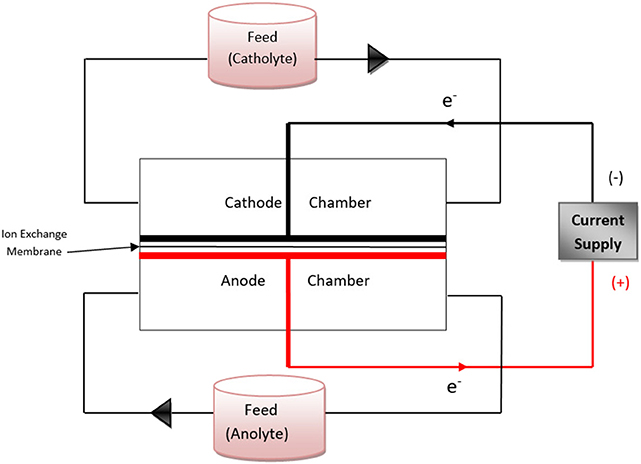
Figure 2. Schematic diagram showing the flow pattern of the feed through the electrochemical reactor in batch electrolysis experiments.
During the continuous experiments the feed was passed through the reactor in two directions in two separate electrolysis experiments: (i) Anode to cathode passage where the feed was first passed through the anode chamber then through cathode via. the reservoir (Figure 3). (ii) Cathode to Anode passage where the feed was first passed through the cathode chamber then through the anode chamber via. the reservoir (Figure S1). The contents of all the reservoirs were mixed using a magnetic stirrer. In both the experiments, the flow was allowed to reach a steady-state after which the voltage supply was switched on and a constant current was maintained. The feed was set at a rate of 4 ml/min. After 100 min, three replicates of the effluent samples were collected and analyzed for the above-mentioned wastewater parameters. The voltage reading was noted down at regular intervals.
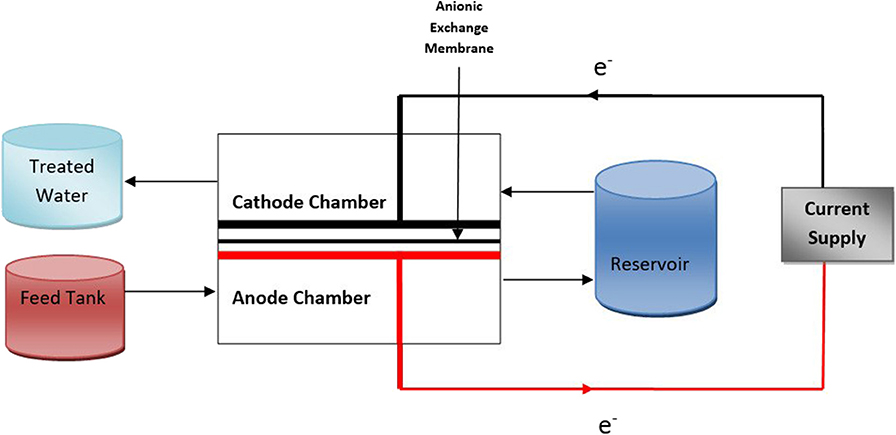
Figure 3. Schematic diagram showing the flow pattern of the feed (VFCW passed septage) through the electrochemical reactor in continuous-AEMW-AC electrolysis experiment.
Results
Batch Electrolysis With Septage as Feed in AEM Divided ECR and CEM Divided ECR
During the electrolysis of septage in the AEM-ECR, it was observed that a higher reduction in various selected wastewater parameters occurred in the cathode chamber compared to that in the anode chamber. The percentage reduction in COD, TOC, TP, TN, and TAN in the cathode chamber were 84.3 ± 3.8, 79 ± 1.6, 92.7 ± 0.7, 41.3 ± 21.4, and 38.73 ± 15.62, respectively. While in the anode chamber the percentage reduction in COD, TOC, TP, TN, and TAN were 20 ± 1.1, 8.2 ± 1.2, −22 ± 4.2, 17.7 ± 5, and −0.73 ± 0.71, respectively. The log10 reduction of the coliform count per mL in the anode and cathode chambers, after 30 min of electrolysis were 2 and 1.14 ± 0.25. This increased to 2.69 after 60 min of electrolysis in both chambers. However, the color of the septage after treatment did not change after the electrolysis in the cathode recirculation.
During the septage electrolysis experiments in a CEM-ECR, the percentage reduction in COD, TOC, TP, TN, and TAN in the anode chamber were 53.21 ± 0.01, 40.06 ± 1.1, 35.6 ± 4.2, 97.2 ± 1.2, and 52.8 ± 12.7, respectively. While in the cathode chamber, the percentage reduction in COD, TOC, TP, TN, and TAN were 28.9 ± 12.8, 13.6 ± 2, 72.32 ± 3.8, −29.5 ± 36.2, and −48.7 ± 7.5, respectively. The log10 reduction of the coliform count per mL in the anode and cathode chambers after 30 min of electrolysis were 3.2 ± 1.2 and 3.5 ± 0.5. The Log10 reduction after 90 min in both the chambers was 5.3 ± 1.3.
Batch Electrolysis With VFCW Treated Septage as Feed in AEM Based ECR
Similar to the results obtained with the electrolysis of septage in the AEM-ECR, the reduction of selected wastewater parameters during the cathode chamber recirculation was higher than during the anode chamber recirculation, as is evident from Figures 8, 9. The percentage reduction in COD, TOC, TP, TN, and TAN in the cathode chamber was 75.8 ± 8.6, 82.2 ± 3.7, 90.9 ± 0.64, 13.5 ± 4.2, and 9.9 ± 7, respectively. In the anode chamber the percentage reduction in COD, TOC, TP, TN, and TAN was 28.12 ± 1.5, 6.6 ± 3.3, 19.15± 3.5, −16.54 ± 5.3, and 10.67 ± 3.2, respectively. A 4 log10 reduction in CFU was obtained after 30 and 60 min of electrolysis in the anode and cathode chamber recirculation, respectively.
Continuous VFCW Treated Septage Treatment by Electrolysis in AEM Based ECR
Continuous feed experiments were conducted in two modes as mentioned above in the AEM based ECR:
(i) Anode to cathode flow mode (ACAEM)
(ii) Cathode to anode flow mode (CAAEM)
Based on the results of the batch experiments AEMW, the charge required to treat a defined amount of VFCW treated septage was determined. This, in turn, determined the flow rate to the ECR and the hydraulic retention time (HRT) in the ECR of the feed, for a fixed current. In the continuous feed experiments (both ACAEM and CAAEM), the flowrate maintained was 5 mL/min with HRT = 22 min in each chamber and current fixed at 0.4 A (Current density = 62.5 A/m2). The overall percentage reduction in COD, TOC, TP, TN, TAN, TC, and TIC achieved in ACAEM was 74 ± 0.9, −1.2 ± 1.4, 54 ± 0.28, 34.7 ± 3.5, 17 ± 1.7, 48.3 ± 0.14, and 82.5 ± 2.5, respectively. In the CAAEM, the percentage reduction in COD, TOC, TP, TN, TAN, TC, and TIC were 80.8 ± 15.4, −4.38 ± 8.07, 33.4 ± 1.7, 9.5 ± 2.11, −5 ± 5.7, 46.7 ± 2.02, and 83.2 ± 2.2, respectively. The log10 reduction in CFU obtained after ACAEM and CAAEM was 3.5 ± 0.6 and 2.4, respectively.
Discussions
The results of the batch electrolysis experiments using septage as feed in the AEM-ECR (experiment 1) are represented in Figures 5, 6. The reduction of COD and TOC occurred in both the anodic and cathodic chamber recirculation. In the cathodic recirculation, the COD and TOC reduction was 64.3 and 71% higher than the reduction achieved in the anodic recirculation. The reduction in the anodic chamber recirculation could have been partially due to direct oxidation of the organics on the surface of the electrode and majorly due to indirect oxidation in the bulk anolyte by the reactive chlorine species generated from inherent chloride (50–185 mg/L) present in the wastewater (Martínez-Huitle and Ferro, 2006; Fajardo et al., 2017). In the cathode chamber, the COD and TOC reduction could be majorly due to movement of the negatively charged smaller sized organics, the phospho-sugars like GDP-D- Glucose, CDP-D-Glucose, etc. and the short-chain fatty acids (Høverstad et al., 2018) to the anode chamber. The removal was due to the coagulation of organic matter at higher pH and subsequent sedimentation.
The TP reduction in the anode chamber (Figure 6) was primarily due to the precipitation of the phosphates as calcium phosphates and magnesium phosphates in the vicinity of the anode electrode on the membrane surface and also in the bulk (anolyte). The elemental analysis of the anodic precipitate by EDAX showed that oxygen (47.5 wt.%), calcium (27.5 wt.%), phosphorus (14.2 wt.%), and magnesium (9.9 wt.%) were the predominant elements precipitated. The atomic O/Ca and Ca/P ratio was 1.72 and 1.93, respectively. The SEM images of the precipitate showed sharp needlelike structures among button headlike structures (formed by several layers of stacked circular structures). The needle-shaped structures were calcium phosphates similar to the structures reported by Drevet et. al. (Drevet and Benhayoune, 2012). The button headlike structures were similar to the calcium oxide nanoparticles encountered by Balaganesh et al. (2018). From the elemental analysis (EDAX) results (Figure S2) and SEM images (Figure 4), it was inferred that the precipitates were primarily constituted of calcium oxides and calcium phosphates. Magnesium oxides and magnesium phosphates were also present in the precipitate in low amounts as inferred from the EDAX results.
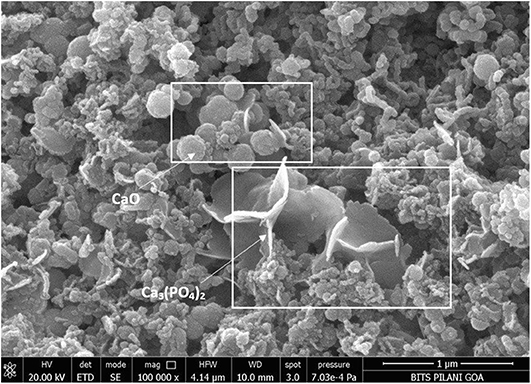
Figure 4. SEM images of anodic precipitate at 100,000× magnification showing circular button head like structures of calcium oxide and needle shaped calcium phosphates.
The TP removal in the cathode chamber (Figure 7) was due to the transfer of phosphate ions from the cathode to the anode chamber across the AEM.
The reduction in TN was observed in both the anodic and cathodic chamber recirculations. Similar to the COD and TOC, the removal percentage was higher in the cathodic chamber than in the anodic chamber. The removal of TN in the anode chamber was due to indirect oxidation of nitrogenous organic matter (Urea) (Hanson et al., 2016) to ammonia and its further oxidation to nitrogen, nitrates, nitrous oxides under acidic pH conditions by OH radicals and by hypochlorous acid (Kim et al., 2005). In the cathode chamber, the TN decrease was due to the movement of nitrates and nitrites from the cathode chamber to the anode chamber across AEM and also due to ammonia volatilization.
The TAN removal in the anode chamber was primarily due to the partial decomposition of ammonia to nitrogen by OH radicals (Kim et al., 2005) and indirect oxidation in the anolyte by chlorine species generated from chloride and less likely by the direct oxidation of ammonium on the surface of the Ti/IrO2 and Ti/RuO2 anodes (Li and Liu, 2009) under acidic anolyte conditions. In the cathode chamber, the TAN decreased due to the volatilization of ammonium ions as ammonia from a highly basic catholyte (11 ± 0.1). Figure 7, summarizes all the major reactions occurring in the anode and the cathode chambers, leading to pollutant removal.
The coliform disinfection in the anode chamber was due to the combined effect of acidic pH (2 ± 0.14)(Pearson et al., 1987; Wahyuni, 2015) and active chlorine species (Kraft, 2008; Cho et al., 2014), while in the cathode chamber, it was solely due to the high pH (11 ± 0.1) (Pearson et al., 1987). The charge supplied and power required to achieve the mentioned reduction was 7794 ± 10 coulombs L−1 and 48 ± 6.7 Wh L−1. The total chlorine concentration in the treated septage in the anode recirculation and the power required per gram of chlorine production was 3.65 mg L−1 and 13 Kwh gm−1 chlorine.
In the case of septage electrolysis in the CEM-ECR (experiment 2), as expected and shown in our previous research (Talekar et al., 2018), a significant reduction in most of the parameters occurred in the anode chamber compared to the cathode chamber. The mechanisms involved in the reduction of various parameters in anode and cathode chambers in a CEM-ECR are described in detail in our previous research (Talekar et al., 2018). The charge and power required was 8,640 coulombs L−1 and 42.12 ± 4 Wh L−1. The total chlorine concentration in the treated septage in the anode recirculation and the power required per gram of chlorine production was 1.975 mg L−1 and 21 Kwh gm−1 chlorine.
On comparing the results obtained from experiments 1 and 2, as represented in Figures 5, 6, it can be seen that the COD, TOC, and TP reduction was highest in the cathode chamber recirculation in the AEM-ECR. The highest removal of TN and TAN was seen in the anode chamber recirculation in the CEM-ECR. The TN removal in the anode chamber in the CEM-ECR was double the reduction achieved in the cathode chamber of the AEM-ECR. The TAN removal in the anode chamber of CEM-ECR was 14% higher than that achieved in the cathode chamber of AEM-ECR. With respect to coliform removal, complete removal was achieved after 60 min in both the anode and cathode recirculations in the AEM-ECR, while it took 90 min in both the anode and cathode recirculations in the CEM-ECR.
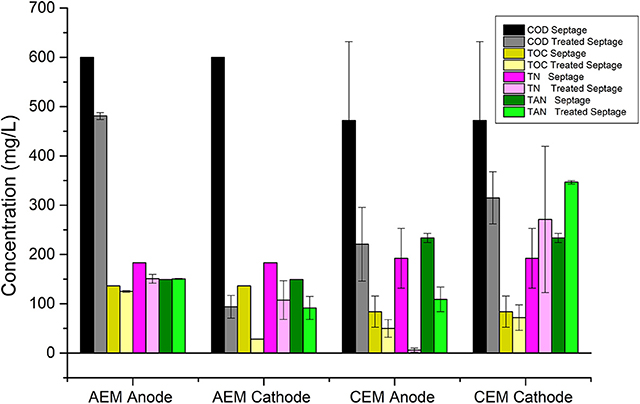
Figure 5. Variation in wastewater parameters of septage/blackwater after 90 min of electrolysis in anode and cathode chamber recirculation in ECR with AEM and ECR with CEM.
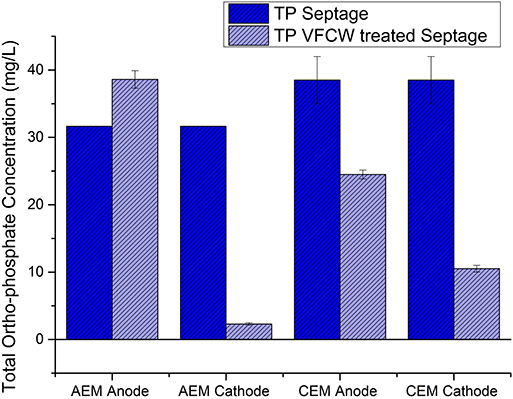
Figure 6. Variation in ortho-phosphate concentration of septage/blackwater after 90 min of electrolysis in anode and cathode chamber recirculation in ECR with AEM and ECR with CEM.
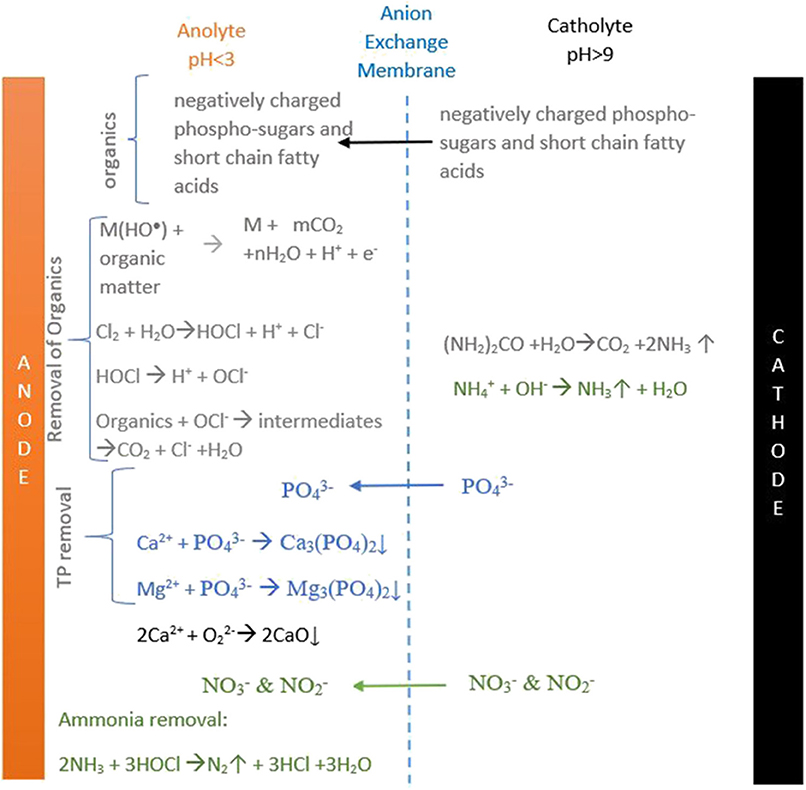
Figure 7. Schematic diagram that summarizes all the major reactions occurring in the anode and cathode chambers of the ECR.
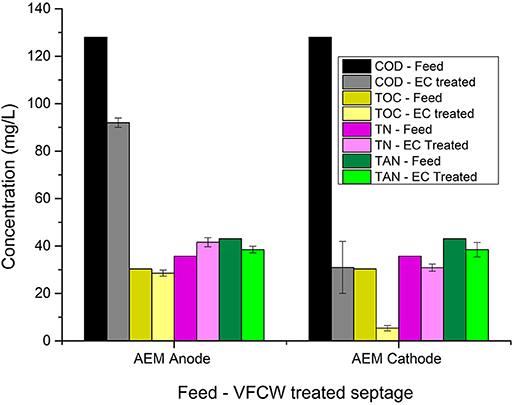
Figure 8. Variation in wastewater parameters of VFCW treated septage after 90 min of electrolysis in anode and cathode chamber recirculation in ECR with AEM.
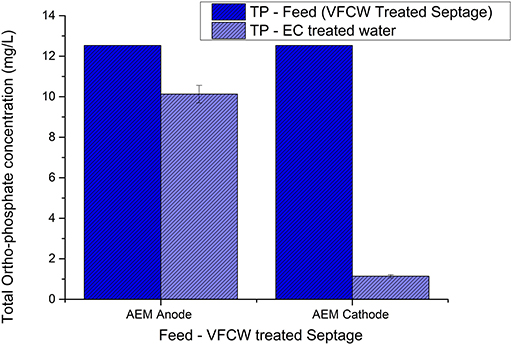
Figure 9. Variation in ortho-phosphate concentration of VFCW treated septage after 90 min of electrolysis in anode and cathode chamber recirculation in ECR with AEM.
The charge requirement in the case of AEM-ECR electrolysis was 10% lower than that required in CEM-ECR electrolysis. However, the power consumption of the AEM-ECR was 8% more than the requirement of the CEM-ECR. Even though the CEM-ECR seems to be promising in terms of power consumption, the AEM-ECR outweighs the CEM -ECR in terms of COD, TOC, TP reduction, and chlorine production. Chlorine, contributing to the oxidation of organics and coliform removal, production in the anode chamber of the AEM-ECR was around 82% higher. Hence it was concluded that the optimized membrane between anode and cathode chamber was the AEM. Therefore, further experiments were conducted with the AEM-ECR.
The electrolysis experiment (experiment 3) following the membrane selection, was carried out with the AEM-ECR using VFCW treated septage as the feed. The results showed that the COD, TOC, TP, and TN reduction were 48, 75.6, 71.75, and 13.5% higher, respectively, in the cathode chamber to that achieved in the anode chamber. TAN removal was similar in both the chambers. Mechanisms of removal of considered parameters in anode and cathode chambers have been discussed above. The charge supplied and power required to achieve the mentioned reduction was 4482 ± 846 coulombs L−1 and 31 ± 1.6 Wh L−1. The average total chlorine concentration in the treated septage in anode recirculation and the average power required per gram of chlorine production was 3.125 mg L−1 and 9.9 Kwh gm−1 chlorine.
On comparing the results of experiments 1 and 3 (Table 2), it was seen that the percentage removal of COD, TOC, TP from septage and VFCW treated septage in the cathodic chamber recirculation after electrolysis was almost the same, except in the case of TN and TAN. The removal percentage of TN and TAN was higher in the case of septage as feed. This may mislead one to conclude that septage could be the optimum feed to the process. However, the charge and power requirements for achieving the mentioned reduction were significantly lower for electrolysis of the VFCW treated septage than for that of septage. The charge and power requirements for VFCW treated septage were 42.5 and 35% lower, respectively to those for septage. This was for the obvious reason that the VFCW treated septage had lower organic loads. Power requirements per gram of chlorine production from the VFCW treated water was 38.1% lower than the requirements for electrolysis of septage. Hence from this result analysis, it was concluded that a pre-treatment of the septage by a VFCW before the electrolysis was advantageous in terms of lowering power requirements. Therefore, VFCW treated septage was considered the preferred feed to the AEM-ECR.
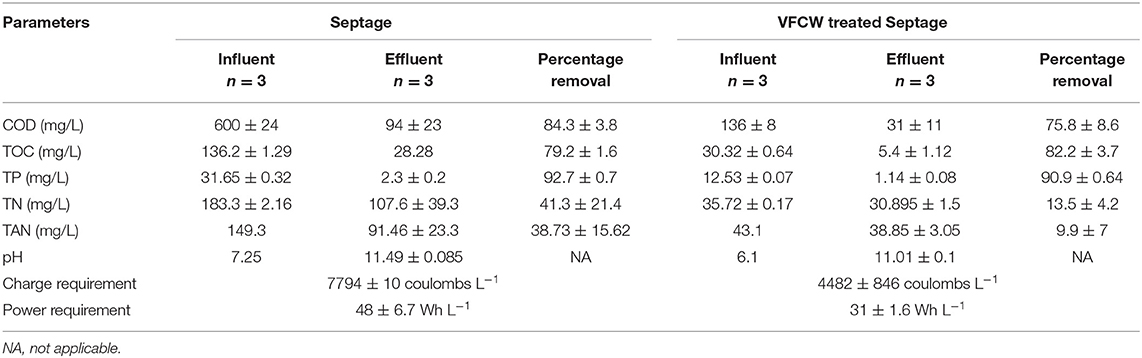
Table 2. Variation of wastewater parameters of the feed in the cathode chamber recirculation of AEM-ECR, feed being septage, and VFCW septage.
Hence, at the end of the batch experiments, it was concluded that the ECR performance was optimal with the AEM as the membrane between the anode and cathode chambers and VFCW treated septage as feed. Therefore, the following continuous experiments were conducted in the AEM-ECR with VFCW treated septage.
In the ACAEM experiment, during electrolysis (Table 3), as the feed passed the anode chamber, the COD reduced by 80%. Further, as the anode passed feed passed through the cathode chamber, the COD increased by around 42%. The unusual increase in [COD] observed after the cathode passage could be due to the detection of the small chain peptides in the cathode effluent sample by the dichromate method of COD estimation. These small chain peptides could be formed by the denaturation of macromolecular proteins at a higher pH (Min et al., 2018). However, the overall reduction was 74 ± 0.9%. In the case of TOC, after the anodic passage, the TOC increased very slightly (by 2 mg/l) and then further decreased as the anode passed feed flowed through the cathode (Table 3). The decrease in the TOC in the cathode chamber was partially due to coagulation at higher pH and subsequent sedimentation and predominantly due to the chemical conversion of organic carbon species to inorganic carbon species as evident from Table 3. Overall there was no removal in the TOC.
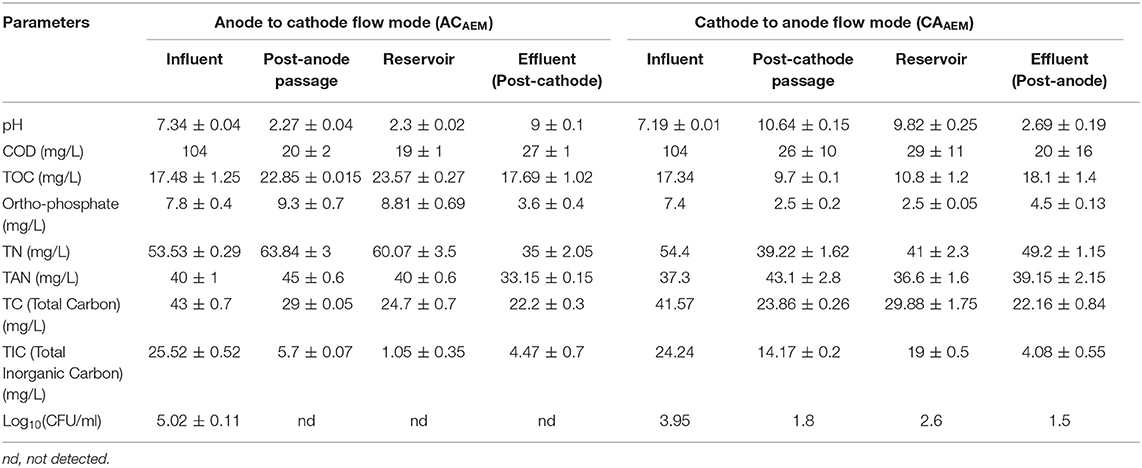
Table 3. Variation in selected wastewater parameters as the feed flows through the chambers of the ECR in experiments ACAEM and CAAEM.
A TP reduction, in this flow mode, was seen after the cathodic passage of the feed due to a transfer of the phosphate ions to the anode chamber forming white-colored precipitates of calcium (oxides and phosphates) and magnesium (oxides and phosphates) as discussed previously. The un-combined phosphate ions were added to the pre-existing phosphates in the anolyte and hence there was an increase in [] in the anolyte.
The TN initially increased by 19% after anode passage and then decreased as the anode passed feed passed through the cathode chamber. The increase in TN was possibly due to the addition of nitrites and nitrates from the catholyte to the anolyte via the AEM. The decreased TN in the cathode chamber was possibly due to the decomposition of organic nitrogen (Urea) in basic catholyte conditions (pH ≤ 9) (Zhigang et al., 2008), volatilization of ammonia and movement of nitrites and nitrates to the anode chamber. The TAN remained almost constant as the feed flowed through the anode chamber and reached the reservoir. It decreased, however, as the feed from the reservoir passed through the cathode. The decrease, as mentioned earlier, was due to the volatilization of ammonia at high pH (pH>9) (Desloover et al., 2012). The TC of the feed exhibited a decreasing trend throughout as the feed flowed through the anode and then through the cathode via the reservoir.
In the CAAEM experiment, the COD of the feed decreased after cathodic passage and showed a further reduction after anodic passage, as shown in Table 3. The TOC variation trend was opposite to that seen in the ACAEM. The TOC after cathodic passage decreased, then increased as the cathode passed feed in the reservoir flowed through the anode chamber. Overall there was no TOC removal. The TP concentration decreased as the feed passed the cathode chamber and increased as the cathode effluent passes through the anode chamber. The decrease observed in the cathode effluent was due to the transfer of ions from the catholyte to the anolyte. These transferred phosphates further precipitated in the anode chamber as discussed before. The TP concentration of the final effluent in comparison to the cathode passed feed was higher due to the accumulation of uncombined ions added from the catholyte to the anolyte across the membrane. The TN decreased after cathodic passage and then increased as the cathode passed feed flowed through the anode chamber, a trend opposite to that seen in ACAEM. The ammoniacal nitrogen increased as the feed passed the cathode chamber, and remained the same as the cathode passed feed flowed through anode chamber. The increase in the cathode chamber was due to the high pH of the catholyte at which nitrogen exists predominantly as ammonium. The TC concentration was shown to decrease after both cathode and subsequent anode passage. The value of various parameters at every sampling point during the flow of the feed through the ECR in ACAEM flow mode and CAAEM flow mode is shown in Figures 10, 11.
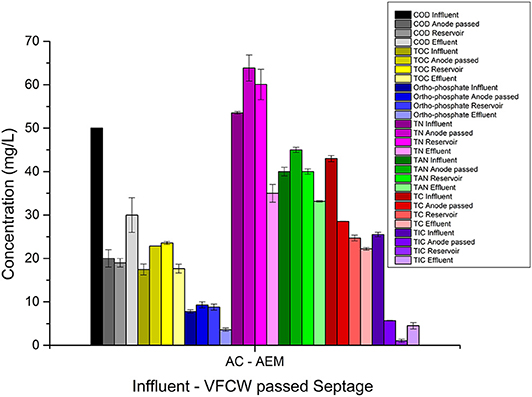
Figure 10. Graphical representation of variation in wastewater parameters as the feed flows through the anode chamber and then through the cathode chamber via reservoir during electrolysis in AEM based ECR.
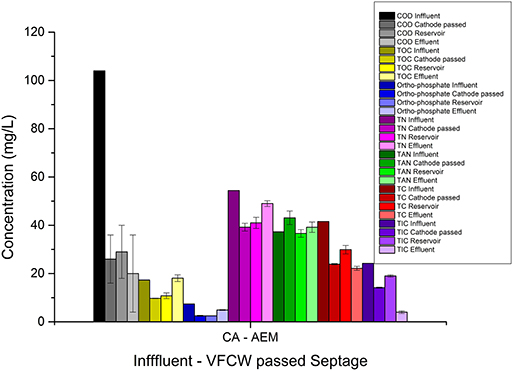
Figure 11. Graphical representation of variation in wastewater parameters as the feed flows through the cathode chamber and then through the anode chamber via reservoir during electrolysis in AEM based ECR.
It was seen that the percentage reduction in TP, TN, TAN, TC, and TIC in ACAEM was higher than in the case of CAAEM (Table 4). The TOC reduction in both the flow modes was negligible or equal to zero and COD removal in ACAEM is almost similar to the reduction reached in CAAEM. The [COD], [], and [TN] removal achieved in ACAEM and CAAEM was 128.33, 7, 38.83, and 140, 4.83, 8.66 g/m2 day, respectively. The power consumption in the ACAEM and CAAEM flow modes was calculated to be 21.2 and 21.46 Kwh/m3, respectively. The effluent pH of the ACAEM was in the permissible range for environmental discharge, while the effluent pH of CAAEM was more acidic. Hence among both the flow modes tested, ACAEM can be chosen as the optimum mode of flow of feed through the ECR in consideration of the higher reduction in [], [TN] and similar [COD] removal. Furthermore, the energy consumption in the ACAEM was lower than the consumption in the ACCEM (28 Kwh/ m3) as shown in our previous study (Talekar et al., 2018). The effluent quality meets the Indian CPCB standards mentioned for release in inland surface water.
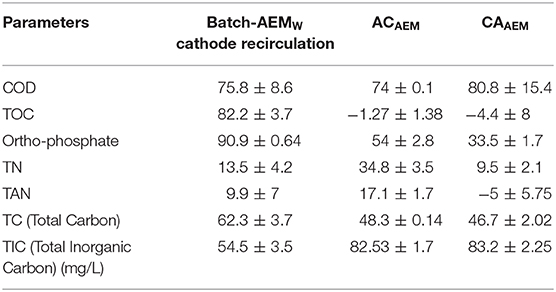
Table 4. Percentage reduction in wastewater parameters achieved in Batch-AEMW, ACAEM, and CAAEM experiments.
In the future, septage treatment in the modified ECR configuration consisting of both the AEM and CEM will be studied to recover and simultaneously and its scaleup feasibility.
Conclusion
In the present study, an attempt was made to optimize the type of the ion exchange membrane and the type of feed used in the double-chambered electrochemical reactor. The results of the batch electrolysis experiments in AEM-ECR and CEM-ECR using septage as feed lead to the conclusion that among the two studied membranes, the AEM was optimal. The reduction in COD, TOC, and TP after electrolysis in the AEM-ECR was double the reduction achieved in the CEM-ECR. The charge supplied and power required were 7794 ± 10 coulombs L−1 and 48 ± 6.7 Wh L−1.
Further, the batch electrolysis experiments in AEM-ECR using VFCW treated septage as feed concluded that the optimum feed to the ECR with AEM was VFCW treated septage. The charge and power requirement for treating wetland (VFCW) treated septage was 42.5 and 35% lower, respectively, than that required for septage. The charge supplied and power required was 4482 ± 846 coulombs L−1 and 31 ± 1.6 Wh L−1.
Finally, the continuous flow experiments, ACAEM and CAAEM lead to the conclusion that an anode to cathode flow mode was the optimal mode of flow of feed. The power required for treatment was 21.2 Kwh/m3. The developed process showed promise in small scale on-site electrochemical treatment of wastewater. The treated water could be used for agricultural purposes. However, the work demands further long-term lab-scale studies and pilot studies to determine the durability of the AEM membrane which will dictate the scale-up feasibility of the process developed. Further, studies about the disinfection by-products (DBP's like HAAs, THM's, perchlorates) released after electrolysis is required for promoting commercialization of the system in the future.
Data Availability Statement
The raw data supporting the conclusions of this article will be made available by the authors, without undue reservation, to any qualified researcher on request.
Author Contributions
GT completed all the lab-scale experiments, analysis, and manuscript writing. SM contributed to the design of the experiments and supported us with his expertise throughout the study. Both the authors read and approved the final manuscript.
Funding
This work was financed from the funds provided by DBT-BIRAC and Bill & Melinda Gates Foundation issued for the Reinvent the Toilet Challenge initiative.
Conflict of Interest
The authors declare that the research was conducted in the absence of any commercial or financial relationships that could be construed as a potential conflict of interest.
Supplementary Material
The Supplementary Material for this article can be found online at: https://www.frontiersin.org/articles/10.3389/fenrg.2020.00020/full#supplementary-material
References
Balaganesh, A. S., Sengodan, R., Ranjithkumar, R., and Chandarshekar, B. (2018). Synthesis and characterization of porous calcium oxide nanoparticles (CaO NPS). Int. J. Innov. Technol. Explor Eng. 8, 312–314.
Chen, G. (2004). Electrochemical technologies in wastewater treatment. Sep. Purif. Technol. 38, 11–41. doi: 10.1016/j.seppur.2003.10.006
Chen, X., Gao, Y., Hou, D., Ma, H., Lu, L., Sun, D., et al. (2017). The microbial electrochemical current accelerates urea hydrolysis for recovery of nutrients from source-separated urine. Environ. Sci. Technol. Lett. 4, 305–310. doi: 10.1021/acs.estlett.7b00168
Cho, K., Qu, Y., Kwon, D., Zhang, H., Cid, C. A., Aryanfar, A., et al. (2014). Effects of anodic potential and chloride ion on overall reactivity in electrochemical reactors designed for solar-powered wastewater treatment. Environ. Sci. Technol. 48, 2377–2384. doi: 10.1021/es404137u
Desloover, J., Abate Woldeyohannis, A., Verstraete, W., Boon, N., and Rabaey, K. (2012). Electrochemical resource recovery from digestate to prevent ammonia toxicity during anaerobic digestion. Environ. Sci. Technol. 46, 12209–12216. doi: 10.1021/es3028154
Desloover, J., Vrieze, J., De, V.ijver, M., Van De, Mortelmans, J., and Rozendal, R. (2015). Electrochemical nutrient recovery enables ammonia toxicity control and biogas desulfurization in anaerobic digestion. Environ. Sci. Technol. 49, 948–955. doi: 10.1021/es504811a
Drennan, D. M., Koshy, R. E., Gent, D. B., and Schaefer, C. E. (2019). Electrochemical treatment for greywater reuse: effects of cell configuration on COD reduction and disinfection byproduct formation and removal. Water Sci. Technol. Water Supply 19, 891–898. doi: 10.2166/ws.2018.138
Drevet, R., and Benhayoune, H. (2012). “Electrochemical deposition of calcium phosphate coatings on a prosthetic titanium alloy substrate,” in Calcium Phosphate: Structure, Synthesis, Properties, and Applications, ed. R. B. Heimann (New York, NY: Nova Science Publishers), 231–252.
Fajardo, A. S., Seca, H. F., Martins, R. C., Corceiro, V. N., Freitas, I. F., Quinta-ferreira, M. E., et al. (2017). Electrochemical oxidation of phenolic wastewaters using a batch-stirred reactor with NaCl electrolyte and Ti/RuO 2 anodes. J. Electroanal. Chem. 785, 180–189. doi: 10.1016/j.jelechem.2016.12.033
Feng, C., Sugiura, N., Shimada, S., and Maekawa, T. (2003). Development of a high performance electrochemical wastewater treatment system. J. Hazard. Mater. 103, 65–78. doi: 10.1016/S0304-3894(03)00222-X
Gildemyn, S., Luther, A. K., Andersen, S. J., Desloover, J., and Rabaey, K. (2015). Electrochemically and bioelectrochemically induced ammonium recovery. J. Vis. Exp. 2015, 1–12. doi: 10.3791/52405
Grimm, J., Bessarabov, D., and Sanderson, R. (1998). Review of electro-assisted methods for water purification. Desalination 115, 285–294. doi: 10.1016/S0011-9164(98)00047-2
Hanson, A. M., Lee, G. F., Hanson, A. M., and Lee, G. F. (2016). Forms of organic nitrogen in domestic wastewater. J. Water Pollut. Control Fed. 43, 2271–2279. Available online at: http://www.jstor.org/stable/25037233
Hong, K. H., Kim, W. Y., Son, D. J., Yun, C. Y., Chang, D., Bae, H. S., et al. (2014). Characteristics of organics and nutrients removal in municipal wastewater treatment by electrolysis using copper electronic conductor. Int. J. Electrochem. Sci. 9, 3979–3989.
Høverstad, T., Fausa, O., Bjørneklett, A., Bøhmer, T., and Bjrneklett, T. H. F. A. (2018). Short-chain fatty acids in the normal human feces short-chain fatty acids in the normal human feces. Scand. J. Gastroenterol. 19:5521. doi: 10.1080/00365521.1984.12005738
Huang, X., Qu, Y., Cid, C. A., Finke, C., Hoffmann, M. R., Lim, K., et al. (2016). Electrochemical disinfection of toilet wastewater using wastewater electrolysis cell. Water Res. 92, 164–172. doi: 10.1016/j.watres.2016.01.040
Kim, D. G., Kim, W. Y., Yun, C. Y., Son, D. J., Chang, D., Bae, H. S., et al. (2013). Agro-industrial wastewater treatment by electrolysis technology. Int. J. Electrochem. Sci. 8, 9835–9850.
Kim, K. W., Kim, Y. J., Kim, I. T., Park, G. I., and Lee, E. H. (2005). The electrolytic decomposition mechanism of ammonia to nitrogen at an IrO2 anode. Electrochim. Acta 50, 4356–4364. doi: 10.1016/j.electacta.2005.01.046
Kraft, A. (2008). Electrochemical water disinfection: a short review. Platin. Met. Rev. 52, 177–185. doi: 10.1595/147106708X329273
Ledezma, P., Jermakka, J., Keller, J., and Freguia, S. (2017). Recovering nitrogen as a solid without chemical dosing: bio-electroconcentration for recovery of nutrients from urine. Environ. Sci. Technol. Lett. 4, 119–124. doi: 10.1021/acs.estlett.7b00024
Li, L., and Liu, Y. (2009). Ammonia removal in electrochemical oxidation: mechanism and pseudo-kinetics. J. Hazard. Mater. 161, 1010–1016. doi: 10.1016/j.jhazmat.2008.04.047
Luther, A. K., Desloover, J., Fennell, D. E., and Rabaey, K. (2015). Electrochemically driven extraction and recovery of ammonia from human urine. Water Res. 87, 367–377. doi: 10.1016/j.watres.2015.09.041
Martínez-Huitle, C. A., and Ferro, S. (2006). Electrochemical oxidation of organic pollutants for the wastewater treatment: direct and indirect processes. Chem. Soc. Rev. 35, 1324–1340. doi: 10.1039/B517632H
Massoud, M. A., Tarhini, A., and Nasr, J. A. (2009). Decentralized approaches to wastewater treatment and management: applicability in developing countries. J. Environ. Manage. 90, 652–659. doi: 10.1016/j.jenvman.2008.07.001
Min, C., Won, S., Cho, K., and Ho, M. R. (2018). Degradation of organic compounds in wastewater matrix by electrochemically generated reactive chlorine species : kinetics and selectivity. Catalysis Today 313, 189–195. doi: 10.1016/j.cattod.2017.10.027
Pearson, H. W., Mara, D. D., Mills, S. W., and Smallman, D. J. (1987). Physico-chemical parameters influencing faecal bacterial survival in waste stabilization ponds. Water Sci. Technol. 19, 145–152. doi: 10.2166/wst.1987.0139
Rabaey, K., Lissens, G., and Verstraete, W. (2005). “Microbial fuel cells: performances and perspectives,” in Biofuels for Fuel Cells: Renewable Energy From Biomass Fermentation. 377–399. Available online at: http://hdl.handle.net/1854/LU-328755 (accessed August 03, 2018).
Ren, S., Li, M., Sun, J., Bian, Y., Zuo, K., and Zhang, X. (2017). Short communication: a novel electrochemical reactor for nitrogen and phosphorus recovery from domestic wastewater. Front. Environ. Sci. Eng. 11:17. doi: 10.1007/s11783-017-0983-x
Samir, A., and Abbas, S. A. (2013). Combination of electrocoagulation and electro-oxidation processes of textile wastewaters treatment. Civil Environ. Res. 3, 61–74.
Science, W., and Ho, G. (2016). Technology for sustainability: the role of onsite, small and community scale technology. Water Sci. Technol. 51, 15–20. doi: 10.2166/wst.2005.0346
Talekar, G. V., Sharma, P., Yadav, A., and Clauwaert, P. (2018). Sanitation of blackwater via sequential wetland and electrochemical treatment. NPJ Clean Water 1, 1–9. doi: 10.1038/s41545-018-0014-x
Tartakovsky, B., Mehta, P., Bourque, J. S., and Guiot, S. R. (2011). Electrolysis-enhanced anaerobic digestion of wastewater. Bioresour. Technol. 102, 5685–5691. doi: 10.1016/j.biortech.2011.02.097
Tennakoon, C. L. K., Bhardwaj, R. C., and Bockris, J. O. (1996). Electrochemical treatment of human wastes in a packed bed reactor. J. Appl. Electrochem. 26, 18–29. doi: 10.1007/BF00248184
Vlyssides, A. G., and Israilides, C. J. (1998). Electrochemical oxidation of a textile dye and finishing wastewater using a Pt/Ti electrode. J. Environ. Sci. Heal. A 33, 847–862. doi: 10.1080/10934529809376765
Wahyuni, E. A. (2015). The influence of pH characteristics on the occurance of coliform bacteria in Madura Strait. Proc. Environ. Sci. 23, 130–135. doi: 10.1016/j.proenv.2015.01.020
Yang, Y., Lin, L., Tse, L. K., Dong, H., Yu, S., and Hoffmann, M. R. (2019). Membrane-separated electrochemical latrine wastewater treatment. Environ. Sci. 5, 51–59. doi: 10.1039/c8ew00698a
Zhang, Y., Desmidt, E., Van Looveren, A., Pinoy, L., Meesschaert, B., and Van Der Bruggen, B. (2013). Phosphate separation and recovery from wastewater by novel electrodialysis. Environ. Sci. Technol. 47, 5888–5895. doi: 10.1021/es4004476
Keywords: electrooxidation, electro disinfection, membrane divided cells, anion exchange membrane, cation exchange membrane
Citation: Talekar GV and Mutnuri S (2020) Membrane Selection for Electrochemical Treatment of Septage. Front. Energy Res. 8:20. doi: 10.3389/fenrg.2020.00020
Received: 19 September 2019; Accepted: 04 February 2020;
Published: 25 February 2020.
Edited by:
Subba Rao Chaganti, University of Michigan, United StatesReviewed by:
Makarand M. Ghangrekar, Indian Institute of Technology Kharagpur, IndiaQaisar Mahmood, COMSATS University, Islamabad Campus, Pakistan
Copyright © 2020 Talekar and Mutnuri. This is an open-access article distributed under the terms of the Creative Commons Attribution License (CC BY). The use, distribution or reproduction in other forums is permitted, provided the original author(s) and the copyright owner(s) are credited and that the original publication in this journal is cited, in accordance with accepted academic practice. No use, distribution or reproduction is permitted which does not comply with these terms.
*Correspondence: Srikanth Mutnuri, c3Jpa2FudGhAZ29hLmJpdHMtcGlsYW5pLmFjLmlu