
94% of researchers rate our articles as excellent or good
Learn more about the work of our research integrity team to safeguard the quality of each article we publish.
Find out more
ORIGINAL RESEARCH article
Front. Energy Res. , 06 February 2020
Sec. Solar Energy
Volume 7 - 2019 | https://doi.org/10.3389/fenrg.2019.00163
Solar energy industries require an accurate estimation of global solar irradiation particularly on inclined planes. This improves the accuracy of the sizing procedures and optimizes the performance of the solar energy platforms as photovoltaic modules and flat-plate solar collectors. A variety of the transposition models have been developed and reportedly determine incidences of solar irradiance on an inclined surface. However, there is a gap in the literature regarding identifying the most promising transposition model, particularly for the Middle East and North Africa region (MENA). Therefore, this article serves two main objectives. Firstly, it compares comprehensively 24 different transposition models. Several statistical methods are used to quantify the performance of the tilted surface transposition models. Furthermore, the transposition models are compared with real, hourly measured time-series data for several Palestinian cities to identify the promising and most accurate model. The analysis was carried out on three bases: annually, monthly, and a clearness index. The transposition models prove their ability to represent the measured data during the annual and monthly analyses, but they all failed to achieve complacency in the clearness index (KtKt) for the clear sky condition (Kt > 0.78). Secondly, the article advises a reliable and accurate transposition model for the area of the MENA for clear sky conditions. The proposed model was tested for the sites under investigation, and it produces significantly better performance than the candidate transposition models.
Accurate meteorological data, particularly different components of solar radiation, are mandatory for the different stages of the solar energy project, such as design, sizing, performance evaluation, and implementation phases. However, there is a lack of accurate data for the global solar irradiance on titled surfaces for the MENA region, particularly Palestine state. The transposition models could compensate for the deficiency in the measured solar irradiance data. They estimate the global solar radiation with acceptable accuracy (Ulgen and Hepbasli, 2004; Noorian et al., 2008; Chwieduk, 2009; Besharat et al., 2013; Escobedo et al., 2014; Pandey and Katiyar, 2014; Horváth and Csoknyai, 2015; Tuomiranta and Ghedira, 2015; Michael et al., 2016; Vasar et al., 2016; Moretón et al., 2017; Zhang et al., 2017; Pérez-Burgos et al., 2018). The transposition models in general depend on the measured values of horizontal irradiance (Idh) and the global horizontal irradiance (Ih) to compute the global solar irradiance on a tilted surface. Moreover, they could be used to optimize the tilt and azimuth of Photovoltaic (PV) arrays (Yadav and Chandel, 2013; Camelia and Dorin, 2014; Khatib et al., 2015; Hafez et al., 2017; Raptis et al., 2017), which boost the conversion efficiency of PVs and allows accurate tracking for maximum power point under different operating conditions.
Recently, many transposition models are developed and reported for estimating the hourly global solar radiation on inclined surfaces. These models, as the literature claimed, could predict solar irradiation with sufficient accuracy (Ulgen and Hepbasli, 2004; Noorian et al., 2008; Tuomiranta and Ghedira, 2015; Michael et al., 2016; Moretón et al., 2017; Zhang et al., 2017). However, it is difficult to identify a promising transposition model that could be considered as a reference. The literature shows a major difference between the transposition model output and the measured data. In general, the transposition model, as the literature claimed, is site dependent. This also is obvious in Table A1, where list of recommended models for various countries is shown. Moreover, a discrepancy is quite obvious in the literature. For example, the isotropic model is claimed in Reindl et al. (1990a) to be the least efficient for the hourly diffusion of radiation on tilted surfaces. However, Table A1 in the appendix shows the contrary; here, the isotropic model is adopted as a transposition model for diffuse solar irradiance on inclined plane for different countries.
Solar energy software shows the significance of transposition model accuracy. These simulation programs are developed by commercial and governmental bodies for facilitating the sizing, design, and economical/dynamic evaluation of solar energy projects. Their performance is solely transposition model dependent. Thus, uncertainty and/or inaccurate estimations of solar irradiance result in economic and technical inconveniences. Table A2 tabulates the widely used solar energy software, including the software name, the country, and the transposition model used for developing.
Recently, several databases, such as NASA-SSE1 SOLARGIS2, Meteoblue AG3, HELIOS4, European Solar Radiation Atlas (ESRA)5, Satel-Light6, and Meteonorm7, have begun to provide different components of solar irradiances, such as Ih, Idh, and It, freely to users in a simplified manner. However, these databases face the same limitation as solar energy evaluating software; they principally depend on a transposition model. They use different models to compute the sky-diffuse and ground-reflected components of the solar irradiance on inclined surfaces. For example, the HelioClim3 database uses a Muneer model for the sky-diffuse and isotropic model for ground-reflected components8. Therefore, it is necessary to identify the most reliable, applicable, and accurate transposition model, which has the objective of determining the most reliable database and solar energy software.
The literature lacks clear comparative studies between the different transportation models. Usually, the literature has a peer-to-peer comparison between a proposed and an existing model. This comparison usually focuses on the ability of the proposed model to fit the measured data for a particular site and specific time span (Yadav and Chandel, 2013; Camelia and Dorin, 2014; Khatib et al., 2015; Hafez et al., 2017; Raptis et al., 2017). Therefore, this article introduces a comprehensive and statistically authenticated comparison between 24 different transposition models to identify the most promising candidate for the MENA region and the Palestine state in particular. The article addresses different problems of the widely used transposition models, such as site dependency and the mechanism for forecasting global solar irradiance on inclined surface. The analysis was carried out on three bases: annually, monthly, and a clearness index. The transposition models are compared with real, hourly measured time-series data over the course of 15 months (June 2017 to August 2018) of the selected cities to identify the promising and most accurate model. The article also advises a simple and robust transportation model for estimating the solar irradiance of inclined surface for clear sky. The MENA region enjoys a clear sky scenario, Kt > 0.78, for a high percentage of daylight hours.
The article has several contributions:
1. Identifying the most accurate models for representing the sky-diffuse solar irradiance under different sky conditions, and Palestinian territories are used as a case study. Consequently, the appropriate solar energy software/database could be easily determined for the study case and the similar geographical sites.
2. Advising a model that achieves better performance in predicating climatic data for clear sky than the reported transposition models. A clear sky scenario, Kt > 0.78, represents a high percentage of daylight hours for the region of the MENA.
The research methodology commenced by discussing the studied sites and the data control. This was to confirm the validity and applicability of the obtained results. Then, the transposition models concerned were highlighted. Finally, the methodology section introduces the statistical tools used for evaluating each transposition model individually.
Six different cities in the Palestine state were used for assessing the feasibility of these models. The location and geographical data for these cities are illustrated in Figure 1 and Table 1. These cities are selected to represent different characteristics of the Palestine State. For example, Rafah and Gaza depict the terrains with relatively long coasts, Hebron and Nablus represent territories surrounded with mountains, and Jericho and Tulkarm represent the terrains with valleys and plains, respectively. The analysis carried out in thiss research is generic. It could therefore act as a valuable reference for similar territories.
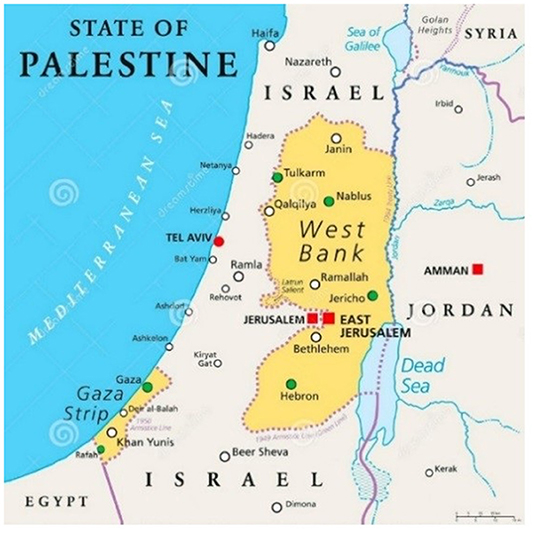
Figure 1. The cities concerned in the Palestine State (circled green ). [source: https://www.dreamstime.com/stock-illustration-state-palestine-political-map-designated-capital-east-jerusalem-claiming-west-bank-gaza-strip-borders-image74413499].
The three components, Ibt, Idt, and Irt, of the global inclined solar irradiance It were determined from the measured values of It, Ih, and Idh. Three pyranometers were used for values of It, Ih, and Idh. Idh is usually obtained from an eye shaded pyranometer. This research used the data recorded from 7th June 2017 up to 12th September 2018 for Rafah, Gaza, Hebron, Jericho, Nabuls, and Tulkarm. The data of global, sky-diffuse horizontal, and global for tilt angle 30° south-facing pyranometers were recorded. A specimen of these measurements and calculations are presented graphically in Figure 2 for horizontal and 30° south-facing planes for the four cities during the day of 21st November 2017.
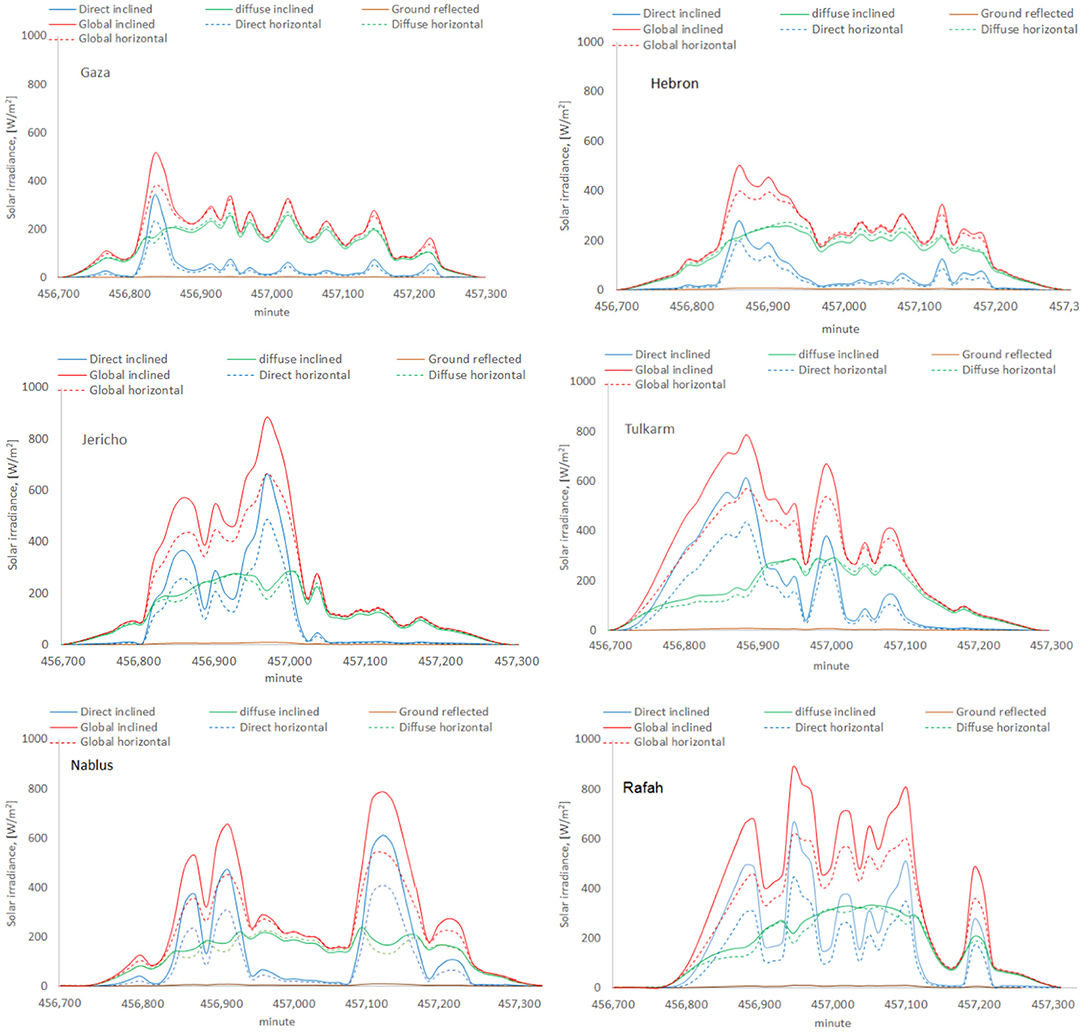
Figure 2. Fifteen-minute time-series measurements and estimated solar radiation components for Gaza, Hebron, Jericho, Tulkarm, Nablus, and Rafah on November 21st, 2017.
Figure 2 shows that the city of Rafah receives more solar irradiance than other cities. Jericho has the highest peak. Each city has distinctive solar irradiance patterns despite the small geographical zone of them (Figure 1). The global inclined irradiance is more than the horizontal one, which is attributed to the reflected component. Figure 2 shows that Gaza and Hebron have high degree of similarity. The data in the article have passed a quality control by many solar energy research centers in Gaza Strip and West Bank Universities (such as An-Najah National University, Polytechnic University, University of Palestine, The Palestinian Energy & Environment Research Center, and many others). The data are also authorized to be used by the Palestinian Central Bureau of Statistics, and they are handled by local researchers.
Transposition models require data of Ih and Idh to estimate the global solar irradiance on a tilted surface (It). Ih is usually measured via a pyranometer. A pyranometer could be used also for measuring Idh by shading its eye. This is to eliminate the direct beam component by mounting a small shading disk on the pyranometer. Ih has two components, direct beam (Ibh) and sky-diffuse (Idh), as given by Nassar (2006); Duffie and Beckman (2013); Bilbao et al. (2014); Alsadi and Nassar (2016),
The direct normal solar irradiance (IDN) is given by
Transposition models usually convert solar irradiance on a horizontal plane to that on a tilted one. Thus, the global irradiance for a tilted surface, It, at a slope angle (β) from the horizontal is given by Nassar (2006)
Equation (3) could be arranged in terms of the available data Ibh and Idh by Nassar (2006), Duffie and Beckman (2013)
The transposition factor Rb could be given as a function of geometrical parameters of the inclined surface and the position of the sun by Nassar (2006), Duffie and Beckman (2013)
where θi, θz are the solar incidence and zenith angles, respectively. Similarly, Rr is the transposition factor for ground-reflected solar irradiance. It is given by
ρg is the albedo radiation factor, which is alternatively themed for the ground reflectivity. It is generally assumed to equal 0.2 (Moretón et al., 2017). For a ground covered with a layer of water or with plants having glossy leaves, the reflection of such radiation is usually anisotropic. The ground transposition factor Rr is given by Temps and Coulson (1977)
where ψ is the surface azimuth angle. The diffuse irradiance is due to scattering of the solar radiation by the different components of the atmosphere. Therefore, it has naturally a non-uniform distribution throughout the sky. However, some models consider diffuse irradiance to be uniform and isotropic. Other models try to depict the scattering processing by adding to the isotropic background, the diffuse irradiance coming from the circumsolar region and the horizon band. Therefore, the models for estimating Idt, and hence the transposition models, could be divided into two groups: isotropic and anisotropic. The anisotropic group is further divided depending on the region and/or the band used in considering Idt (Gracia and Huld, 2013).
The isotropic models assume that the intensity of diffuse sky radiation is uniform over the sky hemisphere. Hence, the diffuse radiation depends only on the transposition factor Rd. Equations (5)–(7) could be used for determining Rb and Rr for these groups (Liu and Jordan, 1963; Temps and Coulson, 1977; Jimenez and Castro, 1986; Koronakis, 1986; Tian et al., 2001; Badescu, 2002; Nassar, 2006; Psiloglou and Kambezidis, 2009; Duffie and Beckman, 2013; Gracia and Huld, 2013; Bilbao et al., 2014; Lave et al., 2015; Alsadi and Nassar, 2016). This group includes several models:
1. Liu and Jordan model, 1963 (Liu and Jordan, 1963),
2. Korokanis model, 1986 (Koronakis, 1986),
3. Jimenez & Castro model, 1986 (Jimenez and Castro, 1986),
The transposition factor Rb of Jimenezvand Castro model is given by (Jimenez and Castro, 1986)
4. Tian model, 2001 (Tian et al., 2001),
where β is given in degree
5. Badescu model, 2002 (Badescu, 2002),
The anisotropic models assume the anisotropy of the diffuse sky radiation in the circumsolar region and the horizon in addition to the isotropic diffuse component. This group is relatively more accurate than isotropic models. Therefore, around 19 models of this group are considered in this comparative study. These include:
6. Bugler model, 1977 (Bugler, 1977),
7. Temps-Coulson model, 1977 (Temps and Coulson, 1977),
8. Steven and Unsworth model, 1979 (Steven and Unsworth, 1980),
9. Hay model, 1979 (Hay, 1979),
where is Hay's sky-clarity factor
10. Klucher model, 1979 (Klucher, 1979),
where
11. Modified Steven and Unsworth model, 1980 (Steven and Unsworth, 1979),
12. Willmot model, 1982 (Willmot, 1982),
where: , , β is in radians, and Isc = 1367W/m2
13. Ma-Iqbal model, 1983 (Ma, 1983),
where kt is the clearness index
14. Skartveit-Olseth model, 1986 (Skartveit and Olseth, 1986),
where Z = max [(0.3−2FHay), 0 ].
Equations (17) and (22) show that the Skartveit-Olseth model is evolved from the Hay model. Therefore, the performances of these models are forecasted to have a high degree of similarity.
15. Gueymard model, 1987 (Gueymard, 1986),
where Ng, Rdo and Rd1 are given by
where coefficients ai are a function of the solar elevation angle in γ degrees,
where γ′ = 0.01γ
where b = 1.5
16. Modified Bugler model, 1988 (Hay and McKay, 1988),
17. Perez model, 1988 (Perez and Scott, 1983; Perez and Stewart, 1983; Perez and Arbogast, 1985; Perez et al., 1986, 1987a,b, 1990a,b),
The Perez model is subjected to continuous revisions. This is to improve its performance capabilities and fit the measured data more accurately (Perez and Scott, 1983; Perez and Stewart, 1983; Perez and Arbogast, 1985; Perez et al., 1986, 1987a,b, 1990a,b). In this research study, two versions of the perez models are investigated: Perez model 1988 and1990. Perez model 1988, is given by
where a, b, F1, and F2 are given by
where and Δ, θz is in radians, and M is the optical air mass.
Perez published many versions of the Fij coefficients for different locations. Table A3 tabulates the Fij coefficients for Perezs model 1988.
18. Perez model, 1990 (Perez and Scott, 1983; Perez and Stewart, 1983; Perez and Arbogast, 1985; Perez et al., 1986, 1987a,b, 1990a,b),
Perez model 1990 reported in the literature (Perez et al., 1987a,b) has the same equations as Perez model 1988, Equation (35)–(39). However, the values of Fij coefficients, and thus Fij coefficients, differ from those in Table A3. Table A4 gives the Fij coefficients for Perezs model 1993.
19. Modified Ma-Iqbal model, 1990 (Kasten, 1966),
Where and the optical air mass, M are given, respectively, by
kt is as given by Equation (21)
20. Muneer model, 1990 (Muneer, 1990, 1997; Muneer et al., 2004),
FM is a composite clearness function. For shaded surface or overcast sky conditions FM = 0 and b = 2.5, while for clear sky and partly cloudy sky conditions FM = FHay and FHay could be determined by solving the following quadratic equation
21. HDKR model, 1990 (Reindl et al., 1990a,b):
where
22. Hay model, 1993 (Hay, 1993):
Where
This late model of Hay 1993 is the modified version of Hay's 1979. However, Hay's factor FHay in Equation (47) is normalized to the maximum value of solar irradiance, Isc.
23. Modified Olmo model, 1999 (Olmo et al., 1999),
where θi and θz (in radians) are the incidence and solar zenith angles, respectively, kt is the hourly clearness index, and the ρg is albedo of the underlying surface. The function is given by
24. CIBSE model, 2008 (CIBSE, 2008),
This is a modification of Klucher model, where the diffuse horizontal radiation was corrected:
where kb and fβ are given by
ϵj is the correction to mean solar distance on day j, and c is a constant. The values for constant c are as follows: Shadow surface: c = 5.73, Sunlit surface under overcast sky: c = 1.68, and Sunlit surface under non-overcast sky: c = −0.62.
Four different statistical methods are used to assess the potential of the transposition models. This is to identify the most reliable and accurate model, particularly for the area under concern. RMSE, MBE, PAD, and t-stat are the tools of the comparison. Furthermore, the outputs of the different transposition models are compared with measured values to visualize the fitting ability of each model. RMSE, MBE, PAD, and t-stat are defined by Alsadi and Nassar (2016),
The statistical methods Equations (53)–(56) could provide a logical pattern for comparing the different models. The Equations (53)–(56) indicates that the smaller values of RMSE, PAD, and t-stat the more accurate the transposition models are. The Equations (53)–(56) show that the results of RMSE, PAD, and t-stat are positive, while MBE produce ± values according to the deviation of the estimate from the measured values. The most promising transposition model should have the smallest values for RMSE, MBE, PAD, and t-stat simultaneously. However, they may not agree simultaneously on single transposition model (Khan and Ahmad, 2012). Therefore, the graphical comparison is introduced to show visually the correlation between the measured values and the output of each model.
The analysis is carried according to three bases: annual, monthly, and a clearness index. This diversity in the analysis widens the comparison and thus increases the feasibility and reliability of the conducted results.
The evaluation was carried out on an hourly basis for almost 1 year's worth of data records. The sky-diffuse solar irradiance on a 30° tilted south-facing surface was determined from measured horizontal data using the 24 models and compared with the semi-measured data for a tilted surface during the same period. Table 2 tabulates the statistical analysis results of the 24 considered transposition models for Hebron city.
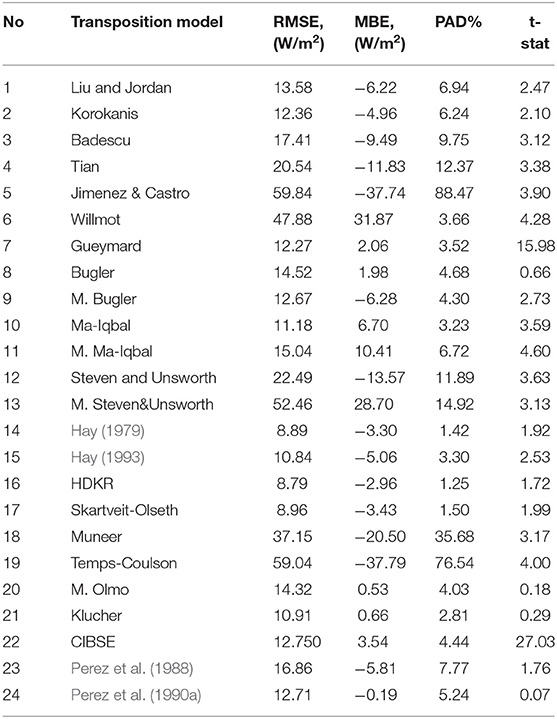
Table 2. Results of the transposition models, for Hebron city for a tilted angle of 30° south facing.
Skartveit-Olseth and HDKR are the most promising candidates according to RMSE. For t-stat, Perez 1990 has the best performance; however, HDKR is a reliable candidate. According to MBE, Perez 1990 is the most accurate model for Herbon city. It is clear from Table 2 that there is a difficulty for a model to achieve the best performance according to the different comparison statistical tools simultaneously. It could be concluded that HDKR model produces the better overall performance than the others for Herbon city. The table mandates the application of an additional comparison tool in order to confirm the feasibility and applicability of a definite transposition model. This tool could be the graphical comparison between the model output and the measured data (Padovan and Del-Col, 2010; Besharat et al., 2013).
In the graphical comparison, Figure 3, the red line represents the locus of the ideal transposition model. Therefore, the quality of a transposition model performance is evaluated via the shape of the distribution of blue dots around the red line. The average of the blue dots should be as close as possible to the red line for a reliable transposition model. Figure 3 shows that the majority of transposition model could produce reasonable accuracy in predicting Idt for Herbon city. However, HDKR, Skartveit-Olseth, and Hay 1979 are the most promising models. Meanwhile, Jimenez and Castro, Muneer, Temps-Coulson, and M. Steven deviated significantly from the measured values.

Figure 3. Sky-diffused solar irradiance estimation vs. measures for south-facing 30° tilt angle inclined surface in Herbon city for 24 models during all sky conditions (8,700 points depicted in the graph) (blue dot), y = x relation (red line).
It could be concluded from Table 2 and Figure 3 that HDKR could be considered as the reference transposition model for Herbon city.
Table 2 shows that t-stat is the least efficient comparison tool as it diverges from the remaining tools. Moreover, the graphical comparison, Figure 3, validates the deficiency of t-stat. The authors, when assessing the transposition models in the other cities concerned, found again that t-stat could not identify the promising model. Therefore, it could be concluded that t-stat is not recommended for identifying a transposition model for particular zone. This, however, differs from the conclusion in reference (Togrul, 1989), which recommends adopting t-stat as the standard tool for determining the best transposition model. Also, MBE fails to identify the appropriate transposition model for a specific city/zone. Table 2 and Figure 3 validate this finding. Therefore, RMSE and PAD are only considered in the remaining research as the authenticated comparative tools. The results of RMSE and PAD of different transposition models for different cities under investigations are given in Table 3.
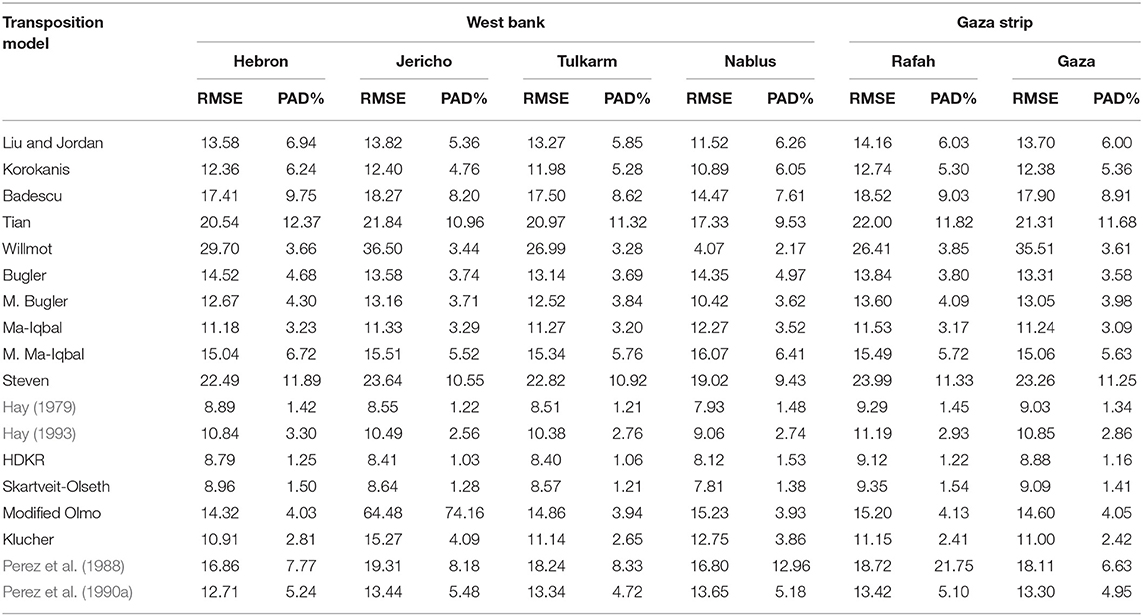
Table 3. RMSe and PAD of transposition models considered cities for a surface tilted 30° south facing.
Table 3 shows that there is coherent between RMSE and PAD. For a transposition model they converge simultaneously to optimal solutions. They could therefore also identify the quality of the transposition model at the same time. The bold numbers in Table 3 show the best solution. HDKR is the most promising solution for 83% of territories under concern. Again, Hay 1979 and Skartveit-Olseth produced comparable performance to HDKR at the majority of the cities under concern. Skartveit-Olseth produced better results than HDKR at Nablus. The preferred transposition models for Gaza, Rafah, Jericho, Tulkram, and Nablus are shown in Figure 4, where a visual comparison between estimated and measured values of Idt for these cities is shown.
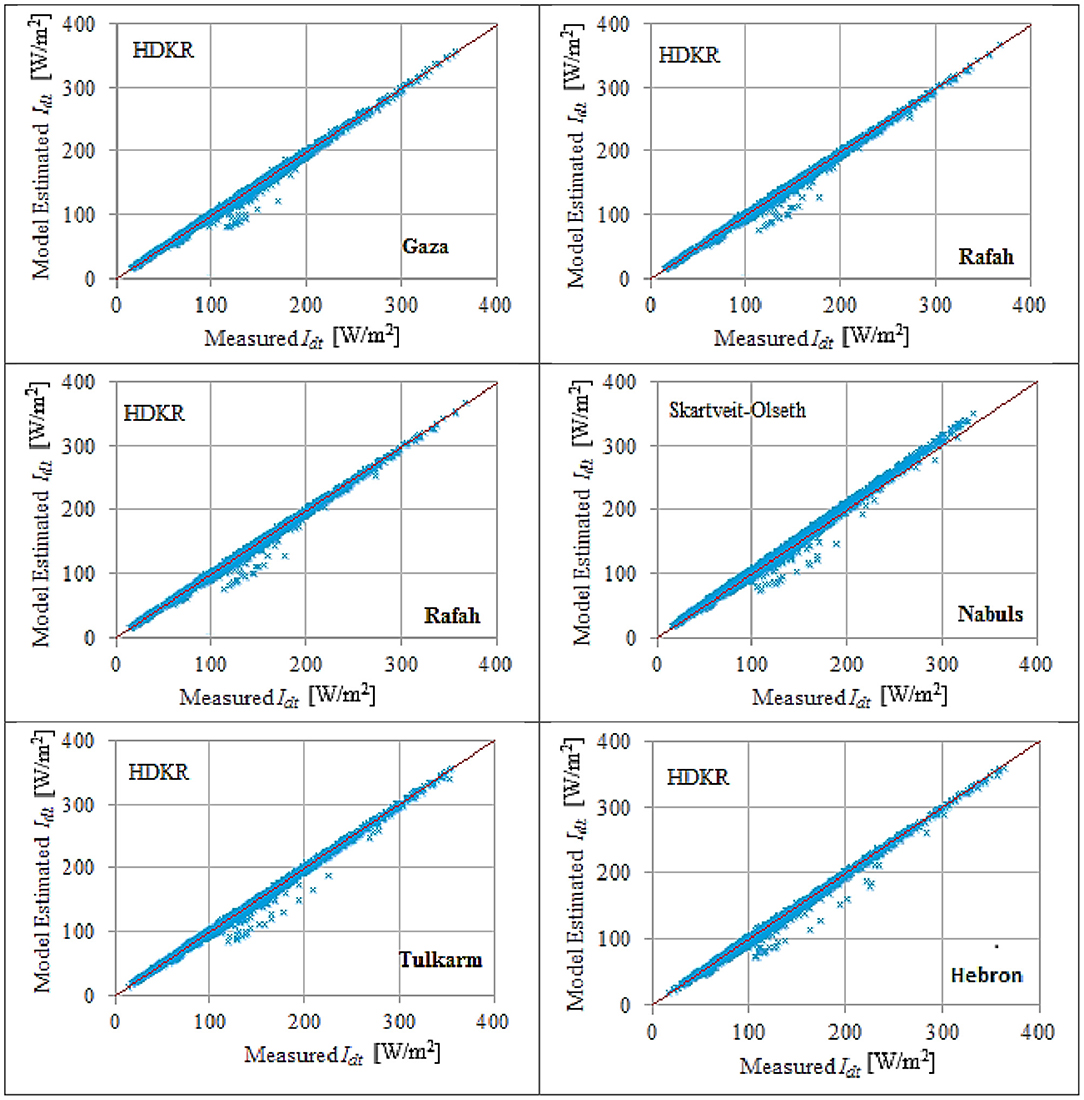
Figure 4. The most accurate diffuse-sky solar irradiance transposition models for the considered cities (8,700 points depicted in the graph) (blue dot), y = x relation (red line).
Figure 4 shows that HDKR model is the most accurate for majority of cities under concern except Nablus where the Stratveit-Olseth model is the most accurate model.
The monthly based approach was adopted to improve the accuracy of the obtained results. PAD was the tool used in the monthly based analysis to differentiate between the different transposition models. Again, the analysis was carried out from August 2017 until September 2018 for six different cities in the Palestine State. Table 4 shows the most promising transposition model for the different cities during each month.
Table 4 confirms the annually based analysis, as HDKR is the most promising candidate at different sites except Nablus, where Skartveit-Olseth model is preferred. However, there was some disparity in the behavior of the models over the months. The similarity between Rafah and Gaza is attributed to same climatological conditions for the two cities.
This analysis assesses the ability of the different transposition models in manipulating solar irradiance for different sky conditions. The sky conditions are classified into three scenarios (Burgess et al., 2011): overcast, intermediate, and clear conditions. The clearness index, kt, usually differentiated between the different conditions the sky. For example, overcast condition clearness index is below 0.3, kt < 0.3, while for intermediate conditions the clearness index is between 0.3 and 0.78 0.3 ≤ kt ≤ 0.78, and clearness index is more than 0.78, kt > 0.78 for clear conditions. The RMSE and PAD were calculated for all cities under different values of kt. The most accurate models having the lowest value of the RMSE and PAD are given in Table 5.
Table 5 again shows that there is no single transposition model that could produce an accurate estimation for the global solar irradiance on a titled plane and its component for different sky conditions, even for the same city. HDKR produced a satisfactory performance for intermediate sky condition for all cities except Nablus. However, for overcast and clear conditions, HDKR deviated from the optimal performance. The Perez model is possibly preferred for a clear sky, while Hay is preferable for overcast.
Table 5 shows that all cities except Nablus and Tulkram have the same best models: Hay 1979, HDKR, and Perez 1900 for clear, intermediate, and overcast sky conditions, respectively. This could be attributed to the latitudes of Nablus and Tulkram, as shown in Figure 1 and Table 1. These two cities are relatively far from the remaining cities.
The preferred models, Table 5, are subjected to the graphical comparison with the measured data for Hebron Figure 5 and Nablus Figure 6. Hebron and Nablus represent the two extremes.
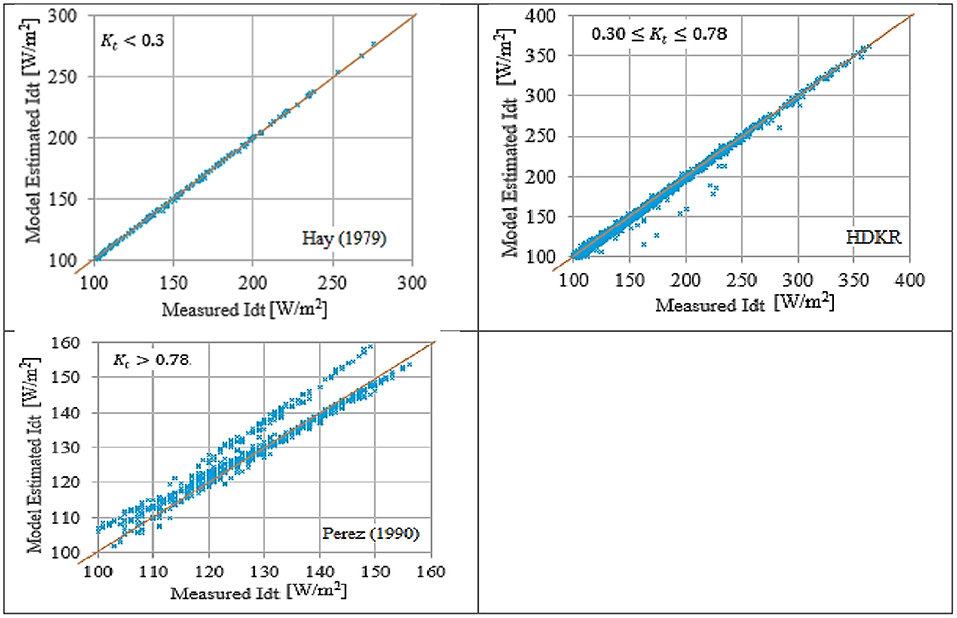
Figure 5. Preferred transposition model for different sky conditions for Hebron city (8,700 points depicted in the graph) (blue dot), y = x relation (red line).
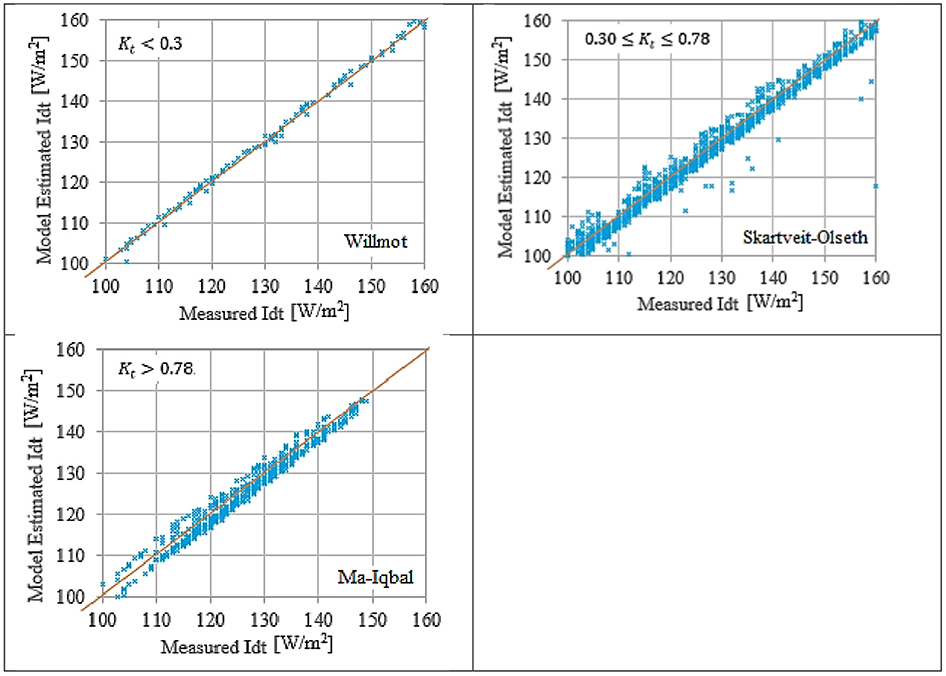
Figure 6. Preferred transposition model for different sky conditions for Nablus city (8,700 points depicted in the graph) (blue dot), y = x relation (red line).
Figures 5, 6 show the preferred models have satisfactory prediction capabilities for the measured data. However, for clear sky, kt > 0.78, the prediction capabilities of Perez 1990 and Ma-Iqbal were not adequate.
Perez 1990 and Ma-Iqbal models were the preferred models for Hebron and Nablus, respectively, for kt > 0.78, Table 5. However, their performances in the graphical comparison were not efficient. Moreover, kt > 0.78 represents the most dominant weather conditions in the area of MENA and Palestine State. Therefore, an adequate and robust transposition model is advised in this research for kt > 0.78.
The proposed model is basically a modification of the Muneer model. It is realized by increasing the share of the isotropic term in Equations (41) and (42). Different regression methods are used for developing the proposed model. Then, a refining is carried out to the model via trial and error technique. The proposed model is given by
Fb is as mentioned before a composite clearness function. It is equal to FHay, which is obtained from Equation (42) and is given in radians.
Table 6 tabulates the performance of the proposed model is compared against the best models for the different cities under investigations for clear sky conditions, kt > 0.78. RMSE and PAD are used as the comparison tools.
Table 6 shows that the proposed model is better at predicating sky-diffused solar irradiance on a titled surface for a clear sky than reported transposition models. There is around 600% reduction in the values of RMSE and PAD. This indicates that the proposed model outputs are similar to the measured values. Table 6 corroborates the reliability and functionality of the proposed model. The feasibility of the proposed model is validated further via a graphical comparison with the measured data, as shown in Figure 7.
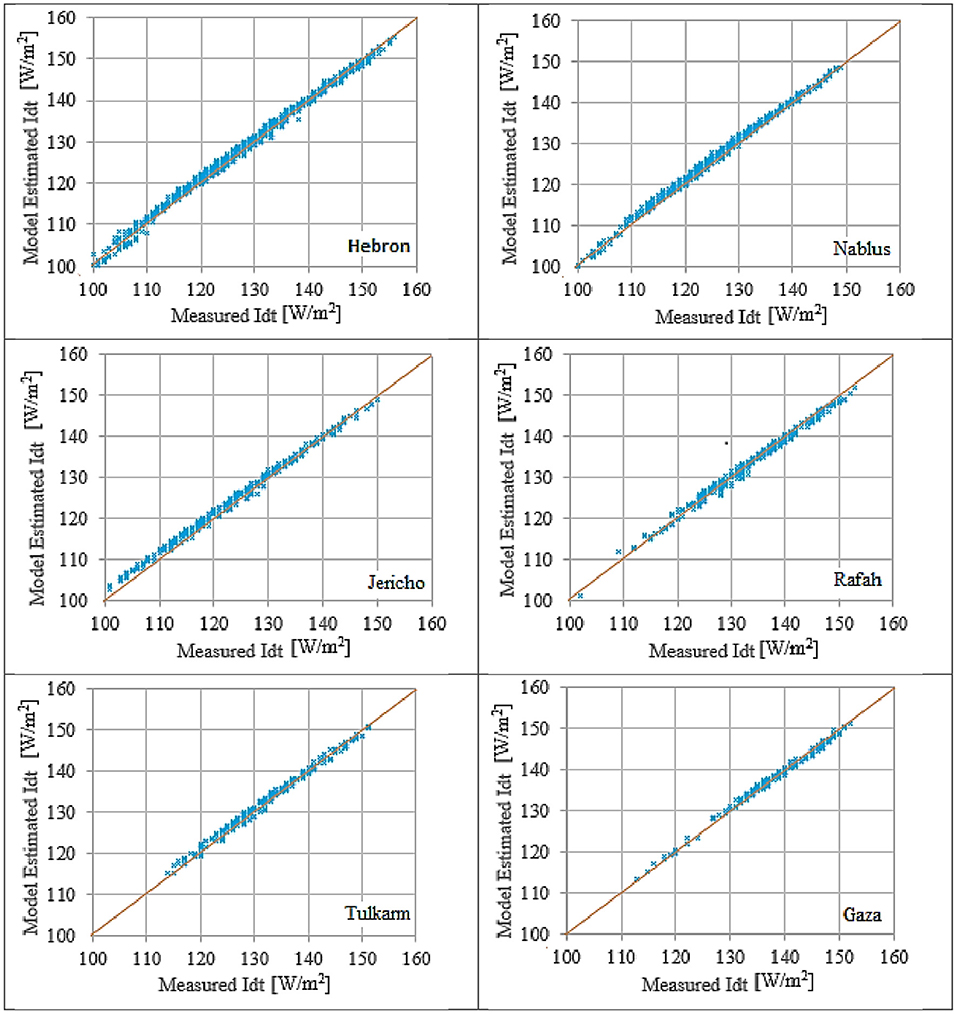
Figure 7. The behavior of the modified Muneer model for clear sky condition Kt > 0.78 (8,700 points depicted in the graph) (blue dot), y = x relation (red line).
Figure 7 shows the applicability of the proposed model in predicting global diffused solar irradiance on a titled surface. It fits the measured data efficiently.
Comparing Figures 5–7 reveals the evaluated quality of the proposed model. It produces much higher quality than even the best models. This model could be considered as a reference for Palestine city under investigations for this 30° south-facing inclined surface. Moreover, the feasibility of the proposed model is examined in other cities for the same climatological conditions. It again produces the best performance for clear sky condition, kt > 0.78.
The transposition model is a basic element in the solar energy conversion systems. It generates the data of the incidence of different solar irradiance components on inclined surfaces. These data are mandatory for the phases of design, sizing, and implementation of a solar energy project.
Solar energy software is usually developed according to specific transposition model. Moreover, the databases employ transposition models to generate the different solar irradiance data. Therefore, evaluating the performance of the dominant transposition models is elementary in determining the appropriate database and solar software.
This article compared comprehensively 24 different transposition models. The comparison is multi-factorial; it includes statistical and graphical phases. In the statistical part, four different methods—RMSE, MBE, PAD, and t-stat—were used to identify the most promising transposition model. In the graphical, the outputs of the transposition models were compared with the measured data to visualize the accuracy of the different models. Moreover, the comparison was carried out on three bases: annual, monthly, and a clearing index. Climatological data over 15 months (June 2017 to August 2018) of six different cities in the Palestine State were used to identify the potential of these 24 models, thus identifying the most accurate model for this region.
The results reveal a number of conclusions:
1. The Transposition model is site dependent; it is therefore difficult to adopt one model for entire zone/region with diverse climatological conditions. This conclusion complies with the literature (Kasten, 1966; Bugler, 1977; Hay, 1979, 1993; Klucher, 1979; Steven and Unsworth, 1979, 1980; Willmot, 1982; Ma, 1983; Perez and Scott, 1983; Perez and Stewart, 1983; Perez and Arbogast, 1985; Gueymard, 1986; Perez et al., 1986, 1987a,b, 1988, 1990a,b; Skartveit and Olseth, 1986; Hay and McKay, 1988; Muneer, 1990, 1997; Reindl et al., 1990b; Olmo et al., 1999; Tian et al., 2001; Badescu, 2002; Muneer et al., 2004; CIBSE, 2008; Padovan and Del-Col, 2010; Khan and Ahmad, 2012). Moreover, the accuracy of the transposition model varies according to the sky clearness, as the model could produce the best performance for overcast sky, but it suffered from deteriorated performance under clear sky conditions, Table 5.
2. The HDKR model showed a relatively better performance than the others for depicting the sky-diffuse inclined solar irradiance for a majority of Palestinian cities. For Nablus, however, the Skartveit-Olseth model produced a better overall performance than the other candidate models. It produced 3.4% higher than the HDKR model.
3. A majority of the investigated models suffered from inefficient performances for clear sky conditions, kt >0.78, which represents the majority of climatological conditions in the MENA; a robust, efficient, and reliable transposition model is therefore proposed in this article for kt >0.78. The proposed model, as shown in Table 6, Figures 5–7, produced a better performance than the best models for different the Palestine terrains under investigation.
4. It is difficult to identify a single software that could be used for the different cities in the entire region as these software are developed according to single transposition model, Table A2 in the appendix. A number of these are recommended for investigating the performance of solar energy projects in the Palestine state, such as HOMER, Energypro, and PVdesignPro. Matlab Simulink is appropriate for clear sky conditions, kt >0.78.
It is worth mentioning that further investigations are required for assessing the feasibility of the studied transposition models and the proposed model for other tilt and azimuth surface angles.
All datasets generated for this study are included in the article/Supplementary Material.
YN conceptualized the project and carried out the analysis. AH performed the editing. SA performed the data collection and graphical presentation.
The authors declare that the research was conducted in the absence of any commercial or financial relationships that could be construed as a potential conflict of interest.
The Supplementary Material for this article can be found online at: https://www.frontiersin.org/articles/10.3389/fenrg.2019.00163/full#supplementary-material
1. ^Satellite Solar Radiation Data. Available online at: http://www.eosweb.larc.nasa.gov/sse/.
2. ^SOLAR GIS. Available online at: http://www.solargis.info/index.html.
3. ^Meteoblue AG - Switzerland. Available online: http://www.meteoblue.com
4. ^HELIOS. Available online: http://www.helios.ies-def.upm.es/.
5. ^ESRA. The European Solar Radiation Atlas. Available online: https://www.scribd.com/document/142793445/The-European-Solar-Radiation-Atlas-Esra-1.
6. ^Global radiation data based on satellite images. Available online: http://www.satellight.com.
8. ^http://www.soda-pro.com/web-services/radiation/helioclim-3-archives-for-free/info
Alsadi, S., and Nassar, Y. (2016). Correction of the ASHRAE clear-sky model parameters based on solar radiation measurements in the Arabic countries. Int. J. Renew. Energy Technol. Res. 5, 1–16. Available online at: http://ijretr.org (accessed November 02, 2019).
Badescu (2002). 3D isotropic approximation for solar diffuse irradiance on tilted surfaces. Renew. Energy 26, 221–223. doi: 10.1016/S0960-1481(01)00123-9
Besharat, F., Dehghan, A., and Faghih, A. (2013). Empirical models for estimating global solar radiation: a review and case study. Renew. Sustain. Energy Rev. 21, 798–821. doi: 10.1016/j.rser.2012.12.043
Bilbao, J., Román, R., and De Miguel, A. (2014). “Measurements and model evaluations of direct normal irradiance in central Spain,” in Conference EuroSun 2014 (Aix-les-Bains). doi: 10.18086/eurosun.2014.08.03
Bugler, J. (1977). The determination of hourly insolation on an inclined plane using a diffuse irradiance model based on hourly measured global horizontal insolation. Solar Energy 19, 477–491. doi: 10.1016/0038-092X(77)90103-7
Burgess, P., Vahdati, M., Davies, D., and Philip, S. (2011). “Development of A virtual pyranometer for solar energy monitoring,” in TSBE Eng. Conference (Whiteknights: TSBE Centre, University of Reading). Available online at: http://www.reading.ac.uk/tsbe/ (accessed November 02, 2019).
Camelia, S., and Dorin, S. (2014) Optimum tilt angle for flat plate collectors all over the World – A declination dependence formula comparisons of three solar radiation models. Energy Conv. Manag. 81, 133–143. doi: 10.1016/j.enconman.2014.02.016
Chwieduk, A. (2009). Recommendation on modelling of solar energy incident on a building envelope. Renew. Energy 34, 736–741. doi: 10.1016/j.renene.2008.04.005
Duffie, J., and Beckman, W. (2013). Solar Engineering of Thermal Processes, 4th Edn. Hoboken, NJ: John Wiley & Sons, Inc.
Escobedo, J., Souza, A., and Martins, D. (2014). An assessment of the diffuse radiation models for prediction on hourly global radiation on tilted surface. Nativa 2, 23–31. doi: 10.14583/2318-7670.v02n01a05
Gracia, A., and Huld, T. (2013). Performance Comparison of Different Models for the Estimation of Global Irradiance on Inclined Surfaces, Report EUR 26075. Brussels: European Commission; Joint Research Centre; Institute for Energy and Transport.
Gueymard, C. (1986). An anisotropic solar irradiance model for tilted surfaces and its comparison with selected engineering algorithms. Solar Energy 38, 367–386. doi: 10.1016/0038-092X(87)90009-0
Hafez, A., Soliman, A., El-Metwally, K., and Ismail, I. (2017). Tilt and azimuth angles in solar energy applications – a review. Renew. Sustain. Energy Rev. 77, 147–168. doi: 10.1016/j.rser.2017.03.131
Hay, J. (1979). Study of Shortwave Radiation on Non-horizontal Surfaces, Downs View: Atmospheric Environment Service. Canadian Climate Centre Report.
Hay, J. (1993). Calculating solar radiation for inclined surfaces: practical approaches. Renew. Energy 3, 373–380. doi: 10.1016/0960-1481(93)90104-O
Hay, J., and McKay, D. (1988). Final Report IEA Task IX-Calculation of Solar Irradiances for Inclined Surfaces: Verification of Models Which Use Hourly and Daily Data. Technical Report. International Energy Agency Solar Heating and Cooling Programme.
Horváth, M., and Csoknyai, T. (2015). Evaluation of solar energy calculation methods for 45o inclined, south facing surface. Energy Proc. 78, 465–470. doi: 10.1016/j.egypro.2015.11.700
Kasten, F. (1966). A new table and approximate formula for relative optical air mass. Arch. Meteoral. Geophys. Bioklimatal. Series B 14, 206–223. doi: 10.1007/BF02248840
Khan, M., and Ahmad, M. (2012). Estimation of global solar radiation using clear sky radiation in Yemen. J Eng. Sci. Technol. Rev. 5, 12–19. doi: 10.25103/jestr.052.03
Khatib, T., Mohamed, A., Mahmoud, M., and Sopian, K. (2015). Optimization of the tilt angle of solar panels for Malaysia. Energy Sources 37, 606–613. doi: 10.1080/15567036.2011.588680
Klucher, T. (1979). Evaluation of models to predict insolation on tilted surfaces. Solar Energy 23, 111–114. doi: 10.1016/0038-092X(79)90110-5
Koronakis, P. (1986). On the choice of the angle of tilt for south facing solar collectors in the Athens basin area. Solar Energy 36, 217–225. doi: 10.1016/0038-092X(86)90137-4
Lave, M., Hayes, M., Pohl, A., and Hansen, C. (2015). Evaluation of global horizontal irradiance to plane-of-array irradiance models at locations across the united states. IEEE J. Photovolt. 5, 597–606. doi: 10.1109/JPHOTOV.2015.2392938
Liu, B., and Jordan, R. (1963). The long-term average performance of flat-plate solar energy collectors. Solar Energy 7, 53–74. doi: 10.1016/0038-092X(63)90006-9
Ma, C. (1983). Statistical comparison of models for estimating solar radiation on inclined surfaces. Solar Energy 31, 313–317. doi: 10.1016/0038-092X(83)90019-1
Michael, S., Okundamiya, J., Emagbetere, O., and Emmanuel, A. (2016). Evaluation of various global solar radiation models for Nigeria. Int. J. Green Energy 13, 505–512. doi: 10.1080/15435075.2014.968921
Moretón, R., Lorenzo, E., Pinto, A., Muñoa, J., and Narvarte, L. (2017). From broadband horizontal to effective inplane irradiation: a review of modelling and derived uncertainty for PV yield prediction. Renew. Sustain. Energy Rev. 78, 886–903. doi: 10.1016/j.rser.2017.05.020
Muneer, T. (1990). Solar radiation models for Europe. Build. Serv. Eng. Res. Technol. 11, 153–163. doi: 10.1177/014362449001100405
Muneer, T. (1997) Solar Radiation and Daylight Models for the Energy Efficient Design of Buildings. Oxford; Boston, MA: Architectural Press. 197–200.
Muneer, T., Gueymard, C., and Kambezidis, H. (2004). “Hourly slope irradiation and illuminance,” in Solar Radiation and Daylight Models, ed G. M. Alam (Oxford: Butterworth-Heinemann), 143–221. doi: 10.1016/B978-075065974-1/50012-7
Noorian, A., Moradi, I., and Kamali, G. (2008). Evaluation of 12 models to estimate hourly diffuse irradiation on inclined surfaces. Renew. Energy 33, 1406–1412. doi: 10.1016/j.renene.2007.06.027
Olmo, F., Vida, J., Foyo, I., Castro-Diez, Y., and Alados-Arboledas, L. (1999). Prediction of global irradiance on inclined surfaces from horizontal global irradiance. Energy 24, 689–704. doi: 10.1016/S0360-5442(99)00025-0
Padovan, A., and Del-Col, D. (2010). Measurement and modelling of solar irradiance components on horizontal and tilted planes. Solar Energy 84, 2068–2084. doi: 10.1016/j.solener.2010.09.009
Pandey, C., and Katiyar, A. (2014). Hourly solar radiation on inclined surfaces. Sust. Energy Technol. Assess. 6, 86–92. doi: 10.1016/j.seta.2014.01.007
Perez, R., and Arbogast, C. (1985). “Climatology of an anisotropic diffuse sky radiation model for slopes,” in Proceedings ISES Word Congress (Montreal, QC). doi: 10.1016/B978-0-08-033177-5.50470-1
Perez, R., Arbogast, C., Seals, P., and Scott, J. (1986). An anisotropic hourly diffuse radiation model for sloping surfaces: description, performance validation, site dependency evaluation. Solar Energy 36, 487–497. doi: 10.1016/0038-092X(86)90013-7
Perez, R., and Scott, J. (1983). “A two-parameter description of the sky hemisphere,” in Proceedings of ISES/AMS Fifth Conference on Atmospheric Radiation, Baltimore, MD (Boston: American Meteorological Society), 322–325.
Perez, R., Seals, R., Ineichen, P., and Menicucci, D. (1987b). A new simplified version of the Perez diffuse irradiance model for tilted surfaces. Solar Energy 39, 22l−231. doi: 10.1016/S0038-092X(87)80031-2
Perez, R., Seals, R., Ineichen, P., Stewart, R., and Michalsky, J. (1990a). Modelling daylight availability and irradiance components from direct and global irradiance. Solar Energy 44, 271–289. doi: 10.1016/0038-092X(90)90055-H
Perez, R., Seals, R., and Stewart, R. (1987a). “Modelling irradiance on tilted planes: a simpler version of the Perez model: US-wide climatic/environmental evaluation,” in Advances in Solar Energy Technology ISES World Congress, Ham burg. (New York, NY: Pergamon Press), 3784–3788. doi: 10.1016/B978-0-08-034315-0.50698-4
Perez, R., Seals, R., Zelenka, A., and Ineichen, P. (1990b). Climatic evaluation of models that predict hourly direct irradiance from hourly global irradiance: prospects for performance improvements. Solar Energy 44, 99–108. doi: 10.1016/0038-092X(90)90071-J
Perez, R., and Stewart, R. (1983). “An anisotropic model for diffuse radiation incident on slopes of different orientations and possible applications to CPCs,” in Proceeding of ASES Minneapolis. (Minneapolis, MN), 883–888.
Perez, R., Stewart, R., and Guertin, T. (1988). Sandia National Laboratories Contractor Report SAND88-7030 Oct. (1988). The Development and veriFication of the Perez Diffuse Radiation Model. Albuquerque, NM. doi: 10.2172/7024029
Pérez-Burgos, A., Díez-Mediavilla, M., Alonso-Tristán, C., and Dieste-Velasco, M. (2018). Retrieval of monthly average hourly values of direct and diffuse solar irradiance from measurements of global radiation in Spain. J. Renew. Sustain. Energy 10:023707. doi: 10.1063/1.5016926
Psiloglou, B., and Kambezidis, H. (2009). Estimation of the ground albedo for the Athens area, Greece. J. Atmos. Solar Terrestr. Phys. 71, 943–954. doi: 10.1016/j.jastp.2009.03.017
Raptis, P., Kazadzis, S., Psiloglou, B., Kouremeti, N., Kosmopoulos, P., and Kazantzidis, A. (2017). Measurements and model simulations of solar radiation at tilted planes, towards the maximization of energy capture. Energy 130, 570–580. doi: 10.1016/j.energy.2017.04.122
Reindl, D., Beckman, W., and Duffie, J. (1990a). Diffuse fraction correlations. Solar Energy 45, 1–7. doi: 10.1016/0038-092X(90)90060-P
Reindl, D., Beckman, W., and Duffie, J. (1990b). Evaluation of hourly tilted surface radiation models. Solar Energy 45, 9–17. doi: 10.1016/0038-092X(90)90061-G
Skartveit, A., and Olseth, J. (1986). Modelling slope irradiance at high latitudes. Solar Energy 36, 333–344. doi: 10.1016/0038-092X(86)90151-9
Steven, M., and Unsworth, M. (1979). The diffuse solar irradiance of slopes under cloudless skies. Quart. J. Roy. Meteorol. Soc. 105, 593–602. doi: 10.1002/qj.49710544507
Steven, M., and Unsworth, M. (1980). The angular distribution and interception of diffuse solar radiation below overcast skies. Quart. J. Roy. Meteorol. Soc. 106, 57–61. doi: 10.1002/qj.49710644705
Temps, R., and Coulson, K. (1977). Solar radiation incident upon slopes of different orientation. Solar Energy 19, 179–184. doi: 10.1016/0038-092X(77)90056-1
Tian, Y., Davies-Colley, R., Gong, P., and Thorrold, B. (2001). Estimating solar radiation on slopes of arbitrary aspect. Agric. Forest Meteorol. 109, 67–74. doi: 10.1016/S0168-1923(01)00245-3
Togrul, I. (1989). Comparison of statistical performance of seven sunshine based models for Elazig, Turkey. Chim. Acta Turcicam. 1, 26–37.
Tuomiranta, A., and Ghedira, H. (2015). “Evaluation of decomposition and transposition models for irradiance data conversion under a hot desert climate,” in 3rd International Conference Energy and Meteorology (Boulder, CO).
Ulgen, K., and Hepbasli, A. (2004). Solar radiation models. Part 1: a review. Energy Sourc. 26, 507–520. doi: 10.1080/00908310490429696
Vasar, C., Prostean, O., and Prostean, G. (2016). Evaluating solar radiation on tilted surfaces – a study case in Timis (Romania). IOP Conf. Ser. Mater. Sci. Eng. 106:012026. doi: 10.1088/1757-899X/106/1/012026
Willmot, C. (1982). On the climatic optimization of the tilt and azimuth of flat-plate solar collectors. Solar Energy 28, 205–216. doi: 10.1016/0038-092X(82)90159-1
Yadav, A., and Chandel, S. S. (2013). Tilt angle optimization to maximize incident solar radiation: a review. Renew. Sust. Energy Rev. 23, 503–513. doi: 10.1016/j.rser.2013.02.027
Zhang, J., Zhao, L., Deng, S., Xu, W., and Zhang, Y. (2017). A critical review of the models used to estimate solar radiation. Renew. Sustain. Energy Rev. 70, 314–329. doi: 10.1016/j.rser.2016.11.124
Keywords: diffuse, Palestine, MENA, diffuse solar irradiance, transposition models, isotropic models, anisotropic models, clearness index
Citation: Nassar YF, Hafez AA and Alsadi SY (2020) Multi-Factorial Comparison for 24 Distinct Transposition Models for Inclined Surface Solar Irradiance Computation in the State of Palestine: A Case Study. Front. Energy Res. 7:163. doi: 10.3389/fenrg.2019.00163
Received: 08 November 2019; Accepted: 18 December 2019;
Published: 06 February 2020.
Edited by:
Ravishankar Sathyamurthy, Hindustan University, IndiaReviewed by:
Runsheng Tang, Yunnan Normal University, ChinaCopyright © 2020 Nassar, Hafez and Alsadi. This is an open-access article distributed under the terms of the Creative Commons Attribution License (CC BY). The use, distribution or reproduction in other forums is permitted, provided the original author(s) and the copyright owner(s) are credited and that the original publication in this journal is cited, in accordance with accepted academic practice. No use, distribution or reproduction is permitted which does not comply with these terms.
*Correspondence: Samer Y. Alsadi, cy5hbHNhZGlAcHR1ay5lZHUucHM=
Disclaimer: All claims expressed in this article are solely those of the authors and do not necessarily represent those of their affiliated organizations, or those of the publisher, the editors and the reviewers. Any product that may be evaluated in this article or claim that may be made by its manufacturer is not guaranteed or endorsed by the publisher.
Research integrity at Frontiers

Learn more about the work of our research integrity team to safeguard the quality of each article we publish.