 Dequn Zhou1,2
 Tingwei Liu
 Qunwei Wang
95% of researchers rate our articles as excellent or good
Learn more about the work of our research integrity team to safeguard the quality of each article we publish.
Find out more
ORIGINAL RESEARCH article
Front. Energy Res. , 21 January 2020
Sec. Sustainable Energy Systems
Volume 7 - 2019 | https://doi.org/10.3389/fenrg.2019.00160
This article is part of the Research Topic Energy Market and Energy Transition: Dynamics and Prospects View all 22 articles
Chinese society's unique characteristics present challenges with regard to discovering new ways to tackle tremendous environmental problems. This paper examines the effect of provincial social capital on environmental performance in China. In the first stage of the analysis, we measured the environmental performance levels of the 2011–2017 panel data of 30 provinces in China. We did this using data envelopment analysis (DEA). After introducing the concept of social capital, we innovatively built the social capital index system based on China's national conditions and measured social capital data from three perspectives. Then, we used the Probit regression model to explore the effect of social capital on environmental performance. The results show that the environmental performance of the well-known and better developed regions of China (such as Beijing, Shanghai, etc.) is significantly higher than other regions. Social capital and environmental performance are related in general. However, the effect of social capital on environmental performance is heterogeneous in different regions. They are more consistent in the eastern and southwest regions but are less stable in other regions. Among the three types of social capital, structural capital has the most obvious benefits for environmental performance. This is followed by relational capital and innovative capital. Furthermore, it has been found that the proportion of the tertiary industry in GDP and the level of social trust are the largest indicators of the rates at which structural capital and relational capital contribute, respectively, to environmental performance.
China is currently facing tremendous environmental pressures (Liao, 2018; Hang et al., 2019; Zhang et al., 2019a). The government has tackled these in various ways, such as by promoting the use of clean energy and introducing tough policies (Zhang et al., 2019c), and have achieved good results (Zhang and Li, 2018; Zhang et al., 2019b). However, these methods often overlook Chinese society's specific characteristics and pose their own challenges. The trends of social space segmentation and structural solidification make protecting the environment difficult. For this reason, we start from the perspective of social capital to try and find new ways to solve environmental governance.
The concept “social capital” was first used by sociologists. Specifically, Granovetter was the first to conceptualize social capital. According to the World Bank's Social Capital Initiative, social capital refers to collective actions taken by the government and civil society for the mutual benefit of an organization. Similarly, according to the Organization for Economic Cooperation and Development (OECD) (Healy and Côté, 2001), social capital is a network that promotes cooperation within and among groups. This network contains norms, values, and understandings that are recognized by group members. Unfortunately, the multifaceted nature of social capital has meant that it has a wide range of definitions in the academic literature, with no consensus on how it should be measured (Svendsen and Svendsen, 2009). In general, social capital can be understood as an association between individuals or groups. It refers to the social networks, reciprocal norms, and resulting trust that people get from their positions in the social structure.
Putnam et al. (1994) and Knack and Keefer (1997) all found that there is a positive correlation between social capital and economic phenomena. Similarly, Pretty and Ward (2001) argue that social capital can increase cooperation and participation within a given community, resulting in greater collectivism and increased willingness to protect natural resources. Jones (2009) claims that social capital is positively related to the achievement of environmental goals because social capital is associated with the individual perceived costs and benefits of environmental policies. Moreover, Halkos and Jones (2012) show that certain forms of social capital, especially social norms and trust, are positively related to people's willingness to pay for environmental taxes. With adequate social capital, citizens are more inclined to protect their environment because they expect their peers to do the same. Similar conclusions were found by Polyzou et al. (2011), Liu et al. (2014), and Czajkowski et al. (2015).
Bjørnskov and Méon (2015) point out that social capital may also influence environmental behaviors depending on the quality of the government, the institutional framework, and the degree of corruption. Fredriksson et al. (2004) found a negative correlation between corruption and the outcomes of energy policies in a sample of OECD countries. Grafton and Knowles (2016), however, found no significant causal relationship between various elements of social capital and several indicators of environmental quality. That being said, they did acknowledge the complexity of social capital and suggest that it needed further research. Peiró-Palomino and Picazo-Tadeo (2018) analyzed the relationship between social capital and environmental performance in the European Union and they failed to reject the hypothesis that social capital has no effect on environmental performance.
At present, the Chinese government is yet to realize the importance of social for solving environmental problems. Starting from the unique perspective of social capital, therefore, this paper addresses it with respect to the characteristics of Chinese society. Based on original first-hand data from the Chinese Social Survey (CSS), we calculate the elements of social capital that are more in line with China's national conditions. On the basis of these results, the effect of social capital on environmental performance is studied. The results of the research highlight the heterogeneity of social capital in different regions and demonstrate how different types of social capital contribute to environmental performance. The results can provide a more powerful and China-oriented basis for the formulation of future policies.
The remainder of the paper is organized as follows: section Methodology and Data describes the methodology and data, section Results and Discussion presents the results, and the final section offers a summary and a conclusion.
To measure environmental performance, we selected the method of data envelopment analysis (DEA). This method has been widely used in performance measurement and has proven effective for measuring energy efficiency (Blomberg et al., 2012; Wang et al., 2013, 2018; Wu et al., 2013; Blancard and Martin, 2014; Xue et al., 2015) and environmental performance (Zhou et al., 2006, 2007, 2008; Jin et al., 2014). However, real production processes often generate undesirable outputs; these should be reduced as much as possible in order to ensure optimal economic efficiency. DEA cannot handle this problem automatically. Tone (2001) established the slack-based measure (SBM) model as a way of addressing this limitation. Due to its ability to solve problems of input–output slack and avoid the influence of radial and oriented choice, the SBM model has become the most powerful and popular tool for evaluating efficiency. It has been successfully used to evaluate the performance of banks (Juo et al., 2012; Avkiran and Cai, 2014), airports (Yu, 2010), the environment (Na et al., 2017; Cecchini et al., 2018; Wang et al., 2019), and more. For this reason, the SBM model was chosen to measure environmental performance. The SBM model is shown below.
ρ represents the environmental performance; m represents the number of decision-making units (DMU); p represents the number of desirable outputs; q represents the number of undesirable outputs. The numerator in the ρ formula represents the ratio at which the amount actually invested by a given evaluation unit can be reduced relative to the average of the production front; that is, the input is invalid. The denominator indicates the actual output of the evaluated unit relative to the production. xij(i = 1, 2, …, m) represents the ith input indicator of DMUj; ydj(d = 1, 2, …, p) represents the dth desirable output indicator of DMUj; buj(u = 1, 2, …, q) denotes the undesirable output indicator of DMUj; represent the slack variable of the input, the desirable output, and the undesirable output.
We have selected the appropriate indicators and data sources based on this particular model. According to literature review (Zhou et al., 2006, 2007; Wang et al., 2013; Wu et al., 2013; Jin et al., 2014; Wang et al., 2019), we find that capital investment, labor input, social water consumption, energy consumption, GDP, carbon dioxide (CO2) emissions, industrial wastewater, and industrial emissions are the most used indicators. However, capital investment is somewhat relevant to social capital, so we didn't choose it as our indicators. Starting with the 12th Five-Year Plan, data from 2011 to 2017 was selected. As there are no data for the Autonomous Region of Tibet, the DMUs add up to a total of 30 provincial administrative units. Each DMU has three types of inputs, one type of expected output, and five types of undesired outputs. The inputs are as follows: labor input (x1j), total social water consumption (x2j), and energy consumption (x3j). The desirable output is GDP (y1j). The five undesirable outputs are carbon dioxide (CO2) emissions (b1j), total industrial wastewater discharges (b2j), industrial sulfur dioxide emissions (b3j), industrial nitrogen oxides emissions (b4j), and industrial smoke dust emissions (b5j). The data sources used are the China Statistical Yearbook and the China Energy Statistics Yearbook.
From a geographic perspective and a convenient picture display, we divided 30 DMUs into six regions: Northeast China (Heilongjiang, Jilin, and Liaoning), North China (Beijing, Tianjin, Hebei, Shanxi, and Inner Mongolia), East China (Shanghai, Jiangsu, Zhejiang, Jiangxi, Anhui, Fujian, and Shandong), Central South (Henan, Hubei, Hunan, Guangdong, Guangxi, and Hainan), Northwest China (Shaanxi, Gansu, Qinghai, Ningxia, and Xinjiang), and Southwest China (Chongqing, Sichuan, Guizhou, and Yunnan).
The calculation of CO2 emissions is based on the net calorific value and CO2 emission factor data of various energy sources issued by the 2006 IPCC Guidelines (Eggleston et al., 2006) for National Greenhouse Gas Inventories. These data are combined with the regional energy balance sheets of each province in order to ensure that the calculation results are more realistic. The following energy varieties should be included as comprehensively as possible: raw coal, clean coal, other coal washing, coke, coke oven gas, crude oil, gasoline, diesel, kerosene, fuel oil, petroleum coke, natural gas, liquefied petroleum gas, and other petroleum products. This is a total of 14 kinds of energy varieties. The specific calculation based on the IPCC Guidelines is as follows:
Where CO2 is the carbon dioxide emission of energy, Ci is the actual consumption of the ith type of energy source, NCVi is the net calorific value of the ith energy, CEFi is the carbon dioxide emission factor of the ith energy, and COFi is the carbon oxidation rate of the ith energy source. For ease of calculation, the COFi is taken as 1. The statistical description of input and output variables are shown in Table 1.
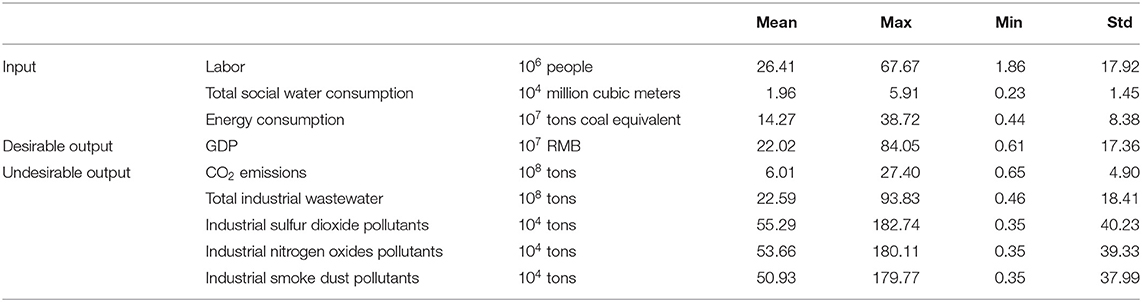
Table 1. Statistical description of input and output variables.
When it came to assessing the measurement of social capital, we referred to a wide range of studies. We found that scholars usually divide social capital into several categories in order to measure it. Based on their various categories and indicators (Putnam et al., 1994; Grootaert et al., 1999; Pretty and Ward, 2001; Villalonga-Olives and Kawachi, 2015) and considering China's special national conditions, we have identified three types of categories. These are innovative capital, structural capital, and relational capital. The evaluation indicators for each category are shown in Table 2.
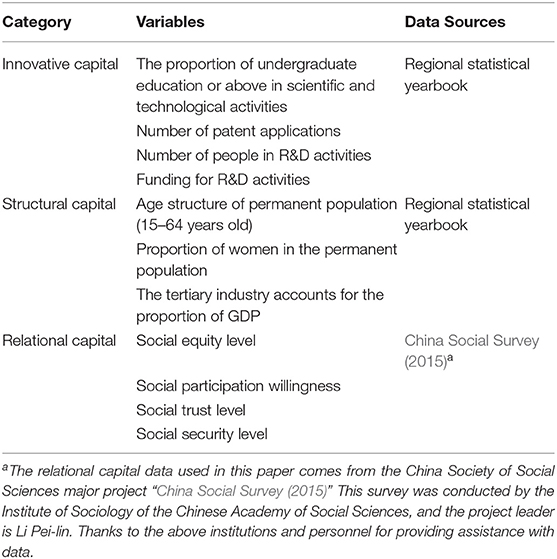
Table 2. The social capital indicator system.
Since CSS data are currently only available up until 2015, and as the Chinese government began to implement the Environmental Protection Law in 2015, when studying the effect of social capital on environmental performance, we only used data from 2015. This is to ensure that the research results are more instructive for future national policy developments.
We used the entropy method to process the data concerning social capital. In general, if the weight of an indicator is smaller, it demonstrates that the greater the degree of variation of the indicator value, the more information is provided, and the greater the role that this indicator should play in the comprehensive final evaluation.
The weights of the final calculated indicators are shown in Table A1. After measuring the index weights by using the entropy weight method, the data were synthesized into a comprehensive index.
According to the index system elaborated in section Methodology and Data, we collected and pre-organized the data before calculating the environmental performance level (EPL) of each province in 2011–2017 according to the SBM model. The final results are shown in Figure 1.
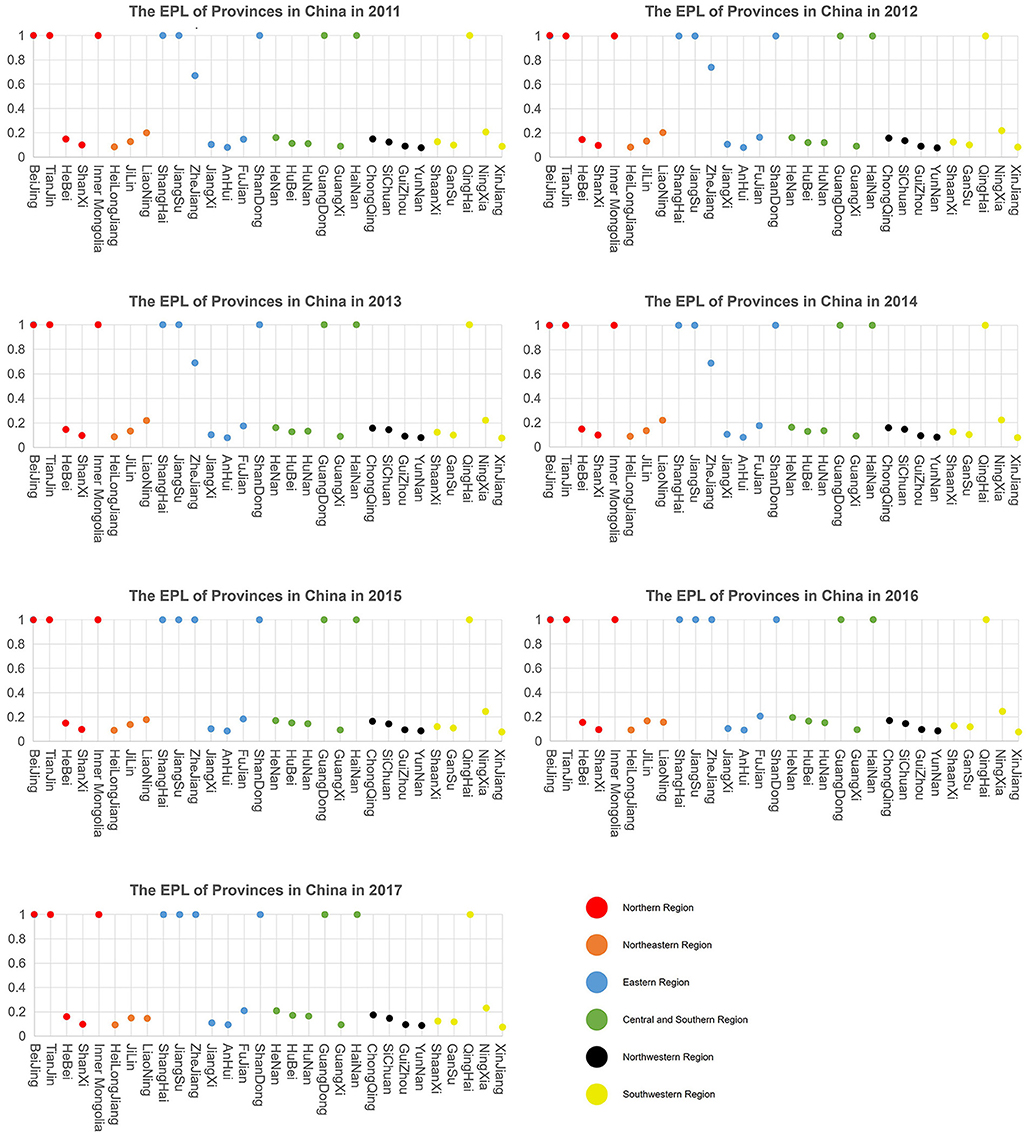
Figure 1. EPL of various provinces in China by year.
The above charts show the level of environmental performance in China's six major regions from 2011 to 2017. From the results of the EPL, it is not difficult to see that the best-performing provinces are Beijing, Tianjin, Shanghai, Jiangsu, Shandong, Guangdong, Inner Mongolia, Hainan, and Qinghai. Other provinces in these regions, as well as all the provinces in the Northeast and Southwest, have a performance level of <0.2. The most noteworthy province is Zhejiang, which has been technically effective since 2014. Our analysis suggests that the reason for this is related to Zhejiang Province's introduction of tough environmental regulations in early 2014.
It can also be seen from this analysis that the EPL of various provinces in China is improving year by year. Nonetheless, the eastern region still performs better than the central and western regions. Looking at these figures in more detail, it becomes clear that the EPL of the provinces other than those at the frontier are essentially not fluctuating. The EPL of the provinces in the northeastern regions has declined slightly in recent years, and the EPL of the provinces in other regions has increased slightly in recent years.
The final measurement results of social capital level (SCL) are shown in Figure 2. It can be seen from Figure 2 that the eastern coastal areas and the Beijing province have the highest levels of social capital. The overall trend is a gradual decrease in social capital from east to west. The province with the highest SCL in 2015 was Jiangsu.
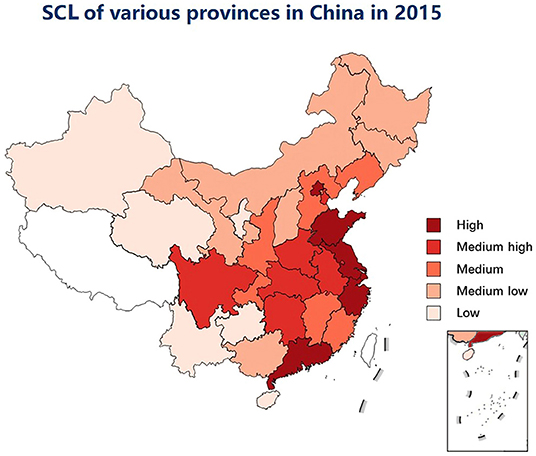
Figure 2. SCL of various provinces in China in 2015.
It can be seen from the above figure that the overall trend is for a high level of social capital in the east and a low level of social capital in the west. As far as the average level of the six regions is concerned, the social capital levels in the provinces of the eastern, northern, and central regions are heterogeneous. The heterogeneity in other regions is relatively small. From Table A2, we can see that the biggest gap between adjacent regions is Guangdong and Hainan in Central and South China. Guangdong ranks second whereas Hainan ranks second to the last. Both the northeast and northwest regions have very low levels of social capital.
In addition, by observing the SCL of Beijing-Tianjin-Hebei, the Yangtze River Delta, the Pearl River Delta, and the surrounding provinces, we can see that the deep red region of the Yangtze River Delta has the widest range. This means that, on average, it has the highest level of social capital. Therefore, we have reason to believe that the three provinces of Jiangsu, Zhejiang, and Shanghai have relatively good knock-on effects on their surrounding provinces.
If we look at the capital outcomes of the three categories separately, we note that the results of relational capital are interesting. It is not difficult to see from the bar chart below (Figure 3) that the relational capital levels of the regions with economies that are relatively more developed are lower. Xinjiang, for example, has the highest level of relational capital, whereas Beijing, Jiangsu, and Shanghai rank the bottom. We believe that this result is consistent with the current state of Chinese society.
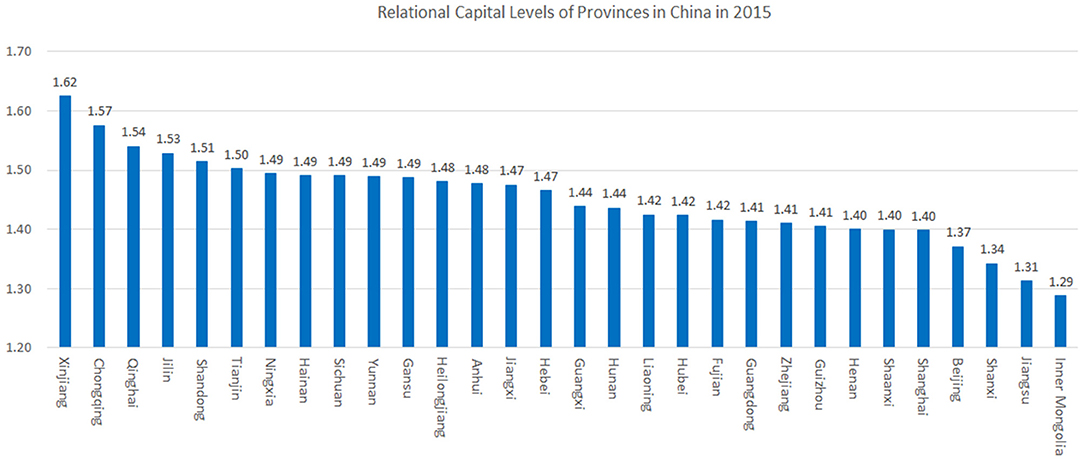
Figure 3. Relational capital levels of provinces in China in 2015.
In this regard, we speculate that the more developed the economy, the more atomized the people and the easier it is to be outside the social system. Furthermore, we speculate that this would lead to a decline of social relations capital and the emergence of a crisis of social trust. This, however, is not the main focus of this paper; the reasons for this phenomenon need further study.
To explore the effect of social capital on environmental performance, we first display the EPL and SCL of various provinces in China in 2015 on the maps that are shown in Figure 4. Comparing these two maps, we can see that the SCL and EPL are generally consistent. In other words, environmental performance is better in regions with higher social capital. There are, however, some provinces with abnormalities.
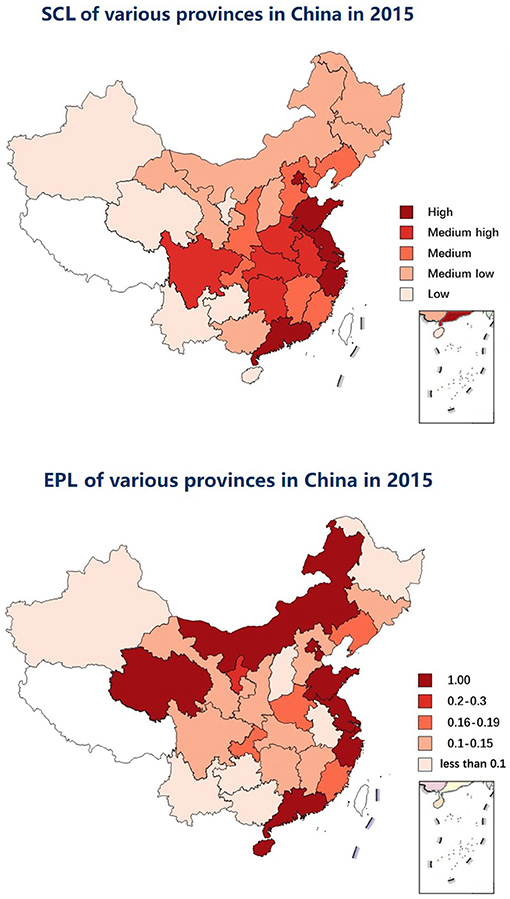
Figure 4. Maps of SCL and EPL in China in 2015.
The environmental performance and social capital levels of the six regions in 2015 are plotted in more detail on the scatter chart in Figure 5. From this, it can be seen that social capital and environmental performance are more consistent in the eastern and southwest regions. The other regions are less stable.
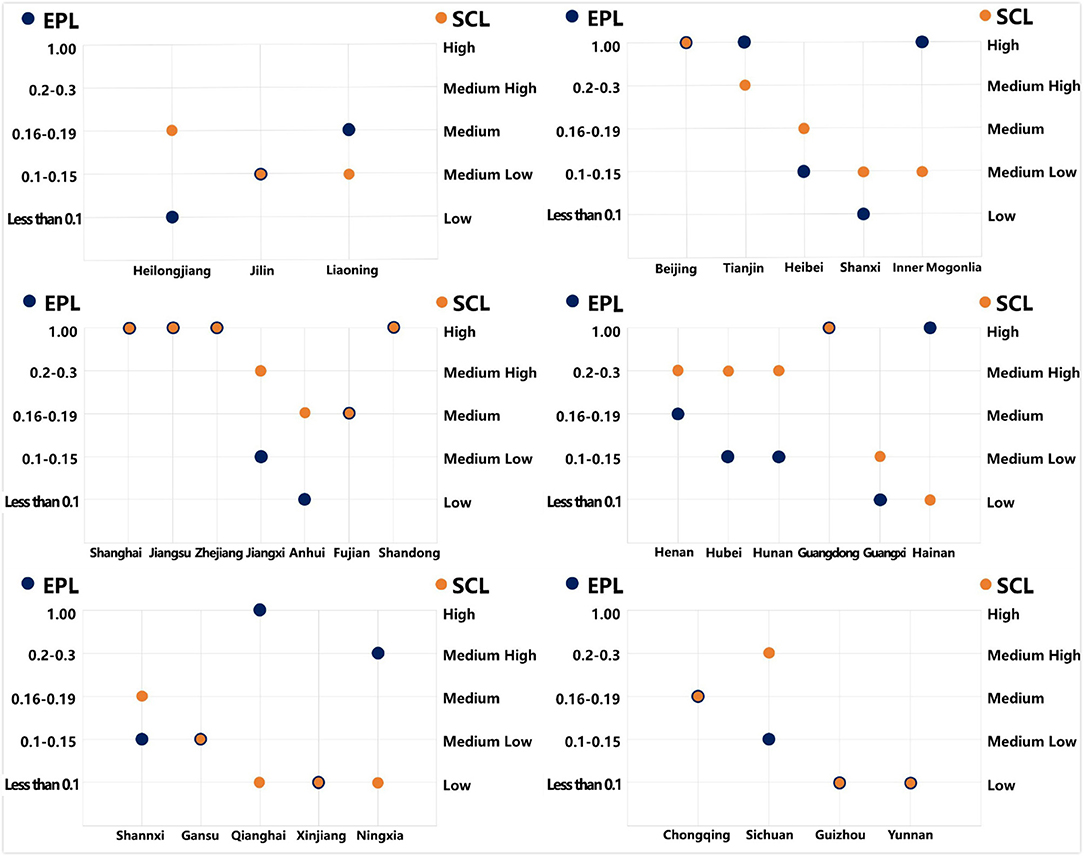
Figure 5. Scatter plot of SCL and EPL in China in 2015.
From the above two figures, we can easily see that social capital and environmental performance are related in general. We have adopted Probit regression of the binary discrete selection model to help us reflect the impact of social capital on environmental performance more accurately.
Firstly, it is important to take the particularity of the results of environmental performance into account: that is, the performance at the frontier is 1 and the performance at the frontier is very small (performance is <0.25). This makes the general regression model difficult to portray the impact of social capital on environmental performance accurately. For the case where the environmental performance of this paper is either 1 or very small, we approximate it as the selection problem. In other words, the performance is at the frontier and is not at the frontier; the binary discrete selection model is selected. The original model is shown below:
Yi represents the environmental performance level, Xi represents the social capital level, α is the drift, β is the slope, and μi is the error term.
The results of Probit regression are shown in Table 3.

Table 3. The estimation result of Probit regression.
From the above results, it can be seen that social capital has a significant effect on environmental performance. In areas with higher social capital, the environmental performance table is better. According to the Probit regression model, when the social capital of a province is known, the observations of the environmental performance of the province can be calculated. This observation highlights the possibility that the province's environmental performance is at the frontier.
Combined with the weights of the specific indicators obtained by the entropy method outlined in section Methodology and Data, it can be argued that structural capital in social capital contributes the most to environmental performance. This is followed first by relational capital and finally by innovation capital. The contribution of the tertiary industry to GDP is the largest contributing factor to structural capital. The indicator of social trust is the most relevant for relational capital.
The relatively unorthodox provinces are Inner Mongolia, Qinghai, Hainan, Anhui, and Ningxia. Inner Mongolia, Qinghai, Hainan, and Ningxia all have high levels of environmental performance and low levels of social capital. By multiplying the coefficients of three small indicators of innovation capital with the measurement model and the raw data of social capital for these four provinces, we can account for why the numerical results regarding social capital are so small. These three indicators are the number of patent applications, the number of people in R&D activities, and the funding for R&D activities. Anhui Province has high social capital, but a low environmental performance. This may be due to the fact that Anhui was affected by Jiangsu and Zhejiang; it received a certain degree of knock-on economic growth and also accepted the transfer of industrial enterprises. This resulted in more serious environmental pollution.
However, due to data sources, there are statistical yearbook data from various provinces in China and social capital data based on questionnaires published by CSS. In the data processing, we found that the statistical methods of the same indicator in the statistical yearbooks of different provinces are different. We try to select the original data of the same method when selecting the data. The questionnaires used to investigate social capital data have different ways of asking questions in different years, so the authenticity of the data will have an impact on the research results of this paper.
In response to the results, we believe that there are two ways to improve the levels of environmental performance.
Firstly, the proportion of the tertiary industry in GDP could be increased. The tertiary industry is a service industry, and its unique service functions promote the development of primary and secondary industries and the entire national economy. It also meets the needs of the nation for a better life in the future. For this reason, it is recommended that the government continue to support the development of the tertiary industry and formulate a more favorable policy environment. They could provide tax incentives, loan concessions, and talent introduction support.
In addition, according to the results that the Yangtze River Delta region has the best radiation effect, the government should strengthen economic cooperation among provinces to transform it into an intensive development model of “low consumption, low pollution and high output.” At the same time, “the proportion of undergraduate education or above in scientific and technological activities” is the most important indicator of innovation capital. The government should vigorously develop higher education and cultivate high-quality talents. Increase investment in research funding and accelerate the flow and spread of energy-saving and emission reduction technologies between regions.
Secondly, they could increase the level of social trust. Bjørnskov (2006) finds that social polarization in the form of income inequality reduces social trust. Bjørnskov (2009) also argues that social trust affects both schooling and the rule of law directly. As demonstrated by the CSS questionnaire, social trust is mainly related to interpersonal relationships, the degree of government corruption, and the degree of citizenship. Social trust is related not only to culture and social systems, but also to individual objective factors such as age and education level.
From the perspective of macroeconomic policy, the government should strive to build a stable social norm and a good social trust system. It should also promote clean government and reduce corruption. It should promote equal opportunities, fair education, and fair income distribution. From a micro-psychological perspective, individuals should also give full play to their subjective initiative. They should actively participate in social activities, uphold the values of equality, and offer mutual assistance. They should be good neighbors and work to create a healthy and harmonious atmosphere.
This paper has taken the unique characteristics of Chinese society into account. It has looked at both the human society and the relationship society, and it has focused on the effect of China's provincial social capital on environmental performance.
In the first stage, we used the SBM model to measure the environmental performance level of the 2011–2017 panel data from 30 provinces in China. The results showed that the environmental performance levels of the more developed regions (such as Beijing, Shanghai, Jiangsu, and others) were significantly higher than the rest. As a whole, it can be seen that the environmental performance levels of various provinces in China are improving year by year, although the eastern region still performs better than both the central and the western region.
In the second stage of the research, we introduced the concept of social capital and divided it into three categories: innovation capital, structural capital, and relational capital. We used the Probit regression model to explore the effect of social capital on environmental performance. From the results, it is clear that the effect of social capital on environmental performance is significant. Structural capital has the most obvious impact on environmental performance. This is followed by relational capital. It was further found that the proportion of the tertiary industry in GDP and the level of social trust are the factors that contribute most to the rate of structural capital and relational capital, respectively.
Based on research results, we put forward two suggestions: increasing the proportion of the tertiary industry in GDP and increasing the level of social trust. We also put forward macro and micro specific measures for the two proposals. Overall, the results of this paper offer a new means for assessing the effect of social capital on environmental performance. However, the results also involve some limitations: whether or not there is a non-linear relationship between social capital and environmental performance, and how the economic meaning is represented at the inflection point is worth studying.
All datasets generated for this study are included in the article/supplementary material.
QW designed the paper framework. TL wrote the manuscript. DZ provided policy recommendations and data.
The authors declare that the research was conducted in the absence of any commercial or financial relationships that could be construed as a potential conflict of interest.
The handling editor declared a past co-authorship with one of the authors QW.
The authors are grateful to the financial support from the National Natural Science Foundation of China (nos. 71834003, 71922013, and 71573186) and the Fundamental Research Funds for the Central Universities (no. NW2018002).
Avkiran, N. K., and Cai, L. (2014). Identifying distress among banks prior to a major crisis using non-oriented super-SBM. Annu. Open Res. 217, 31–53. doi: 10.1007/s10479-014-1568-8
Bjørnskov, C. (2006). Determinants of generalized trust: a cross-country comparison. Public Choice 130, 1–21. doi: 10.1007/s11127-006-9069-1
Bjørnskov, C. (2009). Social trust and the growth of schooling. Econ. Educ. Rev. 28, 249–257. doi: 10.1016/j.econedurev.2006.09.013
Bjørnskov, C., and Méon, P.-G. (2015). The productivity of trust. World Dev. 70, 317–331. doi: 10.1016/j.worlddev.2015.01.015
Blancard, S., and Martin, E. (2014). Energy efficiency measurement in agriculture with imprecise energy content information. Energy Policy 66, 198–208. doi: 10.1016/j.enpol.2013.10.071
Blomberg, J., Henriksson, E., and Lundmark, R. (2012). Energy efficiency and policy in Swedish pulp and paper mills: a data envelopment analysis approach. Energy Policy 42, 569–579. doi: 10.1016/j.enpol.2011.12.026
Cecchini, L., Venanzi, S., Pierri, A., and Chiorri, M. (2018). Environmental efficiency analysis and estimation of CO2 abatement costs in dairy cattle farms in Umbria (Italy): a SBM-DEA model with undesirable output. J. Clean. Prod. 197, 895–907. doi: 10.1016/j.jclepro.2018.06.165
Czajkowski, M., Hanley, N., and Nyborg, K. (2015). Social norms, morals and self-interest as determinants of pro-environment behaviours: the case of household recycling. Environ. Resour. Econ. 66, 647–670. doi: 10.1007/s10640-015-9964-3
Eggleston, S., Buendia, L., Miwa, K., Ngara, T., and Tanabe, K., (eds.). (2006). “Energy,” in 2006 IPCC guidelines for national greenhouse gas inventories. Vol. 2 (Hayama: Institute for Global Environmental Strategies), 2.6–2.23.
Fredriksson, P. G., Vollebergh, H. R. J., and Dijkgraaf, E. (2004). Corruption and energy efficiency in OECD countries: theory and evidence. J. Environ. Econ. Manage. 47, 207–231. doi: 10.1016/j.jeem.2003.08.001
Grafton, R. Q., and Knowles, S. (2016). Social capital and national environmental performance: a cross-sectional analysis. J. Environ. Dev. 13, 336–370. doi: 10.1177/1070496504271417
Grootaert, C., Oh, G.-T., and Swamy, A. V. (1999). The Local Level Institutions Study: Social Capital and Development Outcomes in Burkina Faso, Vol. 7. Washington, DC: World Bank, Social Development Family, Environmentally and Socially Sustainable Development Network, 1–54.
Halkos, G. E., and Jones, N. (2012). Modeling the effect of social factors on improving biodiversity protection. Ecol. Econ. 78, 90–99. doi: 10.1016/j.ecolecon.2012.04.003
Hang, Y., Wang, Q., Wang, Y., Su, B., and Zhou, D. (2019). Industrial SO2 emissions treatment in China: a temporal-spatial whole process decomposition analysis. J. Environ. Manage. 243, 419–434. doi: 10.1016/j.jenvman.2019.05.025
Healy, T., and Côté, S. (2001). The Well-Being of Nations: The Role of Human and Social Capital. Education and Skills, ERIC.
Jin, J., Zhou, D., and Zhou, P. (2014). Measuring environmental performance with stochastic environmental DEA: the case of APEC economies. Econ. Model. 38, 80–86. doi: 10.1016/j.econmod.2013.12.017
Jones, N. (2009). Investigating the influence of social costs and benefits of environmental policies through social capital theory. Policy Sci. 43, 229–244. doi: 10.1007/s11077-009-9107-1
Juo, J.-C., Fu, T.-T., and Yu, M.-M. (2012). Non-oriented slack-based decompositions of profit change with an application to Taiwanese banking. Omega 40, 550–561. doi: 10.1016/j.omega.2011.11.002
Knack, S., and Keefer, P. (1997). Does social capital have an economic payoff? A cross-country investigation. Q. J. Econ. 112, 1251–1288. doi: 10.1162/003355300555475
Liao, X. (2018). Public appeal, environmental regulation and green investment: evidence from China. Energy Policy 119, 554–562. doi: 10.1016/j.enpol.2018.05.020
Liu, J., Qu, H., Huang, D., Chen, G., Yue, X., Zhao, X., et al. (2014). The role of social capital in encouraging residents' pro-environmental behaviors in community-based ecotourism. Tourism Manage. 41, 190–201. doi: 10.1016/j.tourman.2013.08.016
Na, J.-H., Choi, A. Y., Ji, J., and Zhang, D. (2017). Environmental efficiency analysis of Chinese container ports with CO 2 emissions: an inseparable input-output SBM model. J. Trans. Geogr. 65, 13–24. doi: 10.1016/j.jtrangeo.2017.10.001
Peiró-Palomino, J., and Picazo-Tadeo, A. J. (2018). Is social capital green? Cultural features and environmental performance in the European union. Environ. Res. Econ. 72, 795–822. doi: 10.1007/s10640-018-0226-z
Polyzou, E., Jones, N., Evangelinos, K. I., and Halvadakis, C. P. (2011). Willingness to pay for drinking water quality improvement and the influence of social capital. J. Socio. Econ. 40, 74–80. doi: 10.1016/j.socec.2010.06.010
Pretty, J., and Ward, H. (2001). Social capital and the environment. World Dev. 29, 209–227. doi: 10.1016/S0305-750X(00)00098-X
Putnam, R. D., Leonardi, R., and Nanetti, R. Y. (1994). Making Democracy Work: Civic Traditions in Modern. New Jersey, NJ: Princeton University Press. doi: 10.1515/9781400820740
Svendsen, G. T., and Svendsen, G. L. H. (2009). Handbook Of Social Capital: The Troika of Sociology, Political Science and Economics. Cheltenham: Edward Elgar Publishing.
Tone, K. (2001). A slacks-based measure of efficiency in data envelopment analysis. Eur. J. Oper. Res. 130, 498–509. doi: 10.1016/S0377-2217(99)00407-5
Villalonga-Olives, E., and Kawachi, I. (2015). The measurement of social capital. Gaceta Sanitaria 29, 62–64. doi: 10.1016/j.gaceta.2014.09.006
Wang, K., Wu, M., Sun, Y., Shi, X., Sun, A., and Zhang, P. (2019). Resource abundance, industrial structure, and regional carbon emissions efficiency in China. Res. Policy 60, 203–214. doi: 10.1016/j.resourpol.2019.01.001
Wang, Q., Hang, Y., Su, B., and Zhou, P. (2018). Contributions to sector-level carbon intensity change: an integrated decomposition analysis. Energy Econ. 70, 12–25. doi: 10.1016/j.eneco.2017.12.014
Wang, Q., Zhao, Z., Zhou, P., and Zhou, D. (2013). Energy efficiency and production technology heterogeneity in China: a meta-frontier DEA approach. Econ. Model. 35, 283–289. doi: 10.1016/j.econmod.2013.07.017
Wu, A.-H., Cao, Y.-Y., and Liu, B. (2013). Energy efficiency evaluation for regions in China: an application of DEA and Malmquist indices. Energy Efficien. 7, 429–439. doi: 10.1007/s12053-013-9232-8
Xue, X., Wu, H., Zhang, X., Dai, J., and Su, C. (2015). Measuring energy consumption efficiency of the construction industry: the case of China. J. Clean. Prod. 107, 509–515. doi: 10.1016/j.jclepro.2014.04.082
Yu, M.-M. (2010). Assessment of airport performance using the SBM-NDEA model. Omega 38, 440–452. doi: 10.1016/j.omega.2009.11.003
Zhang, M., and Li, H. (2018). New evolutionary game model of the regional governance of haze pollution in China. Appl. Math. Model. 63, 577–590. doi: 10.1016/j.apm.2018.07.008
Zhang, M., Li, H., Song, Y., and Li, C. (2019a). Study on the heterogeneous government synergistic governance game of haze in China. J. Environ. Manage. 248:109318. doi: 10.1016/j.jenvman.2019.109318
Zhang, M., Li, H., Xue, L., and Wang, W. (2019b). Using three-sided dynamic game model to study regional cooperative governance of haze pollution in China from a government heterogeneity perspective. Sci. Total Environ. 694:133559. doi: 10.1016/j.scitotenv.2019.07.365
Zhang, M., Liu, X., Ding, Y., and Wang, W. (2019c). How does environmental regulation affect haze pollution governance?—An empirical test based on Chinese provincial panel data. Sci. Total Environ. 695:133905. doi: 10.1016/j.scitotenv.2019.133905
Zhou, P., Ang, B. W., and Poh, K.-L. (2008). A survey of data envelopment analysis in energy and environmental studies. Eur. J. Oper. Res. 189, 1–18. doi: 10.1016/j.ejor.2007.04.042
Zhou, P., Ang, B. W., and Poh, K. L. (2006). Slacks-based efficiency measures for modeling environmental performance. Ecol. Econ. 60, 111–118. doi: 10.1016/j.ecolecon.2005.12.001
Zhou, P., Poh, K. L., and Ang, B. W. (2007). A non-radial DEA approach to measuring environmental performance. Eur. J. Oper. Res. 178, 1–9. doi: 10.1016/j.ejor.2006.04.038
China Social Survey (2015). Institute of Sociology, Chinese Academy of Social Sciences. Available online at: http://css.cssn.cn/css_sy/zlysj/lnsj/201706/t20170615_3551582.html
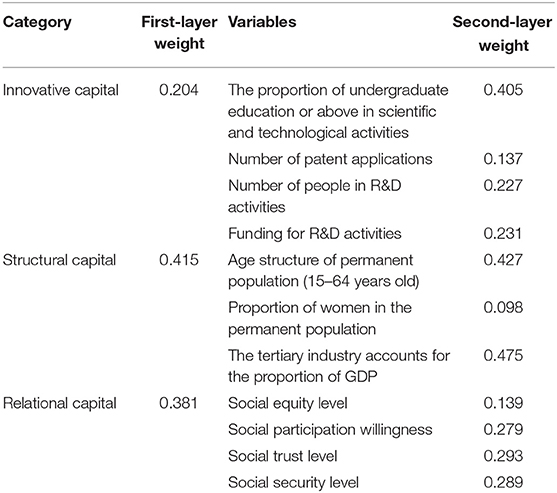
Table A1. The weight of the social capital indicator system.
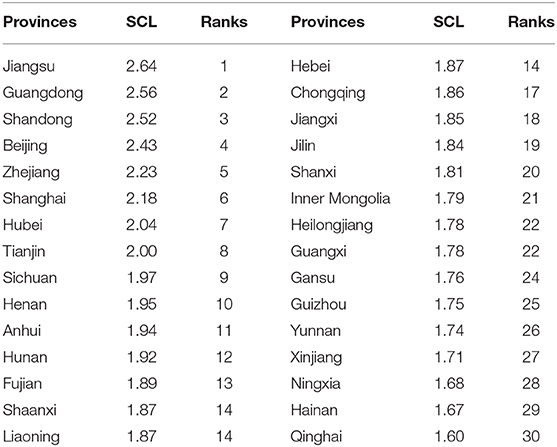
Table A2. The SCL results of the provinces in China in 2015.
Keywords: social capital, environmental performance, data envelopment analysis, China, innovative capital, structural capital, relational capital
Citation: Zhou D, Liu T and Wang Q (2020) How Social Capital Affects Environmental Performance in China. Front. Energy Res. 7:160. doi: 10.3389/fenrg.2019.00160
Received: 21 October 2019; Accepted: 11 December 2019;
Published: 21 January 2020.
Edited by:
Qiang Ji, Chinese Academy of Sciences, ChinaReviewed by:
Ming Zhang, China University of Mining and Technology, ChinaCopyright © 2020 Zhou, Liu and Wang. This is an open-access article distributed under the terms of the Creative Commons Attribution License (CC BY). The use, distribution or reproduction in other forums is permitted, provided the original author(s) and the copyright owner(s) are credited and that the original publication in this journal is cited, in accordance with accepted academic practice. No use, distribution or reproduction is permitted which does not comply with these terms.
*Correspondence: Qunwei Wang, d3F3MDMwNUAxMjYuY29t
Disclaimer: All claims expressed in this article are solely those of the authors and do not necessarily represent those of their affiliated organizations, or those of the publisher, the editors and the reviewers. Any product that may be evaluated in this article or claim that may be made by its manufacturer is not guaranteed or endorsed by the publisher.
Research integrity at Frontiers
Learn more about the work of our research integrity team to safeguard the quality of each article we publish.