 Zhenhua Liu
 Zhihua Ding
 Pengxiang Zhai3*
 Tao Lv
- 1School of Management, China University of Mining and Technology, Xuzhou, China
- 2Infrastructure and Environmental Systems, University of North Carolina at Charlotte, Charlotte, NC, United States
- 3Shenzhen Audencia Business School, Shenzhen University, Shenzhen, China
The China's crude oil futures market (INE market), as it was first launched in late March of 2018, quickly draws much attention from global investors. In reference to the high frequency data, this research explores how well this new product reacts efficiently to international influences and to what extent it can be integrated with traditional benchmarks, such as WTI and Brent. The multivariate GARCH models are employed to capture the cross-market time-varying correlations, return and volatility spillovers, which are modified by incorporating the detected structural breaks in the return dynamics to improve the accuracy of model estimates. Empirical results indicate a strong integration of INE market with these international benchmarks. A high but time-varying correlation is observed with recurring highs around 0.7. Spillover effects have included significant bidirectional return and volatility spillovers between the INE and the international benchmark markets. Secondly, INE market appears to interact better with the Brent market than with the WTI market. Thirdly, structural breaks can influence correlations, the portfolio weights and hedge ratios. Lastly, the correlation between crude oil futures markets decreases significantly during the periods when structural breaks caused by economic and/or geopolitical events are identified. These findings have important implications in policy makings and economic decisions on portfolio management and hedging strategies.
Introduction
Crude oil is not only a crucial source of energy resource for economic growth and national security, but also one of the most valuable assets traded in the international commodity markets (Ding et al., 2017; Ma et al., 2019; Xu et al., 2019). In retrospect, reference benchmarks for crude oil prices have been dominated by the West Texas Intermediate (WTI) and the European Brent markets (Mensi et al., 2014). The lack of an effective benchmark market in Asia is responsible for the well-known “Asian premium” (AlKathiri et al., 2017; Shen et al., 2018). Although China has become the largest oil importer and the seventh major producer of crude oil in the world1, the Chinese crude oil market can only passively follow the pricing mechanisms of these international markets and cannot reliably reflect its own supply and demand information in domestic markets (Shi and Sun, 2017). Consequently, the RMB-denominated crude oil futures of China was launched in the Shanghai International Energy Exchange (INE) in late March of 2018. As the first international futures product induced in China, the INE futures is traded to overseas investors and has attracted much attention by overseas institutions and investors. The success of this international product will depend on how well it will integrate with existing international crude oil futures markets. The present paper aims to model the Chinese newly introduced crude oil futures under global influence and assess the extent to which this product integrates with international benchmark markets, namely WTI and Brent.
The extent to which the Chinese crude oil futures market links to the international markets has great implications for the domestic energy security and overseas investors. China has actually surpassed the U.S. to become the largest net importer of crude oil in the world (EIA, 2018). The country's oil import dependency is expected to rise (Wang and Wei, 2016; Wang et al., 2017; Cheng et al., 2019), implying that China's oil market and oil security may be vulnerable to fluctuations in oil prices from the international oil markets. If the crude oil futures market in China is highly integrated into the international benchmark markets, the expected returns of China's crude oil futures will mainly be determined by the world's undiversifiable risk which further deteriorate energy security concerns over the country. Meanwhile, the conditions of oil demand and supply in China will likely substantially influence the international oil markets (Li and Leung, 2011). Given other things remaining unchanged, China will be more influential as the degree of integration into the international markets increases. If, on the contrary, the crude oil futures market in China is only weakly integrated into the world markets, international economic conditions will have less influence on the Chinese market. If the returns of the Chinese market do not move together with those of international markets, then global investors may benefit from the reduction of diversifiable risk (i.e., portfolio risk) by diversification that includes the Chinese crude oil futures. Moreover, the level of integration could insightfully reflect the position and power of China's newly introduced crude oil futures market in the global oil market.
Furthermore, the success of China's crude oil futures has important implications for introduction of additional advanced financial derivative products. International institutions are interested in such opportunities in China's opening financial markets (Shi et al., 2018). This is a critical issue for investors to realize potential gains from diversifying their international portfolio, and for policy makers to make proper market policies and deal with contagion risks as a result of international shock transmissions (Jouini, 2015). In the foreseeable future, Shanghai crude oil futures are likely to remain as the only financial product on which investors can hedge against or speculate on China's crude oil market. The interactions between the Chinese and the international crude oil futures markets may directly influence the investment decisions and profitability of those market participants who heavily rely on the signs and directions of information flow.
Research on the integration among oil markets in the world dates back to the 1980s, Adelman (1984) argued that the oil markets around the world were highly integrated and thus there is a global market for crude oil like “one great pool.” This globalization hypothesis indicates that changes in oil prices in a regional oil market will spread to the other markets, which has been verified in subsequent empirical studies (see Rodriguez and Williams, 1993; Hammoudeh et al., 2008; Fattouh, 2010; Ji and Fan, 2016; Kuck and Schweikert, 2017; Klein, 2018, among others). Although there is no unanimously agreeable definition of market integration, following Bhar and Nikolova (2009), markets are considered to be integrated when assets in different locations or markets but with identical risk have the same expected return. Related to this definition, this paper focuses on two types of integration: the commonality of oil return movements over time among different markets and cross-market information transmission that measures through return and volatility spillovers.
In this paper, using intraday 5 min data for April 26, 2018, to July 23, 2019, we investigate the level of integration of the China's crude oil futures market with international benchmark markets by examining their time-varying correlations, return and volatility spillovers, with the VAR-DCC-GARCH and the VAR-BEKK-GARCH models. The DCC model measures the variation of the conditional correlations over time. The BEKK model captures the effects of past innovations and variance on the current conditional variance as well as the cross-market shocks and volatility transmission. The information obtained from these models can be used to computing optimal asset allocation and developing global hedging policies. In addition, the Bai and Perron (2003) test is applied to detect structural breaks in the crude oil futures return series, the detected breaks are then incorporated into the VAR-GARCH-type models to improve the accuracy of model estimates and examine the influence of structural breaks on cross-market relationships.
In this way, the contributions of our study are 3-fold. First, to the best of our knowledge, it is the first study to explore time-varying correlation and information transmission between China's newly crude oil futures market and the international markets. Although some stylized facts of the Chinese new crude oil futures have been reported in a pioneer work by Ji and Zhang (2018), they did not emphasize the cross-market relationships. Our empirical results reveal a strong evidence for integration of China's crude oil futures market with international benchmarks. For each pair, we find a high but time-varying correlations with recurring highs around 0.7 within the sample period. In particular, the INE market integrates better with the Brent market than with the WTI market. Although international benchmark markets play a dominate role in cross-market information transmission, the shocks of the INE market will have an impact on the volatility of the international markets.
Second, unlike previous studies using monthly data (Weiner, 1991; Rodriguez and Williams, 1993), weekly data (Reboredo, 2011; Liu et al., 2013; Ji and Fan, 2016; Kuck and Schweikert, 2017), or daily data (Zhang and Wang, 2014; Chan and Woo, 2015; Jiang et al., 2017; Scheitrum et al., 2018), we employ intraday data in examining correlation and information transmission among crude oil futures markets. In the financial market, the discrete collection of data will inevitably result in a loss of information. Since the crude oil market has become an important part of the global financial market, it has strong liquidity and can reflect more new information according to price dynamics within minutes (Liu and Wan, 2012; Elder et al., 2013; Wang et al., 2019). Studies based on low-frequency data cannot incorporate information implied in intraday price movements (Phan et al., 2016). Moreover, the economic benefits of using intraday data in modeling volatility and analyzing cross-market relationships among different financial markets have been explained in the literature (Wu et al., 2005; Rittler, 2012; Yang et al., 2012; Huo and Ahmed, 2018).
Third, we will detect structural breaks in crude oil futures price movements and incorporate them into the analytical procedures to improve the accuracy of volatility estimates. It has been acknowledged that certain economic and/or geopolitical events may cause structural changes in crude oil price dynamics (Zhang, 2008; Broadstock et al., 2016; Liu et al., 2019). The persistence of the volatility may be overestimated when the structural breaks are ignored (Lamoureux and Lastrapes, 1990). Several studies give further theoretical background and empirical evidences, documenting that structural breaks should be considered when modeling financial market volatility (see Mikosch and Stărică, 2004; Charles and Darné, 2014; Ewing and Malik, 2017, among others). In this study, structural breaks are found to influence the performance of the modeling estimates, and further have an impact on cross-market correlations, the portfolio weights and hedge ratios.
The remainder of this paper is structured as follows. The econometric methodology in this paper is explained in section related literature. Then section Methodology reviews related literature. Section Data Description describes the data and reports preliminary analyses. The empirical results are presented in section Empirical Results and section Discussion and Economic Significance of the Results includes the discussion and economic significance of the results. Section Conclusions and Policy Implications provides the concluding remarks and policy implications.
Related Literature
Oil Market Integration
The question whether different crude oil markets located in various countries or regions are integrated has long been focused on in energy related literature. This can date back to the 1980s, when Adelman (1984) argued that the oil market around the world were highly integrated and thus there is a global market for crude oil like “one great pool.” By contrast, Weiner (1991) supports the regionalization hypothesis across oil markets, claiming that the movements of oil prices depend on the local factors, e.g., government's energy policy and regional shocks and thus oil prices vary in an independent way.
More modern studies provide empirical evidence in favor of the assumption articulated by Adelman (1984) that oil markets in the world behave in a similar way and can be seen as one common market. “One great pool” hypothesis is also supported by Rodriguez and Williams (1993) and Hammoudeh et al. (2008). Using weekly data of crude oil spot prices for 24 major producers and consumers around the world, Ji and Fan (2016) further verify that the global crude oil markets are integrated. In a recent study, Kuck and Schweikert (2017) investigate long-term equilibrium relationships across five major crude oil spot prices, namely WTI, Brent, Bonny Light, Dubai, and Tapis, from 1987 to 2015. They find strong evidences to support that the crude oil markets are globally integrated, and the relationship between crude oil markets changes dynamically over time. Klein (2018) surveys the interconnectedness of WTI and Brent markets on different resolutions of price movements. Long-term movements of WTI and Brent confirm “one-great-pool” hypothesis.
The increasing degree of integration of global crude oil futures markets enable information transmission across markets that can be captured by return and variance spillovers. Lin and Tamvakis (2001) investigate variance spillovers across crude oil futures in New York Mercantile Exchange and London's International Petroleum Exchange, the authors find the existence of substantial spillover effects when both markets are traded simultaneously. Similarly, Kang et al. (2011) explore information transmission and volatility spillover between WTI and Brent market. Chang et al. (2010) reveal variance spillovers and asymmetric effects on conditional volatilities for most of the world oil markets. Magkonis and Tsouknidis (2017) find significant spillover effects across commodities based on petroleum and among their spot-future markets variances. As China has become the leading importer of crude oil in the world, its oil import dependence continues to rise. The interaction between Chinese and the international crude oil markets has recently attracted more attention in the literature. Li and Leung (2011) and Song and Li (2015) show that China's oil market is integrated into the international oil market. Liu et al. (2013) investigate volatility spillovers between China's crude oil spot price and four major crude oil spot prices in the world market from 2001 to 2011 with weekly data, their empirical results provide evidence for unidirectional risk spillover from the international benchmark markets to the oil market in China. The authors attribute the dominance of international benchmark markets over domestic market to the absence of China's crude oil futures market.
Intraday Periodicity
The ubiquitous intraday periodicity in the return volatility in financial markets may exert a significant influence in the statistical features of high-frequency returns (Andersen and Bollerslev, 1997). This issue can be addressed by standardizing the return series through the average absolute returns as well as the flexible Fourier form (FFF) first proposed by Andersen and Bollerslev (1997)2. Indeed, modern research draws attention to employ the framework combining high frequency data and GARCH-type models to analyze volatility spillovers across different financial markets (see Rittler, 2012; Yang et al., 2012; Nishimura et al., 2015; Huo and Ahmed, 2018, among others). In a pioneer work, Ji and Zhang (2018) find that intraday periodicity indeed exists in high-frequency returns of China's crude oil futures, which is described as a multi-U-shape pattern. Thus, it is necessary to take account of intraday periodicity in order to reveal the complex intraday return dynamics across oil futures markets.
Structural Breaks
Lamoureux and Lastrapes (1990) prove that, the volatility persistence obtained from the standard GARCH model may be overestimated if the structural breaks are ignored. Mikosch and Stărică (2004) provide further theoretical explanations that structural breaks should be considered when modeling financial market volatility, which has been verified by following empirical research (see Stărică and Granger, 2005; Charles and Darné, 2014; Ewing and Malik, 2017, among others). In recent studies, Lee et al. (2010), Ewing and Malik (2017), and Liu et al. (2019) reveal that certain economic and/or geopolitical events may cause structural changes in crude oil dynamics. Although some studies have considered structural changes in analyzing oil markets, these studies use structural breaks only as the basis for dividing the sample periods; they do not incorporate structural breaks into the used empirical models (Gülen, 1999; Chen et al., 2015; Ji and Fan, 2015). One exception is Kang et al. (2011), who examine the volatility spillover between WTI and Brent by using a bi-variate GARCH model with and without dummies accounting for structural changes. The authors conclude that the directions of information flows and volatility spillovers across crude oil markets may be distorted if structural changes are ignored. In the GARCH-type model, the conditional variance relies on the estimates of conditional mean process. Unlike Kang et al. (2011) considering structural changes in the conditional variance estimates, in a recent study, Tule et al. (2017) endogenously and sequentially detect structural breaks in return series with Bai and Perron (2003) test and modify the VARMA-AGARCH model by incorporating break points into conditional mean equation, to investigate information transmission between world oil markets and the sovereign bond market of Nigerian. Their results indicate that volatility spillover between markets is sensitive to structural breaks.
Methodology
The purpose of this study is to examine the time-varying correlations and spillover effects between China's crude oil futures market and international benchmark markets. The research framework includes (a) detection of structural breaks in the crude oil futures return series using the Bai and Perron (2003) test, (b) inclusion of structural breaks as dummy variables into the mean equation of the VAR model to determine the cross-market return spillovers, and (c) use of DCC-GARCH and BEKK-GARCH models to calculate the dynamic conditional correlations and volatility spillovers between the crude oil futures markets. Although the VAR model can reasonably estimate return spillovers, incorporating structure breaks into the VAR model can help improve the estimates of volatility.
Structural Break Test
Ignoring structural breaks in the financial time series may lead to bias in the estimation of the GARCH model due to overestimates of volatility persistence (Lamoureux and Lastrapes, 1990; Mikosch and Stărică, 2004; Charles and Darné, 2014; Tule et al., 2017). Several methods are available to detect structural breakpoints in financial time series, such as the Chow test (Chow, 1960), the cumulative sum (CUSUM) test (Brown et al., 1975), and the Bai and Perron (2003) test. However, the Chow test requires a priori knowledge of the exact data points of the structural breaks (McLeod and Haughton, 2018; Taghizadeh-Hesary et al., 2019). The CUSUM test cannot provide information on the number of breakpoints and their corresponding dates (Mensi et al., 2016). Therefore, the Bai and Perron (2003) test is employed in this paper. This test can detect multiple breakpoints in a time series based on least squares techniques and endogenously locate the date on which a breakpoint occurred. If the number of structural breakpoints detected is m, the full sample period can be divided into m + 1 regimes. This test can be expressed by the following linear regression equation:
In Equation (1), yt denotes the dependent variable at time t; zt is a constant term; φt is the independent variable; δj and γ are the corresponding coefficients; and ϵt is the disturbance at time t. T1, ⋯ , Tm are indices that represent the break points, which by assumption are unknown. In this study, we use the sequential test developed by Bai and Perron (2003).
VAR Model for the Conditional Mean Specification
The VAR model can be used to forecast interconnected time series systems, analyze the dynamic shocks of random disturbances on variable systems, and assess the impact of economic shocks or events on economic variables (Zhang and Sun, 2016). In this study, we use the VAR model to examine the return spillover between crude oil futures markets. We choose the VAR (1) model based on the principle of minimum Akaike information criterion (AIC) values. The bivariate VAR model with structural break dummy variables is shown in Equations (2) and (3).
where and are the logarithmic returns of China's crude oil futures price (INE) and the international crude oil futures prices (WTI and Brent), respectively, calculated by ; Pt is the closing price of each crude oil futures market at time t; μc and μg are the conditional mean series; and ac and ag can measure the return spillover of each market on their own, whereas bc and bg measure the return spillover across markets. and are the residual series of the VAR (1) model. p and q, respectively, represent the number of structural breakpoints in INE return and WTI (Brent) return series; Di(i = p, q) denote the dummy variables corresponding to structural breaks, in line with Tule et al. (2017), and Di = 1 if t ≥ break dates; otherwise, Di = 0.
MGARCH Models for the Conditional Variance Specification
Two multivariate GARCH-type models are employed to examine the dynamic correlation and volatility spillovers between different crude oil futures markets. The first is the DCC-GARCH model proposed by Engle (2002), which not only measures the volatility persistence of each market but also flexibly models the variance-covariance matrix to describe the time-varying linkages between markets3. Although the rolling window approach can estimate the time-varying correlation coefficients, the time-varying results can be affected by the selection of the window length to allow a trade-off between noisy and smooth data for small and large window widths, respectively. The DCC-GARCH model can address the disturbance of window length selection (Ji and Fan, 2016). The second is a full BEKK-GARCH model defined in Engle and Kroner (1995), which measures the volatility spillover effects of the two markets on their own and across markets.
(1) DCC-GARCH model
The DCC-GARCH model is estimated in two stages. The first is to perform a series of univariate GARCH estimates, and the second is to compute the dynamic conditional correlations based on the first stage.
First, a typical univariate GARCH (1,1) model can be described as follows:
where εt is a 2 × 1 vector of residuals obtained from the VAR (1) model, and Ωt−1 is the information set available up to time t − 1. Ht is the conditional variance-covariance matrix of residuals. and are the covariance between the INE and WTI (Brent) returns. and are derived from the univariate GARCH process and are conditional variances of the INE and WTI (Brent) returns series. ω > 0, α ≥ 0, and β ≥ 0 ensure the positive definite of the conditional variance (ht). ω is a constant term, while the sum of α and β measures the volatility persistence of a given shock.
Second, DCC coefficients for the two markets are estimated. The conditional variance-covariance matrix of the residuals can be described as follows:
where Rt is the dynamic conditional correlation (DCC) coefficient matrix; Dt is a 2 × 2 diagonal matrix of the conditional standard deviation of the residuals; Qt is the 2 × 2 conditional variance-covariance matrix, with its unconditional variance-covariance matrix Qt; and zt is a 2 × 1 standardized residual matrix. θ1 and θ2 denote the short-term and long-term persistence of shocks to the DCC, respectively. θ1 and θ2 are both non-negative and satisfy θ1 + θ2 < 1.
The parameters of the DCC-GARCH model are estimated using the quasi-maximum likelihood method, where the conditional distribution of εt is assumed to follow a joint Gaussian log-likelihood function for a sample of T observations and k = 2 in a bivariate model, as in Equation (7).
(2) BEKK-GARCH model
Note that different specifications of Ht will lead to different multivariate GARCH models. Engle and Kroner (1995) introduce the BEKK representation of the multivariate GARCH models by specifying the positive definite covariance matrix. Specifically, the bivariate full BEKK-GARCH for INE and WTI (Brent) returns takes the following form.
where C is a 2 × 2 lower triangular matrix of constants, and C′ is a transposed matrix of C. acg and bcg capture short-term and long-term volatility spillover from INE to WTI (Brent) returns, respectively; agc and bgc capture short-term and long-term volatility spillover from WTI (Brent) to INE returns, respectively. acc and agg capture the impacts of past shocks of INE to WTI (Brent) returns on their own current volatility, respectively; bcc and bgg capture the impacts of past volatility of INE to WTI (Brent) returns on their own current volatility, respectively.
Similarly, the parameters of the BEKK-GARCH model are estimated by the quasi-maximum likelihood method in Equation (10):
Data Description
Data
In financial markets, sampling frequency has an important impact on the estimation of volatility. Several studies suggest that the 5-min interval is short enough that most of the volatility information in a day is guaranteed, and long enough that the confounding effects from market microstructure noise are not overwhelming (Andersen, 2000; Gong and Lin, 2018). Following the works of Liu and Wan (2012), Rosa (2014), and Wen et al. (2016), we choose a 5-min sampling frequency. For China's crude oil futures market, we include prices for the nearby month contract on INE. For the international benchmark markets, we include prices for the nearby month contract on the New York Mercantile Exchange (NYMEX) and the London Intercontinental Exchange (ICE). The 5 min high-frequency data were collected from Bloomberg and cover the period from March 26, 2018, to July 23, 2019. Price records of the INE crude oil futures in the first month of futures trading (i.e., from March 26, 2018, to April 25, 2018) were excluded from the sample because this period is regarded as the learning stage where the market is not stable (Hou and Li, 2016). To facilitate data screening, we convert the trading hours of WTI and Brent crude oil futures to Beijing time for a typical day (see Figure 1). Additionally, INE crude oil futures priced in RMB (yuan) are converted into US dollars. After removing periods with either a shortened trading session or too few transactions, we obtain 20,701 5 min high-frequency observations. From the econometric point of view, 5 months of intraday 5 min data (a total of 20,701 observations) are long enough to yield meaningful estimation results without a serious small sample bias issue (Yang et al., 2012; Huo and Ahmed, 2018).
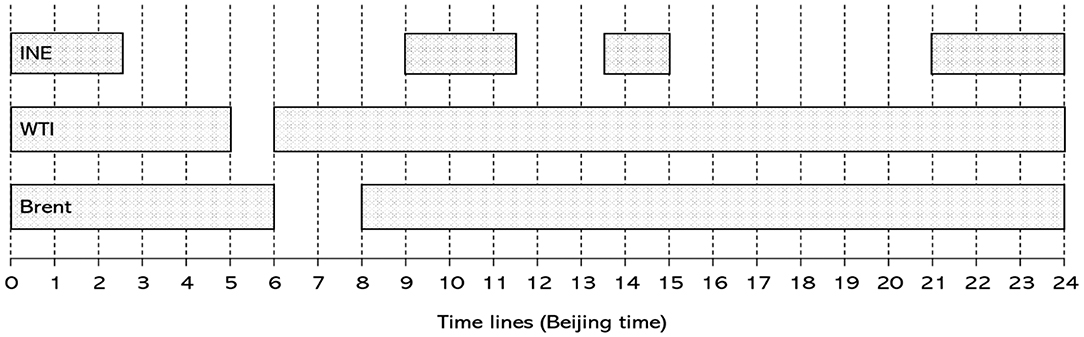
Figure 1. INE, WTI, and Brent trading sessions.
Figure 2 shows the trend of INE, WTI and Brent crude oil futures prices, in which the prices of the three crude oil futures markets tend to move similarly. This implies that crude oil futures prices are largely driven by common fundamental factors, such as the conditions of supply and demand, geopolitics, economic growth and financial markets (Ji and Fan, 2016; Zhang et al., 2019). The common trend for the price dynamics of these crude oil futures markets can initially indicate that there may be shock and volatility correlations between markets; hence, multivariate methods are needed to further reveal the correlation and spillover effects between markets.
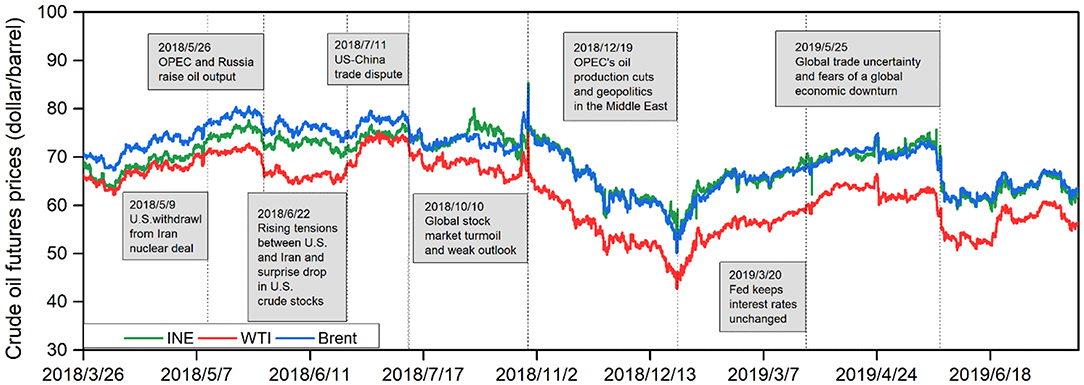
Figure 2. INE, WTI, and Brent price series.
Removal of Intraday Periodicity
A well-known stylized fact about the intraday dynamic characteristics of many financial markets is that return volatility follows a U-shaped pattern (Tse, 1999). Figure 3 plots the average absolute returns, , t = 1, ⋯ , T and k = 1, ⋯ , K, where rt, k denotes the percentage returns for each crude oil futures at the end of the kth interval at day t. T is the total number of trading days and K is the number of equidistant intervals during a trading day. As evident from Figure 3, the usual U-shaped patterns in return volatility of all crude oil futures are observed. Taking the INE crude oil futures as an example, significantly higher return volatility can be observed in each starting period of morning hours (9:00–11:30), afternoon hours (13:30–15:00), and night trading sessions (21:00–2:30). These results parallel the study of Ji and Zhang (2018), they reveal that intraday periodicity indeed exists in high-frequency returns of China's crude oil futures and it can be described as a multi-U-shaped pattern.
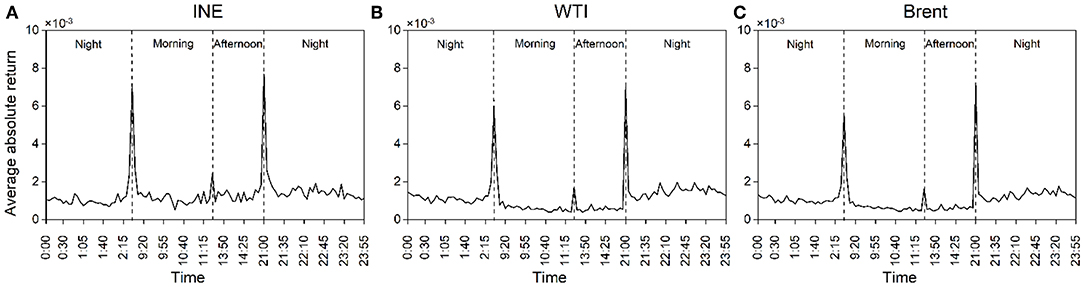
Figure 3. Intraday average absolute returns at 5 min intervals during a trading day. (A) INE, (B) WTI, (C) Brent. The absolute values of original 5 min returns are averaged across days over the entire sample period. There are 112 such values per day.
Figure 4 presents the pattern of the autocorrelation of absolute crude oil futures returns at 5 min intervals for five consecutive days, that is a lag of 560 5 min intervals. The sample autocorrelations exhibit a declining U-shaped pattern, though somewhat distorted, across each day. As shown, each short-term cycle of the autocorrelations is spaced a day (i.e., 112 5-min intervals) apart. The same periodicity pattern is observed for the following days. Hence, one urgent problem in using high-frequency data is that such ubiquitous intraday periodicity in the return volatility in financial markets may have a significant impact on the dynamic features of high-frequency returns; Only taking account of intraday periodicity is it possible to reveal the complex intraday return dynamics across financial markets (Andersen and Bollerslev, 1997).
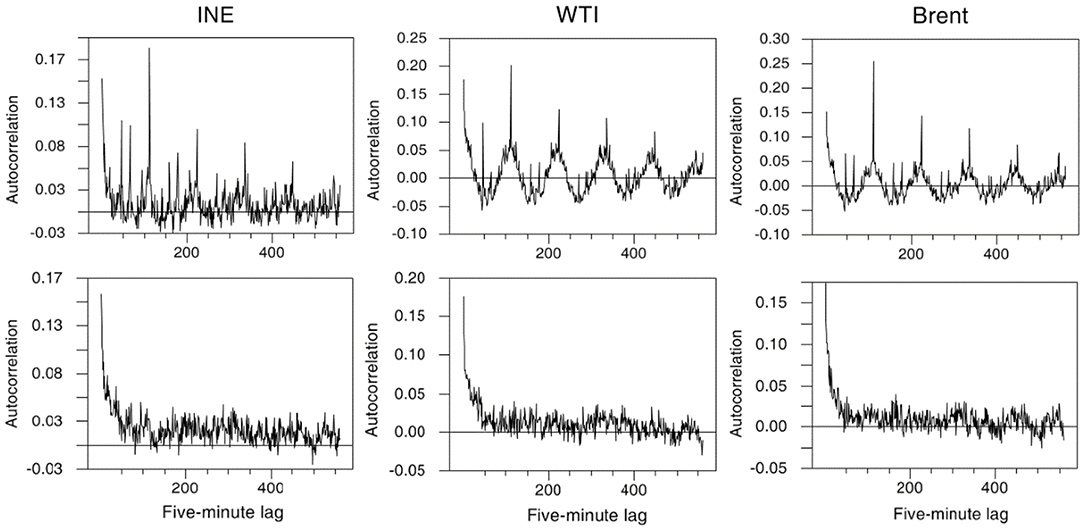
Figure 4. Autocorrelation coefficients of intraday absolute returns. Autocorrelation coefficients of the absolute values of original 5 min returns are displayed by the upper figure and those of the filtered values by the lower figure. The horizontal axis measures lags up to 560 (5 days times 112 per day).
However, there are several ways to address the issue for the intraday periodicity (see e.g., Martens et al., 2002). Following Conrad et al. (2012), we employ a simple but very effective method is to remove the intraday periodicity by standardizing rt, k according to the following rule:
The standardization simply scales each return rt, k by the average absolute return of the interval k. Figure 4 displays the effect of filtering by depicting the sample autocorrelation function of |Rt, k| for five consecutive days. As shown, the recurring intraday periodical patterns indeed disappear, implying that the filtering method is quite effective in removing the intraday periodic pattern.
The above results indicate that the clear intraday periodicity has a significant impact on the autocorrelation patterns of intraday returns. Thus, distortion in the GARCH modeling of the high-frequency return volatility is likely to occur when the intraday periodicity is ignored (Andersen and Bollerslev, 1997).
Descriptive Statistics for Filtered Data
Table 1 demonstrates the descriptive statistics of filtered returns on the different crude oil futures prices under investigation. The INE return is more volatile than the WTI and Brent return, as supported by their corresponding standard deviations. All skewness coefficients are significantly different from 0, and the kurtosis coefficients are higher than 3, implying that each return series has a leptokurtic distribution with asymmetric tails. The Jarque-Bera test provides further evidence that the data do not satisfy the normality assumption. The Ljung-Box Q and Ljung-Box Q2 statistics confirm the presence of serial autocorrelations in both returns and squared returns series. Augmented Dickey-Fuller (ADF) (Dickey and Fuller, 1979), Kwiatkowski-Phillips-Schmidt-Shin (KPSS) (Kwiatkowski et al., 1992) and Phillips-Perron (PP) (Phillips and Perron, 1988) unit root tests are employed in this paper. The results suggest that all return series are stationary at the 1% significance level. Finally, the results of the ARCH-LM test (Engle, 1982) provide evidence of the ARCH effect for these return series, which leads us to employ the GARCH-type models to investigate the dynamic correlation and volatility spillovers among markets.
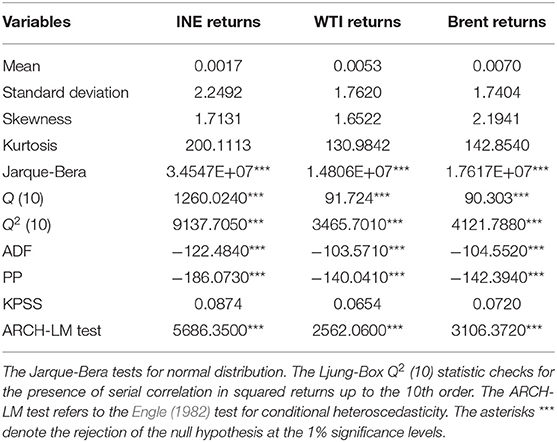
Table 1. Statistical properties of 5 min filtered returns.
Next, we take a glance at unconditional correlations among returns of these crude oil futures, as shown in Table 2. It can be found that the INE market is positively correlated with WTI and Brent markets, indicating that the trends of different oil futures markets are relatively consistent on the whole. Moreover, the INE market is more correlated with the Brent market than with the WTI market.
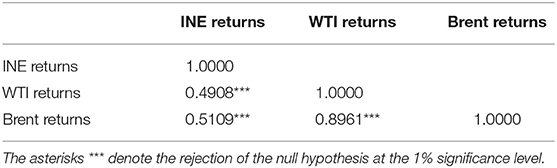
Table 2. Unconditional correlations among crude oil futures returns.
Empirical Results
In this section, we present the results of structural breakpoints detected in the crude oil futures return series using the Bai and Perron (2003) test as well as the estimates of dynamic conditional correlations and volatility spillovers between markets without and with structural breaks.
Structural Break Tests: Bai and Perron (2003)
The results of Bai and Perron (2003) tests for structural break, including the number of breakpoints and their corresponding dates, are collected in Table 3. The Bai and Perron (2003) test determines five structural breaks for each of the INE, WTI, and Brent returns. One interesting finding is that the dates of the detected structural breakpoints are very close, indicating a timely flow of information among the crude oil futures markets. Moreover, the break dates coincide with economic events, geopolitics and energy policies that have great impacts on the supply and demand of crude oil. The first structural break in the crudes occurred in June 2018 may be attributed to rising tensions between U.S. and Iran and surprise drop in U.S. crude stocks; these factors add to fears of a deepening conflict and potential disruption to oil supplies4. The second structural break occurred in October 2018 is related to financial markets and economic conditions. More specifically, during this period, the global stock markets suffer worst losing streak for the last 5 years and economic data weakens demand outlook5, as Zhang (2017) and Zhang and Wang (2019) argue that there is a significant risk transmission between oil market and stock market. Thus, the fear sentiment in financial markets quickly spreads to the oil market, leading to a sharp decline in crude oil prices. The third structural break occurred in December 2018 is caused by OPEC's oil production cuts and geopolitics in the Middle East threatened to hurt oil supply6. As a result, these three crude oil markets prices rise simultaneously. The fourth structural break occurred in March 2019 is related to the announcement that Fed keeps interest rates unchanged, this economic policy plays a role in supporting oil prices. The last structural break occurred in May 2019 can be attributed to global trade uncertainty and fears of a global economic downturn, especially the trade conflict between the two major economies, the US and China, which brings more uncertainty to the global trade7. The trade war environment pushes expectations for global growth to lower levels, thus pressing oil price movements. Consequently, INE crude falls by $12, or 16% within 10 days, WTI crude and Brent crude fall by $7 (12%) and $8 (12%), respectively. This decline is the biggest drop since December 2018.
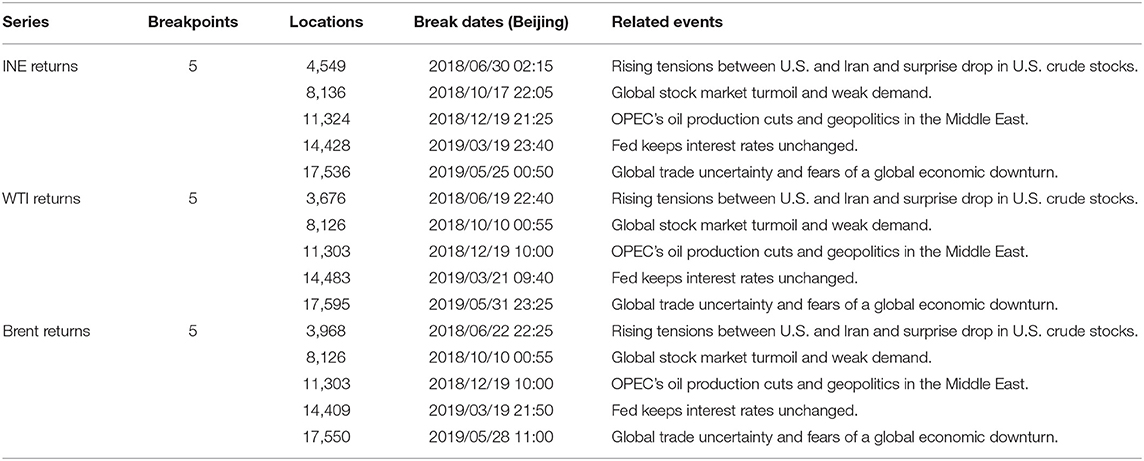
Table 3. Results of structural break tests and related events.
Dynamic Conditional Correlations Without and With Structural Breaks
We estimate the dynamic conditional correlation coefficients between China's crude oil futures market and the international benchmark markets using a bivariate VAR-DCC-GARCH model without and with dummy variables accounting for structural breaks. The results are compiled as Table 4. In this subsection, we first report the estimates when the structural breaks are ignored and then report the results after incorporating structural breaks.
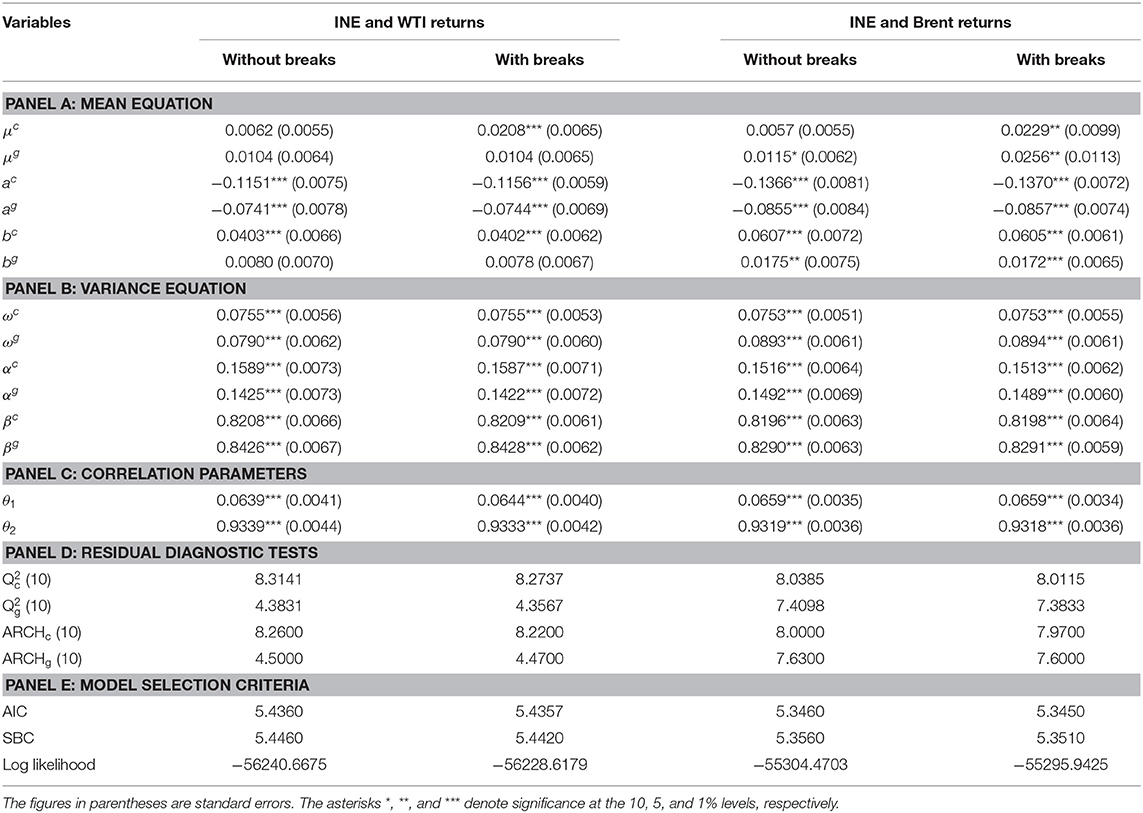
Table 4. Estimation results of the bivariate VAR-DCC-GARCH model for crude oil futures price returns without and with structural breaks.
The estimated results of the conditional mean equation (Table 4 panel A) show that returns of all the three markets are related to their own past returns (ac and ag), implying that these market returns are predictable in the short term. In terms of cross-market return spillovers, there is a significant bidirectional positive return spillover (bc and bg) between the INE market and Brent market, indicating that the rise of Brent oil futures prices will increase INE market returns and vice versa. However, there is unidirectional positive return spillover running from the WTI market to the INE market (bc). The findings show that the interaction of the INE market with the Brent market is stronger than that with the WTI market at the return level.
The variance equation estimates (Table 4 panel B) show that all crude oil futures return series have ARCH and GARCH effects that are statistically significant. For each return series, the sum of the coefficients on the lagged innovation (α) and the lagged condition volatility (β) is close to 1, which implies that shocks to the conditional volatility are highly persistent. In addition, β is significantly larger than α, indicating that past volatility is more important than past shocks for forecasting future market volatility.
Panel C of Table 4 summarizes the resulting DCC coefficients for crude oil futures returns. The short-term (θ1) and long-term (θ2) persistence of shocks on the DCC are statistically significant in all cases. This suggests that the correlations between markets are time-varying. With θ2 close to unity, the long-term persistence of the shock plays an important role in predicting the DCC coefficients. More importantly, as displayed in Figure 5, the plots of the DCCs for the INE market and each of the international market pairs exhibit significant variability in the conditional correlations across the full sample period, with important phases of decreases and increases. For example, the decrease of the conditional correlations across markets is more apparent starting from August 7, 2018, which may be related to the prospect of lower exports from Iran due to American sanctions and uncertainty about Saudi Arabia's oil output strategy; these events have increased market uncertainty. These findings have important implications for energy risk management. Specifically, using constant conditional correlations to compute optimal portfolio weights and hedge ratios can lead to biased estimates. Energy investors should be aware that correlations change dynamically over time, and therefore, portfolios should be dynamically adjusted (Mensi et al., 2015). Additionally, we find high degree of co-movements between the INE market and the international markets. For each pair, the time-varying cross-market correlation coefficient reverts to the mean of 0.7. The results of the diagnostic test (Table 4 panel D) reveal that the residuals of the VAR-DCC-GARCH model estimates are free of serial correlation and the ARCH effect, indicating that the VAR-DCC-GARCH model is correctly specified.
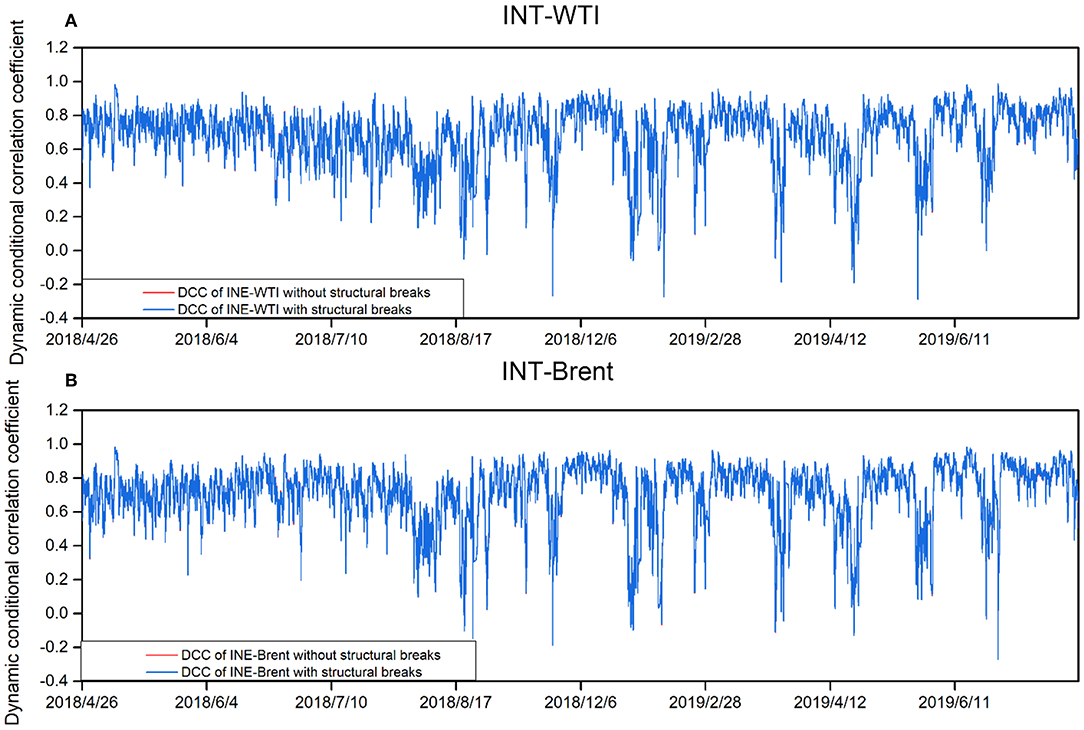
Figure 5. DCCs between crude oil futures returns without and with structural breaks. (A) INT-WTI, (B) INT-Brent.
Modeling volatility by ignoring the structural breaks in the time series may result in spurious regressions due to overestimation of volatility (Lamoureux and Lastrapes, 1990). Therefore, we incorporate the structural break dummy variables into the mean equation to more accurately estimate the conditional volatility of crude oil price returns and the DCCs across crude oil futures markets. Model selection criteria can determine whether the modified model optimizes model estimates. These model selection criteria include the AIC, the Schwarz Bayesian criterion (SBC), and log likelihood. By looking at the results of the model selection criteria in panel E of Table 4, we conclude that the bivariate VAR-DCC-GARCH model with structural breaks is superior to the same model without structural breaks.
The empirical results show that the estimates of cross-market return spillovers are similar to those of the case without structural breaks. However, it is worth mentioning that the significance level for parameter bg–denoting the return spillover from the INE market to the Brent market—has changed from 5% without breaks to 1% with breaks. This finding indicates that structural breaks have an impact on modeling cross-market return spillovers.
The estimating results of variance equations (Table 4 panel B) show that the volatility persistence of all crude oil futures return series decreases after the structural breaks are included, which indicates that ignoring these structural changes in return series may distort the degree of volatility persistence in each market and volatility spillovers across markets. This finding is consistent with those of Kang et al. (2011) and Ewing and Malik (2016). More interestingly, Figure 5 shows that the correlation between the INE market and each of the international benchmark markets decreases significantly for each period when structural breaks are identified. This result implies that, energy policy, economic and geopolitical events that cause structural breaks, will significantly reduce the correlation between the crude oil futures markets.
Table 5 summarizes the descriptive statistics of the DCC coefficients between the INE market and each of the international benchmark markets. As shown, the mean value of the DCC coefficients between the INE market and the Brent market is greater than that of the DCC coefficients between the INE market and the WTI market, regardless of whether the structural breaks are included. Figure 5 also shows that the conditional correlation between the INE market and the Brent market is higher than that between the INE market and the WTI market for most of the sample period. These findings indicate a stronger linkage between the INE market and the Brent market. This is consistent with Song et al. (2019), who use the crude oil spot price to examine the linkage between the Chinese crude oil market and the international crude oil markets during the period 1997–2011. They find that the correlation between the Chinese crude oil market and the Brent crude oil market is significantly higher than that between the Chinese crude oil market and the WTI crude oil market after 2003. Two main reasons for this can be summarized as follows. First, although both WTI and Brent crudes are international benchmark crude oil prices, the WTI crude mainly reflects the supply and demand of the crude oil market in the United States, whose crude oil mainly comes from Canada and Mexico. Meanwhile, the Brent crude mainly reflects the supply and demand in the European crude oil markets, whose crude oil comes mainly from the Middle East and North Africa. As most of China's crude oil is imported from the Middle East, Africa, and Russia (BP, 2018), whose oil pricing mainly refers to the Brent crude oil price, China's crude oil market is more correlated with the Brent market. Second, in recent years, the United States has implemented an independent energy strategy and is vigorously developing alternative energy sources, such as shale gas; this has resulted in a decline in oil demand, which weakens the leading role of the WTI crude in global benchmark crude oil markets. However, the Brent crude oil price is more sensitive to changes in fundamentals; it can more directly represent the trend of global oil prices. In particular, WTI behaved as the price setter before 2010, while Brent has played the leading role in the crude oil market since 2011 (Ji and Fan, 2015).
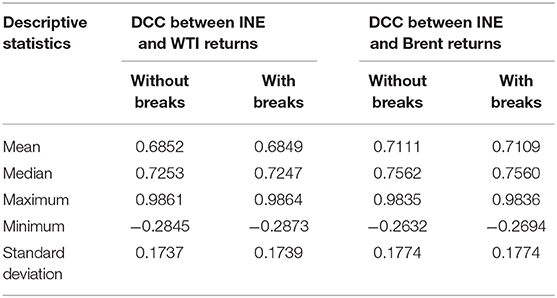
Table 5. Descriptive statistics of correlation coefficients for crude oil futures returns without and with structural breaks.
In addition, following Yin et al. (2018), we employ a paired t-test to measure whether there is a significant difference in DCC coefficients between crude oil futures markets without and with structural breaks. The results of the paired t-test shown in Table 6 provide evidence that the difference between the estimated mean values of conditional correlation coefficients is significant at the 1% level.
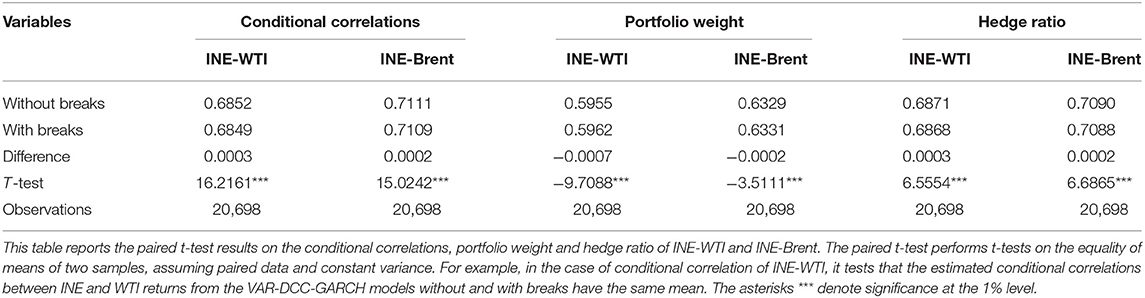
Table 6. Results of paired t-tests.
Volatility Spillovers Without and With Structural Breaks
Analysis of volatility spillovers between crude oil futures markets helps improve the understanding of information and risk transmission across markets as well as the computation of optimal portfolio weights and hedge ratios. Therefore, we further analyze the volatility spillover effect between the INE market and each of the international benchmark markets by using the bivariate full VAR-BEKK-GARCH model, and the estimated results are reported in Table 7. The estimates of the mean equation are similar to those of the VAR-DCC-GARCH model, we will not interpret them here. The results of the conditional variance equation (Table 7 panel B) show that the volatility of these crude oil markets in the current period depends on the past shocks and their past volatilities. These findings indicate that unexpected events in the oil market can increase the volatility of their own markets; current volatility in the oil market has the potential to drive higher volatility in subsequent periods.
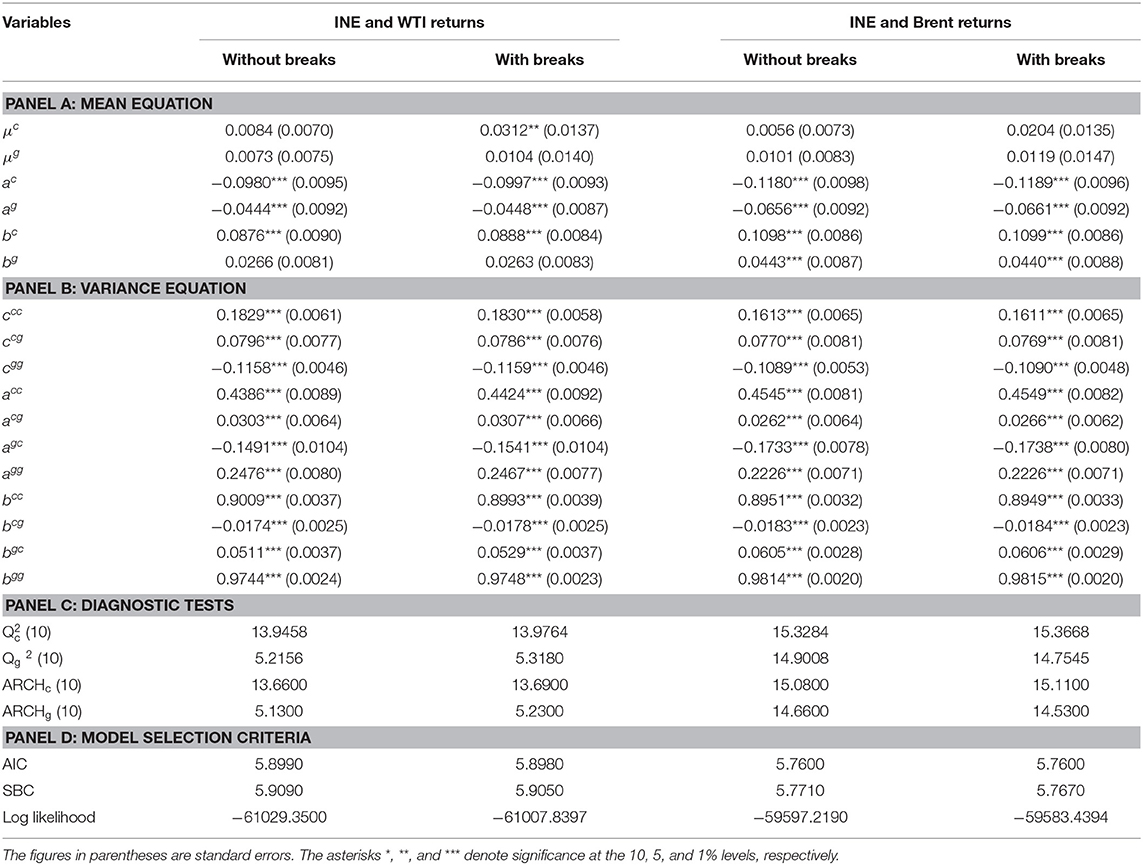
Table 7. Estimation results of the bivariate BEKK-GARCH model for crude oil futures returns without and with structural breaks.
Results pertaining to cross-market volatility spillover indicate that there are significant bidirectional short-term and long-term volatility spillovers between the INE market and each of the international benchmark crude oil markets. These results indicate significant bidirectional volatility transmission between the INE market and the international oil markets; the shocks of the INE market will have an impact on the volatility of the international markets. Part of our results differ from Liu et al. (2013), who use weekly data for crude oil spot prices to examine volatility spillovers between China's crude oil market (Daqing) and four international crude oil markets (WTI, Brent, Dubai and Sandi Arabia's Medium) during the period of 2001–2011. They find that there is only unidirectional volatility spillover from the international markets to China's crude oil market. The main reason for these differences is that on the one hand, the crude oil futures market plays an important role in price discovery; on the other hand, China's crude oil futures market shows a certain influence in the world oil market.
After incorporating structural breaks, the estimates of cross-market volatility spillovers are similar to those of the case without structural breaks. Thus, we will not interpret them here. The results of the diagnostic test (Table 7 panel C) reveal that the residuals are free of serial correlation and the ARCH effect, indicating that the employed model is correctly specified. Finally, as evidenced from the model selection criteria (Table 7 panel D), the VAR-BEKK-GARCH model with structural breaks is superior to the same model without structural breaks.
Discussion and Economic Significance of the Results
Our empirical results have important economic implications because decisions regarding asset allocation and portfolio risk management require accurate estimations of conditional volatility (Ewing and Malik, 2013). The overall essence of portfolio management is to show how an investor can potentially benefit from portfolio diversification between the two asset markets (Tule et al., 2017). In portfolio management, the inherent uncertainties can be mitigated by considering the following two important indicators: (i) the optimal portfolio weight and (ii) the hedge ratio. In this section, we present estimates of these indicators and provide several economic implications for asset allocation and risk management.
Optimal Portfolio Weights and Hedge Ratios
To manage crude oil risks more efficiently, we compute the optimal portfolio weights and hedge ratios for designing the optimal hedging strategies based on the estimates of our bivariate VAR-BEKK-GARCH with and without structural breaks.
We consider a portfolio that can minimize risk without lowering expected returns. We assume that an investor is holding INE crude oil and hope to hedge against the adverse effects of price changes in the international crude oil markets. Following Kroner and Ng (1998), the portfolio weight is expressed as
where wt is the weight of INE crude oil in a $1 portfolio of two asset holdings, INE and WTI (Brent), at time t; h11, t and h22, t denote the conditional volatility of the INE and WTI (Brent) market, respectively; and h12, t represents the conditional covariance between the returns of the INE and WTI (Brent) markets. Therefore, the weight of the WTI (Brent) in the considered portfolio is 1 − wt.
For the hedge ratio, this paper follows Kroner and Sultan (1993) and assumes that to minimize the risk of a portfolio, an investor should short $B of the WTI (Brent) oil portfolio that is $1 long in the INE portfolio, where “risk minimizes hedge ratio” B is expressed as.
Economic Implications for Portfolio Management
The computed optimal portfolio weights and hedge ratios from the VAR-BEKK-GARCH model without and with structural breaks are presented in Table 8. From the table, we find a difference in the portfolio weights after the inclusion of the structural breaks. Specifically, in the portfolio of INE and WTI, the average optimal weight of INE increases from 0.5955 without structural breaks to 0.5962 with breaks. A portfolio weight of 0.5962 implies that an investor who is willing to invest $100 should have optimal holdings of $59.62 in INE oil and $40.38 in WTI oil. As for the portfolio of INE and Brent, the average portfolio weight of INE increases from 0.6329 when the structural breaks are ignored to 0.6331 after controlling for the breaks. These results indicate that (1) ignoring the structural breaks in the crude oil futures return series may lead to bias in the estimation of the optimal portfolio weights, and (2) overall, investors tend to invest in more INE crude oil futures in their portfolio, which indicates more potential gains in the Chinese newly launched crude oil futures market.
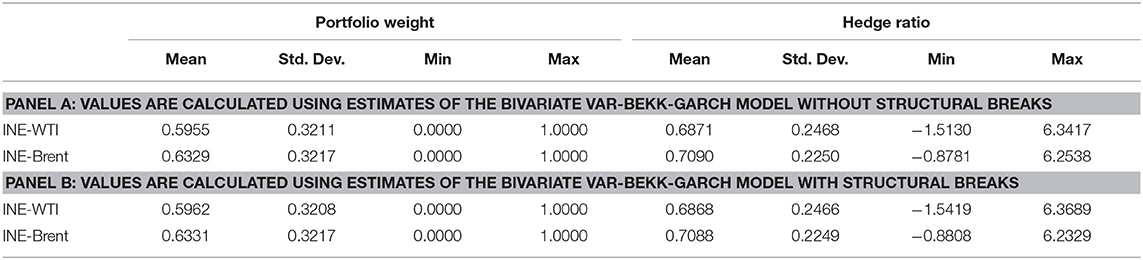
Table 8. Summary statistics for the portfolio weights and the hedge ratios.
As for the hedge ratios, the mean values of the hedge ratio between the INE and WTI (Brent) markets are 68.71% (70.90%) without structural breaks and 68.68% (70.88%) with breaks. This implies that an investor who is holding a long position of $100 in the INE oil will short sell WTI (Brent) for $68.71 ($70.90) without structural breaks and short sell $68.68 ($70.88) with breaks. The minimum and maximum values indicate that each of the hedge ratios shows considerable variability. Therefore, investors must frequently adjust their hedging strategies.
With reference to Table 6 for robustness test, we can reject the null hypothesis that the portfolio weight and the hedge ratio series without and with structural breaks have the same mean values since those differences are statistically significant at the 1% level.
Conclusions and Policy Implications
The integration between crude oil futures markets can provide several interrelated benefits for energy risk management, such as risk sharing and diversification, as well as better allocation of assets. In this paper, we use intraday 5 min data to investigate the dynamic conditional correlations, information transmission and time-varying hedging strategies between China's crude oil futures market and the international benchmark markets (WTI and Brent). Moreover, structural breaks in the crude oil futures markets are detected and incorporated into the models to provide more accurate empirical results.
The results of the Bai and Perron (2003) test show a strong evidence for the presence of structural breaks in all crude oil futures return series. The correlation between crude oil futures markets exhibits significant time-varying characteristics, which indicates that portfolios should be dynamically adjusted over time. In particular, the correlation between crude oil futures markets decreases significantly during the periods when structural breaks caused by economic and/or geopolitical events are identified.
Our empirical results reveal strong evidence for the integration of China's newly crude oil futures market into the international benchmark markets. On the one hand, the mean values of the time-varying conditional correlations among the INE market and the two international markets are both around 0.7, regardless of whether the structural breaks are included. On the other hand, there are significant bidirectional return and volatility spillovers between the INE market and the international benchmark crude oil markets. These findings indicate that China's crude oil futures market exhibits a certain influence on the world's oil markets. Another finding is that the INE market integrates better with the Brent market than with the WTI market, which confirms the leading role of Brent in the world crude oil futures market in recent years (Ji and Fan, 2015). In addition, we further compute the optimal portfolio weights and time-varying hedge ratios for investors who aim to efficiently reduce the investment risk by implementing asset allocations and hedging strategies, by which we highlight the economic significance of our empirical results. The results show that a $100 long position in INE can be hedged for $68.68 ($70.88) with a short position in the WTI (Brent) market, implying that hedging long INE positions by shorting the WTI is cheaper than shorting Brent. The paired t-test results show that the mean values of the DCCs, portfolio weights and hedge ratios estimated from the models without and with structural breaks are statistically significantly different at the 1% level. In summary, introducing dummy variables into the models to account for structural breaks improves our understanding of the correlations and volatility spillovers between crude oil futures markets.
The policy implications of our empirical evidences are 3-fold. First, portfolio managers should possess important information about the directions of spillovers among markets when they allocate assets across crude oil futures markets to take preventive measures to handle sudden events, especially major economic events that may induce risk contagion across markets. Second, investors can dynamically adjust their asset allocation and hedging strategies based on time-varying correlations between crude oil futures markets to maximize benefits and minimize risks. Third, for policy makers, the uncertainty information contained in the market can be obtained from the volatility transmission between the markets, which can be used to forecast future market volatility.
Data Availability Statement
The datasets generated for this study are available on request to the corresponding author.
Author Contributions
ZL, ZD, and PZ: conceptualization and writing—original draft. ZL and PZ: data curation, methodology, and software. ZD, TL, JW, and KZ: supervision. ZL, PZ, and JW: writing—review and editing. All authors read and approved this version.
Conflict of Interest
The authors declare that the research was conducted in the absence of any commercial or financial relationships that could be construed as a potential conflict of interest.
Acknowledgments
The authors gratefully acknowledge the respected editors and the referees for their suggestions in this article. Special thanks are given for the financial support provided by the Fundamental Research Funds for the Central Universities (No. 2017BSCXA04) and the Post-graduate Research and Practice Innovation Program of Jiangsu Province (No. KYCX17_1504).
Footnotes
1. ^https://www.eia.gov/todayinenergy/detail.php?id=34812 (accessed September 15, 2019).
2. ^For more details on comparison between the two seasonal adjustment methods, see Martens et al. (2002).
3. ^We leave the application of fractionally integrated specifications allowing for long memory in the variance equation (see Conrad et al., 2011) for future research.
4. ^https://www.nytimes.com/2018/07/04/business/energy-environment/oil-prices-opec.html (accessed October 31, 2019).
5. ^https://edition.cnn.com/2018/10/31/investing/stocks-markets-october/index.html (accessed October 31, 2019).
6. ^https://www.cnbc.com/2018/12/07/opec-meeting-saudi-arabia-and-russia-look-to-impose-production-cuts.html (accessed October 31, 2019).
7. ^https://ihsmarkit.com/research-analysis/crude-oil-trade-uncertainty-causing-pressure-on-oil-prices.html (accessed October 31, 2019).
References
Adelman, M. A. (1984). International oil agreements. Energy J. 5, 1–9. doi: 10.5547/ISSN0195-6574-EJ-Vol5-No3-1
AlKathiri, N., Al-Rashed, Y., Doshi, T. K., and Murphy, F. H. (2017). “Asian premium” or “North Atlantic discount”: does geographical diversification in oil trade always impose costs? Energy Econ. 66, 411–420. doi: 10.1016/j.eneco.2017.07.005
Andersen, T. G. (2000). Some reflections on analysis of high-frequency data. J. Bus. Econ. Stat. 18, 146–153. doi: 10.1080/07350015.2000.10524857
Andersen, T. G., and Bollerslev, T. (1997). Intraday periodicity and volatility persistence in financial markets. J. Empir. Finance 4, 115–158. doi: 10.1016/S0927-5398(97)00004-2
Bai, J., and Perron, P. (2003). Computation and analysis of multiple structural change models. J. Appl. Econom. 18, 1–22. doi: 10.1002/jae.659
Bhar, R., and Nikolova, B. (2009). Return, volatility spillovers and dynamic correlation in the BRIC equity markets: an analysis using a bivariate EGARCH framework. Glob. Finance J. 19, 203–218. doi: 10.1016/j.gfj.2008.09.005
BP (2018). BP Energy Outlook Country and Regional Insights–China. London. Available online at: https://www.bp.com/content/dam/bp/en/corporate/pdf/energy-economics/energy-outlook/bp-energy-outlook-2018-country-insight-china.pdf (accessed September 1, 2019).
Broadstock, D. C., Fan, Y., Ji, Q., and Zhang, D. (2016). Shocks and stocks: a bottom-up assessment of the relationship between oil prices, gasoline prices and the returns of Chinese firms. Energy J. 37, 55–86. doi: 10.5547/01956574.37.SI1.dbro
Brown, R. L., Durbin, J., and Evans, J. M. (1975). Techniques for testing the constancy of regression relationships over time. J. Royal Stat. Soc. Ser. B 37, 149–192. doi: 10.1111/j.2517-6161.1975.tb01532.x
Chan, H. L., and Woo, K.-Y. (2015). An investigation into the dynamic relationship between international and China's crude oil prices. Appl. Econ. 48, 2215–2224. doi: 10.1080/00036846.2015.1117046
Chang, C.-L., McAleer, M., and Tansuchat, R. (2010). Analyzing and forecasting volatility spillovers, asymmetries and hedging in major oil markets. Energy Econ. 32, 1445–1455. doi: 10.1016/j.eneco.2010.04.014
Charles, A., and Darné, O. (2014). Volatility persistence in crude oil markets. Energy Policy 65, 729–742. doi: 10.1016/j.enpol.2013.10.042
Chen, W., Huang, Z., and Yi, Y. (2015). Is there a structural change in the persistence of WTI–Brent oil price spreads in the post-2010 period? Econ. Model. 50, 64–71. doi: 10.1016/j.econmod.2015.06.007
Cheng, D., Shi, X., Yu, J., and Zhang, D. (2019). How does the Chinese economy react to uncertainty in international crude oil prices? Int. Rev. Econ. Finance 64, 147–164. doi: 10.1016/j.iref.2019.05.008
Chow, G. C. (1960). Tests of equality between sets of coefficients in two linear regressions. Econometrica 28, 591–605. doi: 10.2307/1910133
Conrad, C., Karanasos, M., and Zeng, N. (2011). Multivariate fractionally integrated APARCH modeling of stock market volatility: a multi-country study. J. Empir. Finance 18, 147–159. doi: 10.1016/j.jempfin.2010.05.001
Conrad, C., Rittler, D., and Rotfuß, W. (2012). Modeling and explaining the dynamics of European Union Allowance prices at high-frequency. Energy Econ. 34, 316–326. doi: 10.1016/j.eneco.2011.02.011
Dickey, D. A., and Fuller, W. A. (1979). Distribution of the estimators for autoregressive time series with a unit root. J. Am. Stat. Assoc. 74, 427–431. doi: 10.1080/01621459.1979.10482531
Ding, Z., Liu, Z., Zhang, Y., and Long, R. (2017). The contagion effect of international crude oil price fluctuations on Chinese stock market investor sentiment. Appl. Energy 187, 27–36. doi: 10.1016/j.apenergy.2016.11.037
EIA (2018). China Surpassed the United States as the World's Largest Crude Oil Importer in 2017. Available online at: https://www.eia.gov/todayinenergy/detail.php?id=34812 (accessed September 1, 2019).
Elder, J., Miao, H., and Ramchander, S. (2013). Jumps in oil prices: the role of economic news. Energy J. 34, 217–237. doi: 10.5547/01956574.34.3.10
Engle, R. (2002). Dynamic conditional correlation: a simple class of multivariate generalized autoregressive conditional heteroskedasticity models. J. Bus. Econ. Stat. 20, 339–350. doi: 10.1198/073500102288618487
Engle, R. F. (1982). Autoregressive conditional heteroscedasticity with estimates of the variance of United Kingdom inflation. Econometrica 50, 987–1007. doi: 10.2307/1912773
Engle, R. F., and Kroner, K. F. (1995). Multivariate simultaneous generalized ARCH. Econom. Theory 11, 122–150. doi: 10.1017/S0266466600009063
Ewing, B. T., and Malik, F. (2013). Volatility transmission between gold and oil futures under structural breaks. Int. Rev. Econ. Finance 25, 113–121. doi: 10.1016/j.iref.2012.06.008
Ewing, B. T., and Malik, F. (2016). Volatility spillovers between oil prices and the stock market under structural breaks. Glob. Finance J. 29, 12–23. doi: 10.1016/j.gfj.2015.04.008
Ewing, B. T., and Malik, F. (2017). Modelling asymmetric volatility in oil prices under structural breaks. Energy Econ. 63, 227–233. doi: 10.1016/j.eneco.2017.03.001
Fattouh, B. (2010). The dynamics of crude oil price differentials. Energy Econ. 32, 334–342. doi: 10.1016/j.eneco.2009.06.007
Gong, X., and Lin, B. (2018). Structural breaks and volatility forecasting in the copper futures market. J. Futures Markets 38, 290–339. doi: 10.1002/fut.21867
Gülen, S. G. (1999). Regionalization in the world crude oil market: further evidence. Energy J. 20, 125–139. doi: 10.5547/ISSN0195-6574-EJ-Vol20-No1-7
Hammoudeh, S. M., Ewing, B. T., and Thompson, M. A. (2008). Threshold cointegration analysis of crude oil benchmarks. Energy J. 29, 79–95. doi: 10.5547/ISSN0195-6574-EJ-Vol29-No4-4
Hou, Y., and Li, S. (2016). Information transmission between U.S. and China index futures markets: an asymmetric DCC GARCH approach. Econ. Model. 52, 884–897. doi: 10.1016/j.econmod.2015.10.025
Huo, R., and Ahmed, A. D. (2018). Relationships between Chinese stock market and its index futures market: evaluating the impact of QFII scheme. Res. Int. Bus. Finance 44, 135–152. doi: 10.1016/j.ribaf.2017.07.049
Ji, Q., and Fan, Y. (2015). Dynamic integration of world oil prices: a reinvestigation of globalisation vs. regionalisation. Appl. Energy 155, 171–180. doi: 10.1016/j.apenergy.2015.05.117
Ji, Q., and Fan, Y. (2016). Evolution of the world crude oil market integration: a graph theory analysis. Energy Econ. 53, 90–100. doi: 10.1016/j.eneco.2014.12.003
Ji, Q., and Zhang, D. (2018). China's crude oil futures: introduction and some stylized facts. Finance Res. Lett. 28, 376–380. doi: 10.1016/j.frl.2018.06.005
Jiang, M., An, H., Jia, X., and Sun, X. (2017). The influence of global benchmark oil prices on the regional oil spot market in multi-period evolution. Energy 118, 742–752. doi: 10.1016/j.energy.2016.10.104
Jouini, J. (2015). New empirical evidence from assessing financial market integration, with application to Saudi Arabia. Econ. Model. 49, 198–211. doi: 10.1016/j.econmod.2015.04.010
Kang, S. H., Cheong, C., and Yoon, S.-M. (2011). Structural changes and volatility transmission in crude oil markets. Physica A 390, 4317–4324. doi: 10.1016/j.physa.2011.06.056
Klein, T. (2018). Trends and contagion in WTI and Brent crude oil spot and futures markets—the role of OPEC in the last decade. Energy Econ. 75, 636–646. doi: 10.1016/j.eneco.2018.09.013
Kroner, K. F., and Ng, V. K. (1998). Modeling asymmetric comovements of asset returns. Rev. Financ. Stud. 11, 817–844. doi: 10.1093/rfs/11.4.817
Kroner, K. F., and Sultan, J. (1993). Time-varying distributions and dynamic hedging with foreign currency futures. J. Financ. Quant. Anal. 28, 535–551. doi: 10.2307/2331164
Kuck, K., and Schweikert, K. (2017). A Markov regime-switching model of crude oil market integration. J. Commodity Markets 6, 16–31. doi: 10.1016/j.jcomm.2017.03.001
Kwiatkowski, D., Phillips, P. C. B., Schmidt, P., and Shin, Y. (1992). Testing the null hypothesis of stationarity against the alternative of a unit root: how sure are we that economic time series have a unit root? J. Econ. 54, 159–178. doi: 10.1016/0304-4076(92)90104-Y
Lamoureux, C. G., and Lastrapes, W. D. (1990). Persistence in variance, structural change, and the GARCH model. J. Bus. Econ. Stat. 8, 225–234. doi: 10.1080/07350015.1990.10509794
Lee, Y.-H., Hu, H.-N., and Chiou, J.-S. (2010). Jump dynamics with structural breaks for crude oil prices. Energy Econ. 32, 343–350. doi: 10.1016/j.eneco.2009.08.006
Li, R., and Leung, G. C. K. (2011). The integration of China into the world crude oil market since 1998. Energy Policy 39, 5159–5166. doi: 10.1016/j.enpol.2011.05.048
Lin, S. X., and Tamvakis, M. N. (2001). Spillover effects in energy futures markets. Energy Econ. 23, 43–56. doi: 10.1016/S0140-9883(00)00051-7
Liu, L., Chen, C.-C., and Wan, J. (2013). Is world oil market “one great pool”?: an example from China's and international oil markets. Econ. Model. 35, 364–373. doi: 10.1016/j.econmod.2013.07.027
Liu, L., and Wan, J. (2012). A study of Shanghai fuel oil futures price volatility based on high frequency data: long-range dependence, modeling and forecasting. Econ. Model. 29, 2245–2253. doi: 10.1016/j.econmod.2012.06.029
Liu, Z., Ding, Z., Lv, T., Wu, J. S., and Qiang, W. (2019). Financial factors affecting oil price change and oil-stock interactions: a review and future perspectives. Nat. Hazards 95, 207–225. doi: 10.1007/s11069-018-3473-y
Ma, Y. r., Ji, Q., and Pan, J. (2019). Oil financialisation and volatility forecast: evidence from multidimensional predictors. J. Forecast. 38, 564–581. doi: 10.1002/for.2577
Magkonis, G., and Tsouknidis, D. A. (2017). Dynamic spillover effects across petroleum spot and futures volatilities, trading volume and open interest. Int. Rev. Financ. Anal. 52, 104–118. doi: 10.1016/j.irfa.2017.05.005
Martens, M., Chang, Y.-C., and Taylor, S. J. (2002). A comparison of seasonal adjustment methods when forecasting intraday volatility. J. Financ. Res. 25, 283–299. doi: 10.1111/1475-6803.t01-1-00009
McLeod, R. C. D., and Haughton, A. Y. (2018). The value of the US dollar and its impact on oil prices: evidence from a non-linear asymmetric cointegration approach. Energy Econ. 70, 61–69. doi: 10.1016/j.eneco.2017.12.027
Mensi, W., Hammoudeh, S., Nguyen, D. K., and Kang, S. H. (2016). Global financial crisis and spillover effects among the U.S. and BRICS stock markets. Int. Rev. Econ. Finance 42, 257–276. doi: 10.1016/j.iref.2015.11.005
Mensi, W., Hammoudeh, S., Nguyen, D. K., and Yoon, S.-M. (2014). Dynamic spillovers among major energy and cereal commodity prices. Energy Econ. 43, 225–243. doi: 10.1016/j.eneco.2014.03.004
Mensi, W., Hammoudeh, S., and Yoon, S.-M. (2015). Structural breaks, dynamic correlations, asymmetric volatility transmission, and hedging strategies for petroleum prices and USD exchange rate. Energy Econ. 48, 46–60. doi: 10.1016/j.eneco.2014.12.004
Mikosch, T., and Stărică, C. (2004). Nonstationarities in financial time series, the long-range dependence, and the IGARCH effects. Rev. Econ. Stat. 86, 378–390. doi: 10.1162/003465304323023886
Nishimura, Y., Tsutsui, Y., and Hirayama, K. (2015). Intraday return and volatility spillover mechanism from Chinese to Japanese stock market. J. Jpn. Int. Econ. 35, 23–42. doi: 10.1016/j.jjie.2014.11.005
Phan, D. H. B., Sharma, S. S., and Narayan, P. K. (2016). Intraday volatility interaction between the crude oil and equity markets. J. Int. Financ. Market. Inst. Money 40, 1–13. doi: 10.1016/j.intfin.2015.07.007
Phillips, P. C. B., and Perron, P. (1988). Testing for a unit root in time series regression. Biometrika 75, 335–346. doi: 10.1093/biomet/75.2.335
Reboredo, J. C. (2011). How do crude oil prices co-move? Energy Econ. 33, 948–955. doi: 10.1016/j.eneco.2011.04.006
Rittler, D. (2012). Price discovery and volatility spillovers in the European Union emissions trading scheme: a high-frequency analysis. J. Banking Finance 36, 774–785. doi: 10.1016/j.jbankfin.2011.09.009
Rodriguez, A. E., and Williams, M. D. (1993). Is the world oil market ‘one great pool'? a test. Energy Stud. Rev. 5, 121–130. doi: 10.15173/esr.v5i2.302
Rosa, C. (2014). The high-frequency response of energy prices to U.S. monetary policy: understanding the empirical evidence. Energy Econ. 45, 295–303. doi: 10.1016/j.eneco.2014.06.011
Scheitrum, D. P., Carter, C. A., and Revoredo-Giha, C. (2018). WTI and Brent futures pricing structure. Energy Econ. 72, 462–469. doi: 10.1016/j.eneco.2018.04.039
Shen, Y., Shi, X., and Variam, H. M. P. (2018). Risk transmission mechanism between energy markets: a VAR for VaR approach. Energy Econ. 75, 377–388. doi: 10.1016/j.eneco.2018.08.027
Shi, X., Ji, Q., and Zhang, D. (2018). Evolution of international crude oil pricing mechanism and its implications to China's crude oil futures. J. Environ. Econ. 3, 121–134. doi: 10.19511/j.cnki.jee.2018.03.009
Shi, X., and Sun, S. (2017). Energy price, regulatory price distortion and economic growth: a case study of China. Energy Econ. 63, 261–271. doi: 10.1016/j.eneco.2017.02.006
Song, C., and Li, C. (2015). Relationship between Chinese and international crude oil prices: a VEC-TARCH approach. Math. Probl. Eng. 2015, 1–10. doi: 10.1155/2015/842406
Song, M., Fang, K., Zhang, J., and Wu, J. (2019). The co-movement between Chinese oil market and other main international oil markets: a DCC-MGARCH approach. Comput. Econ. 54, 1303–1318. doi: 10.1007/s10614-016-9564-5
Stărică, C., and Granger, C. (2005). Nonstationarities in stock returns. Rev. Econ. Stat. 87, 503–522. doi: 10.1162/0034653054638274
Taghizadeh-Hesary, F., Yoshino, N., Rasoulinezhad, E., and Chang, Y. (2019). Trade linkages and transmission of oil price fluctuations. Energy Policy 133:110872. doi: 10.1016/j.enpol.2019.07.008
Tse, Y. (1999). Price discovery and volatility spillovers in the DJIA index and futures markets. J. Futures Markets 19, 911–930. doi: 10.1002/(SICI)1096-9934(199912)19:8<911::AID-FUT4>3.0.CO;2-Q
Tule, M. K., Ndako, U. B., and Onipede, S. F. (2017). Oil price shocks and volatility spillovers in the Nigerian sovereign bond market. Rev. Financ. Econ. 35, 57–65. doi: 10.1016/j.rfe.2017.03.003
Wang, K., and Wei, Y.-M. (2016). Sources of energy productivity change in China during 1997–2012: a decomposition analysis based on the Luenberger productivity indicator. Energy Econ. 54, 50–59. doi: 10.1016/j.eneco.2015.11.013
Wang, Q., Zhang, C., and Cai, W. (2017). Factor substitution and energy productivity fluctuation in China: a parametric decomposition analysis. Energy Policy 109, 181–190. doi: 10.1016/j.enpol.2017.07.003
Wang, T., Zhang, D., and Clive Broadstock, D. (2019). Financialization, fundamentals, and the time-varying determinants of US natural gas prices. Energy Econ. 80, 707–719. doi: 10.1016/j.eneco.2019.01.026
Weiner, R. J. (1991). Is the world oil market “one great pool”? Energy J. 12, 95–107. doi: 10.5547/ISSN0195-6574-EJ-Vol12-No3-7
Wen, F., Gong, X., and Cai, S. (2016). Forecasting the volatility of crude oil futures using HAR-type models with structural breaks. Energy Econ. 59, 400–413. doi: 10.1016/j.eneco.2016.07.014
Wu, C., Li, J., and Zhang, W. (2005). Intradaily periodicity and volatility spillovers between international stock index futures markets. J. Futures Markets 25, 553–585. doi: 10.1002/fut.20155
Xu, X., Yu, J., Zhang, D., and Ji, Q. (2019). Energy insecurity, economic growth and the role of renewable energy: a cross-country panel analysis. Singapore Econ. Rev. 1–21. doi: 10.1142/S021759081943001X
Yang, J., Yang, Z., and Zhou, Y. (2012). Intraday price discovery and volatility transmission in stock index and stock index futures markets: evidence from China. J. Futures Markets 32, 99–121. doi: 10.1002/fut.20514
Yin, S., Mazouz, K., Benamraoui, A., and Saadouni, B. (2018). Stock price reaction to profit warnings: the role of time-varying betas. Rev. Quant. Finance Account. 50, 67–93. doi: 10.1007/s11156-017-0623-3
Zhang, B., and Wang, P. (2014). Return and volatility spillovers between china and world oil markets. Econ. Model. 42, 413–420. doi: 10.1016/j.econmod.2014.07.013
Zhang, D. (2008). Oil shock and economic growth in Japan: a nonlinear approach. Energy Econ. 30, 2374–2390. doi: 10.1016/j.eneco.2008.01.006
Zhang, D. (2017). Oil shocks and stock markets revisited: measuring connectedness from a global perspective. Energy Econ. 62, 323–333. doi: 10.1016/j.eneco.2017.01.009
Zhang, D., Ji, Q., and Kutan, A. M. (2019). Dynamic transmission mechanisms in global crude oil prices: estimation and implications. Energy 175, 1181–1193. doi: 10.1016/j.energy.2019.03.162
Zhang, Y.-J., and Sun, Y.-F. (2016). The dynamic volatility spillover between European carbon trading market and fossil energy market. J. Clean. Prod. 112, 2654–2663. doi: 10.1016/j.jclepro.2015.09.118
Keywords: crude oil, integration, structural breaks, dynamic correlation, volatility transmission
Citation: Liu Z, Ding Z, Zhai P, Lv T, Wu JS and Zhang K (2019) Revisiting the Integration of China Into the World Crude Oil Market: The Role of Structural Breaks. Front. Energy Res. 7:146. doi: 10.3389/fenrg.2019.00146
Received: 28 September 2019; Accepted: 28 November 2019;
Published: 10 December 2019.
Edited by:
Dayong Zhang, Southwestern University of Finance and Economics, ChinaReviewed by:
Jian Yu, Central University of Finance and Economics, ChinaWang Tiantian, Nanjing Audit University, China
Copyright © 2019 Liu, Ding, Zhai, Lv, Wu and Zhang. This is an open-access article distributed under the terms of the Creative Commons Attribution License (CC BY). The use, distribution or reproduction in other forums is permitted, provided the original author(s) and the copyright owner(s) are credited and that the original publication in this journal is cited, in accordance with accepted academic practice. No use, distribution or reproduction is permitted which does not comply with these terms.
*Correspondence: Zhihua Ding, ZGluZ3poaWh1YUBjdW10LmVkdS5jbg==; Pengxiang Zhai, cGVuZ3hpYW5nemhhaUAxNjMuY29t