 Qingyang Sun
 Haifeng Gu*
95% of researchers rate our articles as excellent or good
Learn more about the work of our research integrity team to safeguard the quality of each article we publish.
Find out more
BRIEF RESEARCH REPORT article
Front. Energy Res. , 03 September 2019
Sec. Nuclear Energy
Volume 7 - 2019 | https://doi.org/10.3389/fenrg.2019.00092
This article is part of the Research Topic Nuclear Safety Design and Innovation View all 14 articles
Bubble columns are regarded as an effective containment filtration method. A large amount of radioactive aerosol will be retained in a liquid pool and generate decay heat. The surface tension, viscosity and other parameters of the liquid phase are affected by increasing temperature of the liquid pool and the presence of aerosol in the pool, which in turn affect the formation characteristics of bubbles. Another important factor affecting bubble generation characteristics is the proportion of steam in the gas phase, that is, the exchange of mass, and energy of gas phase. This paper will investigate the effects of liquid temperature, aerosol and gas phase composition on bubble formation characteristics by analyzing the variation of bubble detachment volume of the orifice in liquid pool.
The Containment Filtration and Exhaust System is one important measure to guarantee the integrity of the containment. Bubble columns are regarded as a kind of wet filtration method. The gas in the containment is bubbled through the orifice into the bath, and the radioactive aerosol, or inorganic salt is retained in the bath. Radioactive inorganic salts such as iodine can be reacted with sodium thiosulfate in the liquid pool (Wen et al., 2017), and the aerosol is directly retained in the pool by means of mass transfer sedimentation. Bubbles are the form of filtering gas into the liquid pool, and the bubble detachment volume will directly determine the area of gas-liquid contact and affect the efficiency of filtration during the filtering process. The bubble generation characteristics determine the detachment volume of bubble, so the exploration of that is of great significance in evaluation of the filtration system effect.
The bubbling of the orifice plate is a relatively complicated process, and various forces act on the bubble during formation, including its own momentum, surface tension, drag during rising and buoyancy (Gaddis and Vogelpohl, 1986). One of the leading factors affecting the force of the bubble is the flow of the bubble. Most researchers (Davidson and Schueler, 1960; Davidson and Harrison, 1963) have suggested that the decisive factors affecting the size of bubble formation are surface tension and liquid phase density at low flow rates. At high flow rates, the flow will be the main factor. A variety of bubble-off volume prediction models have also been given by different researchers (Davidson and Schueler, 1960; Davidson and Harrison, 1963; Kumar and Kuloor, 1970) which use flow as a parameter of interest, with a simple bubble volume formula:
K is the empirical coefficient obtained by the experiment. Davidson proposed two different coefficients of 1.378 (Davidson and Schueler, 1960) and 1.138 (Davidson and Harrison, 1963), and K = 0.976 was obtained in the experiment of Kumar (Kumar and Kuloor, 1970). It is the ignoring of the influence of surface tension, viscosity and orifice diameter in formula (1) that leads to diverse empirical results in different experiments. Another bubble diameter calculation model that combines more factors was proposed by Gaddis (Bhuiyan et al., 2015):
The influence of liquid phase properties on the bubble generation characteristics has always been the focus of scholars. The addition of inorganic or solid particles in the liquid pool changes the liquid phase properties. For example, when the liquid phase is a sodium thiosulfate solution, as the concentration of the solution increases, the dimension of generated bubbles decreases (Wen et al., 2017), and the presence of inorganic salts also inhibits bubble fusion (Kracht and Finch, 2009). The addition of solid particles in the liquid phase is believed to increase the load of bubble rise and reduce the rate of rise, and the solid particles also promote the fusion of bubbles (Vazirizadeh et al., 2016). There have been many studies on the nature of the addition of inorganic salts in the liquid phase, but studies on aerosol-based solid particles have been fewer as more have focused on the characteristics of the bubble rise process, and there is not enough investigation into bubble formation characteristics. Therefore, there is even less attention paid to liquid phase temperature and gas phase properties during bubbling. Based on this, the present paper focuses on the effects of liquid phase addition of aerosol particles, high temperature liquid phase, gas phase temperature, and composition on the formation characteristics of single bubbles.
The schematic of the test facility is shown in Figure 1. The overall experimental circuit consists of four parts for air supply, steam generation, tracheal transport, bubble generation and imaging, and is also equipped with a parameter measurement, and acquisition device. A rectangular open water tank with a size of 300 × 200 × 700 is provided at the bottom of the bubble generating portion of the experimental table. The facility is designed to run at atmosphere pressure and temperature ranging from 25 to 98°C. The experimental gas flow rate was measured by a mass flow meter, and the flow rate was controlled from 0.05 to 0.20 l/min.
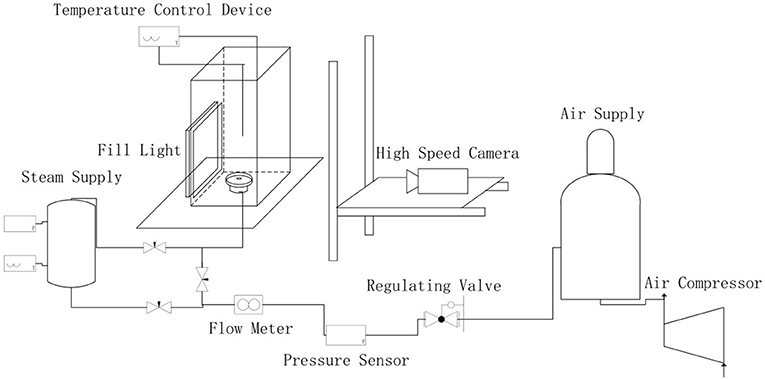
Figure 1. Schematic of experimental facility.
The bubble image is captured by a high-speed camera, and the bubble is processed by Matlab software to extract its characteristic parameters. Pre-processing of the captured image is required because of the large amount of noise in the image taken directly from the experiment. A clearer bubble profile will be obtained after image background removal, median filtering and binarization.
The program calculation relies on the processed image contour to obtain the most suitable center point and symmetry axis of the bubble, and then adopts the processing method of the slice to cut the bubble into a plurality of small slices in a direction perpendicular to the axis of symmetry, each of which can be regarded as a cylinder. Under the idea of differentiation and integration, the volume of the entire bubble is obtained by accumulating the volume of the cylinder. The calculation formula is as shown in equation (3).
The result obtained is the pixel volume of the bubble in the picture, an actual scale k will be given for each image in the experimental shooting and finally volume represented by the pixel can be converted into the actual bubble volume:
The influence of orifice diameter, gas phase flow and liquid phase properties during bubbling has been a concern. In previous studies, it was found that the momentum of the gas phase and other factors change with the increase of pore size and gas phase flow, which in turn makes the size of the bubble increase (Badam et al., 2007). In this paper, as shown in the results of the deionized water experiment in Figure 2, the bubble increased significantly as the orifice diameter increased from 1 to 2 mm and the gas flow rate increased from 0.05l/min to 0.2l/min. On the other hand, for the study of liquid phase properties, the researchers found that bubbling is not affected by liquid level changes in the range of liquid level studied (600–2,100 mm) (Jamialahmadi et al., 2001). In this paper, the aerosol in the liquid phase as well as the liquid phase and gas phase temperatures were taken as the research object. And to ensure the proper experimental variables, diameters of 1 mm for the orifice plate and of 700 mm for the liquid level were uniformly used in the study.
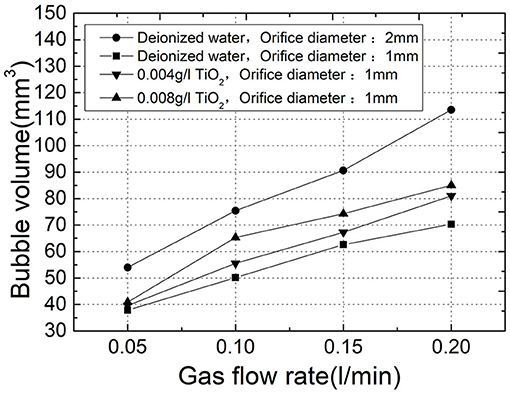
Figure 2. Effect of different TiO2 concentration on bubble volume generation.
Polydisperse aerosol particles TiO2 with a median particle size of 300 nm were chosen in this experiment. To ensure the visibility of the experimental suspension, two concentrations of 0.004 g/l and 0.008 g/l were selected for the experiment. The variation of bubble detachment volume with flow rate in different concentrations of TiO2 suspension at 25°C is shown in Figure 2. As a result, the addition of TiO2 particles in the liquid causes a larger detachment volume of the bubbles compared to the deionized water, and the size increases as the concentration of the TiO2 particles increases. Nanofluids such as TiO2 have been found in previous studies to increase surface tension (Bhuiyan et al., 2015). Therefore, the surface tension was measured by the platinum plate method in the experiment, and the surface tension of the TiO2 suspension of 0.008 g/l at 25°C (72.2 mN/m) was slightly larger than that of the deionized water (71.9 mN/m). When the bubble is detached and the force is balanced, the surface tension is the resistance, which is directly affected by the liquid phase property when the bubble contact angle is zero (Gaddis and Vogelpohl, 1986). And surface tension will affect the buoyancy and detachment size of the bubble when other external conditions such as flow rate are constant.
The water tank and the vent pipe were insulated in the experiment to maintain the temperature of the gas phase, as shown in Figure 3, the bubble size at different liquid temperatures when the gas was 25°C and flow rate was 0.2 l/min. The results show that the bubble size increases after the liquid temperature rises, and its increase is more severe as the temperature approaches saturation.
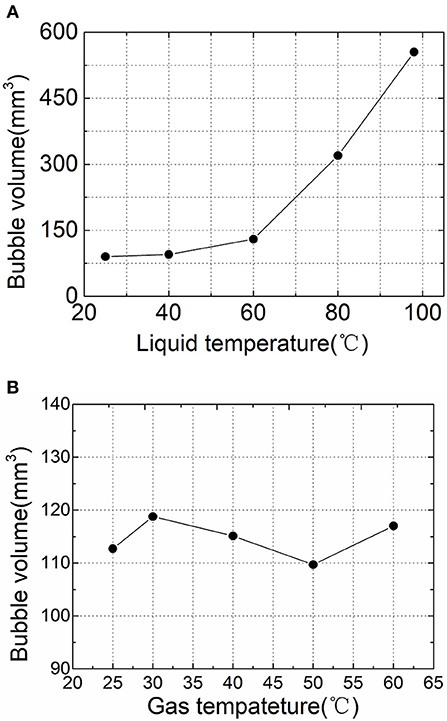
Figure 3. Effect of gas and liquid temperature on bubble generation volume. (A) Effect of liquid temperature. (B) Effect of gas temperature.
The nature of the bubble must be affected by the nature of the liquid or gas phase. On the one hand, in the research and analysis of the changes in liquid phase properties, previous researchers have shown that the increasing of liquid temperature will greatly decrease the surface tension at the gas-liquid interface, which in turn will reduce the size of the bubble. However, it can be seen from the experimental results that the high-temperature liquid phase increases the size of the bubble. Therefore, it is suggested that most scholars only pay attention to the change in liquid phase properties but ignore gas phase. If the gas phase expands or the liquid phase evaporates into the gas phase during bubble generation, the result can be explained. Among them, the expansion will be derived from the temperature difference between the gas and the liquid, so the effect on the gas phase temperature was verified in the experiment. The bubble volume comparison at different gas phase temperatures at a flow rate of 0.2 l/min and a liquid temperature of 60°C is shown in Figure 3B. It can be seen from the figure that the bubble generation size does not change significantly under different gas-liquid temperature differences. Therefore, it is considered that the gas phase does not undergo a significant expansion phenomenon, and it is judged that the increase in the bubble size is derived from the evaporation of the liquid phase.
Since the gas source for bubbling in the experiment comes from the gas storage tank and the boiler, respectively, the bubbling characteristics when the gas phase in the untreated air or the steam-containing air can be analyzed in the experiment. As shown in Figures 4A,B, bubbles are generated with the same gas phase flow (0.05l/min) and liquid phase temperature (95°C), but the gas phase is, respectively, the air of normal humidity (untreated air), and saturated humidity (wet-saturated air). Obviously, the bubble volume under untreated air is significantly larger higher when the gas phase is wet-saturated air. Figure 4C shows that the size of the bubble does not change significantly during the floating process, which means the effect of the pressure change caused by the liquid phase on the bubble size is weak. Therefore, according to the results of the comparative experiments, the main reason must be that the evaporation of the liquid phase exists in the bubbles of untreated air, and it is further verified that evaporation is the main cause of the change in the volume of the bubble by the high temperature liquid phase. On the other hand, the surface tension of the gas-liquid interface is reduced at high temperature, thereby promoting mutual fusion between the bubbles. When the gas phase is untreated air, the large-sized bubbles greatly increase the probability that the bubbles contact each other and fuse. Therefore, in the experiment under this condition, the bubbles merge with each other from the generation to the rise to make a larger one as shown in Figure 4A.
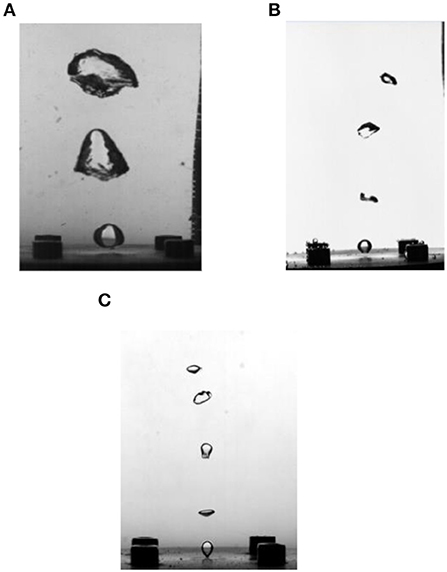
Figure 4. Shows the comparison of bubbles in different gas phase components. (A) 95°C liquid phase, untreated air. (B) 95°C liquid phase wet-saturated air. (C) 25°C liquid phase, untreated air.
Figure 4B shows the shape of the bubble when eliminating the influence of liquid phase evaporation and the effect of liquid phase evaporation is eliminated, and Figure 4C shows the form case of the liquid phase for low temperature bubbles formed when the liquid phase is cold. It can be seen from the comparison that the difference in the morphology of the bubble formed under these two conditions is not obvious. Therefore, it can be considered that the influence of the liquid phase temperature rise is mainly manifested by the evaporation of the liquid phase. When the influence of the liquid phase evaporation is removed, the influence of the liquid phase temperature change is relatively weak.
Some prediction models for the volume of orifice bubbling are given in the preface, and the results obtained in this experiment are compared with the existing formula model, as shown in Figure 5.
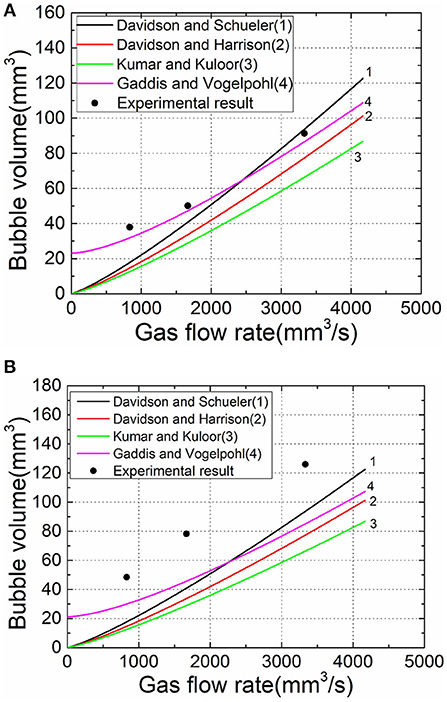
Figure 5. Experimental acquisition of bubble volume values compared with existing calculation models. (A) 25°C liquid temperature. (B) 60°C liquid temperature.
In the model comparison, the experimental values at the liquid temperature of 25°C are better fitted with some models, but when the temperature is higher, the results have a larger deviation since the model does not consider the evaporation factor of the liquid phase.
In view of the result fitting, the calculation formula of Gaddis and Vogelpohl (1986) with better degree of fitting is selected for correction. Inspired by the experimental results of the introduction of steam-containing gas phase, the flow of untreated air can be converted into a wet-saturated gas flow equivalent to the air partial flow through the gas state equation, taking into account the liquid phase portion of the evaporation. The modified model can be obtained by substituting the converted flow value into the original model:
Where Q, T, and P are the flow rate, temperature and pressure of untreated air, Q′, T′, and P′ are the flow rate, temperature and pressure of wet-saturated air at the same temperature, and do is the diameter of the orifice. Equation 6 is obtained by the cubic equation of the bubble size after forcing analysis by Gaddis, and each set of variables in the formula represents a set of coefficients.
The experimental results of different working conditions were fitted with the corrected bubble volume calculation model—the fitting error was within ±30%, which is shown in Figure 6.
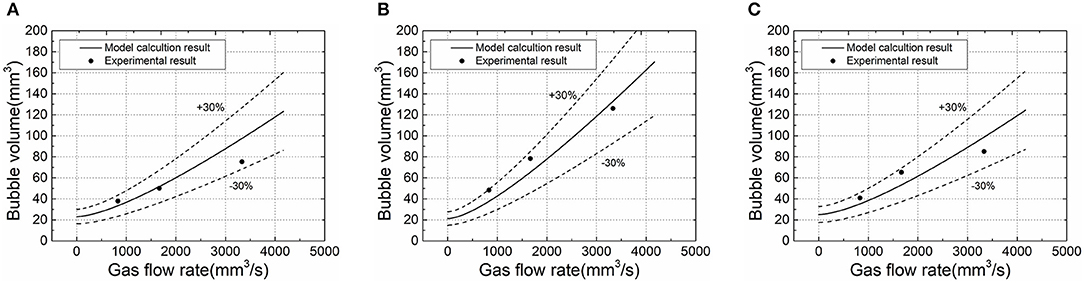
Figure 6. Fitting experimental results with model calculation results under different working conditions. (A) Deionized water, liquid phase temperature 25°C. (B) Deionized water, liquid phase temperature 60°C. (C) 0.008g/l TiO2, liquid phase temperature 25°C.
(1) The suspension of TiO2 particles having a particle diameter of 300 nm has a larger surface tension, and thus a larger-sized bubble is generated from the orifice.
(2) Significant liquid phase evaporation occurs in the high temperature liquid phase, increasing the bubble detachment volume. The effect of gas phase temperature on bubble size is not significant.
(3) A calculation model for the detachment volume of a single-hole bubble is fitted, taking into account the factors of liquid phase evaporation, with the condition that the gas phase is untreated air.
The datasets generated for this study are available on request to the corresponding author.
QS conducted the experiments, data processing, and subsequent analysis. HG guided the direction of the experiment and the writing of the paper. XY is an experimental collaborator and co-authors of the article. WY is an experimental collaborator and collects the experiment data.
The authors declare that the research was conducted in the absence of any commercial or financial relationships that could be construed as a potential conflict of interest.
Badam, V. K., Buwa, V., and Durst, F. (2007). Experimental investigations of regimes of bubble formation on submerged orifices under constant flow condition. J. Canad. J. Chem. Eng. 85, 257–267. doi: 10.1002/cjce.5450850301
Bhuiyan, M. H. U., Saidur, R., Amalina, M. A., Mostafizur, R. M., and Mostafizur, R. M. (2015). Effect of nanoparticles concentration and their sizes on surface tension of nanofluids. Procedia Eng. 105, 431–437. doi: 10.1016/j.proeng.2015.05.030
Davidson, J. F., and Harrison, H. (1963). Fluidized Particles. Cambridge: Cambridge University Press.
Davidson, J. F., and Schueler, B. (1960). Bubble formation at an orifice in an inviscid liquid. J. Trans. Inst. Chem. Eng. 38, 335–342.
Gaddis, E. S., and Vogelpohl, A. (1986). Bubble formation in quiescent liquids under constant flow conditions. J. Chem. Eng. Sci. 41, 97–105. doi: 10.1016/0009-2509(86)85202-2
Jamialahmadi, M., Zehtaban, M. R., Müller-Steinhagen, H., Sarrafi, A., and Smith, J. M. (2001). Study of bubble formation under constant flow conditions. J. Chem. Eng. Res. Design. 79, 523–532. doi: 10.1205/02638760152424299
Kracht, W., and Finch, J. A. (2009). Bubble break-up and the role of frother and salt. J. Int. J. Mineral Proc. 92, 153–161. doi: 10.1016/j.minpro.2009.03.011
Kumar, R., and Kuloor, N. (1970). The formation of bubbles and drops. J. Adv. Chem. Eng. 8, 255–368. doi: 10.1016/S0065-2377(08)60186-6
Vazirizadeh, A., Bouchard, J., and Chen, Y. (2016). Effect of particles on bubble size distribution and gas hold-up in column flotation. J. Int. J. Mineral Proc. 157, 163–173. doi: 10.1016/j.minpro.2016.10.005
Keywords: bubble column, containment filtration method, single-hole orifice, aerosol suspension, formation characteristics
Citation: Sun Q, Gu H, Yu X and Yin W (2019) Bubble Formation Characteristic of Submerged Single-Hole Orifice in Aerosol Suspension. Front. Energy Res. 7:92. doi: 10.3389/fenrg.2019.00092
Received: 31 May 2019; Accepted: 19 August 2019;
Published: 03 September 2019.
Edited by:
Jun Wang, University of Wisconsin-Madison, United StatesReviewed by:
Yen-Shu Chen, Institute of Nuclear Energy Research (INER), TaiwanCopyright © 2019 Sun, Gu, Yu and Yin. This is an open-access article distributed under the terms of the Creative Commons Attribution License (CC BY). The use, distribution or reproduction in other forums is permitted, provided the original author(s) and the copyright owner(s) are credited and that the original publication in this journal is cited, in accordance with accepted academic practice. No use, distribution or reproduction is permitted which does not comply with these terms.
*Correspondence: Haifeng Gu, Z3VoYWlmZW5nQGhyYmV1LmVkdS5jbg==
Disclaimer: All claims expressed in this article are solely those of the authors and do not necessarily represent those of their affiliated organizations, or those of the publisher, the editors and the reviewers. Any product that may be evaluated in this article or claim that may be made by its manufacturer is not guaranteed or endorsed by the publisher.
Research integrity at Frontiers
Learn more about the work of our research integrity team to safeguard the quality of each article we publish.