 Wessam El-Baz
 Peter Tzscheutschler
 Ulrich Wagner
- Institute of Energy Economy and Application Technology, Technical University of Munich, Munich, Germany
Local energy markets represent a mean for distributed energy resources trading for prosumers and energy management for utilities. In these markets, prosumers either trade or shift their loads to maximize their trading gains via communicating with an energy market platform. The utility considers the trading process as an approach to maximize the autonomy and minimize the peak loads. The benefits of the prosumer and utility can vary depending on several parameters such as the market rules, microgrid configurations, or the lifestyle and social behavior of the market participants. In this paper, selected scenarios are presented that discuss and analyze the major factors influencing the market dynamics and microgrid energy balance based on a forward double-sided auction market model simulation. These scenarios are divided into three scenario groups that consider market design parameters, microgrid configurations, and user behavior. Furthermore, the same scenarios are once more evaluated using a reference model, where no market platform is integrated, so that the results of the energy market can be compared. The results are analyzed based on multiple metrics from the perspective of the prosumer and utility to quantify and compare the benefits of the two major market players.
1. Introduction
Societies are transforming the traditional fossil fuel-based supply into a sustainable energy supply that is more environmentally friendly and economically viable. In Germany, the energy system transformation is being realized through expanding the renewable energy sources' (RES) share and increasing the energy efficiency (Renewable Energies Agency, 2016). Along the way of the energy transition, the nature of the electricity grid is transforming. The dependency on centralized power stations is decreasing, and the electricity is being more generated by small power systems that are distributed all over the grid. Between 2002 and 2017, the installed RES increased from 18 to 111 GW. The photovoltaic systems (PV) represent the highest share of the RES, where the capacity increased from 0.3 to 42.71 GW within the same period (Renewable Energies Agency, 2016; Bundesministrium für Wirtschaft und Energie, 2017). According to Maron et al. (2011) and Federal Ministry for Economic Affairs and Energy (BMWi) (2017), 39.4% of the PV capacity is owned by the residential sector, while 19.2% is owned by the commercial and industrial sectors. As much as these figures indicate the progress of energy transition, it demonstrates the extent of transformation in the national grid, and the necessity to modernize the way of managing the grid to adapt to the growing RES. Using conventional concepts to manage the bi-directional power flow is no longer valid. Moreover, more roles are being assigned to the distribution network operators and the energy consumers as well. Thus, traditional consumers are being transformed into prosumers and becoming more aware of the energy system. Hence, using their flexibility is becoming more socially acceptable, as long as they are financially compensated.
Energy markets in microgrids represent not only an approach for energy trading between prosumers but also for demand side management. As discussed in El-Baz and Tzscheutschler (2017), energy market can overcome several challenges faced by current energy management systems such as scalability, decision decentralization, and data privacy. However, energy markets are among the most complex trading markets, given the nature of the energy product. The energy product is highly customizable and exposed to several technical and commitment constraints (Weidlich and Veit, 2008). Hence, there are numerous factors and possibilities to design and run the market.
The developments in the information and communication technologies and the introduction of the Blockchain increased the number of research discussing the applications of energy markets at the microgrid and distribution level (Santos et al., 2012; Goncalves Da Silva et al., 2014; Hu et al., 2016; El-Baz and Tzscheutschler, 2017; Khaqqi et al., 2018). Guerrero et al. (2017) compared the centralized against the distributed trading approaches in the low voltage network under different optimization goals to demonstrate the importance of local energy markets. Bahrami and Amini (2018) developed a decentralized energy trading algorithm, where uncertainties of generation were considered. Khorasany et al. (2017) presented an hour-ahead energy market, where a market subscription charge was used as a price signal. In Zhou et al. (2018), multiple energy sharing mechanisms based on a multi-agent framework were evaluated. The authors discussed the economic and technical benefit of the presented models for the residential prosumers. Other studies were performed to investigate different game theoretic approaches (Tushar et al., 2018), prosumer grouping possibilities (Goncalves Da Silva et al., 2014), scalability (Janko and Johnson, 2018), or even the weather forecasts requirements (Agüera-Pérez et al., 2018). Using the Blockchain technology, (Mengelkamp et al., 2018) discussed the required components for designing an energy market for the microgrids. Kang et al. (2017) presented an electricity trading market for electric vehicles (EVs) using consortium Blockchain. Noor et al. (2018) applied game theoretic approaches and Blockchain to enable transactions between individuals in the microgrid. Hwang et al. (2017) proposed a transaction model as a service for the prosumers. The authors worked on increasing the energy system efficiency while maintaining transparent and secure transactions.
The scenarios presented in the literature were limited given the multiple possibilities of market, microgrid, and prosumers' buildings configurations. Kriukov et al. (2014) and Kang et al. (2017) studied EVs integration in microgrids energy markets. In the model of Marzband et al. (2013), micro turbines, wind turbines, and PV systems were present in a real-time single sided auction market. In this model, the prosumers were absent, and the loads were assumed to be fixed. Chen et al. (2017) and Nudell et al. (2017) studied the integration of combined heat and power systems (CHPs) to the energy markets. Chen et al. (2017) presented a multi-lateral trading model, yet prosumers were not actively integrated.
The objective of this paper is to analyze multiple scenarios of energy markets in microgrids to quantify the benefits of the prosumer and utility under different technical and economic constraints.The scenario analysis is performed based on a double-sided auction model simulation over 1 year. The analysis covers the following aspects:
• Market design parameters such as the trading intervals and market pricing mechanisms
• Microgrid configurations that can be represented by the number of prosumers and installed RES capacities participating in the market.
• User behavior that influences the available flexibility within a building such as the fixed load consumption share.
The structure of the paper is as follows: section 2 shortly describes the used market design and its concept of operation. Moreover, it presents the input parameters and defines the scenario groups. Section 3 demonstrates and discusses the results of the different scenario groups of both the market and reference model. Section 4 compares all the different presented scenario groups. Section 5 presents a conclusive summary of the whole study.
2. Methods and Input Data
2.1. Description of the Model Used
El-Baz et al. (2019) presented a double-sided auction market, where prosumers can trade their energy at different time horizons. This market was designed to provide a fair trading environment and maintain the prosumer's privacy. Hence, the double-sided auction was chosen to be timely discrete and sealed. The discrete-timely double-sided auction synchronizes all the communicated bids at every trading interval such that no advantage is provided for faster traders. Having all the bids sealed guarantees the prosumers data privacy and anonymity while trading. Furthermore, a uniform clearing mechanism was chosen to provide a competitive price for all the market participants and encourage truthful bidding. A type day analysis of this market model was earlier presented in El-Baz and Tzscheutschler (2017).
Figure 1 shows an overview of the model structure and the communication process. The model consists of different components such as a market platform, a home energy management system (HEMS), a market agent, a device controller, and devices D. At the prosumer level, a user interface is available to communicate the user preferences (UP). A forecasting system for the available RES and fixed load is necessary for forward trading. At the microgrid level, a billing system is required to inform the users about their costs. Additionally, the market platform can receive a real-time price (RTP) from the utility or directly connect to the wholesale market.
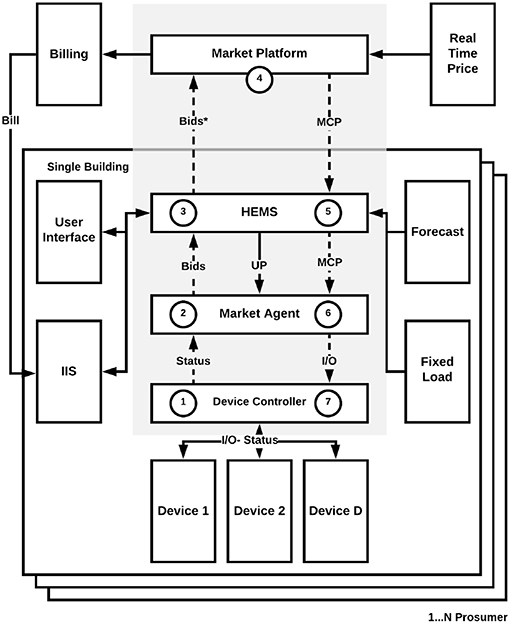
Figure 1. An overview of the model structure and communication steps (El-Baz et al., 2019).
The first market communication step is at the device level, where the device controller communicates the device status such as an EV state of charge. In the second step, the market agent receives the device status to develop the bids. In the market model presented in El-Baz et al. (2019), the market agent behaves depending on the type of device it is connected to. Thus, there is an independently operating market agent with a different strategy for each of the PV, EV, micro-CHP, and heat pump. Depending on the device status and the UP, the market agent develops a bid bi or bj, where i is an index of a buyer (i.e., consuming device) and j is an index of a seller (i.e., generation device). The market rules define the bid price pi or pj such that pmin ≤ pi, pj ≤ pmax, where pmin and pmax are the feed-in price and import price of the utility, respectively. pmax and pmin guarantee the prosumers profitability and participation at every trading interval.
In the third step, the HEMS receives all the bids so that it can be modified depending on the chosen operation mode (standard- comfort - cost saving) as in Equation (1). φ and γ are two variables such that {φ, γ ∈ ℝ:0 ≤ φ, γ ≤ 1}. φ and γ are set by the user to increase or decrease the comfort or cost savings, respectively. Additionally, the HEMS bids on behalf of the user the fixed loads consumption qf at a bid price always equal to pmax so that the bids can always be accepted by the prosumers or utility.
In the fourth step, the market platform receives all the bids from the N participating prosumers to clear the market. The market clearing price is denoted by pe. In this market model, the prosumers have the right to change their bids at any time until the time of the gate closure tg. Also, they have the right to trade at any forward trading horizon. The benefit of the prosumer is evaluated based on Equation (2), where qα denotes an accepted bid volume and n is the number of buyers or sellers bids. More details about market rules are presented in El-Baz et al. (2019).
In the fifth step, the HEMS communicates the pe with the prosumers via the user interface and forwards it to the market agents for further optimization.
In the sixth step, the market agents define the accepted and rejected bids based on the pe. If the bids are accepted, Market agents send activation signals to the device controllers to at the delivery time.
In the seventh, the device controller switches the device based on the market agent signal. Further details about market market rules, clearing process, and insights on the market dynamics are documented in El-Baz et al. (2019).
In order to perform the scenario analysis and generate the most accurate results, the market model is co-simulated on two independent platforms: SimulationX and Matlab. SimulationX, a Modelica based software, is used to model all the physical systems such as the user's building model, heat pump, micro-CHP, EV, batteries, or PV system. Matlab is used to simulate the market model components such the market platform and billing system. Co-simulation of the market model with SimulationX enables simulating the dynamics of the building models and physical systems, in addition to monitoring the building temperature and user's comfort. Furthermore, the co-simulation implementation is similar to the market implementation in real-life. The SimulationX models can be replaced with the real physical systems, while the Matlab models can be running on the cloud as service. The co-simulations run for a complete year according to the parameters defined in section 2.2 and the input data presented in section 2.3.
2.2. Scenarios Definition
There is a various number of possible scenarios that can be used to analyze the behavior of an energy market in a microgrid. These scenarios can vary depending on the market design parameters which are not limited to trading time horizon, trading time interval, market rules, bidding strategies, and pricing mechanisms. At the microgrid level, several combinations can be analyzed for different microgrids sizes, distributed capacities, storage devices, and technical constraints. At the prosumer level, the type of devices integrated, their capacities, and setup can vary. As an example, if a heat pump is installed, different storage sizes can be analyzed. Additionally, the building type and size, heat curves, set temperatures, and night setback can define the prosumer load curve.
The user behavior and lifestyle also have an impact on the prosumers bids in the market. The higher the availability of flexible loads, the higher is the potential of the prosumer to trade in the market. User preferences and optimizations goals can also play an important role. However, they have to be defined based on the society where the market is used.
Calculating the combinations of these variables requires high computational capacity and time. Thus, specific scenarios are selected to represent the market behavior under the most probable configurations. In this paper, three scenario groups are discussed as per Figure 2. Although these scenarios are based on the predefined model in the previous section, the results can be relevant to other market models.
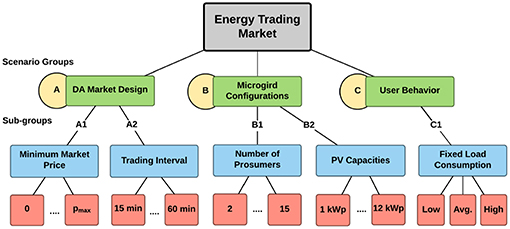
Figure 2. An overview of the model structure.
Group A discusses the double-sided auction (DA) market design variables such as the pmin and the trading intervals. The scenarios of A1 vary the pmin, while holding every other variable constant as shown in Table 1. The pmin is varied at a constant step size between 0 and pmax. At pmin = 0, the prosumers might not get any profit for their feed-in from the utility or trading in the market, but might be able to operate the loads at lower costs. At pmin = pmax, the market is inactive, as the market price is fixed. The goal behind the scenarios of A1 is to show the influence of different feed-in tariffs and foreseeable market fees on the benefits of the prosumers and the utility.
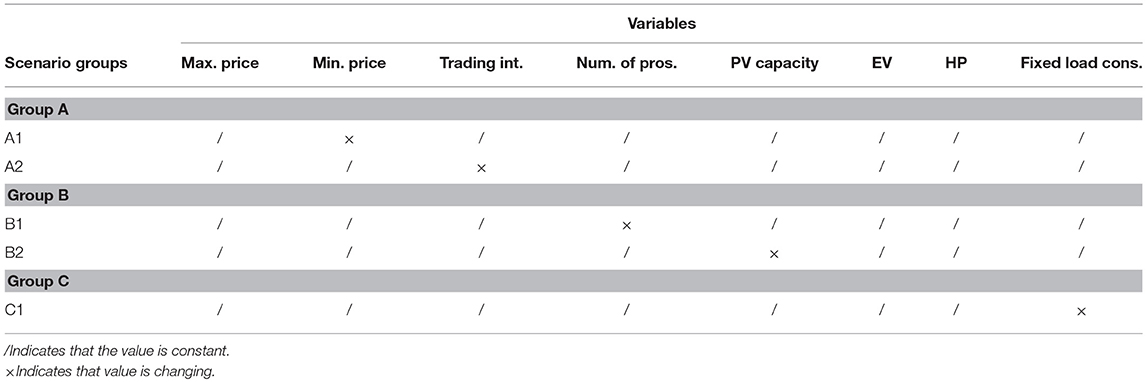
Table 1. Input parameters of the scenario groups.
The influence of the trading intervals is also analyzed in group A. The trading interval Δt is varied between 15 and 60 min. The goal behind varying the trading intervals is to quantify the benefits of higher trading frequency, given the same system configuration and forecast quality.
Group B discusses the microgrid configurations, where the influence of the number of prosumers and the installed PV capacities are studied. An important aspect that needs to be analyzed is the number of participants required to operate the market. Given the decentralized structure presented in El-Baz et al. (2019), each device in a prosumer's building is a market participant. Hence, the number of market participants is the number of prosumers multiplied by the number of devices at each prosumer's house. In this scenario group, the number of prosumers is varied between 2 and 15. Two represents the minimum possible number of prosumers and 15 is the simulation system limit, as each building and device is modeled non-linearly in Modelica. Additionally, the average peak load reaches a plateau for any microgrid size with more than 10 prosumers as discussed in the literature by Huber et al. (2013). Thus, evaluating a large number of prosumers would not be helpful.
Another subgroup of scenarios addresses the influence of the installed PV capacity at each prosumer's building. The capacities are varied from 1 to 12 kWp, which are the expected PV capacities to be possibly installed at a prosumer's building. The goal behind this scenario is to evaluate the influence of the over- and under-capacity on the market prices, prosumer, and utility.
The last group, group C, evaluates the user behavior. Although the user behavior can be evaluated based on different variables, fixed load consumption is used as an indicator of the user behavior and lifestyle. Three categories define the user consumption level: low, average and high. The range of each level is explained in the next section. The goal behind this scenario group is to present the influence of the fixed load consumption magnitude on the prosumer's profitability and behavior in the market.
Within this paper, a separate analysis is performed on each group of scenarios independently. The analysis discusses the results from both the utility and the prosumer perspective, as they are the two main stockholders of the market. Furthermore, the scenarios are always compared to a reference case (no market) and the base scenario. The comparison can be performed based on several metrics, yet to summarize the results only self-sufficiency, self-consumption, peak load, and costs are evaluated. Table 1 summarizes the scenarios including the constant and changing variables.
2.3. Baseline Scenario and Input Data
The baseline scenario is represented by a 10 single family houses microgrid located in Munich, Germany. It is assumed that these single-family houses are occupied by low energy consuming prosumers, and are equipped with a heat pump, an EV charging station, and a PV system. The fixed loads of the prosumers are based on the high-resolution measurements of Tjaden et al. (2015). All the measured households are connected to the same distributor. Thus, it can be assumed that they are located in proximity to each other and can represent a microgrid. Figure 3A presents the distribution of the households yearly energy consumptions, and Figure 3B presents the 10th to 90th percentiles of power variation over time on a typical day. From the typical day profile, it can be assumed that no PV is installed at these houses, given the load peak at noon. Also, no operation patterns of a heat pump, an EV charging or micro-CHP are found in the separate analysis of the household profiles. Hence, it can be deduced that there are no flexible devices in these houses and these profiles can be treated as fixed loads profiles.
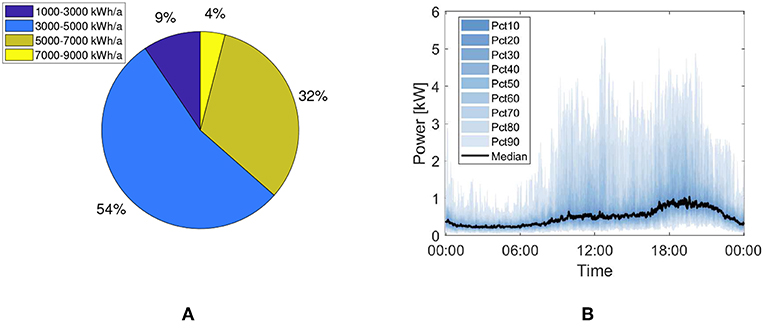
Figure 3. Seventy-four Household representative household profiles analysis, (A) annual energy consumption (B) electrical loads on a typical day.
Using the consumption distribution presented in Figure 3A, the households consuming 1,000–3,000, 3,001-7,000, and 7,001-9,000 kWh/a are defined to be occupied by low, average, and high energy consuming prosumers, respectively. Ten representative profiles are picked from each category to represent the user behavior in the scenario group C.
The integrated heat pump has 10.1 kWth, and a COP of 5.02 at B0/W35 according to the standard EN14511. The heat pump is responsible for covering the space heating and domestic hot water consumption through a 749l combi-storage. The detailed system description and hydraulic configuration are in El-Baz et al. (2018d).
A conventional single-phase charging station is integrated with a power of 3.6 kW. The driving cycle of the EV is based on the worldwide harmonized light duty driving test cycle (WLTC) of class 3 (Tutuianu et al., 2014). The vehicle is assumed to be for private use on working days and weekends. More information on the implemented model is available in ESI ITI.
A 6 kWp PV system is integrated in each single-family house. The power profile of the year 2017 is used and scaled up based on the data of El-Baz et al. (2018a). The prediction of the PV system is based on the work of El-Baz et al. (2018b,c).
The building model is configured based on the research project data of EPISCOPE. A building of a single floor, a cellar and an attic is integrated. The building construction year is between 1984 and 1994. It has a heated living area of 150 m and a room height of 2.5 m. The attic and cellar are assumed to be unheated, while the living area is heated based on a supply temperature curve that varies linearly depending on the outside temperature. The hot water consumption is defined based on the standard VDI 4655. The hot water circulation consumption is based on the field measurements of Lipp and Jungwirth (2011).
In the base scenario, the trading interval is set to 60 min. The utility is assumed to be always participating to balance the market. Hence, the pmax and pmin are set by the utility according to the fixed import and feed-in tariff, respectively. The fixed import is 0.26 €/kWh, and the feed-in tariff is 0.12 €/kWh as per the EEG 2017 BSW Solar (2018). A RTP signal could have been implemented, yet it would have led to suppressing several effects in the selected scenarios (e.g., the impact of constant minimum price).
3. Results
3.1. Overview
This section describes the results of the analysis of the 3 aforementioned scenario groups. The scenarios are variations of the baseline scenario and are always compared to the reference scenario (no market). Each scenario is run for a complete year to represent the behavior of the system in all the seasons. The overall number of market model and reference scenarios are 98. Four metrics are used to evaluate the presented scenarios: self-sufficiency, self-consumption, peak load, and costs. Self-sufficiency describes the share of energy demand supplied by the prosumer, while self-consumption describes the share of on site generated energy consumed by the prosumer. The peak load shows the maximum import load of the microgrid. Costs are calculated from the perspective of the prosumer to quantify the possible costs savings using the market model. Same metrics are used to quantify benefits of the utility at the microgrid level.
3.2. Group A: Market Design
Group A discusses two major factors influencing the market behavior. In A1, the impact of different minimum market prices on the load shifting behavior in the microgrid and the profitability of the prosumers are investigated. Figure 4 presents the results of multiple metrics against different values of pmin. It can be seen that the self-sufficiency, self-consumption, and peak load are almost constant and the cost results of the market model are always better than reference. The self-sufficiency and the self-consumption are doubled, and the peak load is reduced for all the houses. At pmin = 0.24, which is 0.02 less than the pmax, the results fall in comparison to the lower pmin values. This behavior occurs due to the small difference between the pmin and pmax that influences negatively the market clearing algorithm and optimization models of the markets agents. At pmin = pmax, the market can not operate since the price, in this case, is fixed and there are no incentives for the prosumers to trade their energy or shift their load.
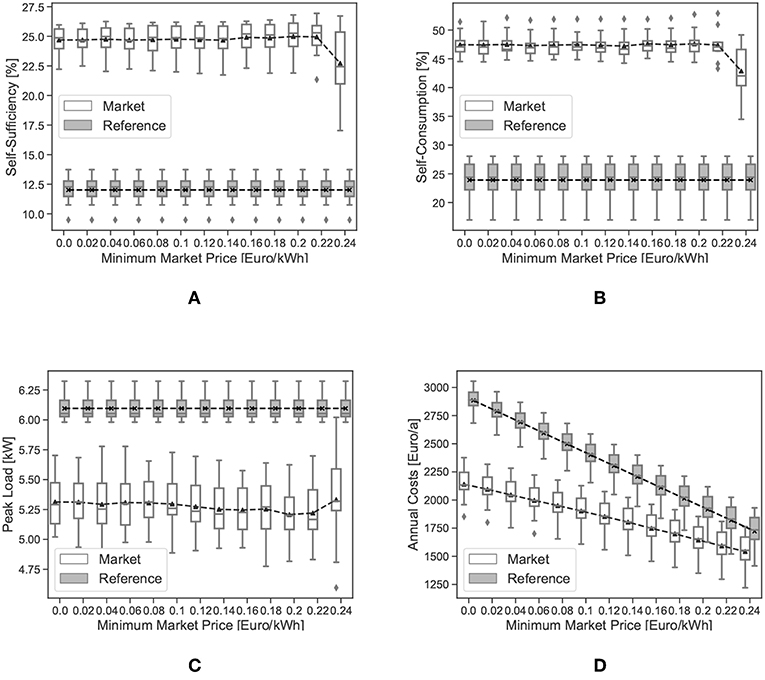
Figure 4. Metrics of the scenario subgroup A1, (A) self-sufficiency, (B) self-consumption, (C) peak load, (D) annual costs.
The costs are evaluated based on Equation (2). As shown in Figure 4D, the costs of the market and reference model decrease as the pmin increases. This reaction occurs as the prosumer gets the chance to feed-in energy at higher prices. Furthermore, it can be seen that the cost savings linearly decrease, as pmin increases. In other words, given that pmax is constant and equal to 0.26, the cost savings are directly proportional to Δp = pmax − pmin. At pmin = 0, Δp = 0.26, the cost savings are around 30%, compared to 8% at pmin = 0.24, Δp = 0.02.
From another perspective, the increase in pmin can be seen as pmin−basescenario = 0 plus transactions fees, utility fees, or ICT service fees. In all these cases, only the prosumer's costs are going to change. The load shifting behavior and overall load curve of the microgrid are not going to be influenced by any changes of additional fees, as long as there is still a minimal difference between the market floor and ceiling. Hence, if fees have to be charged to the prosumers by the market operator for using the platform or by the utility for using the grid to exchange energy, the magnitude of the fees should maintain at least minimal amount of profit or cost savings for the prosumers. Otherwise, the market will fail to operate as an energy management system.
In A2, different trading intervals are investigated. Figure 5 compares the 15, 30, and 60 min trading intervals normalized results depending on the given metrics. The results are normalized to the highest absolute value of the same metric. Self-sufficiency decreases slightly as the trading interval increases. It can be seen that the difference is < 1.5%. The standard deviation of the 15 min is also smaller than that of 30 and 60 min. Self-consumption exhibits the same behavior of the self-sufficiency, where the 15 min is higher than the 30 and 60 min. However, in this case, no significant difference can be noticed between the 30 and 60 min. The peak loads and annual costs in the 15 min trading interval are the lowest.
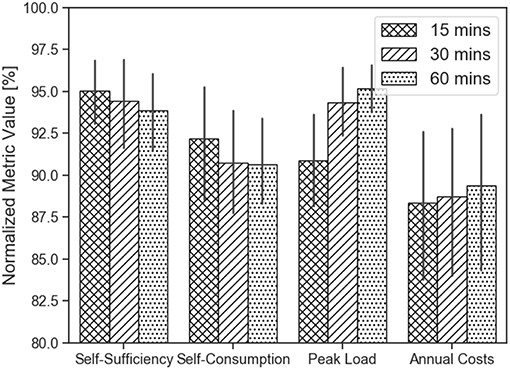
Figure 5. Comparison between different trading intervals at the prosumer level.
The performance of the 15 min trading intervals is always better than other trading intervals, as it enables the market agents to adapt the bids to the load curves without additional averaging. Also, it helps in placing bids that fit better with the supply curves of the PV systems. In a real-life environment, the prosumer can only place a bid and communicate with the market platform according to the forecast resolution constraints. Thus, if the forecasting resolution is half-hourly, but the trading intervals are quarter-hourly, the prosumer will place the bids on a half-hourly basis. In this model, the integrated probabilistic forecast has an hourly-resolution. A linear interpolation was used to increase the resolution of the forecast so that the scenarios of the 15 and 30 min intervals can be evaluated. Although the results are in favor of the 15 min trading intervals, better results could have been achieved if the forecasting systems had higher resolutions.
At the microgrid level, Table 2 shows the absolute values of the given metrics for different trading intervals using the market and the reference models. δ is calculated as . It can be seen that the self-sufficiency and self-consumption for the whole microgrid decrease as the trading intervals increases. δ drops from 134.1 to 122.4% and from 128.1 to 115.2% for self-sufficiency and self-consumption, respectively. Moreover, the peak load increases from 37.5 to 40.6 kW at the 60 min trading interval. This leads to a change in δ by 6.2%. At the microgrid level, costs and cost saving are not calculated as they are calculated for each prosumer. The reference model values at the different trading intervals are constant as no market platform is integrated.
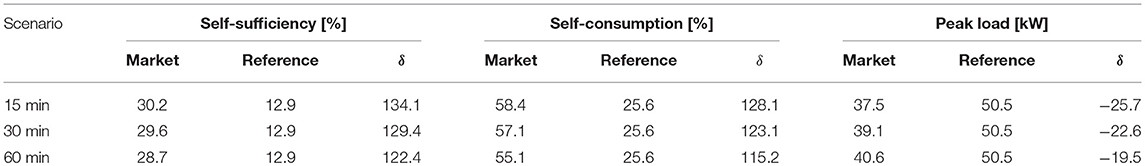
Table 2. Comparison between different trading intervals at the microgrid level.
3.3. Group B: Microgrid Configuration Scenarios
In group B, the impact of different microgrid configurations on the market is discussed. In B1, the influence of the number of prosumers on the microgrid and the market is described. Figure 6 shows the self-sufficiency, self-consumption, peak load and annual costs of 2–15 prosumer microgrid. Generally, it can be seen that the market can operate properly even with a small number of prosumers. No major changes can be seen after 4 prosumers. The most affected measure is the standard deviation. As the number of prosumers increases, the standard deviation increases, which is typical in a real-life situation.
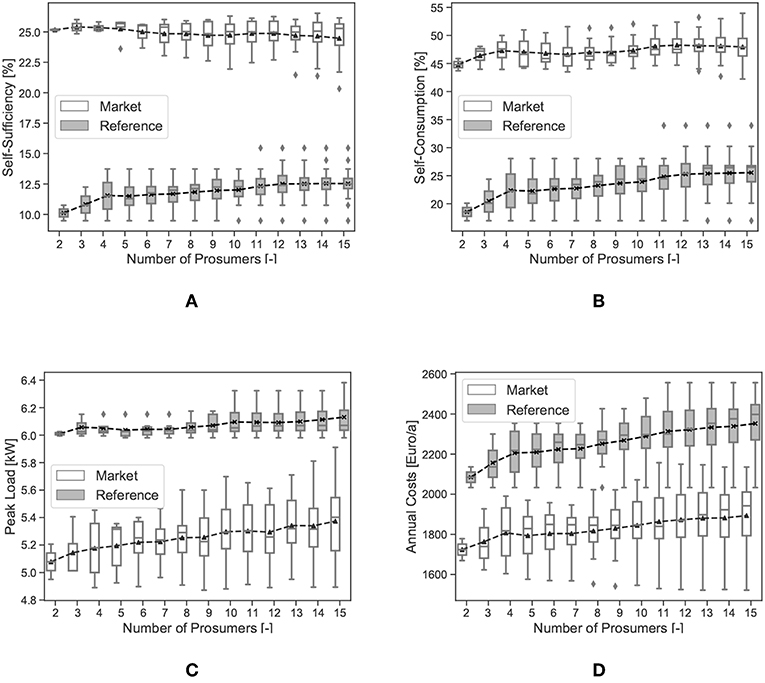
Figure 6. Metrics of scenario subgroup B1 at the prosumer level, (A) self-sufficiency, (B) self-consumption, (C) peak load, (D) annual costs.
The self-sufficiency decreases slightly after 4 prosumers and then maintains an almost constant mean. This can be due to the fact that the first 4 houses have a lower yearly energy consumption. On the other hands, the self-consumption increases from 2 to 4 prosumers and then stays constant. In this case, the same behavior can be seen in the reference model.
The peak load increases as the number of prosumers increase. The reference model is not influenced by the increase in the number of prosumers, as much as the market model. The maximum standard deviation spread of the market model is between 4.9 and 5.9 kW, compared to 5.95 and 6.3 kW for the reference model. On the other hand, the mean varies between 5.1 and 5.3 kW, compared to 6 .1 kW for the reference model.
The mean annual cost also increases as the number of prosumers increases. However, it can be noticed that the market and the reference model increase almost simultaneously. This means that the increase in the annual costs is due to the addition of households with relatively higher energy consumption and not due to the inefficiency of the market model. The difference between the two means is almost constant in every case.
Figure 7 provides another insight at the microgrid level. Compared to the self-sufficiency at the prosumer level, the self-sufficiency at the microgrid level is almost constant as the number of prosumers increases. On the other hand, the self-consumption at the microgrid level shows similar behavior to the self-consumption at the prosumer level, where it increases until four prosumers and then stays constant. Similar to the peak load at the prosumer level, the peak load at the microgrid level increases as the number of prosumers increases. However, it can be seen that the difference between the market and the reference model also increases. Thus, the percentage of peak load reduction achieved by the market improves as the microgrid size increases.
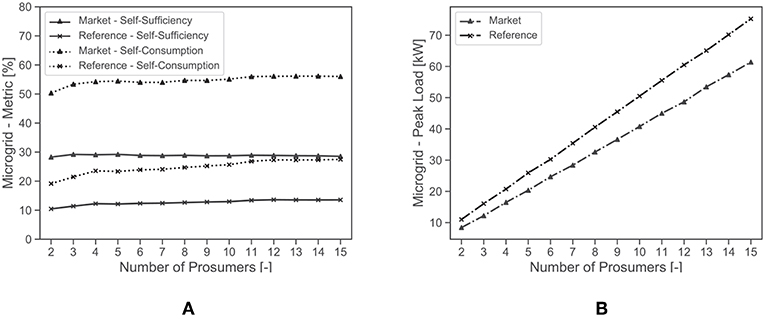
Figure 7. Metrics of scenario subgroup B1 at the microgrid level, (A) self-sufficiency and self-consumption, (B) peak load.
Another aspect that can be studied among several other aspects is the increase in PV capacity installed at each prosumer's house. In B2, the PV capacity is varied from 1 to 12 kWp. Figure 8 shows the results of the given metrics for different PV capacities. The self-sufficiency of all the houses with the market model increases as the PV capacity rises. Also, the gap between the self-sufficiency of the market and the reference model is increasing proportionally to the installed PV capacity. It can be seen that at 1 and 2 kWp the difference in self-sufficiency is not significant compared to that of higher PV capacities. This is because the installed capacities are high enough to enable load shifting or trading. This interpretation can be assured by the self-consumption analysis. It can be seen that at 1 and 2 kWp the market and the reference model are almost identical and 45–65% of the PV energy is consumed on site. As the PV capacity increases, the reference model self-consumption decreases. On the other hand, the self-consumption of the market model increases from 2 to 5 kWp. After 5 kWp, the self-consumption decreases due to the excess capacity of the PV system.
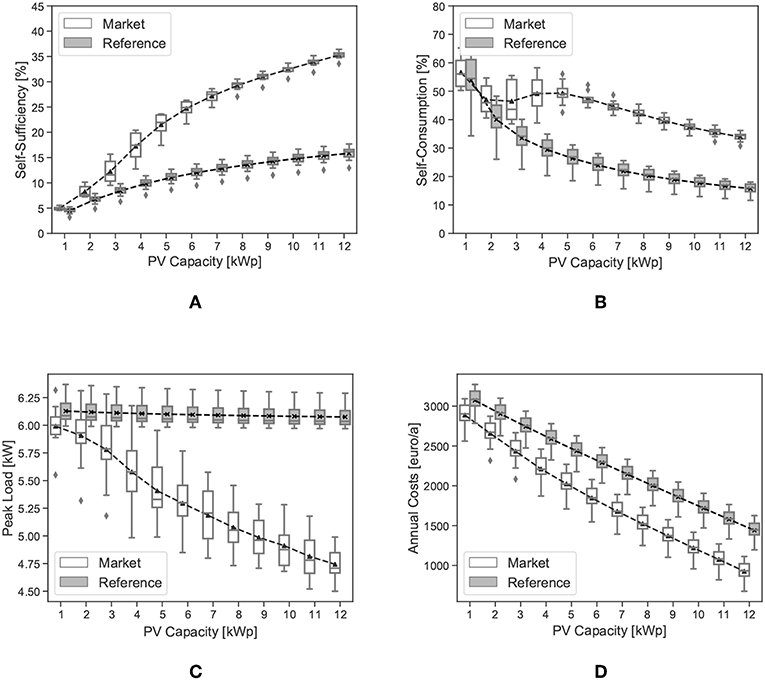
Figure 8. Metrics of the scenario subgroup B2, (A) self-sufficiency, (B) self-consumption, (C) peak load, (D) annual costs.
Using the reference model, the peak load of each prosumer does not change significantly, compared to the market model. This is because some loads operate after the sunset, yet these loads are shifted using the market model. Hence, a linear decrease in the peak load can be seen, as the PV capacity increases.
The annual costs using the reference or market model decreases linearly as the PV capacity increases. That's because in both cases, the excess PV energy is supplied to the grid either at the market clearing price or the fixed feed-in tariff for the market or the reference model, respectively. However, it can be noticed that the gap between the market and the reference model increases as the PV capacity increases. This gap indicates that the prosumers benefit from trading the excess energy supply as in Equation (2).
At the microgrid level, similar behavior can be observed for the self-sufficiency as at the prosumer level. However, the magnitude of self-consumption is higher at the microgrid level. It can be seen that at 1 and 2 kWp the difference between the market and reference are higher compared to the same case at the prosumer level as in Figure 9A.
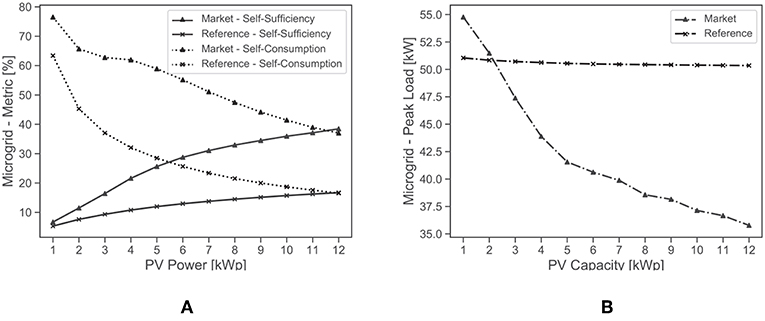
Figure 9. Metrics of scenario subgroup B2 at the microgrid level, (A) self-sufficiency and self-consumption, (B) peak load.
Although the mean peak load of the prosumers is always higher using the reference model than the market model as in Figure 8C, the peak load using the market model at the microgrid level is higher at 1 and 2 kWp than the reference model as in Figure 9B. The lack of energy supply in the market led to using the generated energy locally inside the prosumers' houses and exhibiting the same load shifting behavior. Thus, the peak load of the market model exceeds that of the reference model. As the volume of excess energy increases in the market, the lower the peak load gets. It can be seen that the peak load drops from 55 to 35.5 kW at 12 kWp PV.
3.4. Group C: User Behavior Scenarios
Several variables can be used to study the impact of user behavior on the market platform. In group C, the fixed load consumption is used to indicate the user behavior. Since all the households have the same types and magnitude of flexible loads, higher fixed loads consumption means a lower share of flexible loads. Hence, more energy can be consumed locally by the household itself, and less can be shared with the market. Figure 10 compares the different consumption behavior of the prosumers against the metrics. The results are normalized based on the highest absolute value of the same metric. As anticipated, prosumers with the lowest fixed load energy consumption have the highest self-sufficiency, lowest self-consumption, peak loads, and annual costs.
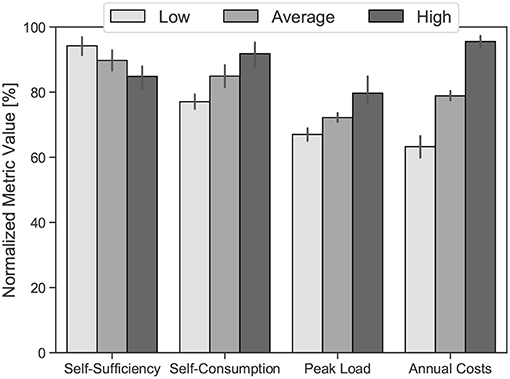
Figure 10. Comparison between different consumption behavior at the prosumer level.
The presented results in Figure 10 are valid and foreseen for the market and the reference model. However, the advantage of the market model over the reference model cannot be recognized. Hence, Figure 11 shows the benefits of the low, average, and high consuming prosumers using the proposed metrics. These results shows the normalized absolute value of the δ of each metric. It can be seen the prosumers with the lowest fixed load energy consumption are the one benefiting most from the market model. These prosumers can achieve the highest self-sufficiency, self-consumption. The differences in the peak load reduction are not as high as self-sufficiency, yet the prosumers with the low fixed load energy consumption are achieving the highest peak load reduction. Similar behavior can also be seen at the annual cost savings metric.
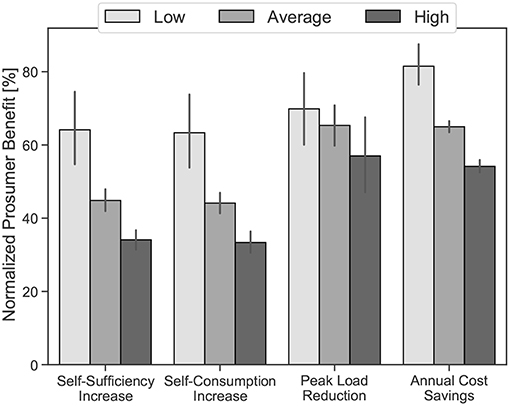
Figure 11. Benefits of different prosumers based on the fixed load consumption.
The reason behind the high benefits claimed by the prosumers with the low fixed load energy consumption is their capability to offer a higher share of the PV and their overall electrical energy consumption. The HEMS of the prosumers with high loads between 7,000 and 9,000 kWh/a always eliminates the PV bids to satisfy the fixed load demands. Moreover, the HEMS always bids the fixed loads with a price equal to pmax to guarantee the operation of the fixed loads. Hence, the higher the fixed loads energy consumption of the prosumer, the less is the overall benefits from the market.
The analysis at the microgrid level shows another perspective. Table 3 shows the absolute values of the self-sufficiency, self-consumption, and peak load. It can be seen that as the fixed load consumption increases the self-sufficiency of the whole grid using the reference model increases, yet it decreases using the market model. The 2.3% increase between low and high using the reference model can be driven by the share of load increase occurring during the availability of PV generation. Comparing the reference and market, it can be seen that between low and high, the δ of self-sufficiency dropped from 122.4 to 65.4%, which is almost 50% decrease.
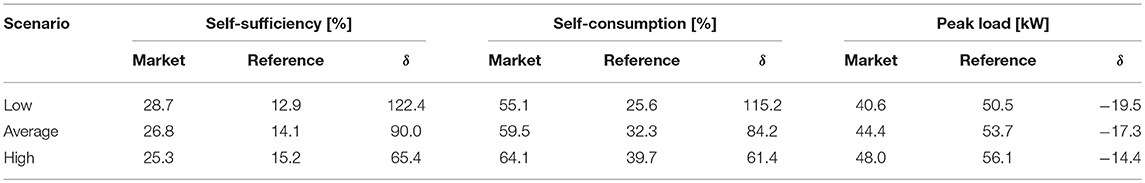
Table 3. Comparison between different consumption behavior at the microgrid level.
The self-consumption of the market and the reference model behaves similarly. Between low and high, the self-consumption increases from 55.1 to 64.1% for the market model, and from 25.6 to 39.7% for the reference model. Although the self-consumption increases in both models, the δ decreases from 115.2 to 61.4%. This result builds upon the results of the same metric at the prosumer level in Figure 11. Hence, it can be deduced that increasing the share of the fixed load reduces the efficiency of the market.
Similarly, the peak load increases for both of the market and the reference model. This leads to decreasing the peak load reduction capability of the market model. The δ, in this case, increases from −19.5 to −14.4%. Hence, 5.1% is lost due to changing the consumer behavior from low (1,000–3,000 kWh/a) to high (7,001–9,000 kWh/a).
4. General Discussion
In order to develop a comprehensive view of the metrics sensitivity to the different scenarios, the results of all the scenario groups have to be compared. Table 4 summarizes the reaction of each metric to the different variations in the scenario groups at the prosumer level using the market model. The presented indicators in this table do not reflect the magnitude or dynamics of change. It is meant to provide a general overview to compare the results. It can be noticed that the reaction of the metrics differs from a scenario group to another. None of the groups presents identical results. This means that the selected scenarios provide a broad perspective on the impact of the energy markets in microgrids.
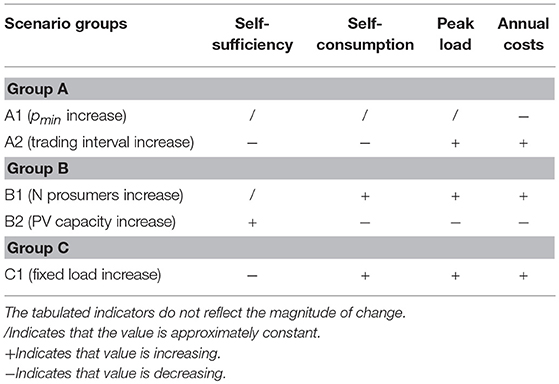
Table 4. Comparison of different scenario groups using the market model at the prosumer level.
In comparison to all the scenario groups, subgroup A1 has only an impact on the annual costs as shown earlier in Figure 4. They are directly influenced by the changes in the market price levels. Other physical aspects such as the self-sufficiency, self-consumption and peak loads are not influenced. Consequently, the overall microgrid is not influenced.
Subgroup A2 shows similar behavior to subgroup C1 except on self-consumption. The increase in trading intervals and fixed loads show a decrease in self-sufficiency and an increase in peak loads and annuals costs, but with different magnitudes. The main difference is the self-consumption. In subgroup A2, the increase in trading intervals made the trading process less efficient as the market participants can not follow accurately the forecasting loads. However, in subgroup C1, the increase in fixed loads increases the self-consumption due to the availability of higher prosumers' loads. At the microgrid level, subgroup A2 and C2 are behaving similarly as per the indicators in Table 4.
subgroups B1 and B2 show contradicting results. Self-sufficiency shows no major changes in subgroup B1, however, it increases in subgroup B2 due to the increase in the PV capacity. The increase in the number of prosumers in subgroup B1, increases the self-consumption, peak loads, and annual costs. This increase is due to the consumption nature of the added prosumers. On the other hand, the increase in the PV capacity decreases the self-consumption, and peak loads due to the increase of the local generation. Consequently, the overall annual costs decrease. At the microgrid level, subgroups B1 and B2 demonstrate similar behavior to the results at the prosumer level but with different magnitudes.
5. Conclusions
This paper presents a scenario analysis of an energy trading market model in microgrids. The used market model enables the prosumers to trade their energy supply and demand within the microgrids. This model does not only support the prosumers via offering a possibility for additional economic incentives but also presents the utility a decentralized approach to manage the microgrid and maintain the prosumers' privacy. Hence, the results were analyzed at the prosumer level and microgrid level to make sure that the two main stakeholders of the microgrid could be encouraged to participate in the market platform.
Ninety-eight selected scenarios are presented. These scenarios are divided into three different groups. The first group studied market design parameters, the second group studied different microgrid configuration, and the third group studied the influence of the user behavior. The results of the three scenario groups can be summarized as follows:
• The capability of the market model to act as energy management system is independent of the price ranges (pmax−pmin), the transaction or service fees imposed by the market operator. The prosumers profit is the only sensitive output to the market prices and fees; however, the prosumer will keep bidding as long as there is a minimal profit.
• Trading intervals and resolutions can improve the benefits of the market model, yet the forecasts resolution limits their impact. Forecast resolution should match the trading intervals to maximize the benefits of the market platform to the utility and prosumers.
• Number of prosumers and devices influence the performance of the market. The used model showed its capability to operate with 2 prosumers, 3 devices each. After 5 prosumers, 15 devices, the benefits of the market reach a plateau.
• Increasing the PV capacity in the microgrid influences directly the self-sufficiency, self-consumption, even if no market platform is integrated. However, the market model can double the self-sufficiency and self-consumption of the microgrid. Moreover, it leads to a linear decrease in the peak loads and annual costs of the prosumers.
• Multiple parameters can be varied to indicate multiple user behavior. However, fixed load consumption is found to be able to reflect the lifestyle, habits and consumption level. Based on the field measurements of different residential household, the results show that the higher the share of fixed loads, the lower is the efficiency of the market. Hence, prosumers with the lowest share of fixed loads are expected to profit the most from the market platforms in microgrids.
Energy platform markets performance is highly dependent on the nature of the market, microgrids, and prosumers. In this paper, the most fundamental scenarios are presented. However, there is room for studying other multiple market design parameters, technical constraints, or social behaviors. In future studies, the realization of these market platforms using Blockchain can be discussed under different national regulatory and operation requirements. Among the most important factors to be studied are the communication frequency constraints under a growing number of prosumers or devices. This communication frequency can affect the trading intervals and, consequently, the market operations and efficiency. Scenarios have also to address the commitment of prosumers to trading bids under the condition of forecast or generation failure of different renewable energy sources. If penalties are to be applied in this case, scenarios can discuss the penalty magnitude influence on the overall annual costs of the prosumers. Additionally, energy consumption of the market platform and its operation costs in the microgrid are yet to be discussed.
On the regional level, a scenario analysis can be performed to study the impact of these local markets on the regional electricity market and the overall national grid.
Author Contributions
WE-B wrote the paper and designed the research. PT and UW provided a detailed critical review. All the authors discussed the documents results and contributed to the preparation of the manuscript.
Conflict of Interest Statement
The authors declare that the research was conducted in the absence of any commercial or financial relationships that could be construed as a potential conflict of interest.
Acknowledgments
This contribution is supported by the German Research Foundation (DFG) and the Technical University of Munich within the Open Access Publishing Funding Program. The research project is supported by the Federal Ministry for Economic Affairs and Energy, Bundesministerium für Wirtschaft und Energie, as a part of the SINTEG project C/sells. Responsibility for the content of this publication lies on the authors.
References
ESI ITI. SimulationX 3.8 | Green City. Dresden. Available online at: https://www.simulationx.com/
Federal Ministry for Economic Affairs and Energy (BMWi) (2017). Renewable Energy Sources in Figures. National and International Development, 80.
Agüera-Pérez, A., Palomares-Salas, J. C., González de la Rosa, J. J., and Florencias-Oliveros, O. (2018). Weather forecasts for microgrid energy management: Review, discussion and recommendations. Appl. Energy 228, 265–278. doi: 10.1016/j.apenergy.2018.06.087
Bahrami, S., and Amini, M. H. (2018). A decentralized trading algorithm for an electricity market with generation uncertainty. Appl. Energy 218, 520–532. doi: 10.1016/j.apenergy.2018.02.157
Chen, Y., Wei, W., Liu, F., and Mei, S. (2017). A multi-lateral trading model for coupled gas-heat-power energy networks. Appl. Energy 200, 180–191. doi: 10.1016/j.apenergy.2017.05.060
El-Baz, W., Honold, J., Hardi, L., and Tzscheutschler, P. (2018a). High-resolution dataset for building energy management systems applications. Data Brief 54, 1–5. doi: 10.1016/j.dib.2017.12.058
El-Baz, W., Seufzger, M., Lutzenberger, S., Tzscheutschler, P., and Wagner, U. (2018b). Impact of probabilistic small-scale photovoltaic generation forecast on energy management systems. Solar Energy 165, 136–146. doi: 10.1016/j.solener.2018.02.069
El-Baz, W., and Tzscheutschler, P. (2017). “Autonomous coordination of smart buildings in microgrids based on a double-sided auction,” in 2017 IEEE Power & Energy Society General Meeting (Chicago, IL: IEEE), 1–5.
El-Baz, W., Tzscheutschler, P., and Wagner, U. (2018c). Day-ahead probabilistic PV generation forecast for buildings energy management systems. Solar Energy 171, 478–490. doi: 10.1016/j.solener.2018.06.100
El-Baz, W., Tzscheutschler, P., and Wagner, U. (2018d). Experimental study and modeling of ground-source heat pumps with combi-storage in buildings. Energies 11:1174. doi: 10.3390/en11051174
El-Baz, W., Tzscheutschler, P., and Wagner, U. (2019). Integration of energy markets in microgrids : a double-sided auction with device-oriented bidding strategies. Appl. Energy 241, 625–639. doi: 10.1016/j.apenergy.2019.02.049
EPISCOPE. IEE Project TABULA. Institut Wohnen und Umwelt GmbH. Available online at: http://episcope.eu/index.php?id=97
Goncalves Da Silva, P., Ilic, D., and Karnouskos, S. (2014). The impact of smart grid prosumer grouping on forecasting accuracy and its benefits for local electricity market trading. IEEE Trans. Smart Grid 5, 402–410. doi: 10.1109/TSG.2013.2278868
Guerrero, J., Chapman, A., and Verbic, G. (2017). “A study of energy trading in a low-voltage network: Centralised and distributed approaches,” in 2017 Australasian Universities Power Engineering Conference (Melbourne, VIC: AUPEC), 1–6.
Hu, M. C., Lu, S. Y., and Chen, Y. H. (2016). Stochastic programming and market equilibrium analysis of microgrids energy management systems. Energy 113, 662–670. doi: 10.1016/j.energy.2016.07.061
Huber, M., Sanger, F., and Hamacher, T. (2013). “Coordinating smart homes in microgrids: a quantification of benefits,” in IEEE PES ISGT Europe 2013, (Lyngby), 1–5.
Hwang, J., Choi, M. I., Lee, T., Jeon, S., Kim, S., Park, S., et al. (2017). Energy prosumer business model using blockchain system to ensure transparency and safety. Energy Proc. 141, 194–198. doi: 10.1016/j.egypro.2017.11.037
Janko, S. A., and Johnson, N. G. (2018). Scalable multi-agent microgrid negotiations for a transactive energy market. Appl. Energy 229, 715–727. doi: 10.1016/j.apenergy.2018.08.026
Kang, J., Yu, R., Huang, X., Maharjan, S., Zhang, Y., and Hossain, E. (2017). Enabling localized peer-to-peer electricity trading among plug-in hybrid electric vehicles using consortium blockchains. IEEE Trans. Indus. Inform. 13, 3154–3164. doi: 10.1109/TII.2017.2709784
Khaqqi, K. N., Sikorski, J. J., Hadinoto, K., and Kraft, M. (2018). Incorporating seller/buyer reputation-based system in blockchain-enabled emission trading application. Appl. Energy 209, 8–19. doi: 10.1016/j.apenergy.2017.10.070
Khorasany, M., Mishra, Y., and Ledwich, G. (2017). “Auction based energy trading in transactive energy market with active participation of prosumers and consumers,” in 2017 Australasian Universities Power Engineering Conference (Melbourne, VIC: AUPEC).
Kriukov, A., Vicol, B., and Gavrilas, M. (2014). “Applying a micro-market inside an electric vehicles parking facility,” in Proceedings of the Universities Power Engineering Conference (Cluj-Napoca).
Lipp, J., and Jungwirth, J. (2011). “Field test with stirling engine micro-CHP-units in residential buildings,” in MicroGEN II Conference (Glasgow).
Maron, H., Klemisch, H., and Maron, B. (2011). Marktakteure Erneuerbare Energie-Anlagen in der Stromerzeugung. Agentur für Erneuerbare Energien, 1–92.
Marzband, M., Sumper, A., Ruiz-álvarez, A., Domínguez-García, J. L., and Tomoiagâ, B. (2013). Experimental evaluation of a real time energy management system for stand-alone microgrids in day-ahead markets. Appl. Energy 106, 365–376. doi: 10.1016/j.apenergy.2013.02.018
Mengelkamp, E., Gärttner, J., Rock, K., Kessler, S., Orsini, L., and Weinhardt, C. (2018). Designing microgrid energy markets: a case study: the Brooklyn Microgrid. Appl. Energy 210, 870–880. doi: 10.1016/j.apenergy.2017.06.054
Noor, S., Yang, W., Guo, M., van Dam, K. H., and Wang, X. (2018). Energy Demand Side Management within micro-grid networks enhanced by blockchain. Appl. Energy 228, 1385–1398. doi: 10.1016/j.apenergy.2018.07.012
Nudell, T. R., Brignone, M., Robba, M., Bonfiglio, A., Delfino, F., and Annaswamy, A. (2017). A dynamic market mechanism for combined heat and power microgrid energy management. IFAC-PapersOnLine 50, 10033–10039. doi: 10.1016/j.ifacol.2017.08.2040
Renewable Energies Agency (2016). Press Fact Sheet: The German Energy Transition. Berlin Energy Transition Dialogue, 1–16.
Santos, G., Pinto, T., Morais, H., Vale, Z., and Praca, I. (2012). “Multi-agent simulation of continental, regional, and micro electricity markets,” in 2012 23rd International Workshop on Database and Expert Systems Applications (Vienna), 331–335.
Tjaden, T., Bergner, J., Weniger, J., and Quaschning, V. (2015). “Representative electrical load profiles of residential buildings in Germany with a temporal resolution of one second,” in Working Paper, HTW Berlin. Berlin: University of Applied Sciences Research, 1–7.
Tushar, W., Yuen, C., Mohsenian-Rad, H., Saha, T., Poor, H. V., and Wood, K. L. (2018). Transforming energy Networks via peer to peer energy trading: potential of game theoretic approaches. IEEE Signal Process. Mag. 35, 90–111. doi: 10.1109/MSP.2018.2818327
Tutuianu, M., Marotta, A., Steven, H., Ericsson, E., Haniu, T., Ichikawa, N., et al. (2014). Development of a World-Wide Worldwide Harmonized Light Duty Driving Test Cycle. Technical Report. The European Commission's Science and Knowledge Service, 7–10.
Weidlich, A., and Veit, D. (2008). A critical survey of agent-based wholesale electricity market models. Energy Econ. 30, 1728–1759. doi: 10.1016/j.eneco.2008.01.003
Keywords: microgrid, Island, grid-connected, energy market, peer-to-peer, energy management systems, energy trading
Citation: El-Baz W, Tzscheutschler P and Wagner U (2019) Evaluation of Energy Market Platforms Potential in Microgrids: Scenario Analysis Based on a Double-Sided Auction. Front. Energy Res. 7:41. doi: 10.3389/fenrg.2019.00041
Received: 15 November 2018; Accepted: 03 April 2019;
Published: 24 April 2019.
Edited by:
Chau Yuen, Singapore University of Technology and Design, SingaporeReviewed by:
Wayes Tushar, University of Queensland, AustraliaNaveed Ul Hassan, Lahore University of Management Sciences, Pakistan
Copyright © 2019 El-Baz, Tzscheutschler and Wagner. This is an open-access article distributed under the terms of the Creative Commons Attribution License (CC BY). The use, distribution or reproduction in other forums is permitted, provided the original author(s) and the copyright owner(s) are credited and that the original publication in this journal is cited, in accordance with accepted academic practice. No use, distribution or reproduction is permitted which does not comply with these terms.
*Correspondence: Wessam El-Baz, wessam.elbaz@tum.de