 Jibran Ali
 Stefano Massucco2
 Federico Silvestro
- 1MEAN4SG & DITEN, University of Genoa, Genova, Italy
- 2DITEN, University of Genoa, Genova, Italy
Modern era is full of renewable energy resources, particularly wind and solar that are installed at both Low and Medium voltage nodes of the distribution system. With the diffusion of new resources in the distribution grid, a new challenge for the system operators is to cope up with the introduced changes in the distribution network. These changes can be on voltage levels, magnitudes and direction of current, and changes in power factor. The reduced visibility of these additives to operators require provision of ancillary services to ensure power system reliability and stability. In order to give flexibility to operator, and in particular DSO for distribution grid, the paper suggests the use of distribution level aggregators to serve as sub-DSO (JDSO). These aggregators utilize the three main components: Electrical energy storage system, customers demand response, and the renewable resources (PV and wind). These aggregators utilize a platform where all these actors can participate. DSO-JDSOs interaction is possible through the platform, and the local problems at distribution can be resolved before it goes to TSO. Paper presents and simulates the platform, develop test cases, and validate the model.
Introduction
Distributed Energy Resources (DERs) are prevalent in the modern power system, with the widespread addition of wind, solar, and other resources (Huanna et al., 2018). These resources create hurdles for the system operators, as they do not have visibility at these levels (Sherick and Yinger, 2017). Therefore, the existing power system infrastructure faces challenges in maintaining power system reliability, stability, and quality (Bokhari et al., 2016; Joshi and Pindoriya, 2017; Lew et al., 2017; Telukunta et al., 2017; Muhanji et al., 2018). DSO at distribution level deals with these issues, with limited visibility to the top-level buses only (Huang et al., 2016; Vilman and Jerele, 2017; Qiu et al., 2018). In next step, TSO on a broad perspective manages the grid at transmission level (Shand et al., 2017; Massaro et al., 2018).
In current market, there is another actor called “Stationary Service Aggregator” which provides services to TSO, and ultimately gives flexibility to TSO where the conventional service providers are only power plants (generators). From another viewpoint, problems due to DERs propagate to these aggregators via DSO, and then TSO (Pudjianto et al., 2017). The idea in this paper is block this chain to DSO level since aggregators exist at DSO level too (Asimakopoulou and Hatziargyriou, 2018; Minniti et al., 2018). It requires a platform for aggregator at DSO level, with the integration, monitoring, and control capabilities using different market players (Han et al., 2017; Yazdani-Damavandi et al., 2017; Ju et al., 2018; Pasetti et al., 2018).
There are a variety of aggregator platform providers with demarcations on software, services, and technology level. Literature further suggests plenty of aggregator platforms, with various protocols, and schemes; use of each protocol at each level is justified in its respective application. The existing platforms include dynamic participation of different actors in a bidirectional manner. This leads to issues of high costs (w.r.t infrastructure and high network traffic), regulatory barriers (as the market needs to be incorporated within the platform, and it varies for different trading regulations), and data handling (it can lead to data privacy issues, requirement of pro-active customers, and a huge human resource). In this paper, the aggregators can only access the run-time service availability of participants, and can procure for service only upon requirement, which requires implementation of different components. The focus here is on the HMI and toolbox, participants, integration, and validation.
The HMI and the toolbox is implemented in LabVIEW real-time, and this is the source of interaction amongst JDSO control box (JDSO-B, i.e., Junior DSO) and DSO. Within JDSO-B, the access is provided to local JDSO customers, storage providers, and the wind-solar participants. Implementation of this platform is done through LabVIEW RT based OPC—socket programming. The paper proposes a pilot scheme for the three providers, and implements them on LabVIEW, MATLAB/Simulink, and DIgSILENT, respectively. All the three actors communicate to JSDO-B through their respective Matrikon based OPC server. Then, a test case is presented to form basis to experimentally simulate the platform. Finally, the validation is done through DIgSILENT.
The structure of the paper is: section Implementation of Wind Farm in DIgSILENT models the wind farm in DIgSILENT, section Implementation of Customers' Participation in LabVIEW demonstrates the demand-response in LabVIEW, and section Implementation of Storage System in MATLAB/Simulink implements storage system in MATLAB/Simulink. Section Development of Matrikon OPC Server and Explorer Platform develops the interface with Matrikon OPC server, client, and explorer; whereas, the J-DSO representation and use-cases are mentioned in section Implementation of LabVIEW-RT Platform and Test Cases Demonstration. Section Validation and Conclusion concludes the paper with validation.
Implementation of Wind Farm in DIgSILENT
A 20 MW wind farm is used, which consists offour wind turbines. Each wind turbine has a nominal apparent power rating and power factor based on (Paul and Rather, 2018). The model is taken from (Wind Farm), with both MPPT and LVRT supports (Uddin and Patel, 2016; He et al., 2017). The model is implemented in DIgSILENT; and the power output for a 24 h test day is noted, with a polling rate of 10 s. The generation profile is shown in Figure 1, and the real power output for 24 h (at an interval of 2 h) is recorded in Table 1.
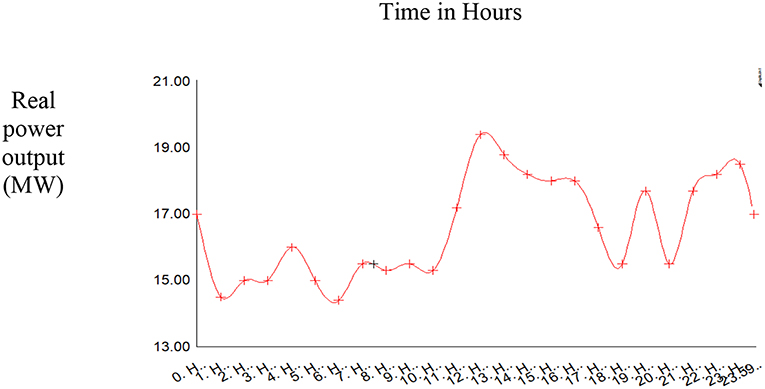
Figure 1. Generation profile—wind.
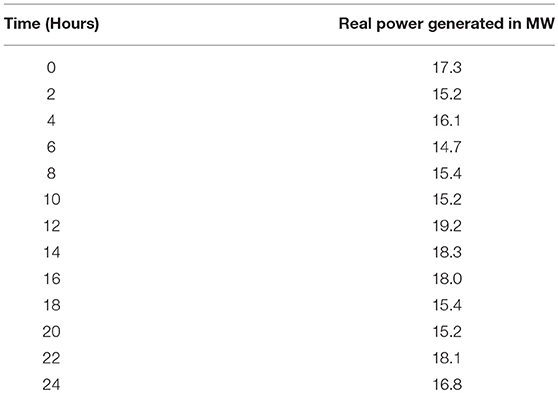
Table 1. Real power output for 24 h.
For later calculations, the per-unit (p.u.) values are used with a base value of 20 MW. Intermittency in real power is clearly visible from Figure 1.
Implementation of Customers' Participation in LabVIEW
The idea is presented, described, and implemented in Ali et al. (2018a), where customers contribute toward ancillary service with the support of presented monitoring and recording tools. The customers participate using the Modbus protocol, where the interaction is amongst the meters and VPP controller. Modbus is used as the meters are compliant with Modbus automatic reading scheme. Details of Modbus communication, addressing, and communication pattern are already discussed in Ali et al. (2018a)1. In this work, there are four customers, which have the capabilities to provide real power reserves via demand-response (Dadkhah and Vahidi, 2018; Padmanabhan et al., 2018). These customers have meters, which are Modbus-compatible (Pereira et al., 2015), and communicate toward the VPP controller in a uni-directional manner.
Four types of customers are residential, commercial, aggregated, and residual. Residential customers are at LV node, while the remaining ones are on MV. For the polling of customer metering information, the Modbus-TCP specific addressing scheme is used2.
The structure is implemented inside LabVIEW using Create TCP Master block for defining the IP address, Set Unit ID block for setting the Modbus id, and Read Holding Registers for defining the specific parameter of the meter, i.e., the real power in the context of this paper2. The structure is shown in Figure 2; however, the values are not indicated for the confidentiality purposes since they come from a real customer. Pink box indicates the IP address, and the box in the middle indicates the Modbus id. The two boxes on the right define the Modbus register and the number of bytes required to acquire the data for the parameter (Ali et al., 2018a).
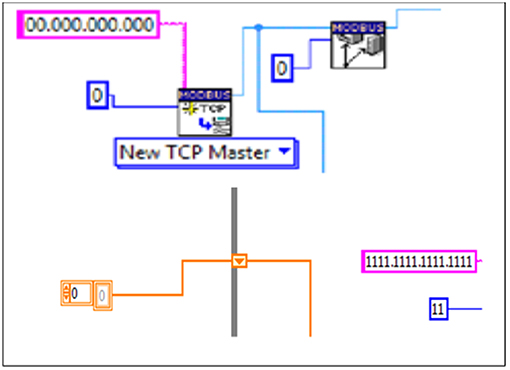
Figure 2. Modbus metering format.
Generation profiles for these four types of customers, for a 24 h test sample, are shown in Figure 3. Table 2 shows the real power output, at some specific time instants, for the different types of customers.
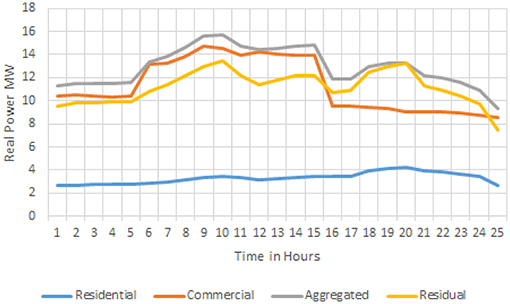
Figure 3. Generation profiles—customers.
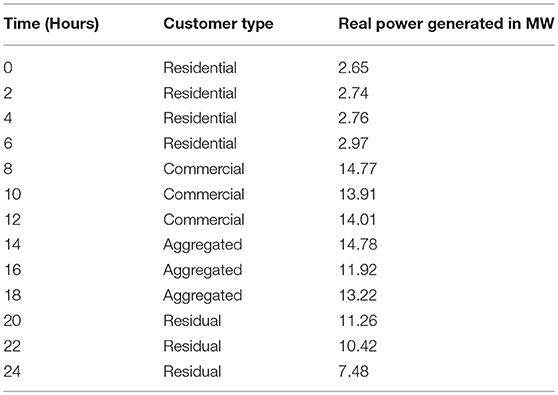
Table 2. Real power output for 24 h—customers.
Implementation of Storage System in MATLAB/Simulink
With the widespread penetration of renewable energy resources, which are not only intermittent but also additives under the existing grid, the idea of storage is the literature best solution to cope with these unplanned changes (Zheng et al., 2017; Liu et al., 2018; Zeraati et al., 2018). Under the umbrella of energy storage, use of battery is the first priority, and the most common and conventional battery technology is based on Lithium-ion cells (Yang et al., 2018). The applications exist in all areas of the modern era (Stroe et al., 2017), and the application of Lithium-ion batteries for distribution system operation is focused here (Satapathy et al., 2018).
The equivalent model for Lithium ion battery is taken from Pei et al. (2018), which is based on the characteristics of self-healing. The battery model, targeting 1 MW loads, is placed at the LV end of the grid. The operating point open-circuit voltage from Pei et al. (2018) is 3.48 Volts, which can stand for a period of 1 h. Therefore, the Watt-hour rating for storage system would be 1 MWh. Consider that the inverter can operate with 85% efficiency; the safe Watt-hour rating for storage system would be 1.18 MWh. The battery capacity would be 339 kAh, the next step is the identification of battery manufacturer, and the number of battery sets in series and parallel.
The selected Lithium ion battery has the nominal capacity of 100 Ah, and complies with the calculated values of maximum depth of discharge, discharge rate factor, and rated capacities. It leads to 3,390 sets of batteries in parallel and 35 sets in series. All the battery related calculations are based on theory and analysis in Masters. The battery is charged using a wind panel, with demonstrations of renewable-storage integration in Wong et al. (2017) and Li et al. (2016), in section Introduction, and the 1 MW loads are added during discharging with the representative customers in section Implementation of Wind Farm in DIgSILENT. An example of the behavior of battery system during charging phase (0–1.4 time instants), discharging phase (1.4–2.8 time instants), and during no-operation periods are shown in Figure 4.
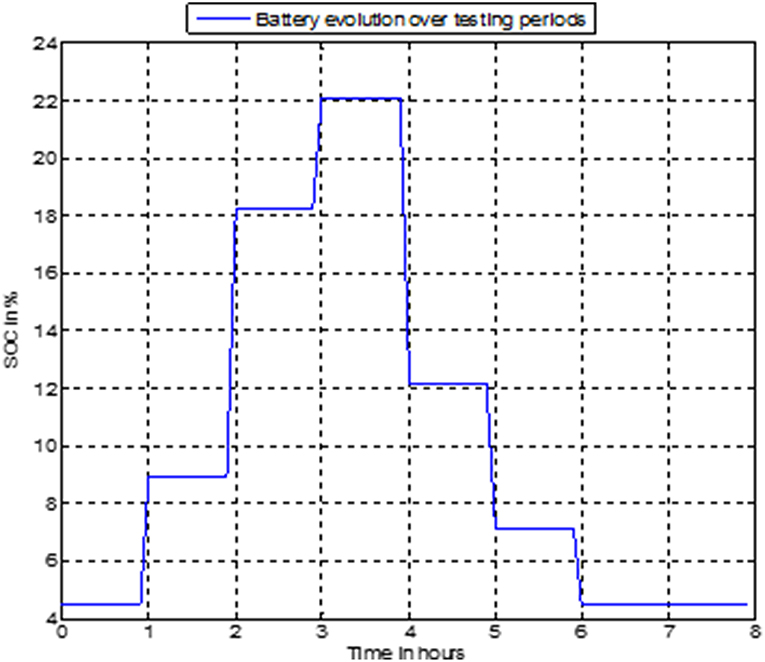
Figure 4. Battery evolution over testing periods.
The SOC values, at some specific time instants, for the battery system are shown in Table 3. Next section describes the interface between the three service providers.
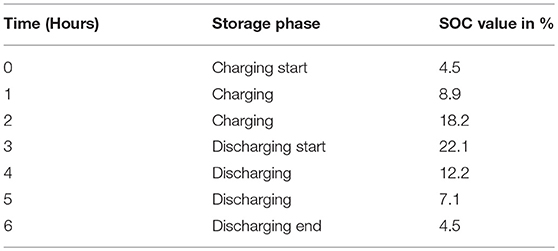
Table 3. SOC output for 24 h—storage.
Development of Matrikon OPC Server and Explorer Platform
Storage, customers, and renewable resources have their individual capabilities within their particular management systems. In order to provide inter-zonal monitoring and control capabilities, these three zones need to communicate with one another. For this purpose, OPC (Object Linking and Embedding for process control) communication mechanism is used (Bajer, Anwar et al., 2004)3. Service providers (DIgSILENT, MATLAB/Simulink, and LabVIEW) and the control platform (LabVIEW RT) are both compatible with OPC standard (Gonzalez-Longatt and Torres, 2017)4,5,6. The developed co-interface platform is shown in Figure 5.
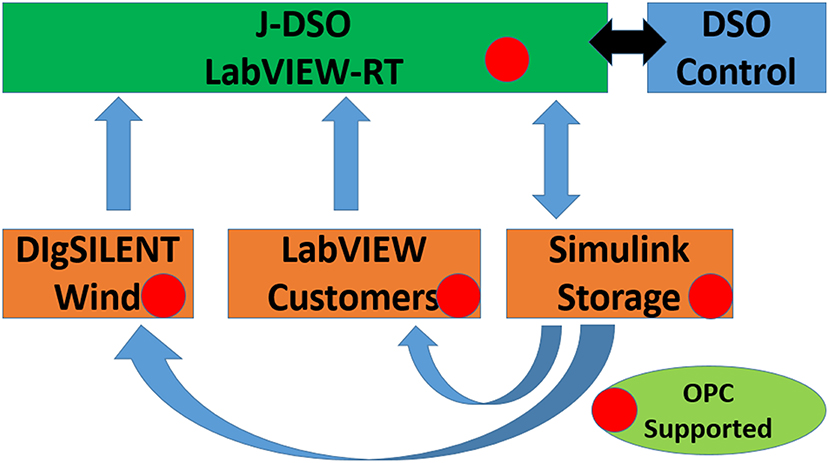
Figure 5. Co-interface platform.
JDSO can read the real-time tags of real power reserves at DIgSILENT based wind farm, real power reserves at LabVIEW based customers, and SOC values at MATLAB/Simulink based Li-ion storage system. Reactive power is also an important parameter to view, but the significance in the context of this paper is low due to two reasons:
1- For LV and MV, the real power characteristics are more similar to distribution level voltages, as compared to reactive power.
2- Use of storage system is battery based.
However, the platform includes both real and reactive powers for future potential extensions. For homogeneity reasons, SOC values are mapped to real power (from percentage to per-unit to actual) by reversing the conversion in Xie et al. (2017). Next step is the definition of tags that can be monitored and configured via OPC Explorer.
There are six tags created overall; tag 1 describes the real power generated by wind farm at its output node, tag 2 describes the real power generated by customers' demand-response with flags indicating the types of customers, tag 3 gives the effective real power values by Lithium storage, while the remaining tags are created for J-DSO. For J-DSO, three tags represent the real power, reactive power, and the circuit breaker status with flags identifying the individual participants and their aggregation. The communication between J-DSO and DSO-DMS can be through LAN—Local Area Network (Ethernet) or WAN—Wide Area Network (ATM—Asynchronous Transfer Mode or SONET—Synchronous Optical Network) (Minoli, 2003).
It works on server/client configuration. The servers extract the information/data from industrial devices, and then these servers communicate with the clients. These clients can be software like MATLAB/Simulink, DIgSILENT etc. The interesting part is that clients can order information/and send data to the servers, and the approach is basically client-driven. There are different types of OPC, for which the more relevant ones are DA (Data Access), AE (Alarm and Events), and HDA (Historical Data Access). For the context of current study, OPC-DA is the point of focus. DA includes data, timestamp, and quality (sort of data validity flag) (Halvorsen, 2011)7. The OPC server, clients, and explorer based platform, with all OPC tags, are shown in Figure 6.
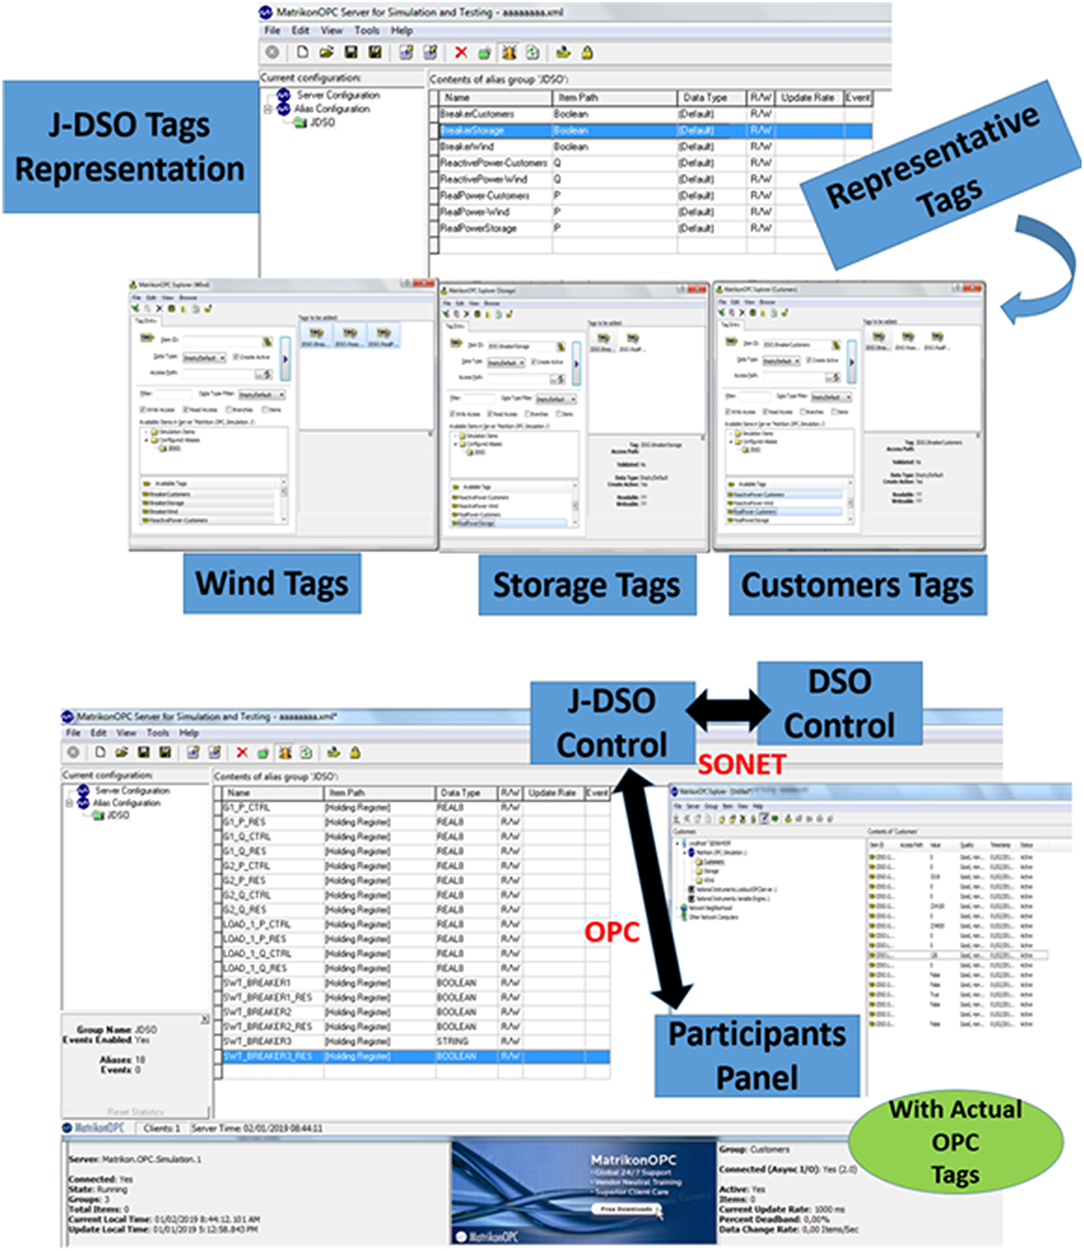
Figure 6. OPC server-clients-explorer platform.
Implementation of LabVIEW-RT Platform and Test Cases Demonstration
There are different ways through which LabVIEW can communicate with an OPC server. It is possible through data sockets with a LabVIEW real-time module, LabVIEW DSC module etc. It depends on capability in terms of UA, and other features. The point of focus here is the data sockets based LabVIEW communication with a LabVIEW real- time module. It breaks it into two parts (OPC and OPC UA, 2000; Halvorsen, 2011):
1- Implementing a data socket platform in LabVIEW which can read from OPC server8,10.
2- Connecting it with real-time module, so that the ports communicate with each other for the three clients here6,9.
It can take the OPC server URL, in a specified format as in (Halvorsen, 2011)7,10 and take tags to be displayed one at a time6,8,9. With the data logging support of LabVIEW RT, OPC data items can be accessed through URL in the specified format of OPC-Machine identification-Server location-Tag selection6,8,9,10. The developed interface is shown in Figure 7.
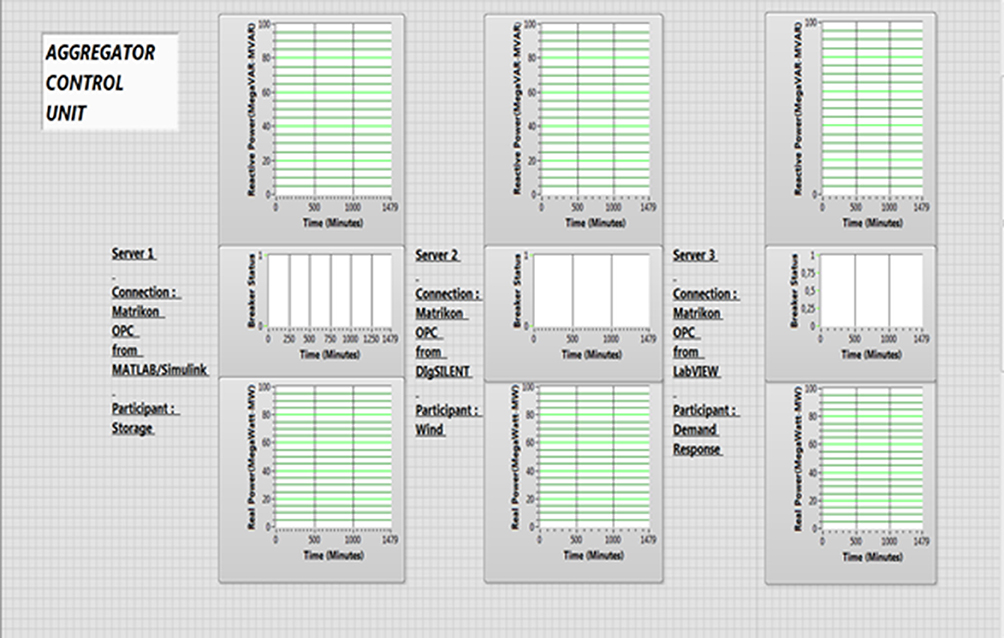
Figure 7. J-DSO platform.
Next step is the description of test cases for the support of DSO in provision of ancillary services, and managing local issues with flexibility from VPP based J-DSO. These test cases will be validated in the next section. The concept of test cases is extracted from ISGAN (2014), with added details from Ali et al. (2018a,b).
Test Case 1: Over Voltage Issue at Distribution Substation Buses
At time = 2 h, DSO suffers over-voltage issues at one of its distribution substation. DSO procures service from J-DSO for real and reactive power, and then J-DSO manages the offers from three providers. Based on its analysis, J-DSO then provides the service to DSO for voltage support.
Test Case 2: Congestion Issue Due to Overloading at Distribution Substation Buses
At time = 8 h, DSO suffers congestion issues at one of its distribution substation. DSO procures service from J-DSO for real power, and then J-DSO manages the offers from three providers. Based on its analysis, J-DSO then provides the service to DSO for congestion relief. Next section simulates the two test cases, and compares it with separate DIgSILENT based analysis for validation of the platform.
Validation and Conclusion
For the 24-h profile of the contributions by renewables, customers, and storage systems; the followings steps are taken for the start of validation process:
1- A distribution grid is modeled in DIgSILENT. The distribution network is taken from the dissemination of the project called ATLANTIDE as in Pilo et al. (2013), Pilo et al. (2012) and Pilo et al. (2014). The 20 KV MV network consists of 103 nodes, and 7 feeders to feed the 190 MV loads. The network is shown in Figure 8 (Pilo et al., 2012, 2013, 2014).
2- Load profile is created for the network for a 24-h time; with 1-h intervals. Dynamic behavior is then modeled using the Hermite approximation facility under DigSILENT.
3- Generation profiles (storage, customers, and wind), from sections Implementation of Wind Farm in DIgSILENT, Implementation of Customers' Participation in LabVIEW, and Implementation of Storage System in MATLAB/Simulink, are added to the primary node (just after transformer low voltage end). The node is named as N-test.
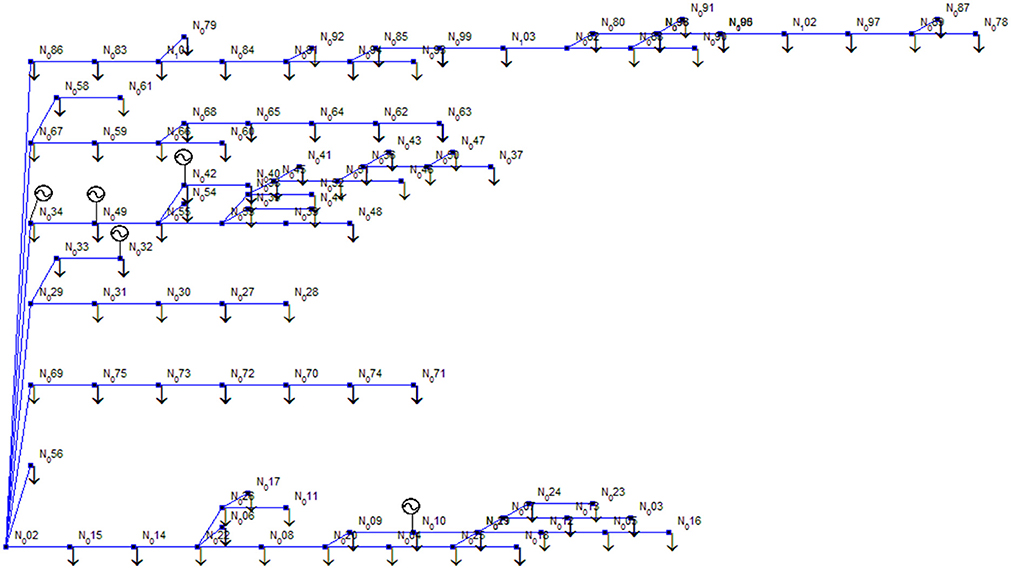
Figure 8. Distribution network from Pilo et al. (2012, 2013, 2014).
These steps create the validation platform for the two test cases presented in the previous section. Next step is to represent over-voltage and over-load conditions in the presented network. For the ease of analysis, the checkpoint is considered N-test only. In other words, overload and over-voltage due to any reasons are reflected, restored, and analyzed at N-test only. The distribution network follows IEC 61850 standard, and hence the data is exchanged as sampled values using process bus.
For the over-voltage, the concept is extracted from Mustafa et al. (2013), which focuses on the concept of lightning strikes as a major source of over-voltage. The concept is used only for simulation purposes; however, it has no implications in actual grid. In other words, a fault at ground level is created on neighboring node (Node 7 here). Overloading is created by increasing real power by 150% in neighboring nodes (Node 23 and 57 here). The results, based on Table 4, are recorded and observed.
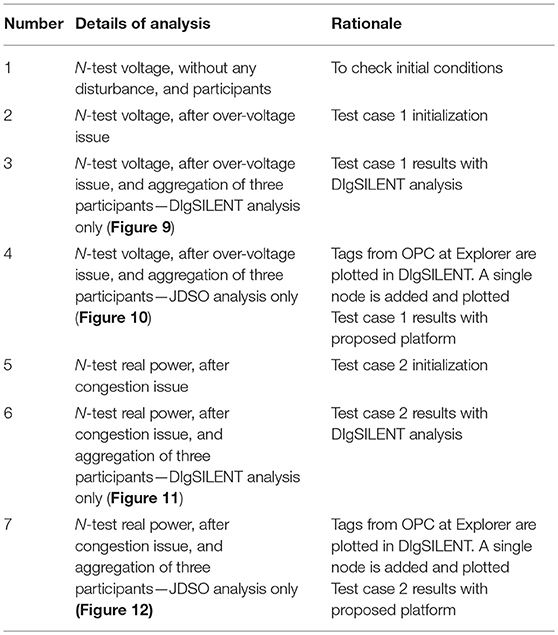
Table 4. Validation table for analysis.
Figure 9 shows the per-unit voltage at node 2 (the test node) with DIgSILENT based simulations. The profile complies with voltage loading criterion, and hence there are no technical issues within the network. Figure 10 shows the same analysis results with the use of platform, and there are minor variations for the following reasons:
1- Pauses in receiving contributions from customers due to Modbus delays. These delays increase with the increase in customers. The delay is negligible in case of just a single customer
2- Tags are rounded up to 2 decimal places, and hence vary with DIgSILENT actual data values.
3- Tags are sampled at a rate of 0.5/s.
4- Delay in validity check of tag flags.
5- Generation of representative tags by DIgSILENT and MATLAB/Simulink takes a little pause.
6- Delays in reading the data sockets
7- Error with hermite representation for creating quasi-dynamic profile in DIgSILENT analysis
8- Errors in conversion of values from SOC to real power for storage system.
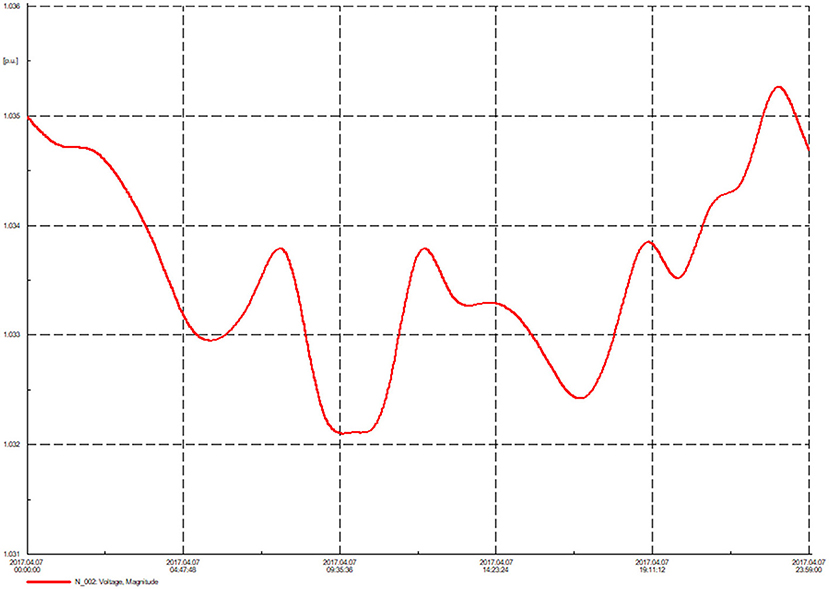
Figure 9. Test case 1—with DIgSILENT.
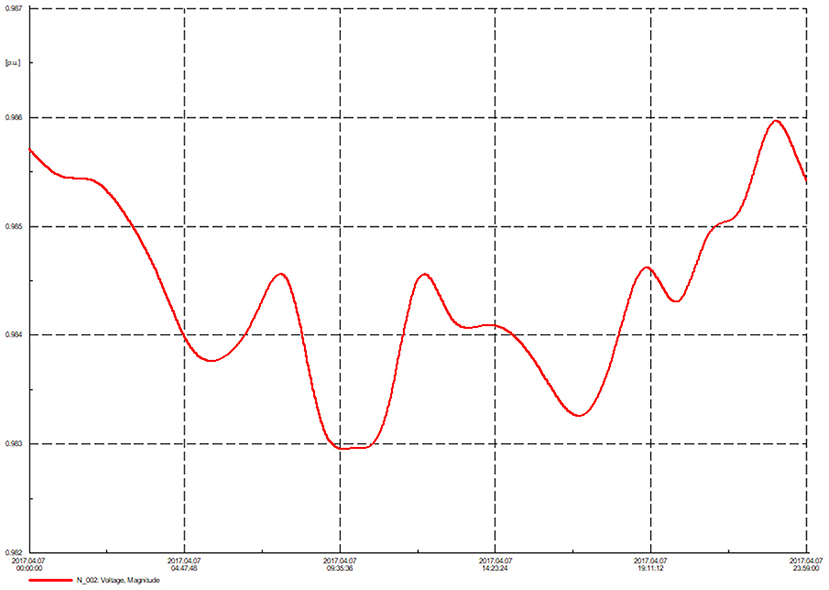
Figure 10. Test case 1—with J-DSO.
Figure 11 shows the loading associated with node 2 line (the test node), in percentage, with DIgSILENT based simulations. Figure 12 shows the same analysis results with the use of platform. There are no congestion issues in the network. There are minor variations due to the same reasons as described above.
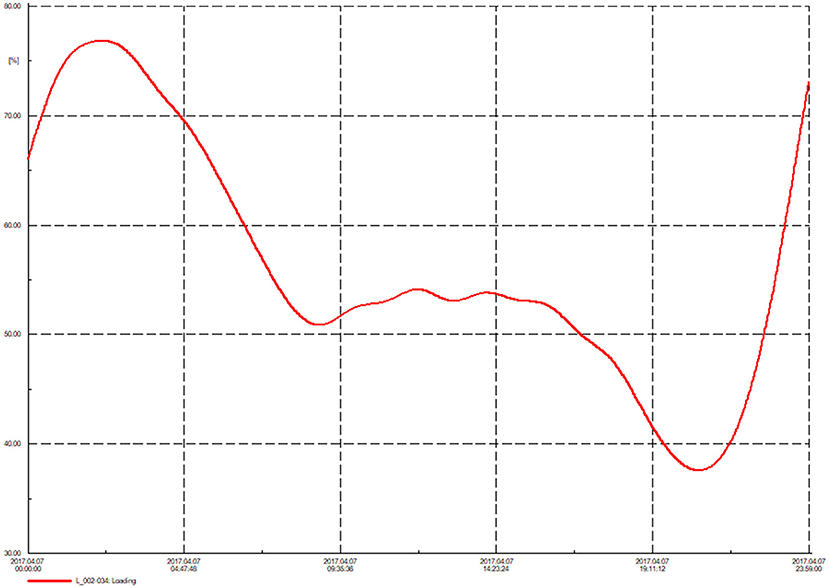
Figure 11. Test case 2—with DIgSILENT.
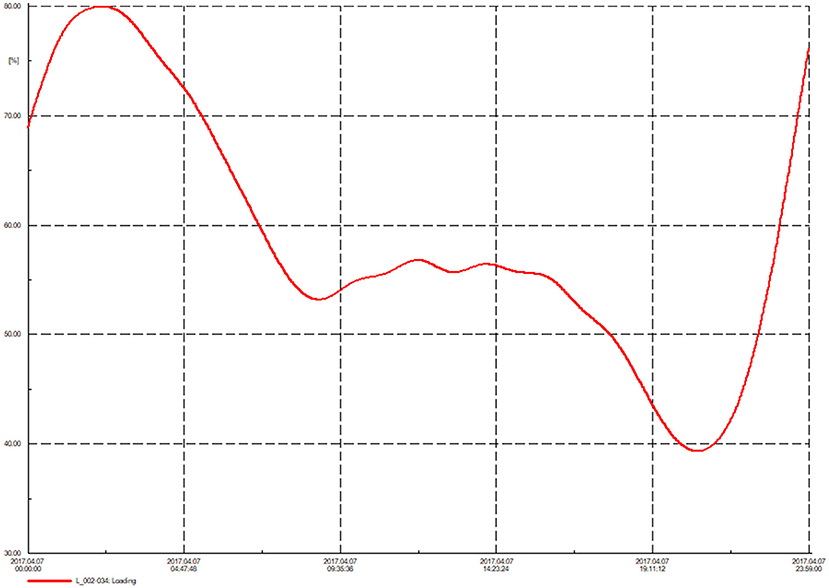
Figure 12. Test case 2—with J-DSO.
For the distribution grid in DIgSILENT, it is observed that there are no over-voltage and over-load conditions. The grid is then disturbed with over-voltage and over loading, and then the issue is resolved with two techniques:
1- VPP with separate controls for their participants, and the centralized proposed platform
2- With the simulations of participants under DIgSILENT
Since the focus of this paper is on platform, therefore, the plots for only the platform related comparisons are provided. Details of integration at components level and optimal placements are application oriented, as in Viet et al. (2018) and Duong et al. (2019). The applications may vary from optimal placement of storage systems, renewables, and peak shaving to challenges on grid stability and reliability within the specific integration requirements. For the specific application of communication amongst tags, the platform is tested.
Figures 9–12 validate the performance of the proposed platform, with minor variations due to communication delays and tags rounding errors. To conclude, the paper incorporates the use of virtual power plant and its participants at DSO level, with a tool that can serve as sub-terminal between DSO and VPP actors at distribution level. The tool is validated with DIgSILENT, using DSO based test cases and a test bed Italian distribution network. Future work may include validation within a real-time tool with PHIL (Power Hardware in the Loop) capabilities like RTDS (Real time Digital Simulator) or OPAL-RT.
Author Contributions
JA did the conceptualization, and writing of the original draft; All authors contributed to the methodology, analysis and results; SM and FS provided the supervision, and review/editing of the original manuscript. The article is part of dissemination of EU Horizon 2020 funded Project MEAN4SG (Grant Number: 676042), under ESR-6.
Conflict of Interest Statement
The authors declare that the research was conducted in the absence of any commercial or financial relationships that could be construed as a potential conflict of interest.
Acknowledgments
 This project has received funding from the European Union's Horizon 2020 research and innovation programme under the Marie Sklodowska-Curie grant agreement No. 676042.
Footnotes
1. ^Introduction to Modbus using LabVIEW. Available online at: ni.com/white-paper/7675/en/
2. ^Introduction to Modbus TCP/IP. Available online at: prosoft-technology.com/kb/assets/intro_modbustcp.pdf
3. ^OPC Specifications, OPC Data Access (OPC-DA). Available online at: matrikonopc.com/resources/opcspecifications/opc-da.aspx/
4. ^Read and Write Data From OPC Servers and Data Historians. Available online at: https://www.mathworks.com/products/opc.html
5. ^How Can I Interface an OPC Server and PowerFactory and Exchange Data Between Them? Available online at: https://www.digsilent.de/en/faq-reader-powerfactory/how-can-i-interface-opc-server-and-powerfactory-and-exchange-data-between-them.html
6. ^OPC with LabVIEW Software Options. Available online at: https://knowledge.ni.com/KnowledgeArticleDetails?id=kA00Z0000019MwxSAE&l=it-IT
7. ^OPC and OPC UA Explained. Available online at: https://www.novotek.com/en/solutions/kepware-communication-platform/opc-and-opc-ua-explained
8. ^Matrikon OPC to Labview. Available online at: https://forums.ni.com/t5/LabVIEW/MatrikonOPC-to-Labview/td-p/2726765
9. ^Connecting LabVIEW to an OPC Server Using Front Panel DataSocket. Available online at: http://www.ni.com/tutorial/3980/en/
10. ^Creating. URL path for OPC. Available online at: https://forums.ni.com/t5/LabVIEW/Creating-URL-path-for-OPC/td-p/932948
References
Ali, J., Massucco, S., and Silvestro, F. (2018b). “Architecture of virtual power plant for ancillary services,” in Proceedings of CIRED Workshop (Ljubljana).
Ali, J., Massucco, S., Silvestro, F., and Vinci, A. (2018a). “Participation of customers to virtual power plants for reactive power provision,” in Proceedings of the 53rd UPEC. Glasgow: IEEE.
Anwar, M. R., Anwar, O., Shamim, S. F., and Zahid, A. A. (2004). “Human machine interface using OPC (OLE for Process Control),” in Proceedings of the Student Conference on Engineering, Sciences and Technology (Karachi: IEEE).
Asimakopoulou, G. E., and Hatziargyriou, N. D. (2018). Evaluation of economic benefits of DER aggregation. IEEE Trans. Sust. Energy 9, 499–510. doi: 10.1109/TSTE.2017.2743349
Bajer, M. Control Systems Integration Using OPC Standard. AGH University of Science and Technology. doi: 10.13140/RG.2.2.29713.74085. Available online at: https://www.researchgate.net/profile/Marcin_Bajer/publication/259258028_Control_Systems_Integration_using_OPC_Standard/links/59ccabcfa6fdcc451d617923/Control-Systems-Integration-using-OPC-Standard.pdf.,
Bokhari, A., Raza, A., Diaz-Aguilò, M., de Leòn, F., Czarkowski, D., Uosef, R. E., et al. (2016). Combined effect of CVR and DG penetration in the voltage profile of low-voltage secondary distribution networks. IEEE Trans Power Delivery 31, 286–293. doi: 10.1109/TPWRD.2015.2422308
Dadkhah, A., and Vahidi, B. (2018). On the network economic, technical and reliability characteristics improvement through demand-response implementation considering consumers' behaviour. IET Gen. Transm. Distr. 12, 431–440. doi: 10.1049/iet-gtd.2017.0554
Duong, M. Q., Pham, T. D., Nguyen, T. T., Doan, A. T., and Tran, H. V. (2019). Determination of optimal location and sizing of solar photovoltaic distribution generation units in radial distribution systems. Energies 12:174. doi: 10.3390/en12010174
Gonzalez-Longatt, F. M., and Torres, J. L. R. (2017). Advanced Smart Grid Functionalities Based on PowerFactory. Springer. doi: 10.1007/978-3-319-50532-9
Han, X., Zhou, M., Li, G., and Lee, K. Y. (2017). Optimal dispatching of active distribution networks based on load equilibrium. Energies 10:2003. doi: 10.3390/en10122003
He, J., Li, Q., Ma, J., Zhang, W., and Zhao, Y. (2017). Research on capacity configuration method of concentrated reactive power compensator for wind farm LVRT capability. J. Eng. 2017, 2428–2432. doi: 10.1049/joe.2017.0765
Huang, S., Wu, Q., Cheng, L., Liu, Z., and Zhao, H. (2016). Uncertainty management of Dynamic Tariff Method for Congestion Management in Distribution Networks. IEEE Trans. Power Syst. 31, 4340–4347. doi: 10.1109/TPWRS.2016.2517645
Huanna, N., Lu, Y., Jingxiang, Z., Yuzhu, W., Weizhou, W., and Fuchao, L. (2018). Flexible-regulation resources planning for distribution networks with a high penetration of renewable energy. IET Gen. Transm. Distr. 18, 4099–4107. doi: 10.1049/iet-gtd.2018.5531
ISGAN (2014). TSO-DSO interaction: An Overview of current interaction between transmission and distribution system operators and an assessment of their cooperation in Smart Grids, ISGAN discussion paper, 2014. Available online at: https://smartgrids.no/wp-content/uploads/sites/4/2016/01/ISGAN-TSO-DSO-interaction.pdf
Joshi, K. A., and Pindoriya, N. M. (2017). Case-specificity and its implications in distribution network analysis with increasing penetration of photovoltaic generation. CSEE J Power Energy Syst. 3, 101–113. doi: 10.17775/CSEEJPES.2017.0013
Ju, L., Li, P., Tan, Q., Tan, Z., and De, G. (2018). A CVaR-robust risk aversion scheduling model for virtual power plants connected with windphotovoltaic-hydropower-energy storage systems, conventional gas turbines and incentive-based demand responses. Energies 11:2903. doi: 10.3390/en11112903
Lew, D., Asano, M., Boemer, J., Ching, C., Focken, U., Hydzik, R., et al. (2017). The power of small: the effects of distributed energy resources on system reliability. IEEE Power Energy Mag. 15, 50–60. doi: 10.1109/MPE.2017.2729104
Li, Q., Ayyanar, R., and Vittal, V. (2016). Convex optimization for DES planning and operation in radial distribution systems with high penetration of photovoltaic resources. IEEE Trans. Sust. Energy 7, 985–995. doi: 10.1109/TSTE.2015.2509648
Liu, L., Matayoshi, H., Lotfy, M. E., Datta, M., and Senjyu, T. (2018). Load frequency control using demand response and storage battery by considering renewable energy sources. Energies 11:3412. doi: 10.3390/en11123412
Massaro, F., Ippolito, M. G., Zizzo, G., Filippone, G., and Puccio, A. (2018). Methodologies for the exploitation of existing energy corridors. Gis Analysis and Dtr Applications. Energies 11:979. doi: 10.3390/en11040979
Minniti, S., Haque, N., Nguyen, P., and Pemen, G. (2018). Local markets for flexibility trading: key stages and enablers. Energies 11:3074. doi: 10.3390/en11113074
Muhanji, S. O., Muzhikyan, A., and Amro, M. F. (2018). Distributed control for distributed energy resources: long-term challenges and lessons learned. IEEE Access 6, 32737–32753. doi: 10.1109/ACCESS.2018.2843720
Mustafa, T. I. A. H., Almaguer, H. D., Meyer, L. H., Cabral, S. H. L., Baader, J. E., Tello, M., et al. (2013). “A model for the analysis of overvoltage in power distribution network including the TLM method,” in Proceedings of International Conference on Power Engineering, Energy and Electrical Drives (Istanbul).
Padmanabhan, N., Ahmed, M., and Bhattacharya, K. (2018). Simultaneous procurement of demand response provisions in energy and spinning reserve markets. IEEE Trans. Power Syst. 33, 4667–4682. doi: 10.1109/TPWRS.2018.2806879
Pasetti, M., Rinaldi, S., and Manerba, D. (2018). A virtual power plant architecture for the demand-side management of smart prosumers. Appl. Sci. 8:432. doi: 10.3390/app8030432
Paul, S., and Rather, Z. H. (2018). A pragmatic approach for selecting a suitable wind turbine for a wind farm considering different metrics. IEEE Trans. Sust. Energy 9, 1648–1658. doi: 10.1109/TSTE.2018.2805262
Pei, Z., Zhao, X., Yuan, H., Peng, Z., and Wu, L. (2018). An equivalent circuit model for lithium battery of electric vehicle considering self-healing characteristic. Hindawi J. Contr. Sci. Eng. 2018:5179758. doi: 10.1155/2018/5179758
Pereira, R., Figueiredo, J., Melicio, R., Mendes, V. M. F., Martins, J., and Quadrado, J. C. (2015). Consumer energy management system with integration of smart meters. Elsevier Energy Rep. 1, 22–29. doi: 10.1016/j.egyr.2014.10.001
Pilo, F., Pisano, G., Ruggeri, S., Scalari, S. D., Canto, D., Petretto, G., et al. (2013). “Applications of DMS in the atlantide project: models and tools,” in Proceedings of CIRED Conference (Stockholm). doi: 10.1049/cp.2013.1261
Pilo, F., Pisano, G., Scalari, S. D., Canto, D., Testa, A., Langella, R., et al. (2012). “ATLANTIDE – Digital archive of the Italian electric distribution reference networks,” in Proceedings of CIRED Workshop (Lisbon). doi: 10.1049/cp.2012.0783
Pilo, F., Pisano, G., Soma, G. G., Canto, D. D., Gigliucci, G., Petretto, G., et al. (2014). “Advanced active distribution simulations with the ATLANTIDE web cloud facilities,” in Proceedings of CIRED Workshop (Rome).
Pudjianto, D., Strbac, G., and Boyer, D. (2017). Virtual power plant: managing synergies and conflicts between transmission system operator and distribution system operator control objectives. CIRED Open Access Proc. J. 2017, 2049–2052. doi: 10.1049/oap-cired.2017.0829
Qiu, J., Xu, Z., Zheng, Y., Wang, D., and Dong, Z. Y. (2018). Distributed generation and energy storage system planning for a distribution system operator. IET Renew Power Gen. 12, 1345–1353. doi: 10.1049/iet-rpg.2018.5115
Satapathy, P., Dhar, S., and Dash, P. K. (2018). Performance validation of battery management system under prediction error for photovoltaic based distribution system. IET Renew. Power Gen. 12, 702–717. doi: 10.1049/iet-rpg.2017.0286
Shand, C., Taylor, G., Stewart, E., Roberts, C., Mcmorran, A., and Mohapatra, P. (2017). Improving actionable observability of large distribution networks for transmission operators to support improved system control, fault detection and mitigation. CIRED Open Access Proc. J. 2017, 1215–1218. doi: 10.1049/oap-cired.2017.1199
Sherick, R., and Yinger, R. (2017). Modernizing the California grid: preparing for a future with high penetrations of distributed energy resources. IEEE Power Energy Magaz. 15, 20–28.doi: 10.1109/MPE.2016.2637159
Stroe, D.-I., Knap, V., Swierczynski, M., Stroe, A.-I., and Teodorescu, R. (2017). Operation of a grid-connected lithium- ion battery energy storage system for primary frequency regulation: a battery lifetime perspective. IEEE Trans. Indus. Appl. 53, 430–438. doi: 10.1109/TIA.2016.2616319
Telukunta, V., Pradhan, J., Agrawal, A., Singh, M., and Srivani, S. G. (2017). Protection challenges under bulk penetration of renewable energy resources in power systems: a review. CSEE J Power Energy Syst. 3, 365–379. doi: 10.17775/CSEEJPES.2017.00030
Uddin, M. N., and Patel, N. (2016). Maximum power point tracking control of IPMSG incorporating loss minimization and speed sensorless schemes for wind energy system. IEEE Trans. Industry Appl. 52, 1902–1912. doi: 10.1109/TIA.2015.2510507
Viet, D. T., Phuong, V. V., Duong, M. Q., Khanh, M. P., Kies, A., and Schyska, B. A. (2018). “A Cost-optimal pathway to integrate renewable energy into the future vietnamese power system,” in Proceedings IEEE International Conference on Green Technology and Sustainable Development (Ho Chi Minh City).
Vilman, A., and Jerele, M. (2017). Voltage quality provision in low-voltage networks with high penetration of renewable production. CIRED Open Access Proc. J. 2017, 2053–2056. doi: 10.1049/oap-cired.2017.0889
Wind Farm. Base Case. Version 15.1 PowerFactory. Available online at: digsilent.de
Wong, S., Gaudet, G., and Proulx, L.-P. (2017). Capturing wind with thermal energy storage - summerside's smart grid approach. IEEE Power Energy Technol. Syst. J. 4, 115–124. doi: 10.1109/JPETS.2017.2754139
Xie, S., Xiong, R., Zhang, Y., and He, H. (2017). The estimation of state of charge for power battery packs used in hybrid electric vehicle. Elsevier Energy Proc. 105, 2678–2683. doi: 10.1016/j.egypro.2017.03.774
Yang, J., Du, C., Wang, T., Gao, Y., Cheng, X., Zuo, P., et al. (2018). Rapid prediction of the open-circuit-voltage of lithium ion batteries based on an effective voltage relaxation model. Energies 11:3444. doi: 10.3390/en11123444
Yazdani-Damavandi, M., Neyestani, N., Chicco, G., Shafie-khah, M., and Catalao, J. P. S. (2017). Aggregation of distributed energy resources under the concept of multienergy players in local energy systems. IEEE Trans. Sust. Energy 8, 1679–1693. doi: 10.1109/TSTE.2017.2701836
Zeraati, M., Golshan, M. E. H., and Guerrero, J. M. (2018). Distributed control of battery energy storage systems for voltage regulation in distribution networks with high PV penetration. IEEE Trans. Smart Grid 9, 3582–3593. doi: 10.1109/TSG.2016.2636217
Keywords: power system simulation, ICT for future grid, renewable energy resources, smart grid, aggregators, demand response, integration platform, storage system
Citation: Ali J, Massucco S and Silvestro F (2019) Distribution Level Aggregator Platform for DSO Support—Integration of Storage, Demand Response, and Renewables. Front. Energy Res. 7:36. doi: 10.3389/fenrg.2019.00036
Received: 08 February 2019; Accepted: 14 March 2019;
Published: 02 April 2019.
Edited by:
Minh Quan Duong, Da Nang University of Technology, VietnamReviewed by:
Gabriela Nicoleta Sava, Politehnica University of Bucharest, RomaniaMohammad Abdul Mannan, American International University-Bangladesh, Bangladesh
Copyright © 2019 Ali, Massucco and Silvestro. This is an open-access article distributed under the terms of the Creative Commons Attribution License (CC BY). The use, distribution or reproduction in other forums is permitted, provided the original author(s) and the copyright owner(s) are credited and that the original publication in this journal is cited, in accordance with accepted academic practice. No use, distribution or reproduction is permitted which does not comply with these terms.
*Correspondence: Jibran Ali, amlicmFuLmFsaUBlZHUudW5pZ2UuaXQ=; amlicmFuYWxpLm1lYW40c2dAZ21haWwuY29t