 Xiaoqin Sun
 Mario A. Medina
 Yuan Zhang3
94% of researchers rate our articles as excellent or good
Learn more about the work of our research integrity team to safeguard the quality of each article we publish.
Find out more
ORIGINAL RESEARCH article
Front. Energy Res., 22 February 2019
Sec. Indoor Environment
Volume 7 - 2019 | https://doi.org/10.3389/fenrg.2019.00013
This article is part of the Research TopicNew Materials and Design of the Building EnclosureView all 7 articles
This paper presents results of the potential thermal enhancement in building walls derived from using phase change materials (PCMs). Typical North American construction, namely, frame walls outfitted with hydrated-salt-based PCM with a melting temperature of 29°C were evaluated in well-controlled test houses under full weather conditions. It was found that PCMs produced reductions in energy gains during summer. The reductions were assessed via total heat transfer and peak heat transfer. For a 10 percentage by weight (wt%) PCM concentration, the largest peak flux reduction of 31.25% was observed when the PCM was integrated within a north-facing wall. For a 20 wt% PCM concentration, the largest peak flux reduction was 25.54% when the PCM pipes was installed on an east-facing wall. Doubling the amount of PCM did not produce improvement on heat flux reduction except for the east-facing wall. The indoor wall surface temperature and temperature amplitude was reduced by 1.5 and 1.4°C, respectively. The maximum time lag for peak heat flux was observed on the north-facing wall, which was 1.5 h for a 10 wt% PCM concentration and 2.25 h for a 20 wt% PCM concentration, respectively. To achieve the maximum energy savings, it is recommended that the PCMs be installed within west-facing walls.
Buildings are responsible for about 40% of US energy consumption. They are the major source of green gas emission as a result of their energy and material demands. A significant fraction of the energy that is consumed is to deal with thermal losses or gains occurring through building enclosures. To accomplish the proposed Architecture 2030 Challenge1 it is important to reduce a part of this energy consumption. The integration of phase change materials (PCMs) to building walls has proven to be an effective method to reduce heat transfer through building enclosures and shift a part of the peak load to other times of the day (Kośny et al., 2007, 2012a,b, 2014; Konuklu et al., 2015; Guldentops et al., 2018; Song et al., 2018). PCMs work by storing relatively large amounts of heat when melting without transferring it to the indoor environment when the outdoor temperature is higher than the indoor air temperature. This heat is released upon solidification of the PCMs when the surrounding-to-the-PCM temperatures drop below the PCM solidification point. Moreover, the utilization of PCM reduces the wall volume significantly but keeps the thermal parameters at the same level as in traditional wall structures. Thus, an increase in the useable living area of a building is obtained (Chwieduk, 2013).
For building applications, the phase changes are predominantly of the solid-liquid transitions, and PCMs can be organic (e.g., paraffins, waxes, and oils) or inorganic (e.g., hydrated salts). There also exist PCMs that are mixtures of organic and inorganic compounds and some that are contained within hydrophilic silica powders. The main technical causes that prevent PCMs from being applied widely in practice are related to the conditioning of phase-change element materials. The material must be completely sealed to prevent leakage of the product during the melting process and material composition changes through contact with the environment. Macro-encapsulation method, which comprises the inclusion of PCM in packages such as tubes, pouches, spheres, panels or other receptacles, is attractive. Cui et al. (2017) proposed a macro-encapsulated PCM using hollow steel balls (HSB) and the mechanical performance of PCM-HSB concrete was examined. They found that the indoor air temperature was reduced by up to 6.5°C compared with standard concrete panels. Alam et al. (2014) investigated Australian residential buildings with pouch macro-encapsulated bio-based PCMs. Annual energy savings of 17–23% in space cooling were found. With the same type of PCM, Ramakrishnan et al. (2017) simulated the thermal performance of a detached single-story house without active air-conditioning system using PCM as inner linings of ceilings and walls. High temperature within the wall was decreased as the PCM layer increased. Gounni and El Alami (2017) tested the thermal performance of panel-encapsulated PCM. The results showed that the internal wall surface temperature was reduced by 2°C. Vicente and Silva (2014) built three similar wall specimens, two with PCM encapsulated in steel rectangular. The wall specimens were constituted by horizontally hollowed fired clay bricks (30 × 20 × 15 cm) with insertion of macro encapsules (30 × 17 × 2.8 cm format and 0.75 mm thickness) filled with organic PCM. It was found that the heat storage capacity was increased significantly, and the thermal amplitude was reduced.
Besides the encapsulation methods, the design parameter of a building wall enhanced by PCM directly impact the thermal dynamics of the wall. Identifying the best design parameters of the PCM is the other main key to apply this technology effectively. To realize an optimal storage effect during a complete day, Kuznik et al. (2015) analyzed the impact of PCM wallboard physical properties on annual heating demand using TRNSYS. It was found that when the PCM wallboard thickness was between 10 and 20 mm, the heating reduction was a flat curve. While, the heating reduction decreased when the thickness was above 20 mm. They recommended that the PCM thickness must be optimized for its use with an optimal storage effect during a complete day (Kuznik et al., 2008). Similarly, Sun et al. (2016) analyzed the energy efficiency of panel macro-encapsulated PCM for a building envelope. It was concluded that the maximum thickness of PCM panel should be <5 mm in various climatic regions in China; otherwise, the PCM board would not be fully charged at most time. Lin et al. (2016) concluded that the thickness of the PCM layer and PCM types should be selected carefully to make full use of the PCM thermal storage capacity. The optimization of the additional wall insulation of the original house may also assist in improving the performance of PCM enhanced buildings. Karim et al. (2014) studied the energy performance of hollow concrete floor panels using a shape-stabilized polymer composite PCM with a melting point of 27°C. They recommended that an optimization of the minimal PCM quantity to fill inside the panel as a function of the climatic condition should be studied since only 70% of the PCM was utilized after 6 h during their tests. For the same reasons, Xu et al. (2005) recommended that the thickness of PCM plate used under the floor for space heating in Beijing should not be larger than 20 mm. Mazzeo et al. (2017) analyzed the energy behavior of PCM layer using an explicit finite difference numerical model to identify which PCM is more suitable in improving the energetic performances of building walls in the heating or cooling period during the year. It was found that the lowest value of energy entering the indoor environment is obtained by a PCM with a melting temperature of 26°C.
Although those works brought some general suggestions for the application of PCMs in building envelope, the results are case specific and cannot be generalized for the design of an integrated building envelope with PCM. It was found that when PCMs were encapsulated using the methods mentioned above, the melting process was not carried out to completion because of the low conductivity of the PCM (Chandel and Agarwal, 2017). The effect of using PCM varies depending on the building construction, configuration, and climatic conditions. As evidenced by the scientific literature, the choice of the most appropriate PCM for a given location requires in-situ experimental testing. In the current research, an experiment on building enclosure integrated with PCMs encapsulated within tubes was studied under full weather conditions. Two different concentrations of PCMs were tested. The outdoor and indoor air temperatures, exterior and interior wall surface temperatures, and heat flux through walls were monitored in well-controlled test houses. The thermal performance of the studied walls was evaluated using peak heat flux reduction, peak load shift, daily energy savings, and indoor wall surface and air temperature reductions. The objective of this research is to evaluate what concentration of PCMs could provide the best thermal performance in the climatic conditions under consideration and which wall orientation should be used to install the PCM tubes.
Xu et al. (2005) recommended that the thermal conductivity of PCM should be larger than 0.5 W/(m°C) to accelerate the solar energy absorption. Sun et al. (2018) found that a paraffin couldn't complete its solidification and melting process because of a low thermal conductivity [0.2 W/(m°C)] (de Gracia and Cabeza, 2015; Guo and Goumba, 2018). To realize a fast phase transition process, calcium chloride hexahydrate was used in this research. Calcium chloride hexahydrate has been proven to be an effective PCM with stable phase transition temperature and latent heat of fusion after 1,000 thermal cycles (Tyagi and Buddhi, 2008). Moreover, Ramakrishnan et al. (2016) recommended a PCM with phase change temperature of 3–5°C higher than the average outdoor air temperature to achieve higher indoor thermal comfort. The average outdoor air temperature in Lawrence, Kansas in summer is 24.9°C. Therefore, the calcium chloride hexahydrate from Teappcm with a melting temperature of 29–30°C is suitable for the application in this city. The thermal properties of this PCM are shown in Table 1. Moreover, copper was recommended to encapsulate calcium chloride hexahydrate by Inés Fernández et al. (2015). Therefore, the PCM was encapsulated in copper pipes with an internal diameter of 1.27 cm (Figure 1), arranged horizontally in the stud walls, and placed next to the interior wallboard. It was proved by D'Alessandro et al. that the structural stability of the building was not negatively affected (D'Alessandro et al., 2018). PCM concentrations of 10 wt% and 20 wt% were investigated. The concentrations were based on the weight of the interior sheathing, i.e., gypsum wallboard. For east-, west-, and north-facing walls, the PCM quantity was 2.08 and 4.15 kg for 10 and 20 wt% concentration, respectively. The PCM quantity for south-facing wall was less because of the presence of a window, resulting in 1.75 and 3.50 kg or 10 and 20 wt%.
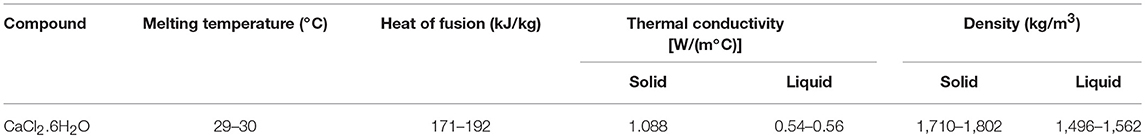
Table 1. The thermal properties of calcium chloride hexahydrate (Zalba et al., 2003).
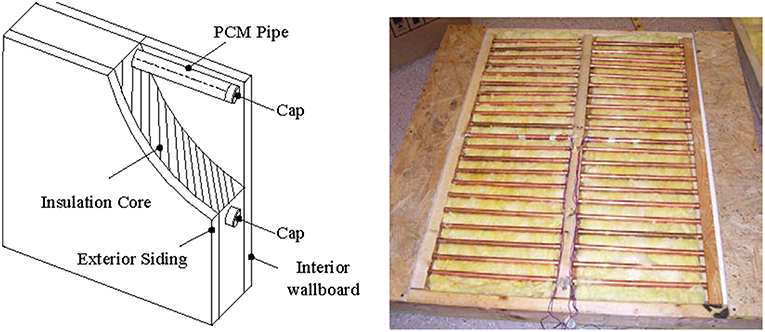
Figure 1. Schematic of PCM encapsulation and installation.
The thermal performance of walls outfitted with PCMs was evaluated using two identical 1.83 × 1.83 × 1.22 m test houses (Figure 2A), where one house was used as a control house and the other as a retrofit house. The roof was a built-up roof with gray asphalt shingles, 6.8 kg felt, and 1.27 cm plywood sheathing. The wall assemblies were 1.11 cm plywood siding, 5.08 × 10.16 cm studs, and 1.27 cm gypsum wallboard from outside to inside (Figure 2B). Insulation (fiberglass and cellulose) with a thermal resistance of 1.94 m2·K/W (R-11) was used for both the ceiling and the walls. In each test house, a window with an area of 0.32 m2 was placed in the south-facing walls.
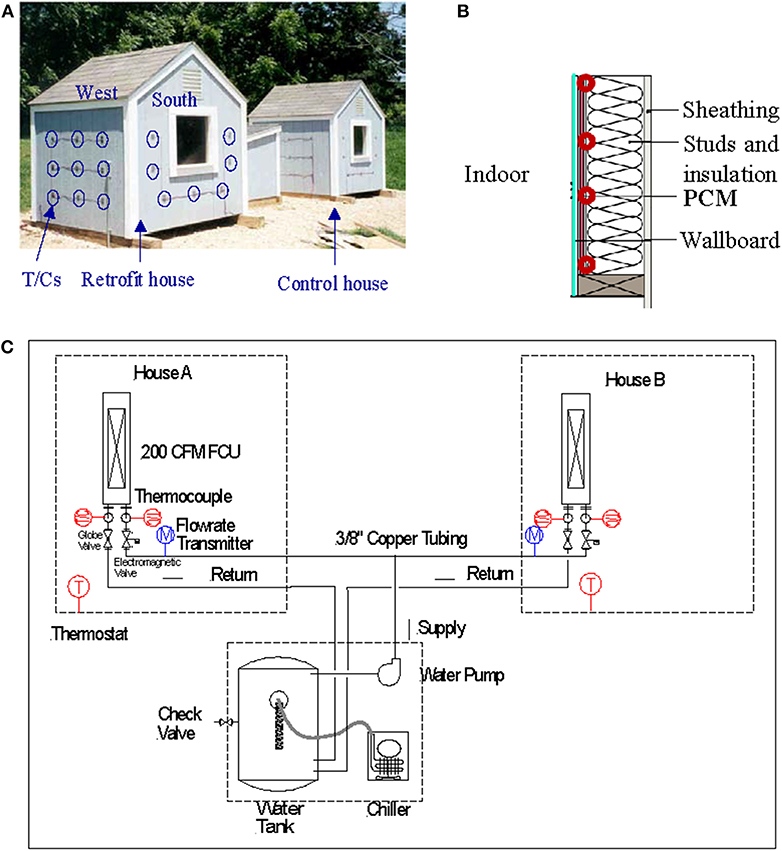
Figure 2. Control and experimental test houses. (A) Pictures of the test houses. (B) Wall assemblies. (C) Space cooling system.
For space cooling purposes, a chilled water system (cooling capacity: 0.4 kW) was designed and field fabricated and installed (Figure 2C). The chilled water system included a water tank, a drop-in coil water chiller, a temperature controller and a set of water pumps. Fan coil units were installed inside each house next to the east-facing walls. The chilled water was circulated from a 265-L insulated plastic water tank to each fan-coil-unit (FCUs) located inside each house. A temperature controller was connected to the chiller to regulate the chilled water temperature in the tank, which was set at around 12.8 ± 2.8°C. The pumps and the electromagnetic valves were controlled by low voltage thermostats to maintain test houses' indoor air temperatures at approximately 21.5 ± 0.5°C. This indoor air temperature was within the temperature range of 68–76°F (20–24.4°C), which was recommended by the Occupational Safety and Health Administration (OSHA) technical manual (Occupational Safety and Health Administration, 2017). Monitoring systems were installed to measure and collect wall heat fluxes, air and surface temperatures. During the tests, the indoor air temperatures of both houses were well-controlled and maintained to be almost identical, within 1.5°C of each other.
Type T thermocouples (T/Cs) were installed to measure indoor and outdoor air and wall surface temperatures. For air temperature measurements, the T/Cs were shielded with aluminum tape to minimize radiation exchange effects. Each wall was instrumented with several T/Cs arranged in parallel grids. This arrangement gave a representative wall temperature, which was the average of the measured points. The measurement range and accuracy of the T/C was between −18 and 93°C and ± 0.6°C. Flat heat flux meters (HFMs) were attached to the interior wall surfaces to measure heat fluxes through the walls. The measuring range and accuracy of the HFMs was 0–3.1 × 10⁵ W/m2 and 1% in departure of readings. The water flow rate was measured using Omega FLR1001 with an accuracy of 1%. A tripod weather station was installed, which had a wind speed sensor, a pyranometer, and temperature and relative humidity probes. Year-round outdoor temperatures was monitored and measured.
It was necessary to perform calibration tests before any retrofits. For this, the thermal performances of the two houses were compared and recorded as baseline. Wall temperatures and heat fluxes were measured and compared to verify their similarity in thermal performance. This is shown in Figure 3. During the calibration period, the control house (House A) was kept at an average indoor air temperature of 24.17°C, while the soon-to-be-retrofit house (House B) was kept at an average temperature of 24.22°C. Figure 3A shows the similarity in temperature of the outside surface temperatures of the south-facing walls. Figure 3B shows the heat flux through the south-facing walls. The average difference in heat flux in the walls of both houses was in the range of 3%.
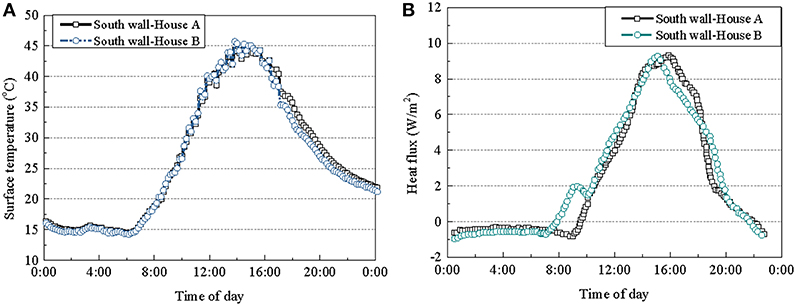
Figure 3. Experimental results on the south-facing walls before retrofit (June 23). (A) Outside surface temperatures. (B) Wall heat flux.
The peak heat flux reduction as a result of using PCMs in the frame walls was calculated by using:
where fr was the peak heat flux reduction in percentage, %; and qc,mand qr,mwere the maximum heat flux through control and retrofit walls, W/m2, respectively.
Because of the energy storage during melting when outdoor temperature increased, the time at which the heat fluxes reached their maximum values were delayed in the retrofit house. That is, the peak load was shifted to later times of the day. The time lag caused by using PCMs was calculated by
where φ was the time delay in hours; and τc,m and τr,m were the times at which the heat flux reached to its peak value for control wall and retrofit wall, respectively.
The heat flux through walls during daytime was reduced because of the heat storage of PCMs. Therefore, less heat gains were transferred into indoor environment under this condition. During the night time, PCMs within the tubes solidified and released the stored heat both indoors and outdoors. Therefore, the heat loss (negative values in Figure 3) was less through the wall with PCMs. The daily energy savings using PCMs were calculated using Equation (3).
where ES was the daily energy savings, J/m2; and Qc and Qr were the daily heat transfer through control and retrofit walls, respectively, J/m2.
Figure 4 shows the heat fluxes across frame walls facing various directions in control and retrofit houses. The peak heat flux was lower for the wall with 10 wt% PCMs during daytime because of the heat energy storage. The average reductions in peak heat fluxes in 3 days in the north, south, east, and west walls were 31.25, 21.87, 22.89, and 21.23%, respectively. The average difference in peak heat fluxes of the aggregate between the control walls and the walls with 10 wt% PCMs was approximately 24%. However, the absolute heat flux was smaller when it was negative during night time. That is, the energy loss through the wall with PCMs was less because of the energy release.
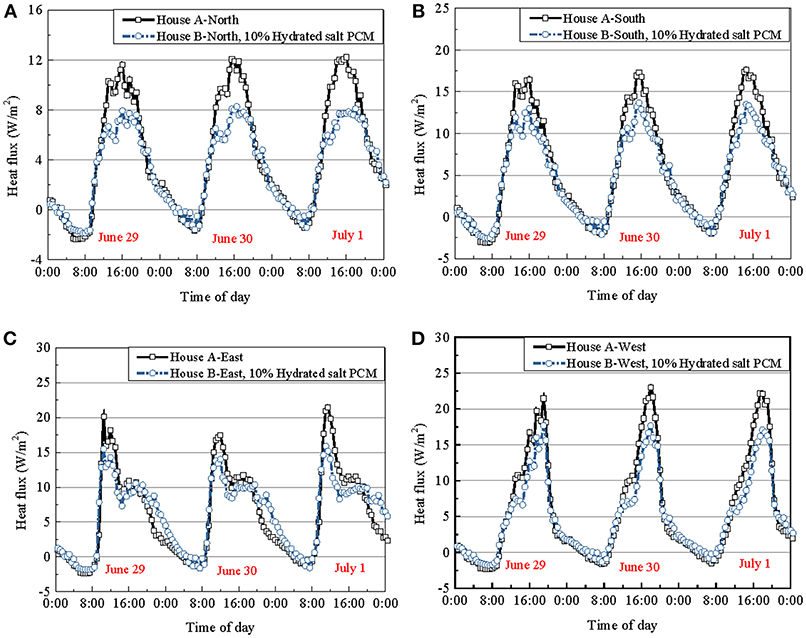
Figure 4. Heat flux through exterior frame walls with 10 wt% PCMs. (A) North-facing walls. (B) South-facing walls. (C) East-facing walls. (D) West-facing walls.
The daily average heat flux reduction, time delay and energy savings by using 10 wt% PCMs are summarized in Table 2. The heat flux through north-facing wall was reduced the most. This is because the north-facing wall received the least solar radiation, resulting in a lower outdoor wall surface temperature. The heat transfer between outdoor and indoor environment through this wall was slow (as shown in Figure 4A), so was the PCM melting process. When the heat flux in the control wall reached its peak, the PCM in retrofit wall did not finish its melting process, where the temperature was maintained at its phase transition temperature. This was illustrated in the relatively flat peak heat flux curve in Figure 4A. For other walls receiving more solar radiation, PCM finished its melting when the outdoor temperature increased. Afterwards, the PCM temperature increased to store more sensible heat. The heat transfer increased until it reached its peak. This was the reason for the time delay results. The peak heat flux was shifted to 1.5 h later for the north-facing wall. In contrast to the heat flux reduction and time delay, the maximum daily energy savings was observed on the west-facing wall.
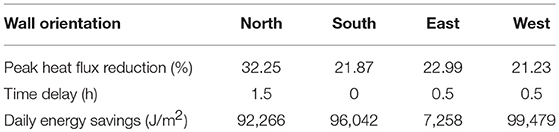
Table 2. Daily peak heat flux reduction, time delay and energy savings using 10 wt% PCM.
Figure 5 depicts how the walls outfitted with PCMs were able to keep a more constant inside wall surface temperature and a narrower temperature fluctuation than the standard wall. Each segment shows indoor wall surface temperatures for a standard wall and for a wall outfitted with PCMs. For example, for the north walls the indoor surface temperature of the control house was on average 23.6°C; while the surface temperature of the wall outfitted with PCMs was 22.5°C. The temperature amplitude in the standard wall was 2.2°C; while, it was 1.1°C for the wall outfitted with PCMs. It was noteworthy that the temperature variation of the retrofit house (House B) was different for walls with various orientations. On the north walls, the surface temperature in the retrofit house had the lowest amplitudes and the temperature in the control house was the lowest. In this case, the PCM was maintained partially melting or in its solidification process. Therefore, the PCM temperature was maintained at its phase change temperature. This phenomenon was also observed in the heat flux variation in Figure 4A. On the south and west walls, the temperature variation in retrofit and control houses followed the same trend. However, the temperature variation was in a reverse trend for east walls. The surface temperature of the south and west walls increased faster than that of the east walls. That is, the heat transfer rate through the south and west walls was larger (Figures 4B,D), in a way which the phase change process finished faster, resulting in a smaller time delay in peak temperatures.
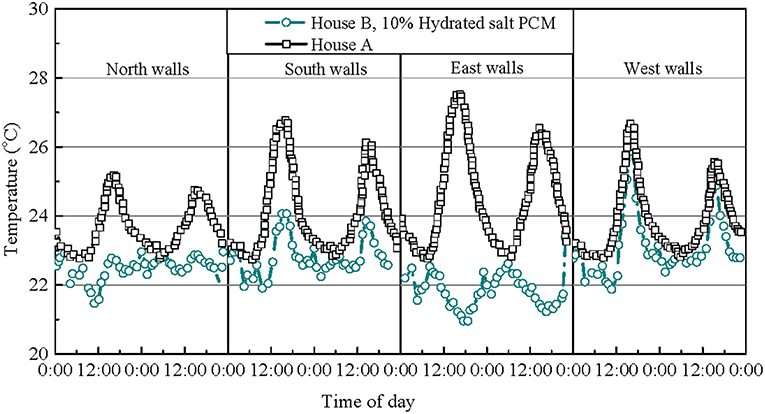
Figure 5. North, south, east, and west walls inside surface temperatures using 10 wt% PCM.
Table 3 summarizes the findings related to the reductions in inside wall surface temperatures and in the daily temperature amplitudes. As stated above, the walls with PCMs were able to not only lower the inside wall surface temperature, but also their daily temperature amplitudes. The average reduction of inside wall surface temperature and daily temperature amplitudes were 1.5 and 1.4°C, respectively. These results could translate to human comfort and to an increase in the life of comfort equipment with less on/off modes and operation time.
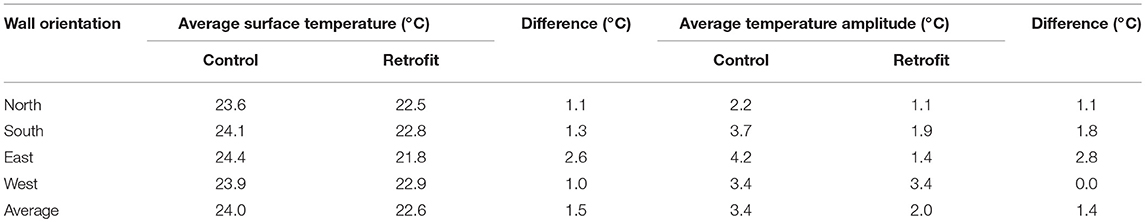
Table 3. Reductions in inside wall surface temperatures and reductions in temperature amplitudes produced by using 20 wt% PCMs.
Same tests were performed for a 20 wt% PCM concentration. It was interesting to observe that the difference in peak heat fluxes between the control walls and the walls outfitted with PCMs was lower than the values for the 10 wt% PCM concentration. This means that doubling the amount of PCM did not produce improvement in peak heat flux reductions. Figure 6 shows the heat fluxes through the north, south, east and west walls, respectively. The average daily reduction in peak heat transfer rates in the north, south, east and west walls were 5.6, 6.65, 25.54, and 11.32%, respectively. From these results and aside from the east-facing wall, it was observed that doubling the quantity of PCM did not improve the performance. The peak heat flux reduction was lower for 20 wt% PCM than it for 10 wt% PCM for the north, south, and west-facing walls. Compared with the heat fluxes in Figure 4, the heat fluxes through control walls were much lower in Figure 6 because of the variation of solar radiation and outdoor temperature on these days, except for the east-facing wall where the total daily heat flux was the largest. It was concluded that the PCM did not complete its phase transitions on these walls except for the east-facing wall. The PCM without phase transition served as an insulation. However, its thermal resistance was lower than the R11 insulation. Therefore, more heat gains were received when doubling the PCM. For east-facing wall, doubling the quantity of PCM improved the performance by 11.58%.
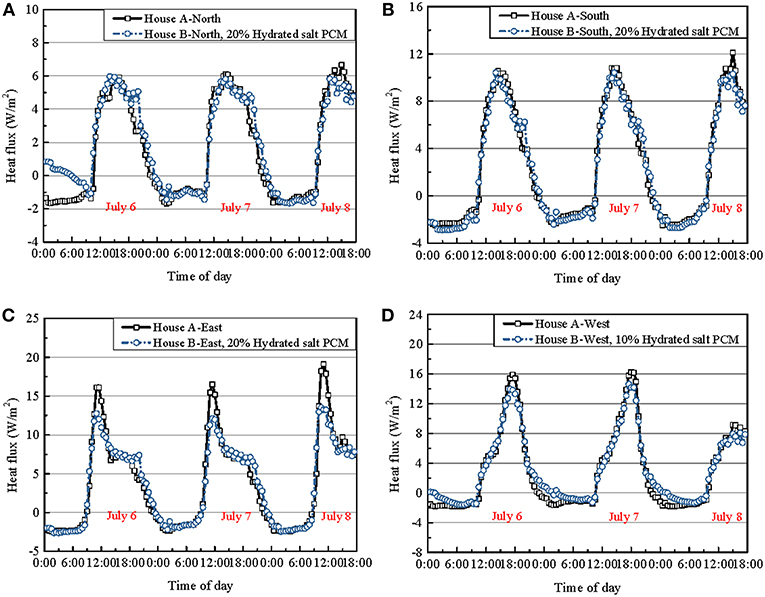
Figure 6. Heat flux through exterior frame walls with 20 wt% PCM. (A) North-facing walls. (B) South-facing walls. (C) East-facing walls. (D) West-facing walls.
The results by using 20 wt% PCM are summarized in Table 4 for peak heat flux reduction, time delay and daily energy savings. Compared with the results for 10 wt% PCM, the peak heat flux reduction decreased except for the east-facing wall. The reason is that the PCM did not complete its melting for the 20 wt% concentration. Therefore, the total material that melted under this condition was less than that in 10 wt% of cases. Moreover, the un-melted PCM served as insulation within the tubes. However, the thermal resistance of the PCM was much lower than the R11 insulation. Therefore, the peak heat flux through retrofit walls increased, resulting in a lower peak heat flux reduction. For east-facing walls with similar heat flux through control walls for 10 and 20 wt% PCM cases, the peak heat flux reduction was improved by using more PCMs. It was concluded that adding more PCMs improved the thermal behavior of the walls as long as the PCMs completed their melting during daytime.
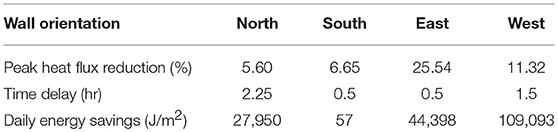
Table 4. Daily peak heat flux reduction, time delay and energy savings using 20 wt% PCM.
Table 5 summarizes the indoor surface temperatures in the control and the PCM-outfitted walls with 20 wt% PCM. The average indoor surface temperature of the four control walls was 23.9°C while the indoor surface temperatures in the walls outfitted with PCMs was 22.4°C. The average temperature amplitude in the control walls was 3.2°C, while it was 1.7°C in the walls outfitted with PCMs. The surface temperature of the walls outfitted with PCMs was more constant than those for the control walls. This is shown in Figure 7.
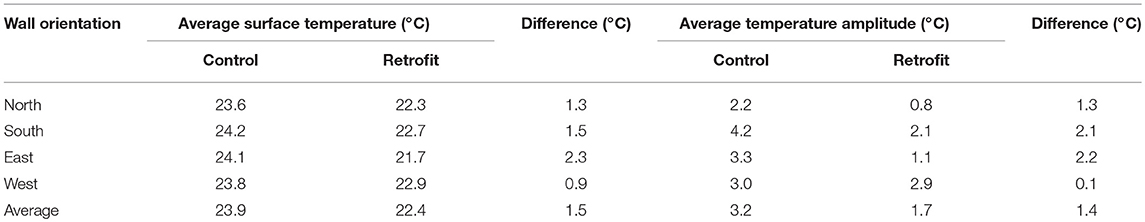
Table 5. Reductions in inside wall surface temperatures and reductions in temperature fluctuations produced by using 20 wt% PCMs.
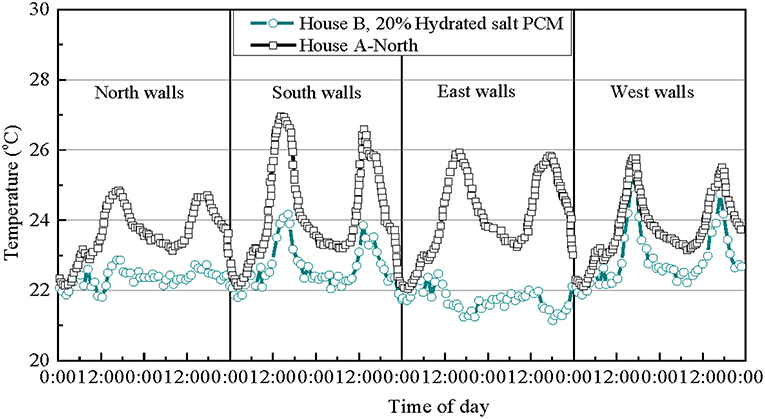
Figure 7. North, south, east, and west walls inside surface temperatures using 20 wt% PCM.
Heat transfer through frame walls with PCM encapsulated in copper pipes were investigated in well-controlled test houses under full weather conditions. The heat flux, time delay and energy savings were tested and compared with two PCM concentrations. The following results were retrieved:
1) For a 10 wt% PCM, the largest observed peak flux reduction was 31.25% when the PCM pipes were installed within the north-facing wall. However, for the 20 wt% PCM concentration, the largest peak flux reduction of 25.54% was found when the PCM pipes were installed within the east-facing wall. The different peak flux reduction was mainly impacted by the outdoor air temperature and solar radiation. To realize a larger peak heat flux reduction, the PCM should be within a phase transition state when the heat flux through control wall reached its peaks.
2) The total heat flux was reduced by approximately 24% with 10 wt% PCM and 12% with 20 wt% PCM concentrations. Doubling the amount of PCM did not produce improvement on the heat flux reduction if the PCMs cannot complete the melting process except for the east-facing walls. The PCM quantity should be carefully designed to realize a complete melting and solidification cycle in 1 day. More tests under different weather conditions should be studied to obtain the relationship between the PCM quantity and the climatic condition.
3) The maximum daily energy savings were observed on the west-facing wall for both 10 and 20 wt% concentration. PCMs were recommended to be installed on the west-facing walls in order to obtain larger energy savings.
MM conceived of the presented idea. XS developed the theory and performed the experiments. YZ helped with the writing. All authors discussed the results and contributed to the final manuscript.
The authors declare that the research was conducted in the absence of any commercial or financial relationships that could be construed as a potential conflict of interest.
The authors acknowledge the funding and support of the following agencies: the National Science Foundation (0533362), the California Energy Commission, ASHRAE, the University of Kansas, the Kansas Geological Survey, the KU Transportation Research Institute, the National Natural and Science Foundation (China, 51308051), the Science and Technology Department of Hunan (2017RS3036), Hunan Association for Science and Technology (2017TJ-Q05), and Changsha Fund for Distinguished and Innovative Young Scholars (kq1802032).
1. ^“The 2030 Challenge (2018).” from Available online at: http://architecture2030.org/2030/_challenges/2030-challenge/
Alam, M., Jamil, H., Sanjayan, J., and Wilson, J. (2014). Energy saving potential of phase change materials in major Australian cities. Energy Build. 78, 192–201. doi: 10.1016/j.enbuild.2014.04.027
Chandel, S. S., and Agarwal, T. (2017). Review of cooling techniques using phase change materials for enhancing efficiency of photovoltaic power systems. Renew. Sustain. Energ. Rev. 73, 1342–1351. doi: 10.1016/j.rser.2017.02.001
Chwieduk, D. A. (2013). Dynamics of external wall structures with a PCM (phase change materials) in high latitude countries. Energy 59, 301–313. doi: 10.1016/j.energy.2013.06.066
Cui, H., Tang, W., Qin, Q., Xing, F., Liao, W., and Wen, H. (2017). Development of structural-functional integrated energy storage concrete with innovative macro-encapsulated PCM by hollow steel ball. Appl. Energ. 185, 107–118. doi: 10.1016/j.apenergy.2016.10.072
D'Alessandro, A., Pisello, A. L., Fabiani, C., Ubertini, F., Cabeza, L. F., and Cotana, F. (2018). Multifunctional smart concretes with novel phase change materials: mechanical and thermo-energy investigation. Appl. Energ. 212, 1448–1461. doi: 10.1016/j.apenergy.2018.01.014
de Gracia, A., and Cabeza, L. F. (2015). Phase change materials and thermal energy storage for buildings. Energy Build. 103, 414–419. doi: 10.1016/j.enbuild.2015.06.007
Gounni, A., and El Alami, M. (2017). The optimal allocation of the PCM within a composite wall for surface temperature and heat flux reduction: an experimental approach. Appl. Therm. Eng. 127, 1488–1494. doi: 10.1016/j.applthermaleng.2017.08.168
Guldentops, G., Ardito, G., Tao, M., Granados-Focil, S., and Van Dessel, S. (2018). A numerical study of adaptive building enclosure systems using solid–solid phase change materials with variable transparency. Energy Build. 167, 240–252. doi: 10.1016/j.enbuild.2018.02.054
Guo, X., and Goumba, A. P. (2018). Process intensification principles applied to thermal energy storage systems—a brief review. Front. Energy Res. 6:17. doi: 10.3389/fenrg.2018.00017
Inés Fernández, A., Solé, A., Giró-Paloma, J., Martínez, M., Hadjieva, M., Boudenne, A., et al. (2015). Unconventional experimental technologies used for phase change materials (PCM) characterization: part 2 – morphological and structural characterization, physico-chemical stability and mechanical properties. Renew. Sustain. Energy Rev. 43, 1415–1426. doi: 10.1016/j.rser.2014.11.051
Karim, L., Barbeon, F., Gegout, P., Bontemps, A., and Royon, L. (2014). New phase-change material components for thermal management of the light weight envelope of buildings. Energy Build. 68, 703–706. doi: 10.1016/j.enbuild.2013.08.056
Konuklu, Y., Ostry, M., Paksoy, H. O., and Charvat, P. (2015). Review on using microencapsulated phase change materials (PCM) in building applications. Energy Build. 106, 134–155. doi: 10.1016/j.enbuild.2015.07.019
Kośny, J., Biswas, K., Miller, W., and Kriner, S. (2012a). Field thermal performance of naturally ventilated solar roof with PCM heat sink. Solar Energy 86, 2504–2514. doi: 10.1016/j.solener.2012.05.020
Kośny, J., Fallahi, A., Shukla, N., Kossecka, E., and Ahbari, R. (2014). Thermal load mitigation and passive cooling in residential attics containing PCM-enhanced insulations. Solar Energy 108, 164–177. doi: 10.1016/j.solener.2014.05.007
Kośny, J., Kossecka, E., Brzezinski, A., Tleoubaev, A., and Yarbrough, D. (2012b). Dynamic thermal performance analysis of fiber insulations containing bio-based phase change materials (PCMs). Energy Build. 52, 122–131. doi: 10.1016/j.enbuild.2012.05.021
Kośny, J., Yarbrough D., Miller W., Petrie T., Childs P., Syed AM., et al. (2007). “Thermal performance of PCM-enhanced building envelope systems,” in Proceedings of the ASHRAE/DOE/BTECC Conference on the Thermal Performance of the Exterior Envelopes of Whole Buildings X (Clear Water Beach, FL: Ashrae), 1–8.
Kuznik, F., Arzamendia Lopez, J. P., Baillis, D., and Johannes, K. (2015). Phase change material wall optimization for heating using metamodeling. Energy Build. 106, 216–224. doi: 10.1016/j.enbuild.2015.06.021
Kuznik, F., Virgone, J., and Noel, J. (2008). Optimization of a phase change material wallboard for building use. Appl. Therm. Eng. 28, 1291–1298. doi: 10.1016/j.applthermaleng.2007.10.012
Lin, W., Ma, Z., Cooper, P., Sohel, M. I., and Yang, L. (2016). Thermal performance investigation and optimization of buildings with integrated phase change materials and solar photovoltaic thermal collectors. Energy Build. 116, 562–573. doi: 10.1016/j.enbuild.2016.01.041
Mazzeo, D., Oliveti, G., and Arcuri, N. (2017). A method for thermal dimensioning and for energy behavior evaluation of a building envelope PCM layer by using the characteristic days. Energies 10:659. doi: 10.3390/en10050659
Occupational Safety and Health Administration (2017). OSHA Technical Manual: Health Hazards-Indoor Air Quality Investigation. Washington, DC: Occupational Safety and Health Administration.
Ramakrishnan, S., Wang, X., Alam, M., Sanjayan, J., and Wilson, J. (2016). Parametric analysis for performance enhancement of phase change materials in naturally ventilated buildings. Energy Build. 124, 35–45. doi: 10.1016/j.enbuild.2016.04.065
Ramakrishnan, S., Wang, X., Sanjayan, J., and Wilson, J. (2017). Thermal performance of buildings integrated with phase change materials to reduce heat stress risks during extreme heatwave events. Appl. Energy 194, 410–421. doi: 10.1016/j.apenergy.2016.04.084
Song, M., Niu, F., Mao, N., Hu, Y., and Deng, S. (2018). Review on building energy performance improvement using phase change materials. Energy Build. 158, 776–793. doi: 10.1016/j.enbuild.2017.10.066
Sun, X., Medina, M. A., Lee, K. O., and Jin, X. (2018). Laboratory assessment of residential building walls containing pipe-encapsulated phase change materials for thermal management. Energy 163, 383–391. doi: 10.1016/j.energy.2018.08.159
Sun, X., Zhang, Q., Medina, M. A., Lee, K. O., and Liao, S. (2016). Parameter design for a phase change material board installed on the inner surface of building exterior envelopes for cooling in China. Energy Conv. Manage. 120, 100–108. doi: 10.1016/j.enconman.2016.04.096
Tyagi, V. V., and Buddhi, D. (2008). Thermal cycle testing of calcium chloride hexahydrate as a possible PCM for latent heat storage. Solar Energy Mater. Solar Cells 92, 891–899. doi: 10.1016/j.solmat.2008.02.021
Vicente, R., and Silva, T. (2014). Brick masonry walls with PCM macrocapsules: an experimental approach. Appl. Therm. Eng. 67, 24–34. doi: 10.1016/j.applthermaleng.2014.02.069
Xu, X., Zhang, Y., Lin, K., Di, H., and Yang, R. (2005). Modeling and simulation on the thermal performance of shape-stabilized phase change material floor used in passive solar buildings. Energy Build. 37, 1084–1091. doi: 10.1016/j.enbuild.2004.12.016
Keywords: phase change materials (PCMs), heat transfer through building walls, energy management in buildings, enhanced building enclosures, heat flux reduction
Citation: Sun X, Medina MA and Zhang Y (2019) Potential Thermal Enhancement of Lightweight Building Walls Derived From Using Phase Change Materials (PCMs). Front. Energy Res. 7:13. doi: 10.3389/fenrg.2019.00013
Received: 17 September 2018; Accepted: 04 February 2019;
Published: 22 February 2019.
Edited by:
Kaushik Biswas, Oak Ridge National Laboratory (DOE), United StatesCopyright © 2019 Sun, Medina and Zhang. This is an open-access article distributed under the terms of the Creative Commons Attribution License (CC BY). The use, distribution or reproduction in other forums is permitted, provided the original author(s) and the copyright owner(s) are credited and that the original publication in this journal is cited, in accordance with accepted academic practice. No use, distribution or reproduction is permitted which does not comply with these terms.
*Correspondence: Mario A. Medina, bW1lZGluYUBrdS5lZHU=
Disclaimer: All claims expressed in this article are solely those of the authors and do not necessarily represent those of their affiliated organizations, or those of the publisher, the editors and the reviewers. Any product that may be evaluated in this article or claim that may be made by its manufacturer is not guaranteed or endorsed by the publisher.
Research integrity at Frontiers
Learn more about the work of our research integrity team to safeguard the quality of each article we publish.