- 1Department of Agricultural and Biological Engineering, Pennsylvania State University, University Park, PA, United States
- 2Idaho National Laboratory, Bioenergy Technologies Department, Idaho Falls, ID, United States
Wet storage is synonymous with ensilage, a simple biotechnology that has been used to preserve forage for livestock feed for millennia. In this natural process, organic acids are produced by anaerobic microbial degradation of a small fraction of the biomass, and these acids reduce the pH to levels that minimize further microbial activity and can preserve the biomass for years as long as anaerobic conditions are maintained. These organic acids also result in mild pretreatment with potential to enhance downstream conversion processes, making this an effective storage strategy. However, the degree and significance of this natural pretreatment capability of ensiled storage on downstream processes has not previously been quantified across a range of storage conditions. In this study, the degree of pretreatment was investigated by measuring the reactivity of corn stover fiber to cellulolytic enzymes. Although the results indicated significant improvement in hydrolytic outcomes after wet storage, by a factor of up to 2.4, saccharification of cellulose to sugar monomers was still limited. The results also show that dominance of lactic acid in the ensilage process is key to wet storage (pretreatment) effectiveness as in the livestock feed industry. Lactic acid pKa value is lower than the pKa of other silage acids and lower than typical silage pH. This gives lactic acid the advantage of being in the more dissociated form, with more protons available to facilitate pretreatment hydrolysis. However, unlike the livestock feed industry, where quality feedstock is attainable within very narrow storage moisture range, for biofuel purposes, a wider range of 35–65% is appropriate in achieving a similar quality outcome. This is true both for the immediate fiber response to enzymes and with subsequent pretreatment. This wider moisture range implies more flexibility in harvest schedule without sacrificing feedstock quality, thus alleviating concerns over feedstock quality that biomass suppliers or biorefineries may have.
Introduction
Two main attractions of wet storage of biomass under anaerobic conditions are (1) minimizing dry matter loss, and (2) enhancing downstream pretreatment and conversion processes. In the first case, it is well-established that the production of organic acids and associated reduction of pH have bacteriostatic or bactericidal effects on most spoilage microbes, and the outcome is a well-preserved feedstock with reduced dry matter loss. For the second case, previous studies have suggested the potential of the organic acids produced during wet storage or ensilage to break some structural bonds or alter cell wall structure, thereby serving as a pretreatment mechanism. The purpose of pretreatment is to allow more effective enzymatic hydrolysis of sugar polymers into sugar monomers, as those sugar monomers can serve as a reactive intermediate for fermentations that produce biochemicals and biofuels (Tanjore and Richard, 2015). The various chemical, thermal, and biological pretreatment strategies that have been developed have high capital and operational costs, often on the order of one third of the total conversion cost (Brown and Brown, 2014; Eggeman and Elander, 2015). The idea of ensilage serving as an avenue for in situ pretreatment during biomass storage to enhance downstream fermentation processes was suggested by Linden et al. (1987) and Richard et al. (2001). Several more recent studies have documented promising effects (Chen C. et al., 2007; Digman et al., 2007; Ren et al., 2007; Thomsen et al., 2008; Oleskowicz-Popiel, 2010; Pakarinen et al., 2011), although the range of silage conditions and their impacts have not been fully explored. With few exceptions, storage moistures in these studies are within the range of traditional ensilage recommendations for livestock feed, while each study typically explores a single moisture level. See Table 1 for a snapshot of storage conditions and key outcomes of these studies. Wet storage for bioenergy may require different recommendations than for livestock feeding, and the criteria for desired outcomes may also differ.
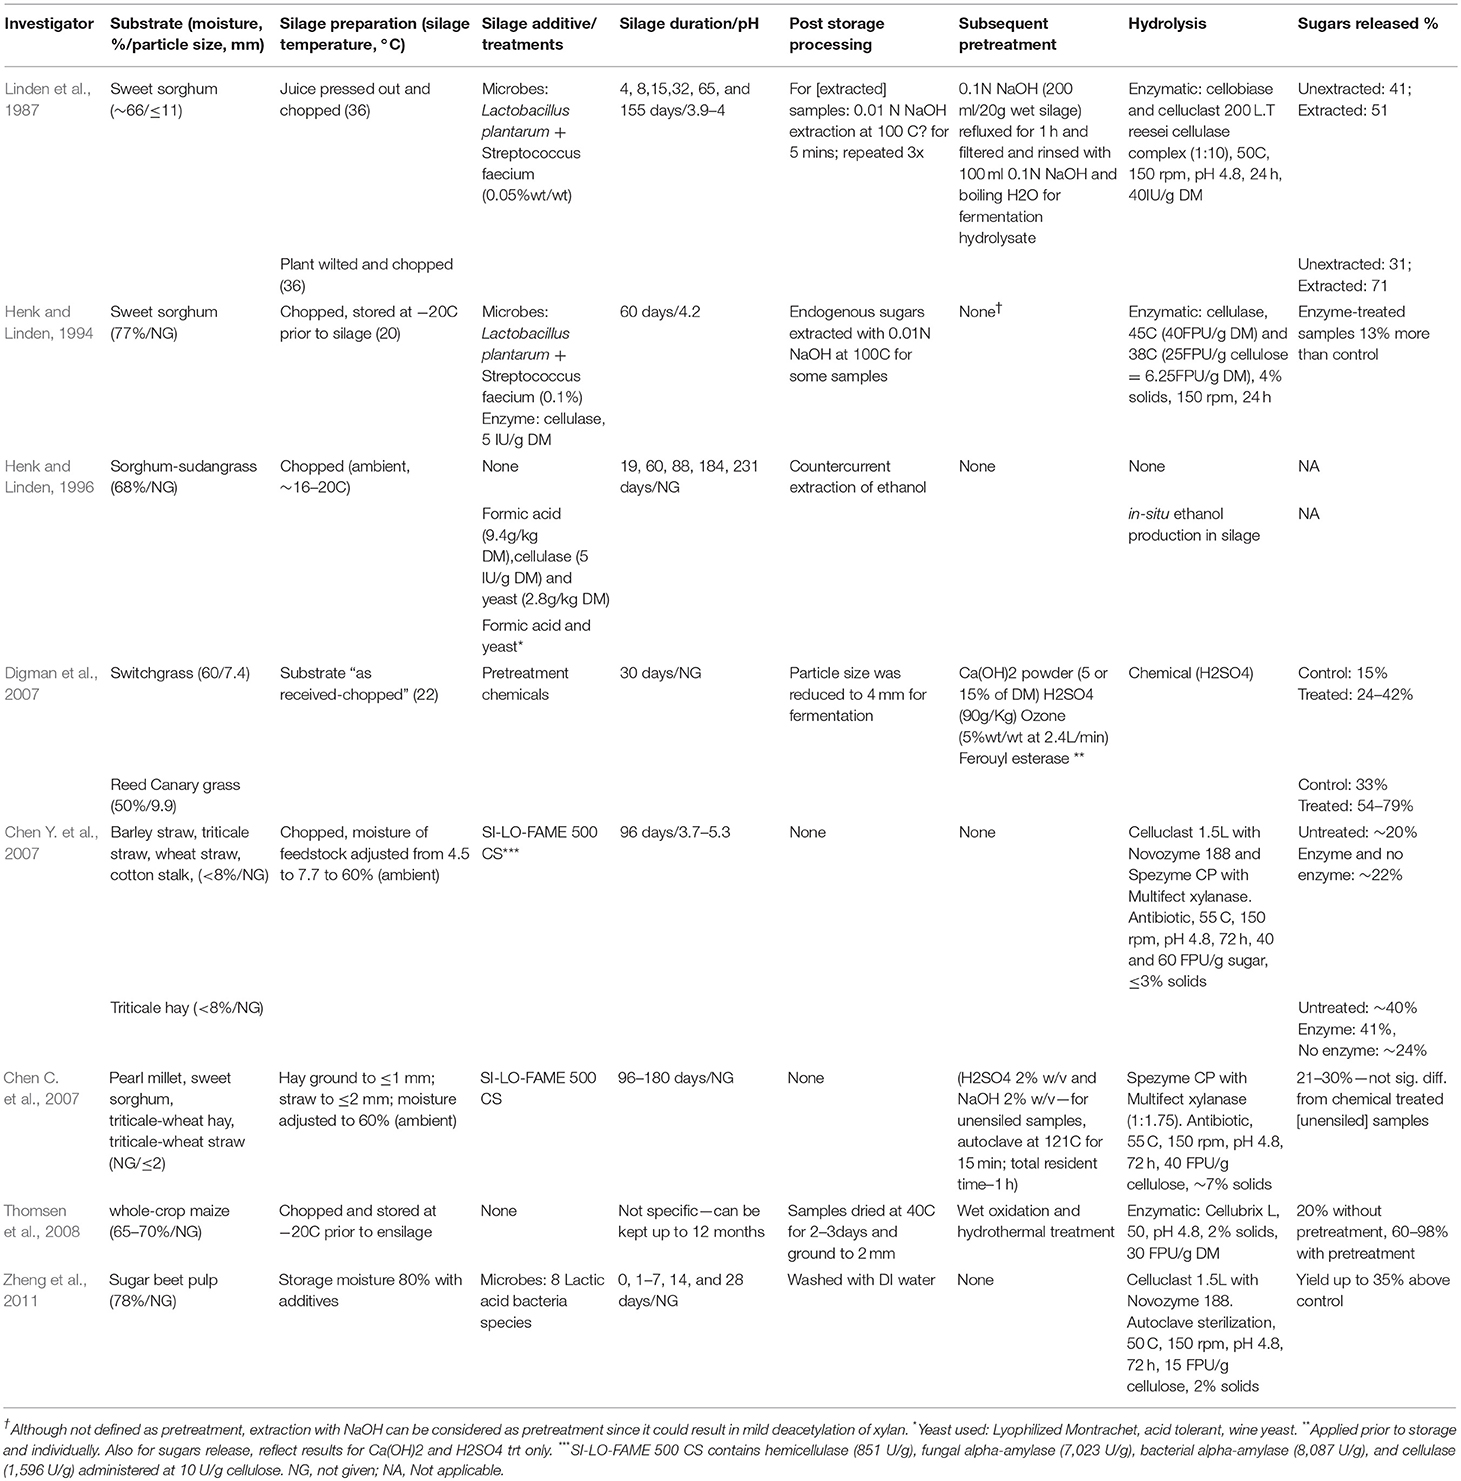
Table 1. Silage studies involving enzymatic hydrolysis showing storage and post storage treatments and outcomes.
The pretreatment mechanism of organic acids during wet storage is hypothesized to be similar to that of dilute hydrochloric, sulfuric, or phosphoric acid, which act on glycosidic bonds as described below. These inorganic acids have been extensively explored for the pretreatment of lignocellulosic feedstocks under various temperatures, pressures and times (Jacobsen and Wyman, 2000; Tanjore and Richard, 2015; Kumar and Sharma, 2017). Various organic acids,—maleic, oxalic, succinic, fumaric, formic,—have also been explored for pretreatment of biomass (Kootstra et al., 2009; Lee and Jeffries, 2011; Marzialetti et al., 2011; Barisik et al., 2016). However, there are important differences between wet storage (organic) acid treatment and conventional (inorganic) pretreatment in terms of both temperature and time. In the case of inorganic acid pretreatment, the acid-amended biomass is exposed to high pressures and temperatures (typically 120–200°C) for a period of minutes, whereas in wet storage the temperatures would be much lower (20–40°C) but the duration much longer, on the order of months to years.
The reactivity of acids with biomass is random and targeted mainly at glycosidic bonds, which are found between and within the polysaccharide polymers, mainly cellulose, and hemicellulose chains. Dilute acid hydrolysis results in partial hydrolysis of glycosidic bonds, and can also result in degradation of lignin if temperatures are above 180°C (Chesson, 1993; Donohoe et al., 2008). At ambient temperatures, which would be typical of most wet storage systems for biofuel production, acid hydrolysis is slow and limited to the amorphous regions where the hydrolytic reaction is initiated (Tímár-Balázsy and Eastop, 1998; Stoddart, 2007). Amorphous cellulose constitutes anything from 10 to 50% of total wood cellulose, depending on the feedstock (Jacobsen and Wyman, 2000). Cellulose is less susceptible to acid pretreatment because of its highly crystalline nature. In contrast, hemicellulose has a comparatively lower degree of polymerization and a highly branched, heterogeneous and fully amorphous structure that makes it more susceptible to acid reactions. Another factor contributing to hemicellulose's susceptibility is the presence of α-glycosidic bonds in the side chains, which are less stable than the β-bonds found in cellulose and the main chain of hemicellulose. The pretreatment capability of organic acids, produced under wet storage conditions, is therefore achieved mainly through hemicellulose hydrolysis.
A number of studies (McDonald et al., 1991; Muck, 1996; Richard et al., 2001; Ren et al., 2007) have shown the preferential degradation of hemicelluloses over cellulose during ensilage. The hydrolysis of hemicelluloses is an important pretreatment outcome of conventional acid or liquid hot water pretreatment, and the effectiveness of these pretreatment processes is associated with the amount of hemicellulose removed (Wyman, 1999; Sun and Cheng, 2002; Mosier et al., 2005). Conventional dilute acid pretreatment can result in up to 90% removal of xylose (the major constituent of hemicellulose), while liquid hot water pretreatment can remove up to 51% (Elander et al., 2005; Zheng et al., 2009). Since the structural sugars are bound or linked together throughout the plant cell wall, it can be expected that the degradation of hemicellulose will increase the surface area and allow enzymes access to other structural components through the openings created by their removal. Levels of hemicellulose degradation in silages can range from 0.5% or less (Muck, 1996) to as high as 54% depending on the crop type, storage conditions, and storage additives (Ren, 2006). These variations in hemicellulose degradation not only reflect the heterogeneity of biomass feedstocks, particularly the hemicellulose component whose constituents and arrangement vary from species to species, but also the sensitivity of wet storage to different conditions. This variability poses a potential challenge to wet storage as a complement to other pretreatment systems.
In addition to measures of hemicellulose degradation during wet storage, electron micrographs show evidence that the structure of ensiled corn stover differs from that of unensiled stover (Donohoe et al., 2009; Oleskowicz-Popiel, 2010). However, the impacts or significance of these structural changes on further downstream requirements has not been verified. Investigations into downstream processing of ensilage (Linden et al., 1987; Henk and Linden, 1994; Chen C. et al., 2007; Chen Y. et al., 2007; Digman et al., 2007) usually involve amended or enhanced silage that includes some form of additive—microorganisms, enzymes, chemicals, acids, sugars, etc. These studies do not have sufficient controls to make a case for the effectiveness of plain, unamended silage. For instance, Chen C. et al. (2007) compared hydrolytic and fermentation yields from enzyme amended silage to that of conventional, chemically treated feedstock, ignoring plain silage. Digman et al. (2007) analysis focus on chemically aided silage as compared to plain silage without relating it to unensiled feedstock. These studies have implicitly attributed the effectiveness of silage as a pretreatment or hydrolytic tool to these silage additives, and overlooked the potential of the plain, unamended ensilage process. Furthermore, the outcome of these amended silage depended on various factors that include the type of feedstock, the drying method, the type of additive, etc. As in Linden et al. (1987), a clear conclusion could not be made as the controls, silage without additives, were not consistent with respect to combined endogenous water soluble sugars and post-storage hydrolytic yields; unensiled (day 0) samples sometimes had higher yields, sometimes lower yield and in some cases similar yields.
As these prior studies suggest, an important attraction for wet storage is to enhance feedstock quality. The question, however, is what attributes of the wet storage system are responsible for quality enhancement. Feedstock quality can impact or influence the outcome of every downstream processing step even to the quality and quantity of the final biofuel end product (Li et al., 2016). Lactic acid is recognized as responsible for the quick reduction of pH that aids preservation with a resultant minimum dry matter loss (Muck, 2010). However, the pretreatment impacts of silage systems is generally attributed to organic acids without distinction. Understanding the critical and specific attributes that contribute to feedstock quality and identifying consistent quality indicators could bring provide a coherent knowledge framework to understand and improve wet storage strategies for biomass.
In addition to the technical effects, wet storage offers practical and economic opportunities for innovation and expanded farmer involvement in the cellulosic industry. The US Energy Policy Act of 2005 stipulates, in section 942(a)(4) and (e) (2), that funding priority would be given to projects in which the small feedstock producers are full participants or equity partners in the development of the cellulosic biofuel industry. Another important section of the Act is 946(a)(1) in which grants would be offered to agricultural producers who can demonstrate cost effective cellulosic biomass innovations in the preprocessing of feedstock, including chemical or biochemical treatments to add value and lower the cost of subsequent processing at the biorefinery. Although the more recent Energy Independence and Security Act of 2007 (EISA), does not contain these statements, the issue of involvement and quality enhancement still remain. Wet storage presents a platform for achieving these goals by providing opportunities for manipulation of some storage factors or the use of additives that can facilitate pretreatment or preprocessing of biomass to enhance its value at the refinery. This value-added processing can be performed at the farm level by feedstock producers, many of whom may already be familiar with the basics of ensilage, providing a simple but effective technology that can be adopted quickly at the scale needed for rapid growth of a large scale biofuel industry.
In this study, a wide range of moisture levels, outside tradition silage recommendations, are covered to accommodate varying moisture associated with flexible harvest schedules. Such moisture variations can occur with the percentage of residue removed, often associated with various heights of cut, anatomical fractions, harvest dates and/or selective harvesting. Moisture contenst from various anatomical fractions or different heights of cut at various harvest date can range from 10 to 80% (Igathinathane et al., 2006). The specific objective of this study was to determine the fiber reactivity of plain silage at six different moisture levels and relate this to the corresponding organic acid profile. For reporting purposes, the organic acid profile relates to the types, amount and relative proportion of each acid present during storage. The fiber reactivity concept was adapted from Henk and Linden (1994) and refers to how easily the fiber can be converted to sugar through enzymatic reactions. The essence of the fiber reactivity test is to determine if organic acids produced during ensilage have any significant pretreatment effect on fiber structure. The response to enzymatic reaction would be an indication of the degree of pretreatment that has occurred during storage, and can be used in defining the pretreatment capability of wet storage. This study also explored whether organic acids all have the same pretreatment and/or preservative effect on feedstock during storage. To our knowledge there has been no prior study on the pretreatment effect of individual acids or any attempt to define which acids have the most impact on enhancing feedstock quality during storage. This research therefore addresses the general impact as well as the specific impact of acids produced endogenously during ensilage. Better understanding of these relationships could allow the organic acid profile produced during storage to act as quality indicator of biomass feedstock after wet storage.
Materials and Methodology
Stover Description and Storage
Corn stover was from two sources, one in the U.S. state of Iowa (IA stover) and one in Pennsylvania (PA stover). The former was obtained from the US Department of Energy's Idaho National Lab while the latter was obtained from the Penn State Dairy farm. The IA stover, planted from Pioneer brand 34A20 seed, was conventionally harvested after the grain harvest from a plot near Boone, IA. After field-drying for 3–5 days it was raked, baled, transported to Idaho and stored indoors with a tarp cover to prevent dust accumulation. The PA stover, planted from Dekalb DKC54-46 seed, was left standing in the field through winter and harvested and chopped in spring. Both stover types had their particle size reduced to 1 inch minus (≤25.4 mm), using a forage chopper, prior to these trials.
The particle size distribution was analyzed using the Penn State Forage Particle Separator. The PA stover had ~26% of particles >19 mm, 26% were between 19 and 8 mm, 37% were between 8 and 1.18 mm and 11% were <1.18 mm. The IA stover had a similar distribution; 26% of particles >19 mm, 26% were between 19 and 8 mm, 31% were between 8 and 1.18 mm and 17% were <1.18 mm. A description of this particle size separation method can be found in Heinrichs and Kononoff (2002).
Corn stover from these two sources was presumed to have different compositional qualities. The (glucan; xylan; lignin; water soluble extractives) composition of IA and PA stover as received was (34.02 ± 0.14; 21.39 ± 0.18; 14.24 ± 0.13; 6.04 ± 0.23) and (34.35 ± 0.44; 20.49 ± 0.29; 14.96 ± 0.20; 3.82 ± 0.63), respectively. Significant components of water soluble extractives would include water soluble carbohydrates (monosaccharides—e.g., glucose, xylose, sucrose—and oligomeric sugars); and sometimes organic acids; alditols; inorganic ions/cations; and tannins. The initial moisture contents of the IA and PA stover, ~7 and 30% respectively, were adjusted within ±2 percentage units of the target moisture to six various moisture levels (25, 35, 45, 55, 65, and 75% wet basis). Moisture adjustment was carried out by spraying with appropriate amount of deionized water, mixing thoroughly and leaving over night at 4°C to be well-absorbed into fibers. For PA 25% moisture, the stover as received was dried and rewetted to achieve the desired moisture. Corn stover was packed at a density of about 159 dry Kg/m3 in 1 pint (0.00047 m3) glass canning jars that were tightly sealed to create anaerobic conditions and stored for 220 days at 37°C. Experiments were performed in triplicate. After storage, samples were stored in the freezer at −20°C until further analysis.
Corn Stover Composition and Organic Acids
Corn stover composition before and after storage was determined by quantitative saccharification using adapted biomass analytical methods from the U.S. National Renewable Energy Laboratory (NREL) (Hames et al., 2008; Sluiter et al., 2008a,b,c). Soluble extracts were collected before and after storage for pH and organic acid measurements. Stover samples were mixed with deionized water at a ratio of 1:10, wet stover weight: water. The mixtures were shaken for 30 min at 200 rpm using a Barnstead SHKA 2000 open air platform shaker (Barnstead International, Dubuque, IA) after which the extracts were filtered through Whatman No.1 paper. The pH of extracts was determine using SevenEasy S20 pH meter (Mettler-Toledo International Inc., Columbus, OH) and calibrated with standard buffers 2, 4, and 7. The collected extracts were filtered again using 0.2 μm PTFE filters, diluted 20-fold and analyzed using Dionex ICS 3000 ion exclusion chromatography (Thermo Fisher Scientific Inc., Dionex ICS 3000, Sunnyvale, CA) for types and amount of organic acids. Separation was performed at 30°C using IonPac ICE-AS1 guard (4 × 50 mm) and analytical (4 × 250 mm) columns with 100 mM methanesulfonic acid at a flowrate of 0.16 mL/min. Organic acids were detected with a photodiode array detector (Dionex UVD 340U) at a wavelength of 210 nm. Thirteen different potential acids (lactic, acetic, butyric, pyruvate, isobutyric, valeric, isovaleric, propionic, tartaric, malic, formic, citric, succinic) were used as standards.
Fiber Reactivity Across Moisture Levels
For the fiber reactivity assay, replicates of wet stored samples, “as is” were combined then washed in multiple steps so that the organic acids and background or residual sugar level were negligible (less than or about 0.01% on a dry matter basis) and did not interfere with the assay either by inhibiting enzyme activity or inflating hydrolytic yields. Also, the removal of all extracts provided a better basis for directly testing the fibers. Samples “as is” refer to silage without any post-storage processing like drying or further size reduction. By combining replicates before resampling we reduced the variability among replicates and the propagation of error that could result from inherent variability of the samples or other unknown factors.
The moisture content of washed samples was estimated using the microwave method (Jones et al., 2004) as a guide to how much wet material was required to achieve the target dry weight for the fiber reactivity test. Fiber reactivity was measured by how much glucose was released after 3 days of enzymatic hydrolysis without additional pretreatment. Enzyme loading rates, using a commercial cellulase (Spezyme CP, Genencor, Rochester, NY), of 0 and 15 FPU/ g glucan with corresponding commercial β-glucosidase (Novozyme 188, Novozymes A/S, Bagsvaerd, Denmark) loading rates of 0 and 60 CBU/g glucan was chosen for the IA and PA stover. However, PA stover had additional samples hydrolyzed at 2 and 5 FPU/ g glucan with corresponding β-glucosidase of 8 and 20 CBU/g glucan, to explore the sensitivity of ensiled and unensiled feedstock to these lower enzyme loading rates.
Hydrolysis was carried out in 50 ml centrifuge tubes with ~1 dry gram of stover, at 15% solids loading. Tetracycline was added at a final concentration of 40 μg/mL to prevent microbial growth during hydrolysis, and citric acid buffer (pH 4.5) was added to obtain a final concentration of 0.05 M to maintain the pH in the optimum range for enzyme activity. Samples were vortexed for ~5 s before placing in a Barnstead Max Q5000 SHKE 5000-7 floor shaker/ incubator (Barnstead International, Dubuque, IA) at 50°C, 120 rpm for hydrolysis. A HOBO® U12-011H temperature data logger (Onset Computer Corp., Cape Cod, MA) was placed in incubator to monitor temperature over the 3-day hydrolytic period. Control samples included substrate blanks, enzyme blanks and unensiled feedstock as negative controls and Avicel (α-cellulose, which is pure insoluble cellulose) as a positive control.
Fiber Reactivity After Liquid Hot Water Pretreatment
The purpose of testing pretreated samples was to determine if the impact of organic acids on feedstock during storage enhances or reduces requirements of subsequent pretreatment or if fiber reactivity of wet storage samples would be more pronounced or effective after pretreatment. Pretreatment was applied to washed PA samples. The pretreatment process employed was a liquid hot water (LHW) method using the Dionex Accelerated Solvent Extraction 350 (ASE 350) (Thermo Fisher Scientific Inc., Dionex ASE 350, Sunnyvale, CA) system at 190°C, with one static cycle of 15 min and 0% flush. This temperature and time have been found to be the optimum condition for controlled pH LHW pretreatment of corn stover (Mosier et al., 2005). Hydrolysis was performed on the pretreated solids only (without the pretreatment liquid extract) in order to directly test the stover fiber without interference from extracted solubles, which may contain sugars, acids and other inhibitors.
In all cases, after hydrolysis, the samples were placed in a hot water bath at 95°C for 10 min to prevent any further enzymatic reaction after which 20 ml of deionized water was added to each sample to facilitate sampling due to the high solids loading. The samples were vortexed to mix and then centrifuged to collect supernatant for sugar analysis. The supernatants were then filtered using 0.2 μm nylon filters and stored at −20°C until analyzed for sugars. See Figure 1 for process chart.
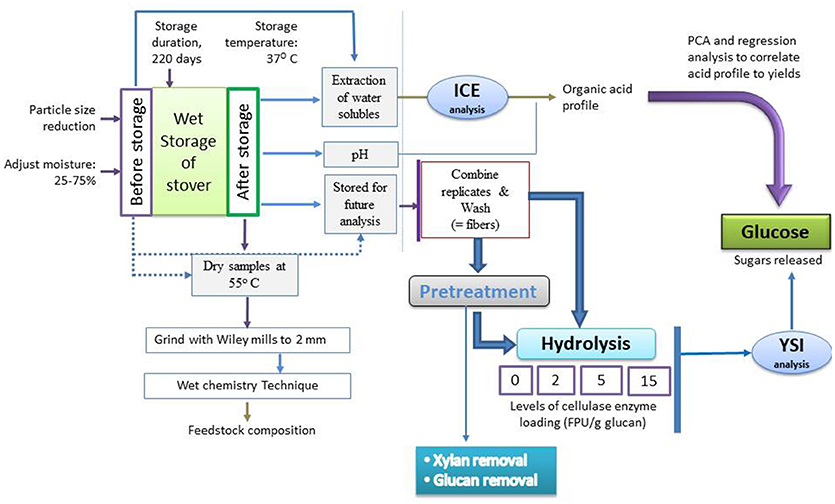
Figure 1. Process flow chart of fiber reactivity—organic acid correlation study; for each process, experiments were performed in triplicate.
Data Analysis
Filtered samples were diluted 5-fold and the amount of glucose released during hydrolysis was measured using a YSI 2700 SELECTTM biochemical analyzer (YSI Inc., Yellow Springs, OH) with 2% precision. Glucose yields from substrate and enzyme blanks, if any, were subtracted from sample yield to get actual glucose resulting from hydrolysis. For pretreated samples, glucan removed during pretreatment was subtracted from initial amount. Results were analyzed using statistical tools including principal component analysis (PCA), clustering analysis and analysis of variance (ANOVA). To analyze the effect of organic acids on fiber reactivity, PCA was first performed on raw data to see if storage samples could naturally be grouped into categories based on their organic acid profiles and to estimate the number of categories to specify for the cluster analysis. Ward's hierarchical clustering method was then used to group the samples into the appropriate number of clusters. Two other cluster analyses were performed using hydrolytic yields. One involved hydrolytic yields from the four cellulase enzyme loadings (0, 2, 5, and 15 FPU/g glucan) for the PA samples as variables for grouping and the other combined the IA and PA samples with two cellulase enzyme loadings (0 and 15 FPU /g glucan) for grouping. All correlation analyses were carried out using the Pearson Method. This gives the Pearson correlation coefficient, r, which is a dimensionless index that ranges from −1.0 to 1.0 and measures the degree of linear relationship between two data sets. The initial assumption of linearity is rejected if “r” is 0 or the p > 0.05. All statistical tests were conducted at a significance level, α, of 0.05. Statistical software used for these analyses are The Unscrambler® X 10.0 (CAMO Software Inc., Woodbridge, NJ) and Minitab 14 (Minitab Inc., State College, PA).
Results and Discussion
Organic Acid Profile
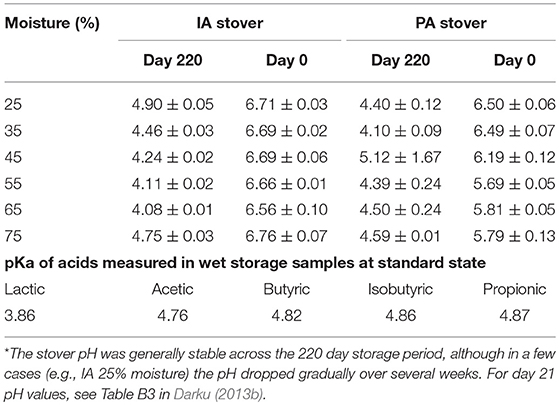
The organic acids identified in the wet stored stover samples included lactic, acetic, butyric, isobutyric, and propionic acids. Low levels of tartaric and malic acids were also identified in a number of samples but were difficult to quantify due to their short retention times near the elution of the system void volume and hence were not used in the current analysis. The results indicated that the IA control (day 0) samples had essentially no organic acids (see Figure 2). All acids are reported on a dry matter basis. PA control (day 0) samples had only lactic and acetic acids, both of which constituted ≤ 0.6% dry mass of stover. These two acids were also present in all wet stored IA and PA samples, except for samples stored at 75% moisture, which had no lactic acid likely due to clostridia secondary fermentations (Jones et al., 2004). Lactic acid concentration was up to 4.9 and 2.2% in IA and PA stover, respectively while acetic acid was up to 3.5 and 4.2%, respectively. Isobutyric acid was also present in all storage samples. Propionic and butyric acids were present only in high moisture storage samples. Figure 2 shows the organic acid profile of IA and PA stover at the two storage durations and different moisture levels. The lower acid content of the 45% PA stover could be due to compromised anaerobic storage conditions as reflected in high mean pH (5.12) compared to other storage samples (4.00–4.93) as shown in Table 2. In general total acid content increased linearly with moisture content. The correlation between total acids and moisture content was 0.813 and 0.819 for IA and PA samples, respectively, both with p < 0.0001. In terms of individual acids, all acids were significantly linearly correlated with moisture except lactic acid [lactic (r = −0.145, p = 0.398), acetic (r = 0.807, p < 0.001), propionic (r = 0.508, p = 0.002), isobutyric (r = 0.586, p < 0.0001), and butyric (r = 0.651, p < 0.0001)]. Lactic acid, however, had a second order polynomic acid-moisture relationship (R-square of means >90%). Analysis of variance showed the mean value of the various organic acids at the different moisture levels are all not equal [lactic (p = 0.003), acetic (p < 0.001), propionic (p = 0.010), isobutyric (p = 0.001), and butyric (p < 0.001)].
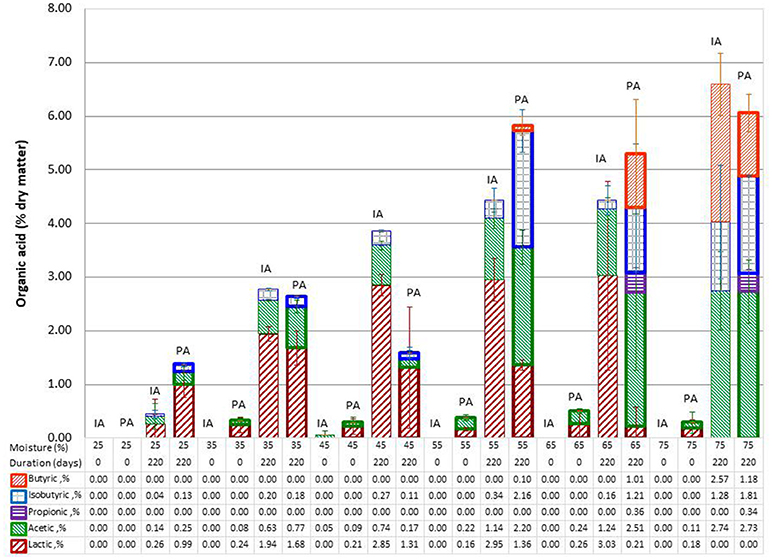
Figure 2. Organic acid profile showing means of IA and PA stover at different moisture levels. Lighter bars are IA samples and darker bars to the right are PA samples. Error bars are standard deviations of mean.
Studies on organic acids for biomass pretreatment have tested a wide range of pretreatment severities that are much higher than can be expected during wet storage: acid concentrations from 1 to 80% wt; temperatures of 100–210°C; and retention time of 10 min to 1 h (Kootstra et al., 2009; Lee and Jeffries, 2011; Marzialetti et al., 2011; Barisik et al., 2016). Furthermore, the organic acids that are dominant during wet storage are not those typically explored for conventional pretreatment. There are limited studies on acetic acid, which is common in and sometimes dominant during ensilage, but most studies have focused on dicarboxylic acids because they are relatively stronger than the analogous monocarboxylic acids due to the two ionizable functional groups they have. More importantly, as a result of the two functional groups, these acids also have two pKa values, which could make them more suitable and efficient in hydrolytic pretreatment over a range of temperature and pH values (Lee and Jeffries, 2011). One unexplored area is the interaction of various organic acids on biomass structure, as could be possible in wet storage systems.
Cluster Analysis
For PA organic acids, the first two principal components accounted for ~82% of total variability. Approximately 41% of the samples were significantly associated with the first component, and about 53% were associated with the second component. Acetic, propionic, isobutyric, and butyric acids, i.e., volatile fatty acids, were the major contributors to component 1, while lactic acid was the main contributor, ~86%, to component 2. This is also true for PCA of the combined PA and IA samples. These PCA results were supported by the strong correlation acetic acid has with isobutyric acid (0.912, p < 0.0001), propionic acid (0.643, p = 0.001) and butyric acid (0.770, p < 0.0001), all of which were strongly correlated with each other. No significant correlations exist between lactic acid and these acids. However, when considering only day 220 samples, there were some negative correlations between lactic and isobutyric (−0.446, p = 0.006), propionic (−0.360. p = 0.031) and butyric acids (−0.552, p < 0.0001) but still no correlation with acetic (−0.297, p = 0.079). Since lactic and acetic acid were not correlated, both as dominant acids could qualify as potential predictors of storage effect in defining relationship between storage acid and glucose yield, if multicollinearity is to be avoided.
Based on the PCA result, three categories were chosen for Ward's clustering analysis. The three categories resulting from the cluster analysis of PA samples were: (1) high amount of acids (5 to <10%) associated with high moisture wet stored samples (55–75% moisture), (2) a moderate amount of acids (2 to <5%) associated with low moisture wet stored samples (35 and 45% moisture), and (3) low amount of acids (<2%) associated with day 0 and 25% moisture anaerobic (wet stored) samples. These three groupings were maintained when combined with the IA samples, which had a slightly different pattern. The IA groupings were: (1) High amount of acids: wet stored samples with 75% moisture, (2) moderate amount of acids: wet stored sample with 35–65% moisture and (3) low amount of acids: day 0 and 25% moisture anaerobic (wet stored) samples.
Fiber Reactivity of Pretreated Washed PA Stover
To evaluate the impact of pretreatment, xylan, and glucan removal were measured as well as enzymatic hydrolytic sugar yields after pretreatment. Xylan removal was used as an indicator of liquid hot water (LHW) effectiveness. When taking into account the amount of xylan degraded during storage, xylan removals in the day 220 samples were significantly higher (55.0% ± 7.2) than day 0 samples (47.2% ± 6.1) (p < 0.0001) as shown in Figure 3. This suggests that the percentage xylan removal had approached the limit of removal under LHW conditions or could be close to xylan removal under optimum pretreatment conditions. The idea of a limit to xylan removal in liquid hot water pretreatment is also based on results from Elander et al. (2005) and Zheng et al. (2009), in which xylan removal was always <55%. Xylan removals for day 220 samples were more variable than day 0 and not significantly different across moisture (p = 0.915). For day 0, there were no significant differences among the different moisture treatments except for the 35% moisture condition, which was lower than 65% moisture (p = 0.031).
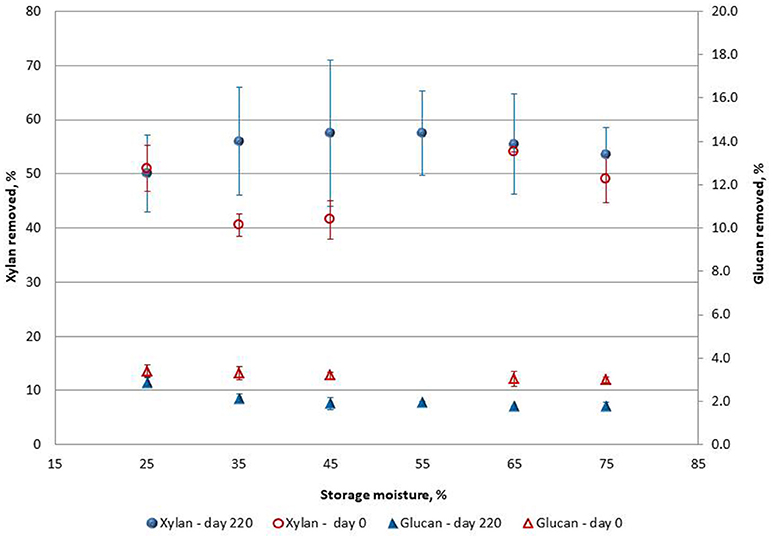
Figure 3. Xylan and glucan removal during LHW pretreatment of ensiled (day 220) and unensiled (day 0) PA stover. Error bars are standard deviations of mean (Data for 55% moisture, Day 0 missing).
As shown in Figure 3, the glucan removed during pretreatment was generally <4% for both day 0 and day 220. Day 0 samples had significantly higher glucan removal during pretreatment (p < 0.0001) than day 220. The relatively low glucan removed from wet storage samples could be a result of some glucan degradation (on average ~1%) during storage, hence a lesser amount of readily degradable glucan was available for removal during pretreatment. For glucan removal there was no significant difference across moisture for day 0 samples (p = 0.545). Glucan removal at day 220 was also not significantly different across moisture levels except for 25% moisture (p = 0.030), which was only similar to the 35% moisture samples.
Glucose yields, from fiber reactivity studies, were calculated with reference to the mean glucan composition for each moisture level and reported as percent of theoretical yields. The glucan content of the initial biomass prior to the storage trials ranged from 33.50 to 35.63% for both IA stover and PA stover. Grams glucan were converted to glucose using a factor of 1.111. Glucan removed during pretreatment was subtracted from this original amount to determine the appropriate amount of enzymes to add and for calculation of theoretical yields. As expected, glucose yields increased significantly with enzyme loading (p < 0.001) (see Figure 4). For the PA stover, these values were 28.79% ± 4.33, 47.18% ± 3.45 and 84.18% ± 6.65 for 2, 5, and 15 FPU/g glucan, respectively. The results indicated that the glucose yields of day 220 and day 0 samples were not significantly different at the various enzyme loadings, p = 0.586 (Figure 4). Furthermore, glucose yields at various moisture levels for each enzyme loading were not significantly different for both day 0 (p = 0.994) and day 220 (p = 0.990). The implication is that xylan removal from the biomass during pretreatment did not serve as a good indicator for downstream glucan hydrolysis. This is understandable since conditions used for pretreatment were the optimum time and temperature for raw feedstock. Given the differences in xylan removal, it is possible that at a lower pretreatment severity (less time and/or a lower temperature), there might be significant differences in glucose yield between day 220 and day 0 samples.
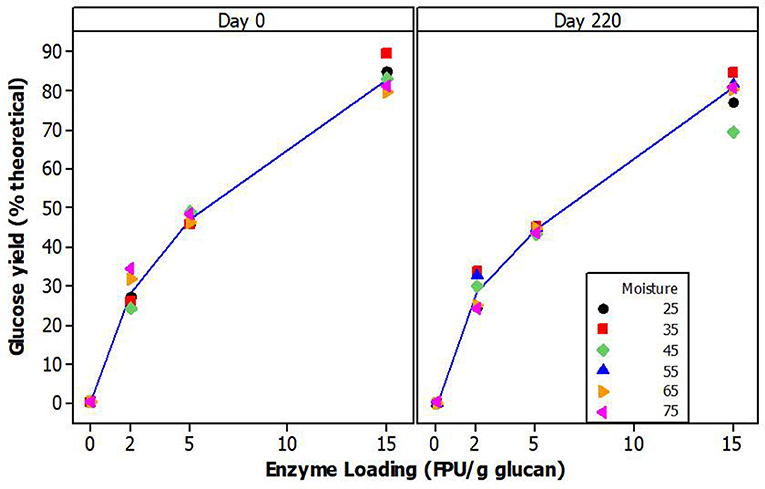
Figure 4. Mean glucose yield (% theoretical) of pretreated washed PA corn stover fiber at different enzyme loadings.
Fiber Reactivity of Corn Stover Without Pretreatment
Fiber reactivity results showed the glucose hydrolysis yields for both stover types to be generally poor, <30% of theoretical. The glucose yields after hydrolysis were calculated using mean glucan composition for each moisture level as was done for pretreated samples. As expected, sugar yield increased with increased enzyme loading. At 15 FPU cellulase enzyme loading, the glucose yields of day 220 samples of both IA and PA stover were significantly higher (p < 0.0001) than corresponding day 0 samples. Average yields for day 220 were ~23.61% ± 3.16 and 15.54% ± 5.71, respectively in contrast to 14.30% ± 4.83 and 11.05% ± 3.51 for day 0. At 5 FPU cellulase enzyme loading, glucose yields of PA stover at day 220 (12.56% ± 3.41) were significantly higher than yields at day 0 (9.60% ± 3.85) (p = 0.022). However, at 2 FPU there were no significant differences as a result of wet storage, 8.83% ± 2.80 vs. 6.93% ± 3.20 for day 220 and day 0, respectively (p = 0.065). Compared to yields obtained from Avicel hydrolysis (~58% for 2 FPU, 65% for 5 FPU and 83% for 15 FPU), enzymatic access to stover cellulose was still limited after wet storage. This could be due to the low level of hemicellulose degradation during storage as compared to conventional pretreatment. On average 10% of hemicelluloses in IA stover was degraded during storage, in contrast to ~55% removal during LHW pretreatment (of PA stover). In theory, the pretreatment capability of wet storage derives from hemicelluloses degradation as a result of organic acid interaction.
In this study there was no significant difference in storage (day 220) hemicellulose degradation across the tested range of storage moisture contents (p = 0.083) and no correlation between hemicellulose degradation and glucose yields (p = 0.90). However, if day 0 samples are also considered in the analysis, in addition to the day 220 samples, then correlation between hemicellulose degradation and glucose yield exists and is significant, 0.62 (p = 0.001). For day 220, the IA samples had statistically significant groups of [(25–45%) 65%], (55, 65%) and (55, 75%) in decreasing glucose yields (p < 0.0001). The overlaps defined using the Tukey test suggest glucose yields at all moisture levels were not that different except for 75% moisture, which is similar to 55% percent moisture but significantly differs from the remaining moisture contents. For the PA samples at an enzyme loading of 15 FPU, the groups were (45–65%), (35, 65%) and (25, 75%) (p < 0.0001). Yields from the 25 and 75% moisture samples were the lowest among this set. Thus, when these extreme moisture levels are avoided, a similar glucose yield could be expected from wet storage across a wide range of moisture contents. On the other hand, as expected, day 0 samples did not show any significant difference in glucose yields across moisture for both stover types (p = 0.346 for IA stover and p = 0.073 for PA stover). See Figure 5 for glucose yields across moisture.
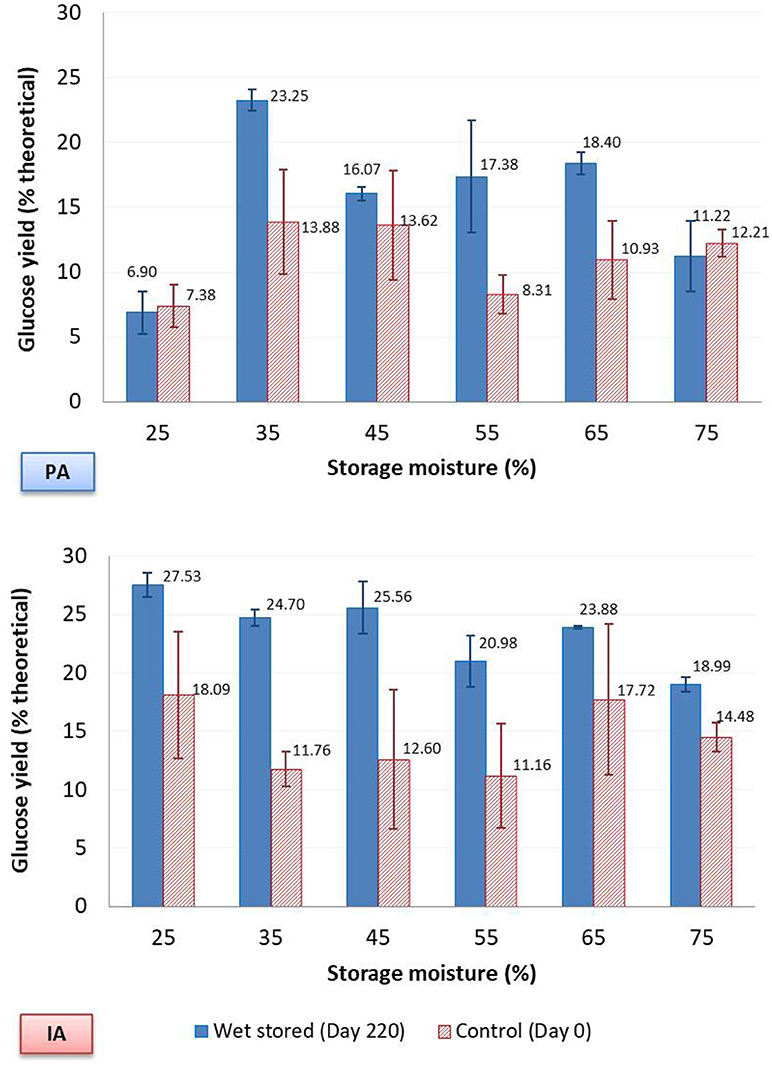
Figure 5. Glucose yield of fiber reactivity test, with 15 FPU/g glucan cellulase enzyme loading, without pretreatment. Error bars are standard deviations of mean.
Cluster analysis was performed on glucose yields of the fiber reactivity test, initially assuming the same number of groups (three) as was determined for the organic acid cluster analysis. PA samples were clustered based on yields from the four cellulase enzyme loadings: 0, 2, 5, and 15 FPU /g glucan. The result was slightly different from the combined IA-PA set, which was based on two enzyme loadings (0 and 15 FPU/g glucan). The three PA stover glucose clusters consisted of (1) high glucose yield: wet storage (day 220) 35–65% moisture samples, (2) moderate glucose yield: all day 0 samples excluding 25% moisture, as well as 25 and 75% wet stored (day 220) samples; and (3) low glucose yield: day 0, 25% moisture. The combined IA-PA analysis yielded: (1) high glucose yield: wet storage with 25–65% moisture for IA; 35% for PA, (2) moderate glucose yield: wet storage moisture of 75% for IA; 45–65% for PA and (3) low glucose yield: day 0 samples including PA wet stored samples of 25 and 75% moisture. The cluster outcome also showed that for each stover type, two groups could be sufficient, defined as wet stored samples and day zero samples. In general, IA samples had higher glucose yields than PA samples (p > 0.0001). Wet stored IA samples were clustered as relatively high yielding while wet stored PA samples fall mainly under moderate glucose yield. This lower outcome for PA stover compared to IA stover could be due to the lower pH of the former and the presence of more volatile acids which have higher pKa. The implication is that the PA stover had comparatively fewer protons available during storage for the catalysis of hydrolytic pretreatment.
Relating Organic Acid Cluster to Fiber Reactivity Cluster
The relationship between the clusters of similar organic acid portfolios with clusters of similar glucose yields was examined using results from the fiber reactivity assay across different moisture contents for non-pretreated, anaerobically stored samples. For the PA stover clusters, high glucose yields were associated with high acid levels (excluding the 75% moisture sample) and moderate acid levels. Moderate glucose yields were associated with day 0 samples (excluding the 25% moisture sample) as well as 25% and 75% moisture samples of day 220. Low glucose was associated with day 0, 25% moisture samples. The relationships between the organic acid and fiber reactivity clusters of the combined IA and PA samples are shown in Figures 6, 7. The pattern in Figure 6 suggests some reasonably distinct range of glucose yields and associations with organic acid levels and also corroborates the advantage of anaerobic storage at moisture levels of 35–65%. Glucose yields across this full population of ensiled and unensiled samples were correlated with the total organic acids (r = 0.349, p = 0.002) with significant differences in the glucose yields of the various group (p < 0.0001). In general, high glucose yields were associated with moderate organic acid levels; moderate glucose yields were associated with high organic acid levels; and low glucose yield with little or no organic acids. Two exceptions were the PA and IA stover samples stored anaerobically at 25% moisture. Interestingly, although both clustered in the low range for organic acid concentrations, the IA stover produced a high glucose yield while the PA stover had a low glucose yield. This suggests an important effect of biomass harvest conditions and structural composition on subsequent hydrolysis. Across this full population of initial (day 0) and wet storage (day 220) samples, only lactic acid showed a significant correlation with glucose yield (r = 0.518, p < 0.0001). Earlier, under organic acid cluster analysis, acetic acid and lactic acid were suggested predictors for glucose based on their dominance but more importantly to avoid potential for multicollinearity. Figure 8 shows how lactic acid serves as a more logical predictor relative to acetic.
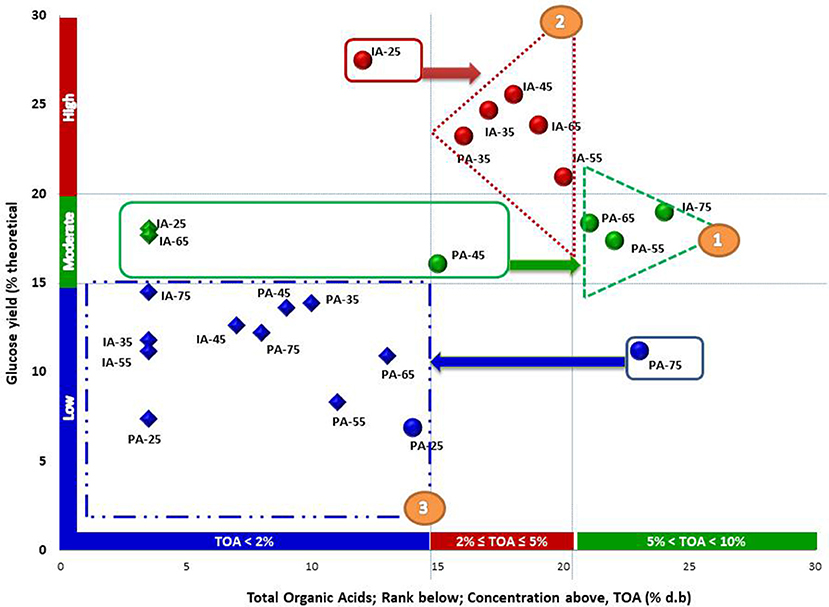
Figure 6. Relationship between organic acids and fiber reactivity cluster grouping of PA/IA corn stover (without pretreatment) and grouped using ranks of mean glucose yields from cellulase enzyme loading of 15 FPU/g glucan and ranks of mean total acids. The ranks of mean glucose correspond with the percentage theoretical yields. Diamonds represent day 0 samples and circles represent day 220 samples. Numbers following IA and PA represent storage moisture content on a percent wet basis.
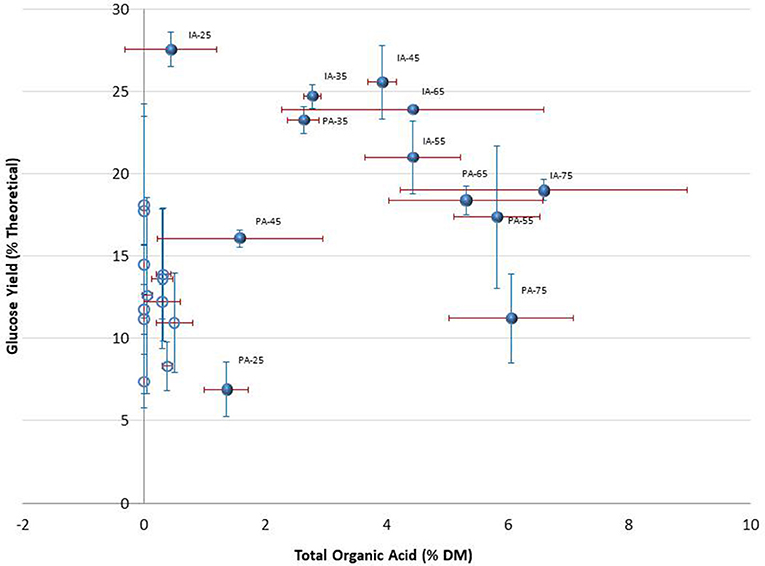
Figure 7. Relationship between total organic acids and glucose yields of PA and IA corn stover without pretreatment. Unlike Figure 6, this chart is based on actual values of glucose yields (from 15 FPU/g enzyme loadings) and actual amount of organic acids as percentage of dry matter. Filled circles = Day 220; Opened, unlabeled circles = Day 0. Data labels for Day 0 not included because congested. Error bars are standard deviation of means.
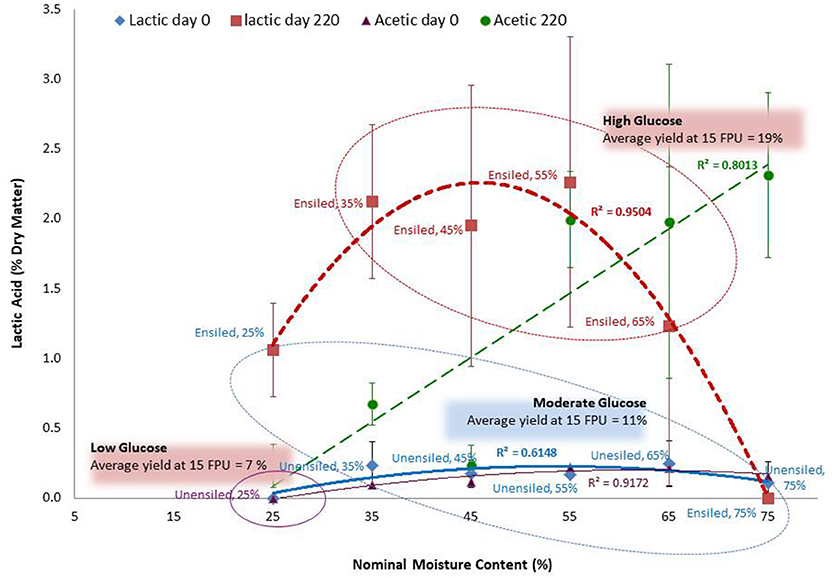
Figure 8. Relating glucose from fiber reactivity grouping of PA corn stover without pretreatment with lactic acid and acetic acid. To capture a better range of amount of acid produced during silage, data for lactic and acetic acid is a wider set that includes data of corn stover feedstock not used in the fiber reactivity test (i.e., includes samples stores at 23°C). See Darku (2013b). The R-square values are for mean acid values and so do not capture the variability of organic acid yield at the various moisture levels. The three groups (captured within the ovals) show lactic acid levels and glucose yields that are not significantly different within groups but significantly different among groups. Error bars are standard deviations of mean.
When considering only stored samples (day 220), glucose was not correlated to total acids (−0.142, p = 0.409). The contrary effects associated with low acid concentrations in the 25% moisture IA and PA samples were partially responsible, as were the moderate and low glucose yields for the highest acid concentrations, at 75% moisture. Moderate acid concentrations were associated with high glucose yields, suggesting an optimum level of total acids. Glucose yields showed some significant correlations with some individual acids; positively with lactic acid (0.366, p = 0.028) and negatively with propionic (−0.345, p = 0.039) and isobutyric (−0.340, p = 0.043). There was no correlation with neither acetic nor butyric acids (each: 0.299, p = 0.180). In Table 3, it can be observed that this overall relationship does not necessary hold within the cluster groups. Organic acids, specifically lactic and acetic acids were significantly and positively correlated to glucose yields in Group 2 (samples with moderate acid levels), even though lactic acid dominates. In Group 1 (samples with high acid levels), all acids were present, however none of them was correlated with the glucose yields. Acetic acid is dominant in this group, and even assuming the correlation p-values gave a false negative (i.e., assuming there is in fact a significant correlation contrary to what the p-values from the analysis indicate), acetic acid showed a very weak correlation compared to other acids. Glucose yields from Group 3 (samples with low acid levels) were also not affected by individual organic acids, but this was understandable since acids levels were negligible. Although glucose yields from Group 1 and 3 had no correlations with individual organic acids, Group 1 had significantly higher glucose yields than Group 3 when excluding the sole storage condition with high glucose yield in Group 3 (IA stover, 25% moisture at day 220) (p = 0.006). Otherwise there was no significant difference in the glucose yields of the two groups (p = 0.090).
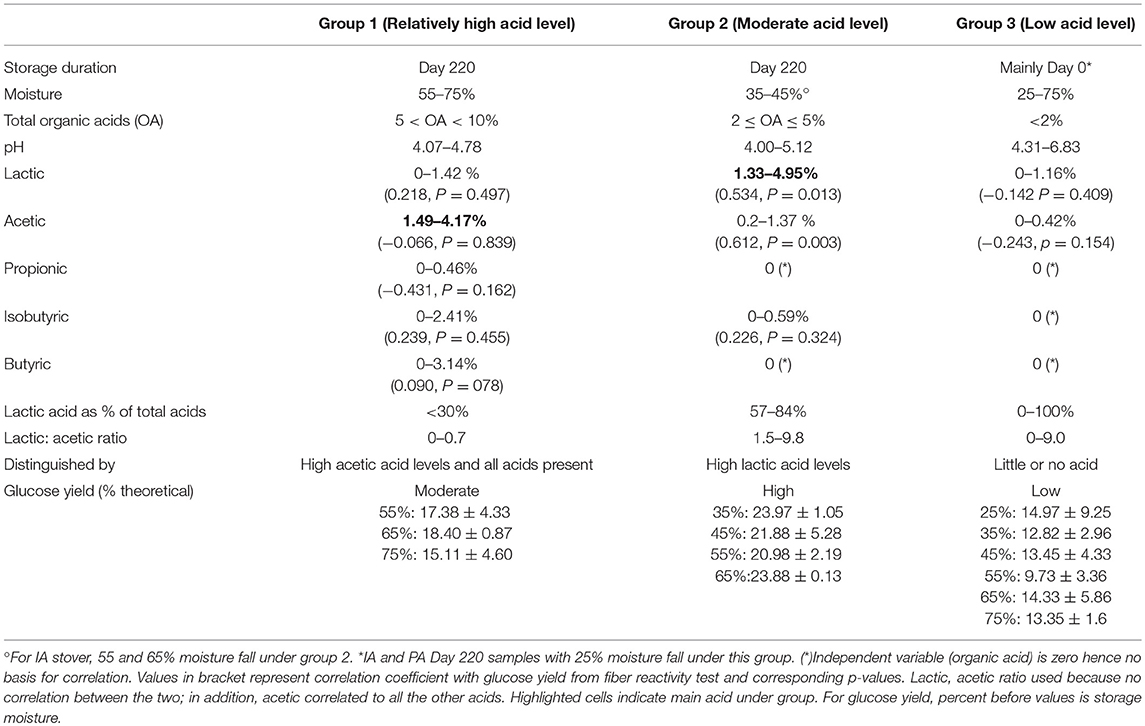
Table 3. Differences in the three organic acid groupings and correlation of individual acids with glucose.
Although Group 1 has a high total acid concentration, the relatively low yields compared to Group 2 cannot be attributed to the potential inhibitory nature of the acids since the samples were thoroughly washed before hydrolysis. The pH values during storage (4.07–4.78), and the acid profile of the high acid samples (in which volatile acids dominate with pKa of 4.76–4.88) suggest that the effect of the Group 1 acids on fiber structure could be negligible. This is because the level of dissociated acids, and hence protons to facilitate cleavage of bonds, were lower in Group 1 than in Group 2. On the other hand, for the cluster of samples with moderate total acid concentrations (Group 2), lactic acid with a pKa of 3.86 is dominant. In this cluster, the high pH relative to this pKa leads to a relatively high dissociation of lactic acid, resulting in more hydrogen ions being available for the hydrolytic reaction that alters the feedstock structure. This also may explain why lactic acid was the only acid correlated to glucose yields. In addition, this may explain why the IA stover, which produced more lactic acid during wet storage, had higher glucose yields than the PA stover. The overall effect of these pKa – pH relationships increases the natural pretreatment effect of the lactic acid dominated treatments in Group 2, while a much lower effect is observed with the higher pKa acids that dominate in Group 1. Although high concentrations of these volatile acids are present in Group 1, their impact on glucose yield is minimal, with results similar to Group 3 which had little or no acid.
Highlights and Practical Implications of This Study
Wet storage has been recommended over dry storage as a biofuel feedstock storage system suitable for warm, humid climates, typical of most of the major U.S. agricultural zones. These climatic conditions prolong field drying and result in extensive material deterioration before material reaches a state that is dry enough for storage. The narrow harvest window experienced as a result of weather conditions in major agricultural regions of the US, in particular the Midwest corn belt, necessitate that harvest of crop residue be carried out within 40 days of grain harvest before winter arrives with heavy snow and wind. Within these 40 days, biomass can experience significant moisture changes. This study corroborates and provides evidence that the adaption of ensilage technology, which has been proven in the livestock feeding industry but not commercially applied to cellulosic biofuels, provides an alternative to dry storage that resolves the conflict between a short harvest window and the need for prolonged field drying.
This research shows that although ensilage for the livestock feed industry vs. for biofuel production may have some common requirements, e.g., the need for lactic acid dominance, in other respects the requirements differ. For instance, whereas the livestock industry would recommend a very narrow moisture range for any particular storage configuration, a much wider range can be accommodated by the biofuel industry with similar end product quality. In this study, the storage configuration used, which is comparable to traditional upright silo, yielded similar results for moistures 35–65%. In traditional upright ensilage the recommended moisture is 60–65%. Even when considering all storage configurations for traditional ensilage, the moisture range is still relatively narrow, ranging from 50 to 70%. With biofuels, however, if extreme moisture levels (≤ 25 and ≥75%) are avoided, the quality of feedstock as indicated by its reactivity to enzymes was not significantly different. The implication is that even when harvesting heterogeneous moisture material, such as different anatomical fractions, various heights of cut, or when unable to harvest stover residue immediately after grain harvest, biorefineries can be optimistic about the storage outcome if moistures are within 35–65%.
Although previous studies have recommended wet storage as an alternative to dry storage, none of the commercial cellulosic plants have yet incorporated any wet storage solutions. Instead, every one of the biorefineries storing corn stover uses dry bales, and every one has had serious fires and lost massive quantities of biomass feedstock. While there is interest in wet storage as a solution to this challenge, there is limited understanding of how wet storage works in a biochemical conversion process, or how those outcomes change with slight moisture variations compared with conventional dry storage. There also remains a perception that wet storage presents an economic disadvantage as high moisture is transported along the supply chain. The latter concern is addressed in Darku (2013a), which modeled farm gate cost of wet and dry storage feedstock and shows cost of ensiled feedstock at moisture content <40% to be comparable or better than dry bales. The former concern, which relates to feedstock quality, is addressed in this research.
In particular, the results of this study indicate that the lactic acid produced during wet storage stood out from other acids as the major contributor to feedstock quality. Samples with moderate organic acid concentrations (2 to ≤ 5% dry matter) correlated with high lactic acid and with high glucose yields, which could then be converted into biofuels or other products. These results suggest that lactic acid dominance in the ensilage process is key to wet storage pretreatment effectiveness, and is more important than high amounts of total acid.
Conclusions
There is evidence from the fiber reactivity test conducted in this study that wet storage, without any form of biological or chemical additives, does indeed have pretreatment capability. Although cellulose accessibility was limited, due to the low hemicellulose degradation during storage, the feedstock structure was altered enough to improve glucose yields over day 0 samples by a factor of ~1.5–2.4. However, relative to conventional pretreatment and theoretical glucose yields, these yields were low, indicating that wet storage of corn stover biomass would still require post-storage pretreatment to achieve desirable hydrolytic yields. The glucose yield after enzymatic hydrolysis of wet stored samples was comparable across moisture except for the extreme moisture levels tested (25 and 75%). Generally, storage at 75% moisture had the lowest glucose yield. In the moderate moisture range from 35 to 65%, this similarity in yields also minimizes the expected complexity and questions about quality given the varied moisture conditions under which different farmers may harvest and store their biomass feedstock. Other crop management factors rather than storage moisture may be of more concern to quality outcome.
Cluster analysis comparisons indicated that moderate (total) acid levels corresponded with high glucose yields and vice-versa, with significant but not very strong correlations. For wet storage pretreatment to proceed, organic acids must dissociate to provide protons that will catalyze the cleavage of bonds. Generally, samples with high total acid levels are high moisture samples (55–75%) with comparatively lower lactic acid amount, while samples with moderate acid levels had comparatively higher lactic acid concentration. Lactic acid was found to be the most influential acid because of its low pKa, which allows more dissociation at the relatively high pH typical of corn stover silages.
With respect to post-storage liquid hot water pretreatment, there was no significant difference between hydrolytic yields of day 220 and day 0 samples likely due to the pretreatment conditions employed. It is probable that less severe conditions would favor wet storage samples over day 0 samples as the former had more xylan. Also using fresh stover instead of rewetted dry stover could present different outcome in favor of the former. The lack of difference at lower enzyme loadings could be more of low reaction rate rather than maximum yield that could be obtained from the two durations.
Author Contributions
DE and TR conceived the idea. DE designed, planned and performed the experiments. MM contributed to the experimental set-up, analytical methods used and provided some technical support. AR provided the methodology and settings for washing the feedstock. TR and MM provided critical feedback that shaped the research as it progressed. DE performed the data analysis, drafted the manuscript and designed the figures. All authors discussed the results and commented on the manuscript.
Conflict of Interest Statement
The authors declare that the research was conducted in the absence of any commercial or financial relationships that could be construed as a potential conflict of interest.
Acknowledgments
This research was supported by the U.S. Department of Energy, Office of Energy Efficiency and Renewable Energy, Bioenergy Technologies Office, under DOE Idaho Operations Office Contract DE-AC07- 05ID14517. Additional project support was provided by Penn State University and Agriculture and Food Research Initiative Competitive Grant No. 2012-68005-19703 from the USDA National Institute of Food and Agriculture. The authors are grateful to Kay DiMarco and the many students that helped out in the lab. The authors would also like to thank the Bioenergy Technologies Office for their support. The views and opinions of the authors expressed herein do not necessarily state or reflect those of the United States Government or any agency thereof. Neither the United States Government nor any agency thereof, nor any of their employees, makes any warranty, expressed or implied, or assumes any legal liability or responsibility for the accuracy, completeness, or usefulness of any information, apparatus, product, or process disclosed, or represents that its use would not infringe privately owned rights.
References
Barisik, G., Isci, A., Kutlu, N., Elmaci, B. S., and Akay, B. (2016). Optimization of organic acid pretreatment of wheat straw. Biotechnol. Progr. 32, 1487–1493. doi: 10.1002/btpr.2347
Brown, R. C., and Brown, T. R. (2014). Biorenewable Resources: Engineering New Products from Agriculture. Hoboken, NJ: John Wiley & Sons. doi: 10.1002/9781118524985
Chen, C., Sharma-Shivappa, R., Chen, Y., Wichman, D., and Johnson, D. (2007). “Potential of annual cereal crops to serve as fuel ethanol feedstock and livestock feed,” Proceedings 6th National Symposium Creating Markets for Economic Development of New crops and New Uses, eds J. Janick and A. Whipkey (Alexandria, VA: ASHS Press), 47–55.
Chen, Y., Sharma-Shivappa, R. R., and Chen, C. (2007). Ensiling agricultural residues for bioethanol production. Appl. Biochem. Biotechnol. 143, 80–92. doi: 10.1007/s12010-007-0030-7
Chesson, A. (1993). “Mechanistic models of forage cell wall degradation,” in Forage Cell Wall and Digestibility, eds H. G. Jung, D. R. Buxton, R. D. Hatfield, and J. Ralph (Madison, WI: ASA-CSSA-SSSA), 347–376.
Darku, I. D. (2013a). SLEEPS — Storage, Logistics and Economics of Ethanol Production from Stover. Penn State University Data Comons. Available online at: http://www.datacommons.psu.edu/commonswizard/MetadataDisplay.aspx?Dataset=6130
Darku, I. D. (2013b). Characterization of Wet Storage Impacts on Bioprocessing of Corn Stover to Biofuels. Ph.D. Dissertation University Park, The Pennsylvania State University.
Digman, M. F., Shinners, K. J., Dien, B. S., Hatfield, R. D., Li, X., Muck, R. E., et al. (2007). “On-farm pretreatment technologies for improving enzymatic degradability of cellulose and hemicellulose present in perennial grass,” in ASABE Paper No 071021. St Joseph, MO: ASABE.
Donohoe, B., Haas, T., Wiess, N., Ding, S., Nagle, N., and Himmel, M. (2009). “Evaluation of plant cell wall structure of ensiled corn stover by correlative microscopy,” NREL/PO-270-44906 Poster presentation at the 31st Symposium on Biotechnology for Fuels and Chemicals May 3-6, San Francisco, CA.
Donohoe, B. S., Decker, S. R., Tucker, M. P., Himmel, M. E., and Vinzant, T. B. (2008). Visualizing lignin coalescence and migration through maize cell walls following thermochemical pretreatment. Biotechnol. Bioeng. 101:913–925. doi: 10.1002/bit.21959
Eggeman, T., and Elander, R. T. (2015). Process and economic analysis of pretreatment technologies. Bioresour. Technol. 96:2019–2025 doi: 10.1016/j.biortech.2005.01.017
Elander, R. T., Wyman, C. E., Dale, B. E., Holtzapple, M. T., Ladisch, M. R., Lee, Y. Y., et al. (2005). “Initial comparative process economics of leading pretreatment technologies,” in Presented at the 15th International Symposium on Alcohol Fuels and Other Renewables, San Diego, CA.
Hames, B., Ruiz, R., Scarlata, C., Sluiter, A., Sluiter, J., and Templeton, D. (2008). “Preparation of samples for compositional analysis,” in Laboratory Analytical Procedure (LAP) NREL/TP-510-42620 (Golden, CO: National Renewable Energy Laboratory).
Heinrichs, J., and Kononoff, P. (2002). Evaluating Particle Size of Forages and TMRs Using the New Penn State Forage Particle Separator. Pennsylvania State University, College of Agricultural Sciences, Cooperative Extension DAS 02-42.
Henk, L. L., and Linden, J. C. (1994). “Silage processing of forage biomass to alcohol fuel,” in Enzymatic Conversion of Biomass for Fuels Production, eds M. E. Himmel, J. O. Baker, and R. P. Overend (Washington, DC: ACS symposium series 566), 391–410. doi: 10.1021/bk-1994-0566.ch020
Henk, L. L., and Linden, J. C. (1996). Solid-state production of ethanol from sorghum. Appl. Biochem. Biotechnol. 57, 489–501. doi: 10.1007/BF02941729
Igathinathane, C., Womac, A. R., Sokhansanj, S., and Pordesimo, L. O. (2006). Mass and moisture distribution in aboveground components of standing corn plants. Trans. ASABE 49, 97–106. doi: 10.13031/2013.20217
Jacobsen, S. E., and Wyman, C. E. (2000). Cellulose and hemicellulose hydrolysis models for application to current and novel pretreatment processes. Appl. Biochem. Biotechnol. 84–86, 81–96. doi: 10.1385/ABAB:84-86:1-9:81
Jones, C. M., Heinrichs, A. J., Roth, G. W., and Ishler, V. A. (2004). From Harvest to Feed: Understanding Silage Management. Agricultural Research and Cooperative Extension, The Pennsylvania State University.
Kootstra, A. M. J., Beeftink, H. H., Scott, E. L., and Sanders, J. P. (2009). Comparison of dilute mineral and organic acid pretreatment for enzymatic hydrolysis of wheat straw. Biochem. Eng. J. 46, 126–131. doi: 10.1016/j.bej.2009.04.020
Kumar, A. K., and Sharma, S. (2017). Recent updates on different methods of pretreatment of lignocellulosic feedstocks: a review. Bioresour. Bioproc. 4:7. doi: 10.1186/s40643-017-0137-9
Lee, J., and Jeffries, T. W. (2011). Efficiencies of acid catalysts in the hydrolysis of lignocellulosic biomass over a range of combined severity factors. Bioresour. Technol. 102, 5884–5890. doi: 10.1016/j.biortech.2011.02.048
Li, C., Aston, J. E., Lacey, J. A., Thompson, V. S., and Thompson, D. N. (2016). Impact of feedstock quality and variation on biochemical and thermochemical conversion. Renew. Sustain. Energy Rev. 65, 525–536. doi: 10.1016/j.rser.2016.06.063
Linden, J. C., Henk, L. L., Murphy, V. G., Smith, D. H., Gabrielsen, B. C., Tengerdy, R. P., et al. (1987). Preservation of potential fermentables in sweet sorghum by Ensiling. Biotechnol. Bioeng. 30:860–867. doi: 10.1002/bit.260300708
Marzialetti, T., Miller, S. J., Jones, C. W., and Agrawal, P. K. (2011). Switchgrass pretreatment and hydrolysis using low concentrations of formic acid. J. Chem. Technol. Biotechnol. 86, 706–713. doi: 10.1002/jctb.2573
McDonald, P., Henderson, A. R., and Heron, S. J. E. (1991). The Biochemistry of Silage, 2nd Edn. Marlow: Bucks; Chalcobe Publications.
Mosier, N., Hendrickson, R., Ho, N., Sedlak, M., and Ladisch, M. R. (2005). Optimization of pH controlled liquid hot water pretreatment of corn stover. Bioresour. Technol. 96, 1986–1993. doi: 10.1016/j.biortech.2005.01.013
Muck, R. (1996). “Inoculation of silage and its effects on silage quality,” in Proc. of the Dairy Forage Research Center Conference with Dairy and Forage Industries, US Dairy Forage Res. Madison, WI, 43–51.
Muck, R. E. (2010). Silage microbiology and its control through additives. Rev. Brasil. Zoot. 39, 183–191. doi: 10.1590/S1516-35982010001300021
Oleskowicz-Popiel, P. (2010). Biogas and Bioethanol Production in Organic Farming. Ph.D. dissertation. Kongens Lyngby, Denmark. Risø DTU National Laboratory for Sustainable Energy, Technical University of Denmark. Available online at: http://orgprints.org/19318/4/19318.pdf
Pakarinen, A., Maijala, P., Jaakkola, S., Stoddard, F. L., Kymäläinen, M., and Viikari, L. (2011). Evaluation of preservation methods for improving biogas production and enzymatic conversion yields of annual crops. Biotechnol. Biofuels 4:20. doi: 10.1186/1754-6834-4-20
Ren, H. (2006). Effect of Cell Wall Degrading Enzymes and Chemicals on Corn Stover Preservation and Pretreatment During Ensilage Processing. Ph.D. Dissertation University Park, Pennsylvania: The Pennsylvania State University.
Ren, H., Richard, T. L., and Moore, K. J. (2007). The impact of enzyme characteristics on corn stover fiber degradation and acid production during ensiled storage. Appl. Biochem. Biotechnol. 136–140, 221–238. doi: 10.1007/s12010-007-9054-2
Richard, T. L., Proulx, S., Moore, K. J., and Shouse, S. (2001). “Ensilage technology for biomass pre-treatment and storage,” in ASAE Paper No 016019. St Joseph, MO: ASAE.
Sluiter, A., Hames, B., Ruiz, R., Scarlata, C., Sluiter, A., Sluiter, J., et al. (2008a). “Determination of structural carbohydrates and lignin in biomass,” in Laboratory Analytical Procedure (LAP) NREL/TP-510-42618. Golden, CO: National Renewable Energy Laboratory.
Sluiter, A., Hames, B., Ruiz, R., Scarlata, C., Sluiter, A., Sluiter, J., et al. (2008b). “Determination of ash in biomass,” in Laboratory Analytical Procedure (LAP) NREL/TP-510-42622. Golden, CO: National Renewable Energy Laboratory.
Sluiter, A., Ruiz, R., Scarlata, C., Sluiter, A., Sluiter, J., and Templeton, D. (2008c). “Determination of extractives in biomass,” in Laboratory Analytical Procedure (LAP) NREL/TP-510-42619. Golden, CO: National Renewable Energy Laboratory.
Stoddart, B. (2007). The Structures of Plant Tissues and the Effects of Drying and Fluid Preservation Upon Them. NatSCA News11, 38–43. Available online at: http://www.natsca.org/article/223
Sun, Y., and Cheng, J. (2002). Hydrolysis of lignocellulosic materials for ethanol production: a review. Bioresour. Technol. 83, 1–11. doi: 10.1016/S0960-8524(01)00212-7
Tanjore, D., and Richard, T. L. (2015). “A systems view of lignocellulose hydrolysis,” in Advances in Bioprocess Technology, ed R. Pogaku (Zug: Springer International Publishing), 387–419. doi: 10.1007/978-3-319-17915-5_19
Thomsen, M. H., Holm-Nielsen, J. B., Oleskowicz-Popiel, P., and Thomsen, A. B. (2008). Pretreatment of whole-crop harvested, ensiled maize for ethanol production. Appl. Biochem. Biotechnol. 148, 23–33. doi: 10.1007/s12010-008-8134-2
Tímár-Balázsy, Á., and Eastop, D. (1998). Chemical Principles of Textile Conservation. Butterworth-Heinemann Series in Conservation and Museology. Wosbon, MA: Elsevier Science Ltd.
Wyman, C. (1999). Biomass ethanol: technical progress, opportunities, and commercial challenges. Annu. Rev. Energy Environ. 24, 189–226. doi: 10.1146/annurev.energy.24.1.189
Zheng, Y., Pan, Z., and Zhang, R. (2009). Overview of biomass pretreatment for cellulosic ethanol production. Int. J. Agric. Biol Eng. 2, 51–68. doi: 10.3965/j.issn.1934-6344.2009.03.051-068
Keywords: corn stover, ensilage, wet storage, pretreatment, organic acids, hydrolysis, lactic acid, lignocellulose
Citation: Essien D, Marshall MN, Richard TL and Ray A (2018) Wet Corn Stover Storage: Correlating Fiber Reactivity With Storage Acids Over a Wide Moisture Range. Front. Energy Res. 6:108. doi: 10.3389/fenrg.2018.00108
Received: 04 May 2018; Accepted: 25 September 2018;
Published: 02 November 2018.
Edited by:
Abdul-Sattar Nizami, King Abdulaziz University, Saudi ArabiaReviewed by:
Ao Xia, Chongqing University, ChinaYu-Shen Cheng, National Yunlin University of Science and Technology, Taiwan
Copyright © 2018 Essien, Marshall, Richard and Ray. This is an open-access article distributed under the terms of the Creative Commons Attribution License (CC BY). The use, distribution or reproduction in other forums is permitted, provided the original author(s) and the copyright owner(s) are credited and that the original publication in this journal is cited, in accordance with accepted academic practice. No use, distribution or reproduction is permitted which does not comply with these terms.
*Correspondence: Dzidzor Essien, aWRkMTAzQHBzdS5lZHU=
 Dzidzor Essien
 Megan N. Marshall
 Tom L. Richard
 Allison Ray