- 1Environmental Sciences Division, Oak Ridge National Laboratory, Oak Ridge, TN, United States
- 2QMT Group, Knoxville, TN, United States
- 3Energy & Transportation Science Division, Oak Ridge National Laboratory, Oak Ridge, TN, United States
- 4Environmental Sciences Division, Oak Ridge National Laboratory, Oak Ridge, TN, United States
Lignocellulosic biomass derived fuels and chemicals are a promising and sustainable supplement for petroleum-based products. Currently, the lignocellulosic biofuel industry relies on a conventional system where feedstock is harvested, baled, stored locally, and then delivered in a low-density format to the biorefinery. However, the conventional supply chain system causes operational disruptions at the biorefinery mainly due to seasonal availability, handling problems, and quality variability in biomass feedstock. Operational disruptions decrease facility uptime, production efficiencies, and increase maintenance costs. For a low-value high-volume product where margins are very tight, system disruptions are especially problematic. In this work we evaluate an advanced system strategy in which a network of biomass processing centers (depots) are utilized for storing and preprocessing biomass into stable, dense, and uniform material to reduce feedstock supply disruptions, and facility downtime in order to boost economic returns to the bioenergy industry. A database centric discrete event supply chain simulation model was developed, and the impact of operational disruptions on supply chain cost, inventory and production levels, farm metrics and facility metrics were evaluated. Three scenarios were evaluated for a 7-year time-period: (1) bale-delivery scenario with biorefinery uptime varying from 20 to 85%; (2) pellet-delivery scenario with depot uptime varying from 20 to 85% and biorefinery uptime at 85%; and (3) pellet-delivery scenario with depot and biorefinery uptime at 85%. In scenarios 1 and 2, tonnage discarded at the field edge could be reduced by increasing uptime at facility, contracting fewer farms at the beginning and subsequently increasing contracts as facility uptime increases, or determining alternative corn stover markets. Harvest cost was the biggest contributor to the average delivered costs and inventory levels were dependent on facility uptimes. We found a cascading effect of failure propagating through the system from depot to biorefinery. Therefore, mitigating risk at a facility level is not enough and conducting a system-level reliability simulation incorporating failure dependencies among subsystems is critical.
Introduction
Lignocellulosic biomass (wood, grasses, or non-edible parts of plants) has been considered as a promising feedstock for production of biofuels. The main driving force behind push toward using lignocellulosic biofuels are (1) energy security by reducing dependence on foreign oil, (2) boost rural and national economy through technology deployment and generating employment opportunities, (3) protecting environment by reducing greenhouse gas emissions (Valdivia et al., 2016; Satlewal et al., 2018). While currently the lignocellulosic biofuel industry relies on a conventional bale-delivery system (Figure 1A) in which feedstock is harvested, baled, stored locally, and then delivered in a low-density format to the biorefinery (Lamers et al., 2015b), the conventional bale-delivery supply system is accompanied by operational disruptions at the biorefinery. The disruptions are mainly due to difficulties encountered with the handling of bales and quality variability (ash, composition, and moisture) in the biomass feedstock (U.S. Department of Energy, 2016). Operational disruptions include decreased facility uptime, production efficiencies, and increased maintenance costs. System disruptions are especially problematic in a bioenergy industry based on a low-value, high-volume product where margins are very tight. In addition, biomass supply uncertainty in the conventional bale-delivery system limits large-scale implementation of biorefinery facilities.
An advanced pellet-delivery system (Figure 1B) is one alternative strategy proposed for dealing with decreasing feedstock quantity and quality uncertainty. The advanced pellet-delivery system consists of a network of distributed biomass processing centers called depots. In these depots, biomass is densified from large bales into stable, dense, and uniform material. The depot creates consistent physical and chemical characteristics commodities that meet biorefinery conversion specifications and improve the handling, transport, and storage of biomass material (Hess et al., 2009; Lamers et al., 2015b). This system offers advantages by addressing biorefinery operational and supply risks and providing a reliable biomass supply chain design. While the pre-processing depots are costly, their benefits have been found to outweigh costs (Jacobson et al., 2014). Existing studies, however, have not considered the impact of adding a depot on the entire biomass supply system. In a way, the operational disruptions caused by inconsistent biomass supply and quality at the biorefinery have now moved to the depot. It is not necessarily true that achieving reliability by assuming that failures are independent of the entire system can be accomplished by providing a uniform format product to the biorefinery from the depot. Our hypotheses for this study is that decoupling processing of hard-to-handle bales from the biorefinery to the depot reduces costs and improves performance by minimizing operational disruptions at the biorefinery.
There have been several studies on modeling Biomass Supply Chain (BSC) compiled in review papers (Sharma et al., 2013; Zandi Atashbar et al., 2017). Initially, BSC models were designed under deterministic settings, but when the dynamic nature of BSC along with its complexity and uncertainty was recognized, researchers incorporated risks in models to improve system resilience and reliability (Bai et al., 2015; Liu et al., 2017). The majority of studies have been based on mathematical programming and heuristics (Atashbar et al., 2016) and some studies involved simulation (Hansen et al., 2015; Wang et al., 2018) modeling. Compared to analytical modeling, simulation is a powerful approach to studying complex and dynamic systems and holds great potential for modeling dynamic BSC with parametric, internal, and external uncertainties. A simulation model can also capture temporal variations in failure or repair rates relatively easily (Wan et al., 2014). In this study we developed a revised version of Integrated Biomass Supply Analysis and Logistics (IBSAL) simulation model (Sokhansanj et al., 2006). The current version (IBSAL02.0) is database-centric with additional capabilities to simulate multi-biomass, -form, -product, -facility, and -year biomass supply chain.
A few studies have evaluated the impact of storage (Liu et al., 2017), biorefinery characteristics (Bai et al., 2015), and intermodal facilities disruptions (Marufuzzaman et al., 2014) due to flooding, hurricane, and drought, on costs and BSC network design. In the majority of static planning models, the failure probabilities were considered unchanged over time (Liu et al., 2017). To the best of our knowledge, existing approaches focus only on failures at a facility, however, impact of failure at a facility on all the entities in the supply chain is not evaluated and could significantly impact overall reliability of a system. Hansen et al. (2015) quantified feedstock supply risk by considering uncertainty in yield, dry matter loss, and ash for conventional bale-delivery and advanced pellet-delivery systems. An advanced pellet-delivery system was found to significantly reduce biomass supply risk by diversifying the supply portfolio and protecting the system against catastrophic supply disruptions, such as drought, flood, and pests. However, this study did not evaluate impact on costs and system performance due to facility disruptions in conventional bale and advanced pellet-delivery systems. Therefore, our research question is to determine how costs and operational management decisions for an advanced pellet-delivery system compare with those of a conventional bale-delivery system under facility disruptions. Unlike the descriptions in the above-mentioned articles, we developed a multi-form (bale, pellets) and multi-year database centric simulation model to evaluate the impact of operational disruptions on costs, inventory and production levels, and facility metrics while failure probability at facilities varies across a span of years.
Methodology
Figure 2 shows the methodology used in this study to quantify the impact of operational disruptions at facilities for conventional bale and advanced pellet-delivery systems. Since agricultural residues, particularly corn stover, is the feedstock of choice for near-term ethanol production (Jessen, 2015), a case study for an Iowa biorefinery using corn stover as feedstock is developed. The following three sub-sections: Inputs, Simulation Model-IBSAL 2.0, and Scenarios, along with a case study, describe the methodology used to investigate the impact of operational disruptions.
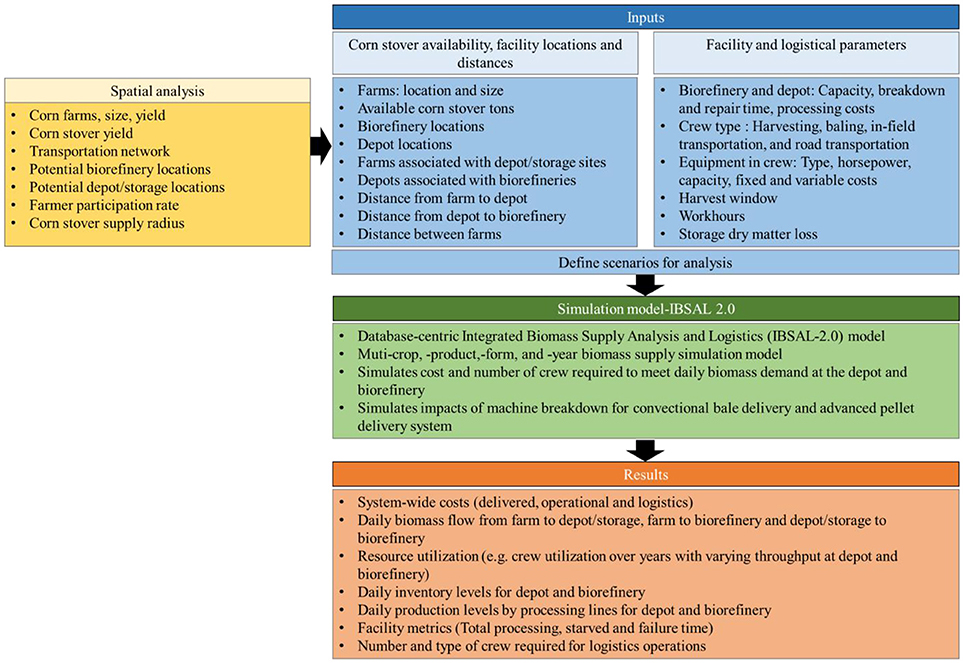
Figure 2. Schematic of the methodology used to quantify the impact of operational disruptions on costs, biomass flow, resource utilization, inventory and facility metrics for the conventional bale-delivery and advanced pellet-delivery system scenarios.
Inputs
Spatial Analysis
To incorporate the impact of spatial variation on biomass supply system management decision-making, spatial analysis was conducted using Python and Esri, ArcMap 10.3 (Esri, 2017) software to gather information on farm and facility locations, available corn-stover tonnage, biomass allocation, and distances between sites. Corn-specific land cover and corn yields were determined using the Cropland Data Layer (CDL) (USDA National Agricultural Statistics Service, 2016) and Iowa Soil Properties and Interpretations Database (ISPAID) (Miller et al., 2010) as described by (Brandes et al., 2016). The harvest index (pounds of corn grain divided by total pounds of above-ground biomass, such as corn stover plus grain Pennington, 2013) was assumed to be 0.5, reflecting a corn-stover yield equal to corn grain yield in tons per acre (Lorenz et al., 2010). Multi-criteria suitability analysis was conducted to determine suitable biorefinery sites (Sharma et al., 2017). Potential depot/storage locations were restricted to points on a 5-mile grid to provide enough options for optimal depot location estimation for this analysis. Suitability analysis could be conducted to determine ideal depots sites. The ArcGIS location-allocation maximized capacitated coverage problem type was formulated using a US census road network (United States Census Bureau, 2016) dataset and facility locations to determine site facilities and allocate corn stover supply to the facilities in the most efficient manner. Location-allocation is a two-fold problem that simultaneously locates facilities and allocates farms to them. The maximize capacitated coverage problem type (Esri, 2016) chooses biorefinery, depot, and storage sites, such that all, or the greatest amount of corn stover supply, is utilized without exceeding the capacity of any facility. The outputs of spatial analysis were farm, biorefinery, depot, and storage locations, available corn stover tons, allocations of corn stover supply to facilities, and distances between facilities and farms.
Facility and Logistical Parameters
As described in Figure 2, facility and logistical parameters include facility capacity, breakdown/repair times, processing costs, crew composition, size, harvest/transport costs, storage dry-matter loss, work hours, and harvest window. These input parameters are specific to the case study under consideration and are described in detail in section Scenarios.
Simulation Model-IBSAL 2.0
The Integrated Biomass Supply Analysis and Logistics (IBSAL) Model-2.0 is an updated version of the IBSAL simulation model (Sokhansanj et al., 2006; Ebadian et al., 2011) (Figure 3). This version of model is built around the ExtendSim database. The ExtendSim's integrated model database tends to promote better model design, increase model organization, and streamline modeling processes. In addition, database-centric simulation models require less time to build, modify, maintain, validate and verify and are more reliable, scalable, and flexible (Diamond et al., 2010).
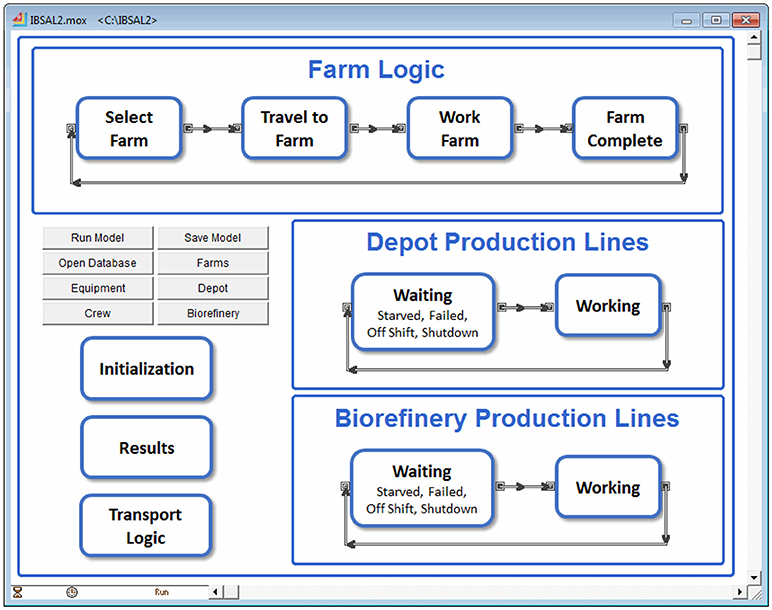
Figure 3. Schematic of IBSAL 2.0 model logic and front-end interface developed using ExtendSim software.
IBSAL 2.0 is a dynamic discrete event simulation model capable of making operational decisions for both the conventional bale-delivery and the advanced pellet-delivery biomass supply chain configurations. The model is multi-biomass, multi-product, multi-form, multi-facility, and multi-year supply chain simulation model (Figure 3). The model manages the biomass system from harvesting all the way through supply to the biorefinery reactor throat. In addition to biomass harvesting, handling, inventory, and fleet management, the model can test the reliability of the system by considering biomass quality (moisture and ash), biomass degradation (dry matter loss and discarded/expired biomass), and facility failures across a multi-year system.
Biomass loss in the model is done thorough both dry matter loss and discarded biomass. Biomass must be harvested and transported to the field side within a pre-defined harvest window. The biomass not harvested and transported to the field side within this window will be discarded or used for alternative markets. Biomass must also be transported from the field side to the intermediate storage depot within a second pre-defined window while the biomass not transported within this window will be discarded. While in the field, at the field side, or in storage, dry matter loss occurs periodically based on the dry matter loss schedule defined in the model database.
Four primary tasks are defined in the model. The four tasks include: harvesting the biomass, transporting the biomass to the field side, transporting from the field side to the depot, and transporting from the depot to the refinery. Each task is completed by a specific crew type. Each crew type has a unique capacity, performance, and cost parameters depending on the equipment they are assigned. There are multiple crews of each crew type. Each crew has been assigned to a specific depot (harvesting, in-field transportation, and transportation to depot) or biorefinery (transportation to refinery) to minimize traveling between tasks. For example, we would not want a crew who has just finished a farm for depot 1 to travel across the system basically long distance to work on a farm for depot 2.
The modeling style used for IBSAL 2.0 is flipped from a traditional modeling style. The entities moving through the model are resources, not products as in a traditional model. Product characteristics and variations throughout supply chain are tracked in the log table. This flipped modeling approach uses database transactions to manage inventory throughout the system. The model database in this environment is more than simply a container for input and output data. The model database is truly integrated with the model. This modeling style tends to be faster and provides more control when dealing with large amount of product being processed by specialized resources. The entities in this model include crews, depot processing lines, and the biorefinery processing lines. These entities flow through 4 primary constructs in the model. The crew entities flow through the farm construct and the transport construct, depending on the type of crew. The depot processing lines flow through the depot construct. The biorefinery processing lines flow through the biorefinery construct. This focus on populations of entities each transitioning between states to accomplish tasks essentially implements an agent-based approach within a traditional discrete-event modeling tool and has many of the properties of an agent-based model. For instance, after a crew finishes a task, the crew must decide on their next task based on the status of the world. The results emerge from these multiple loosely linked decisions.
Scenarios
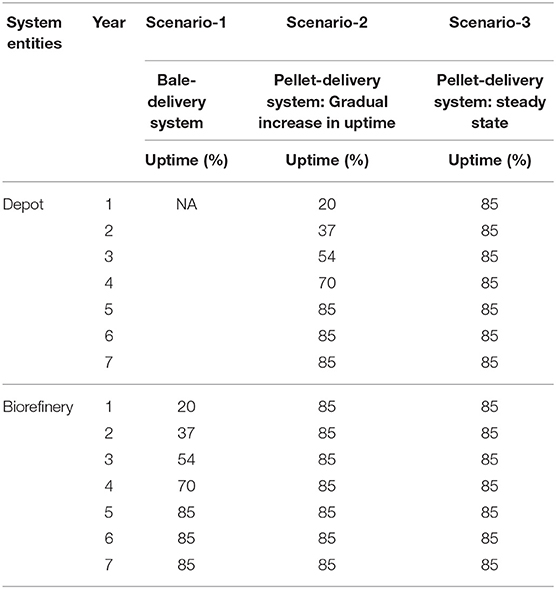
Table 1 presents the three scenarios analyzed in this study. These scenarios were developed to illustrate effects of operational disruptions (i.e., equipment failures) at the depot and biorefinery on the performance and behavior of the biomass supply chain system. The current state of the US biofuel industry located in highly productive Midwest corn regions relies on a conventional bale-delivery represented by scenario-1 (Cafferty et al., 2014; Lamers et al., 2015a,b) (Table 1). The second and third scenarios represent use of advanced pellet-delivery systems, with scenario 3 representing mature and resilient lignocellulosic biofuel production system that operates in steady state (Table 1). The uptime/throughput at the facility was assumed to increase from 20 to 85% (Foody, 2014). Due to feedstock flowability and variability challenges the uptime at biorefinery has been low (U.S. Department of Energy, 2016). These challenges need to be addressed to achieve an overall equipment effectiveness score of 85%, considered as world class for manufacturing industries (Muchiri and Pintelon, 2008). The system was evaluated over 7 years, including 5 years to reach 85% uptime at the facility (Foody, 2014) and 2 years at steady-state.
Case Study
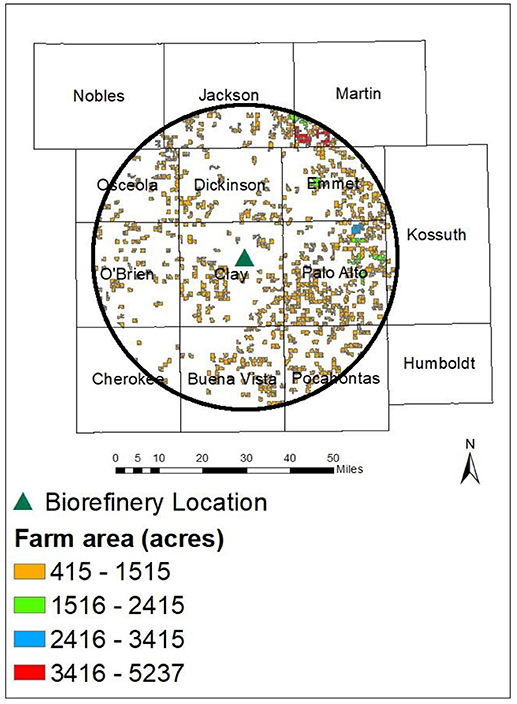
To test the model, a case study was developed for a biorefinery in Iowa (Figure 4), the leading producer of corn stover in the US. The biorefinery site was selected by conducting a multi-criteria suitability analysis (Sharma et al., 2017). For commercial scale biorefineries of size 20–30 million gallons per year, the biomass demand is reported between 285,000 and 375,000 bone-dry tons per year (Berven, 2009; Rosen, 2012). Therefore, the biorefinery yearly corn stover demand was assumed to be 335,000 bone-dry tons with a collection radius of 35 miles (Ward, 2015). The stover yield was estimated using the methodology described in section Spatial Analysis. The moisture content in stover and stover losses throughout the system were assumed to be 20% (Darr and Shah, 2012) and 10% (Shah and Darr, 2016), respectively. Farms with a harvestable yield greater than 1.2 tons/acre were selected for analysis (Wirt) (Figure 4 and Table 2). The harvest window and work hours at the farms were assumed to be 32 days per year and 9 h per day, respectively (Lorenz et al., 2010; Darr and Webster, 2014; Shah and Darr, 2016).
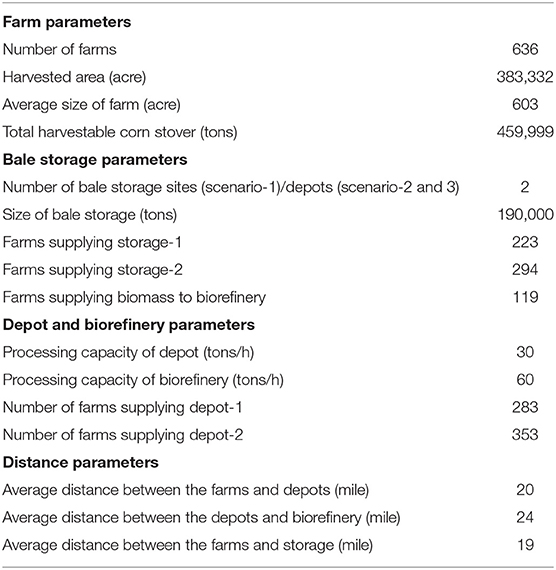
Table 2. Summary of parameters for farms, storage, depot and biorefinery used as input for the simulations model.
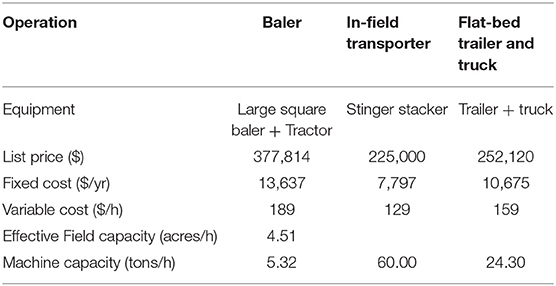
To achieve consistency for comparison among scenarios (section Scenarios), the bale storage site and depot site locations were assumed in this analysis to be same. The location-allocation model was used to determine two optimal storage/depot sites and farms allocated to these sites (Figures 5A,B and Table 2). Distances from each farm to the depot, farm to the biorefinery, farm to storage, and between farms were also estimated and used as input to the model. All costs (Table 3) were estimated using the methodology described by Turhollow et al. (2009). Additionally, personal communication with A. Khanchi (personal communication, 2018) was used to estimate costs of processing and storage of pellets. The depot processing capacity was assumed to be 30 tons/h and the processing cost was estimated as $21.42/ton. The biorefinery processing capacity was assumed to be 60 tons/h and the cost of drying and grinding biomass at a biorefinery was estimated as $6.24/ton. Operating days per year and work hours per year at depot and biorefinery were assumed to be 351 days per year and 24 h per day, respectively. Storage costs for bale storage and pellet storage were estimated as $7.36 and $9.22/ton, respectively.
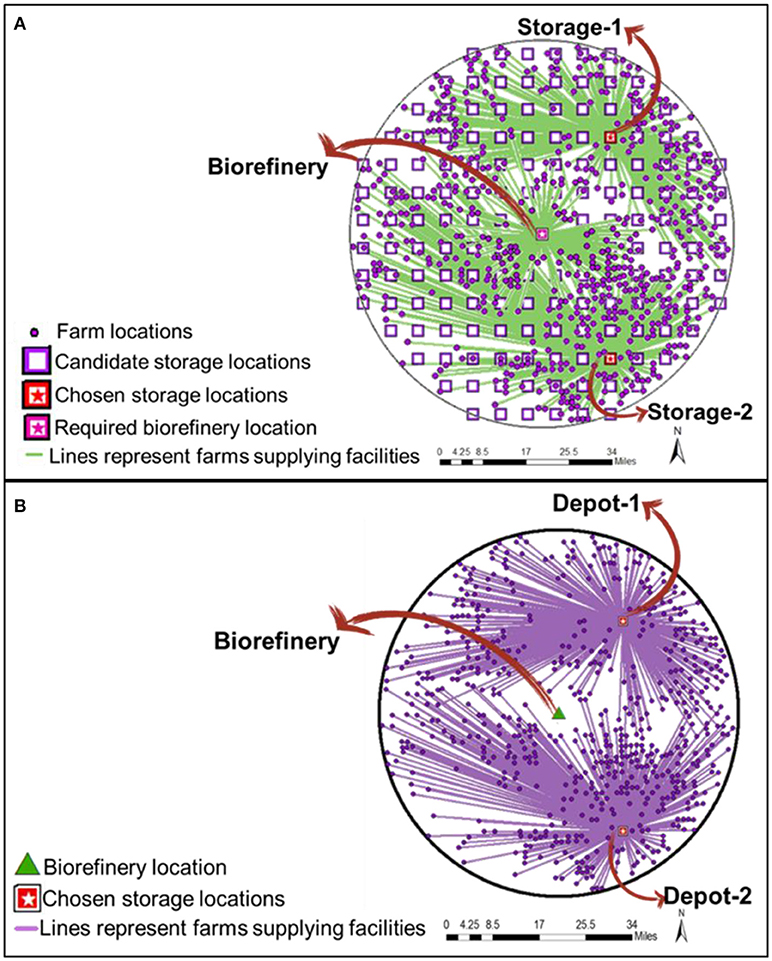
Figure 5. Location-allocation model (A) Farms associated with supplying corn stover to storage sites and biorefinery; (B) Farms associated with supplying corn stover to depots.
Four types of crews were considered in the model: (a) baling, (b) in-field transportation, (c) road transportation to the depot, and (d) road transportation to the biorefinery. Equipment considered included a large rectangular baler (3 × 4 × 8 feet), an in-field transporter (12 bales per load) (Stinger Inc., 2018), and a flat-bed trailer (36 bales per load) (McGill and Darr, 2014). Fixed and variable costs and effective field capacity and machine capacity were estimated using the methodology described by (Turhollow et al., 2009). Large square baler field speed, and efficiency were assumed to be 80% and 5 miles per hour, respectively (ASAE, 2003). The inflation-adjusted list prices for large square baler, stinger stacker, and flat-bed trailer-truck was 377,814, 225,000, and 252,120$, respectively (Edwards, 2014; Stinger Inc., 2018). The crew composition (number of equipment) for this analysis was 10, 1, and 6 for baling, in-field transportation and road transportation, respectively. The crew composition (number of equipment) was determined using trial and error to ensure that all farms were harvested within the harvest window.
Results
Farm Tons Harvested, Discarded, and Transported
Figure 6 shows farm metrics for total corn stover tonnage harvested, transported, discarded, and lost as dry matter. The model was set up to reflect all the contracted farms (40% within a 35-mile buffer radius, Berven, 2009) were harvested each year (460,000 tons). In year one of the bale-delivery (biorefinery uptime: 20–85%) scenario, all harvested tonnage was transported because there was no storage at the beginning of the simulation run. In the second year, since storage tonnage was at its maximum capacity and uptime at the biorefinery was low (37%), only 50% of the harvested tonnage was transported (Figure 6). The tonnage transported from the farms increased as production at the biorefinery increased. The number of tons discarded at the field edge was high (50%) in the second year because of low throughput at the biorefinery and a short storage window (3 months) at the field edge. The model does not account for cost of discarding corn stover at the field edge before the beginning of next corn planting season. In this analysis we assume that corn stover is discarded however in reality it could be available for alternative markets such as animal feeding and bedding. This tonnage discarded at the field edge decreased as biorefinery uptime increased and storage space became available. A similar trend was observed in the pellet-delivery scenario-2 (depot uptime: 20–85%, biorefinery uptime: 85%). Dry matter loss was low because corn stover was stored at the field edge for a maximum of 3 months (Figure 6). For scenario-3 (pellet-delivery (depot uptime: 85%, biorefinery uptime: 85%), an average of 6,479 tons of stover discarded (Figure 6) could be attributed to less available bale storage area at the depot, resulting in more bales stored at the field edge and not transported to the depot before the start of the next corn planting season. Three ways to reduce tonnage discarded at the field edge are the following: (A) the processing facility should have higher uptime; (B) fewer farms should be contracted at the beginning, and the number subsequently increased as uptime increases; (C) determining alternative corn stover market.
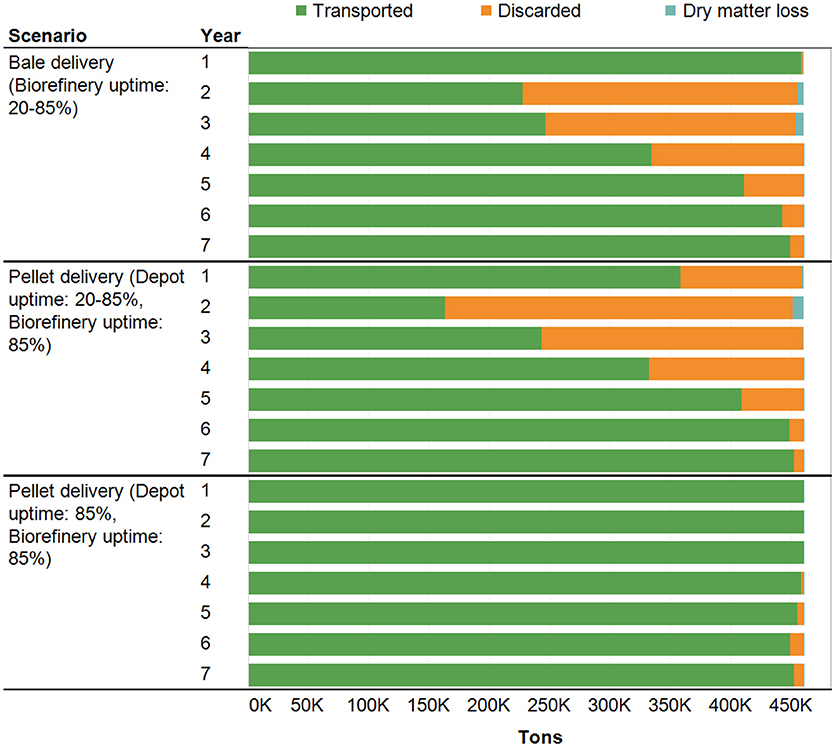
Figure 6. Farm metrics for the bale-delivery (Biorefinery uptime: 20–85%), pellet-delivery (Depot uptime: 20–85%, Biorefinery uptime: 85%) and pellet-delivery (Depot uptime: 85%, Biorefinery uptime: 85%) scenarios.
Inventory
Inventory management is crucial to provide a buffer against biomass supply fluctuations, but it also adds infrastructure and maintenance costs. Since inventory is a biorefinery's largest asset to protect against supply fluctuations, a key decision for a biorefinery is how much inventory to keep on hand. It is recommended that biomass supply inventories should be at 110–130% of the biorefinery nameplate capacity to ensure a year-round feedstock supply and to buffer against biomass supply risks (Darr and Shah, 2012; Darr et al., 2014). For bale-delivery (biorefinery uptime: 20–85%) scenario-1, the storage site capacity was 115% of biorefinery demand, which takes into account dry matter losses in the system. The bale inventories at the storage sites and the biorefinery on-site storage site were 435,000 and 25,000 tons, respectively. At the biorefinery maximum 2 weeks of corn stover storage was considered in the model (Wirt). No yield variation over the years was assumed in the model hence additional biomass storage to buffer against supply uncertainties was not required. In pellet-delivery scenario-2 (depot uptime: 20–85%, biorefinery uptime: 85%) and pellet-delivery scenario-3 (depot uptime: 85%, biorefinery uptime: 85%), the bale storage site capacity was 67% of the biorefinery demand, determined by running simulations to ensure that the biorefinery would not be starved in scenario-3. This is in agreement with the finding that establishment of a pellet-delivery system reduces storage cost and storage size (Lamers et al., 2015b).
The storage sites were empty at the beginning of the first year in each scenario run, and corn stover inventory built up during the 32-day harvest window, then decreased depending on facility uptime (depot and biorefinery) (Figure 7). In the first year of bale-delivery (biorefinery uptime: 20–85%) scenario-1, the maximum bale (tonnage) inventory grew to about 85% of the biorefinery demand, while during the non-harvest time-period, the biorefinery removed corn stover from the inventory, reducing storage tonnage to 64% of biorefinery demand. In the second year of harvest, the inventory began building up during the harvest season and reached its maximum capacity of 435,000 tons. It then stays at that level for about 90 days due to low uptime at the biorefinery which utilizes 25,000 tons of corn stover from onsite storage. As biorefinery uptime increases, the minimum inventory level decreases and the inventory remains at the maximum level for a shorter period (Figure 7). A similar inventory trend was observed for pellet-delivery (depot uptime: 20–85%, biorefinery uptime: 85%) scenario-2 and pellet-delivery (depot uptime: 85%, biorefinery uptime: 85%) scenario-3 (Figure 7). In the pellet-delivery scenario, as the system stabilizes (85% uptime at the depot and biorefinery) a safety stock of 50,000 tons (~1-month biorefinery demand) was maintained to mitigate risk of depot supply disruptions. The maximum tonnages of pellets stored in pellet-delivery scenario-2 and pellet-delivery scenario-3 were 2,304 and 2,382 tons, respectively. These values were low because the consumption rate at the biorefinery matched the rate of production at the depot. We demonstrated storage behavior across multiple years with varying uptime at the biorefinery, and in the future we will investigate the role of storage in mitigating supply under risk related to feedstock supply uncertainty.
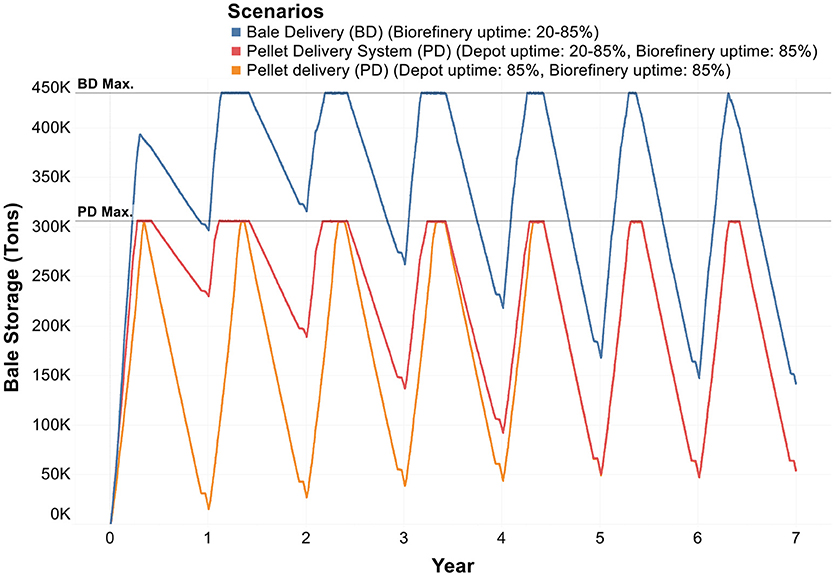
Figure 7. Corn stover bale storage (tonnage) for the bale-delivery (Biorefinery uptime: 20–85%), pellet-delivery (Depot uptime: 20–85%, Biorefinery uptime: 85%) and pellet-delivery (Depot uptime: 85%, Biorefinery uptime: 85%) scenarios.
Figure 8 shows the total number of truckloads delivered both to the biorefinery and to intermediate storage or depot sites. Each truckload can transport 21 or 44 tons, respectively, of bales or pellets, and a significant transportation effort is required to move the large square bales from the farm boundaries to the intermediate storage/depot locations and then move bales/pellets from the intermediate (storage/depot sites) to the biorefinery. The average maximum number of semi-loads of baled corn stover transported from the farms to the intermediate sites (storage/depot sites) was 20,000. A similar estimate was reported by McGill and Darr (2014) for a biorefinery with a biomass demand of 400,000 dry tons. The average maximum number of semi-loads of bales and pellets transported from bale storage to biorefinery, and from depot to biorefinery, were 17,673 and 9,596, respectively. The relative intensity of truck traffic decreases in the pellet-delivery scenarios because of more efficient transport of high-density pellets. As biorefinery uptime increases, the number of semi-loads transported from intermediate sites (storage/depot) to the biorefinery also increases (Figure 8).
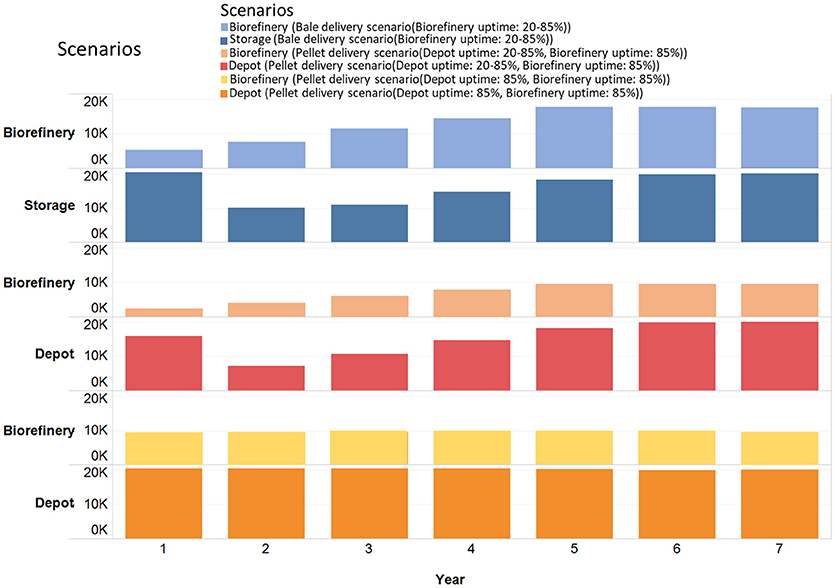
Figure 8. Total corn stover trucks delivered to intermediate sites (storage/depot) and biorefinery for the bale-delivery (Biorefinery uptime: 20–85%), pellet-delivery (Depot uptime: 20–85%, Biorefinery uptime: 85%) and pellet-delivery (Depot uptime: 85%, Biorefinery uptime: 85%) scenarios.
In this study, we assumed two storage sites in the bale-delivery scenario and these same storage sites were taken as depot sites in the pellet-delivery scenario to enable direct comparison between the scenarios and determination of the impact of operational disruptions. This assumption resulted in large bale storage sites being included in the model, although storage of large volume biomass increases fire risk, infrastructural requirements, and seasonal road traffic (Sahoo and Mani, 2017). In the future, we will examine the impact in meeting biorefinery cost, quantity, and quality specifications of the number of storage sites, their location, size, layout, and safety stock. We will also consider local fire code and safety regulations.
Number and Type of Crew Required
The number of crew required in each scenario is based on corn stover demand at the biorefinery, capacity of crew type, length of harvest season, length of time bales stored at field edge, daily working hours, distance between farms, and time required to move crews between the farms (Ebadian et al., 2017; Wang et al., 2017). It was assumed that bales could be stored at field edge for about 3 months until the beginning of preparation for the next corn planting season.
The number of baling, in-field transportation, and road transportation crews required for the bale-delivery (biorefinery uptime: 20–85%) scenario as estimated by the model were 430, 34, and 32, respectively. Similarly, baling, in-field transportation, and road transportation crews for pellet-delivery (depot uptime: 20–85%, biorefinery uptime: 85%) scenario-2 and pellet-delivery (depot uptime: 85%, biorefinery uptime: 85%) scenario-3 were 440, 30, and 24, respectively. In Iowa, the harvest window is very short, varying between 27 and 32 days (Darr and Webster, 2014; Shah and Darr, 2016), impacting the fleet size and associated costs. The crew compositions were determined using a trial-and-error approach to ensure that all contracted farms would be harvested within the harvest window. The fleet sizes varied among the scenarios according to their designs (storage sites vs. depots). It was assumed that the biorefinery owns the equipment fleet, but existing equipment owned by farmers or custom harvest groups could also be used for fleet operations. The large number of baling crews (430–440) was mainly attributed to low baler productivity and the narrow harvest window (32 days).
In bale-delivery (biorefinery uptime: 20–85%) scenario-1, 460,000 tons of corn stover harvested in the first year were transported to the bale storage sites by the bale road transportation crew (Figure 9). Since the simulation began with an empty system, in the first year all harvested corn stover was transported to storage, while in the second year, all contracted acres were harvested, but biorefinery uptime was low, resulting in underutilization of the road transportation crew. The crew utilization did increase as biorefinery uptime increased. In pellet-delivery (depot uptime: 20–85%, biorefinery uptime: 85%) scenario-2, 286,977, and 156,433 tons, respectively, of corn stover were transported in the first and second years. The relatively low transportation tonnage was due to smaller bale storage size in the pellet-delivery scenario. As biorefinery uptime increases, road transportation crew utilization increases. In bale-delivery scenario-1, comparing the available 3,285 h per year (365 days per year, 9 days per hour) with actual task hours, the harvest and in-field transportation crew utilization levels were only 7.6 and 6.9%. Similarly, farm-to-storage and storage-to-biorefinery average crew utilization levels were 14.9 and 43.3%, respectively. Since we assumed that the biorefinery owns the equipment, low equipment utilization would represent an economic burden on the biorefinery and increase the per-unit biofuel cost. Achieving an optimal combination of custom harvest groups, farmer-owned equipment, and biorefinery-owned equipment could serve as a cost-cutting strategy for the biorefinery.
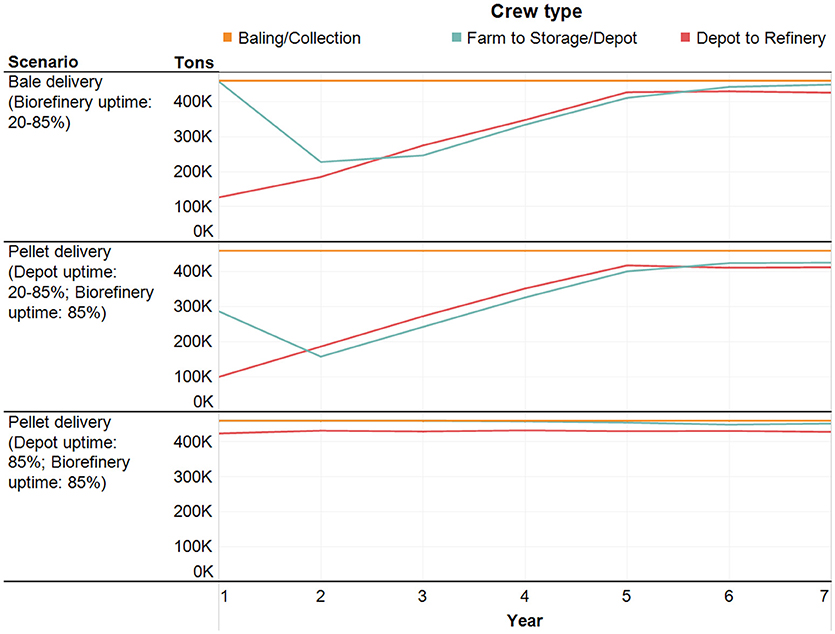
Figure 9. Corn stover tonnage handled by crew type for the bale-delivery (Biorefinery uptime: 20–85%), pellet-delivery (Depot uptime: 20–85%, Biorefinery uptime: 85%) and pellet-delivery (Depot uptime: 85%, Biorefinery uptime: 85%).
Facility Metrics
To understand the impact of operational disruptions on the biomass supply system, we present facility metrics (processed, starved, failed, warm-up and scheduled downtime) at the depot and biorefinery for three scenarios in Figure 10. In year one of the bale-delivery (biorefinery uptime: 20–85%) scenario-1, the uptime at biorefinery was only 20%; therefore, downtime was high and the amount processed at the biorefinery was low. The biorefinery failures were assumed to decrease over time. As the biofuel industry matures, improved equipment for feedstock handling and consistent quality attributes could resolve the failure issues. As uptime at biorefinery increased, the failed time decreased, thus tonnage processed at the biorefinery increased (Figure 10). There was no starved time at the biorefinery as adequate corn stover was available for processing. Biomass supply uncertainty due to extreme weather events, yield and quality variability, and supplier reliability were not considered in this analysis.
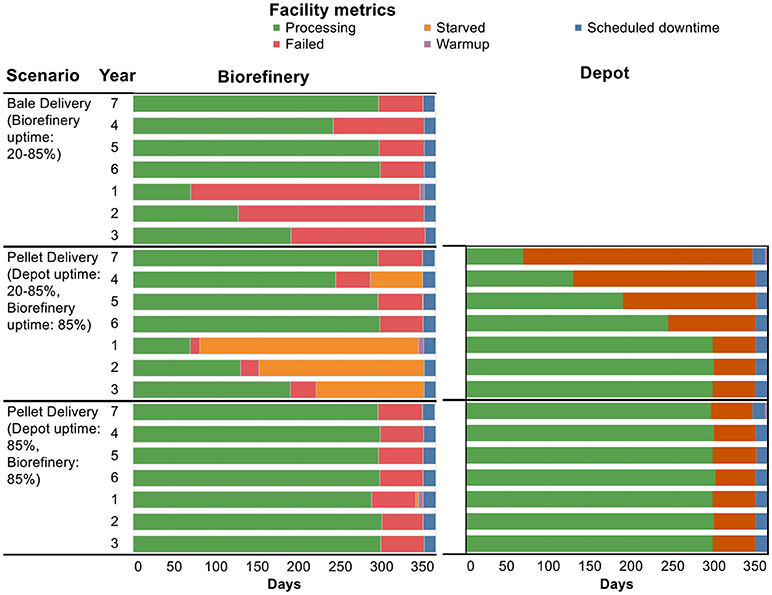
Figure 10. Facility metrics for the bale-delivery (Biorefinery uptime: 20–85%), pellet-delivery (Depot uptime: 20–85%, Biorefinery uptime: 85%) and pellet-delivery (Depot uptime: 85%, Biorefinery uptime: 85%).
Downtime at facility not only causes loss of production, it also impacts product quality, loss of customers, and increased costs. Downtime at a biorefinery is mainly due to biomass handling problems (flowability) and inconsistent biomass quality attributes (ash, moisture). Preprocessing of biomass at depots to produce uniform format feedstock “commodities” is strategy proposed to improve uptime at the biorefinery (Lamers et al., 2015b). Dedicated pre-processing depots do not eliminate the problem but add an entity (depots) in the supply chain to resolve the issue. In pellet-delivery scenarios, intermediate pre-processing depots were added to the supply chain. Reducing downtime and increasing uptime improved the efficiency of system (Figure 10). In pellet-delivery (depot uptime: 20–85%, biorefinery uptime: 85%) scenario-2, we observed a cascading effect of failures across facilities (depot to biorefinery). Even though the biorefinery uptime was 85% with depots in the system to address handling and quality issues, depots started with higher failure rates, thus starving the biorefinery. This indicates that having a depot is only justified if they consistently have higher uptimes and the cost of having a depot outweighs overall supply benefits. Resolving biomass handling and quality challenges could eliminate the need of having depots. In pellet-delivery scenario-3 (depot uptime: 85%, biorefinery uptime: 85%), the uptime at the depot and biorefinery were same, thus we observed stable system and consistency among processed tonnage at both facilities.
We recommend performing a system-level reliability analysis incorporating failure dependencies among subsystems. Biomass quality and handling are key issues for operational disruptions at biorefinery. Quality issues could be addressed at farm level. For example, farmers adapt harvesting processes that minimize ash and moisture levels in corn stover. In addition, farmers should be fully aware and educated about quality metrics, including ash and moisture, required by the biorefinery. They should realize if quality metrics are not met there could be price penalties or rejected loads. Feedstock handling is other major issue limiting processing capacity at the biorefinery. A comprehensive understanding and quantification of biomass physical properties to enable design of equipment and handling systems at the biorefinery is a potential solution to feedstock flowability challenges. In addition, detailed cost-benefit analysis for depots should be conducted.
Costs
Figure 11 shows average delivered cost based on tonnage processed at the biorefinery for three scenarios. The delivered cost, for the bale-delivery (biorefinery uptime: 20–85%) scenario, averaged to $380/ton in the first year. As biorefinery tonnage processing increased, the delivered costs decreased. In the years five through seven when biorefinery uptime was assumed to be 85%, the average delivered cost was $99/ton. Harvest cost was the biggest contributor to the average delivered costs. In the model, it was assumed that all the contracted farms are harvested every year and the equipment fleet is owned by the biorefinery. Large number of balers were required to complete the harvesting operation within 32 days due to low machine capacity of balers. This mainly contributed to harvest being the largest cost contributor. In the pellet-delivery (depot uptime: 20-85%, biorefinery uptime: 85%) scenario-2, the delivered cost followed the same trend, decreasing over time with increasing production at the biorefinery. In the years five through seven when uptime at depot and biorefinery was assumed to be 85%, depot cost contributed 26% to the total delivered cost. The storage cost decreased as less tonnage was stored. In the pellet-delivery scenario-3 (depot uptime: 85%, biorefinery uptime: 85%), the average delivered cost was found to be $116/ton. The delivered cost for the pellet-delivery scenario was about $16/ton greater than the bale-delivery scenario with uptime at facilities (biorefinery/depot) being 85%. This analysis considers the production costs and does not account for depot and biorefinery capital costs. Pre-processing depots may be necessary to achieve quality, quantity, and reliability required for the growth of a US bioeconomy. However, detailed analysis should be conducted to evaluate if overall supply benefits of preprocessing depots outweighs costs.
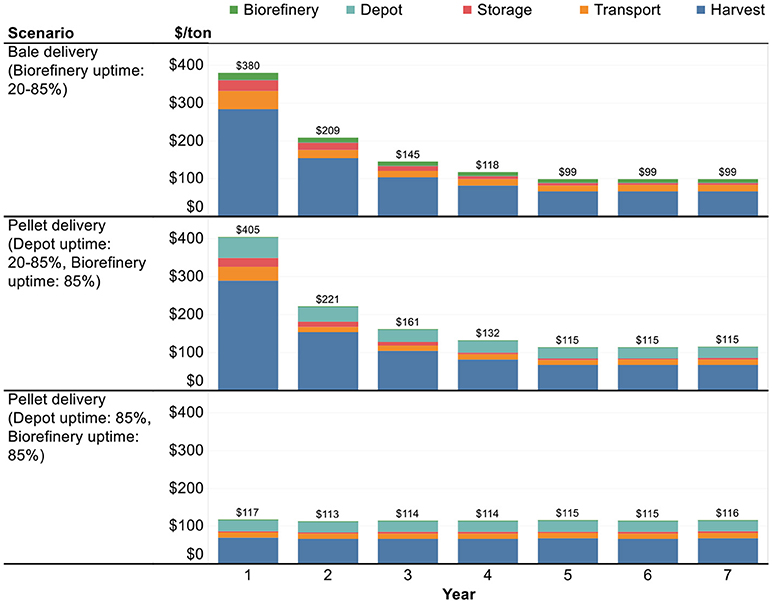
Figure 11. Average delivered cost per ton corn stover processed ($/ton) for the bale-delivery (Biorefinery uptime: 20–85%), pellet-delivery (Depot uptime: 20–85%, Biorefinery uptime: 85%) and pellet-delivery (Depot uptime: 85%, Biorefinery uptime: 85%).
Conclusions and Implications
We have presented a simulation-driven study for analyzing the operational reliability of the biomass-to-biorefinery supply chain. Our approach considers the end-to-end biomass supply chain system as a series of connected components. It estimates independent failure modes for each facility (depot and biorefinery) and tracks how these failures then propagate throughout the entire system. As a case study, we evaluated our simulation framework for a biorefinery with corn stover demand of 335,000 dry tons and facility (depot/biorefinery) failure data varying each year. This allows us to investigate and gain insights on the impact of operational disruptions on costs, facility metrics, and inventory. Our main contribution is the development and implementation of a database centric discrete event model that simulates multi-biomass, multi-form, multi-product, and multi-year biomass supply chains for operational level decision making. We found cascading effects of failures propagating through the system from depot to biorefinery. Operational disruptions caused by biomass quality and handling issues needs to be addressed. If pre-processing depots are required to achieve quality, quantity, and reliability, detailed analysis should be conducted to evaluate how overall supply benefits outweigh costs. Harvest cost was found to be the biggest contributor to the delivered costs. Achieving an optimal combination of custom harvest groups, farmer-owned equipment, and biorefinery-owned equipment could serve as a cost-cutting strategy for the biorefinery.
Notice of Copyright
This manuscript has been authored by UT-Battelle, LLC, under contract DE-AC05-00OR22725 with the US Department of Energy (DOE). The US government retains and the publisher, by accepting the article for publication, acknowledges that the US government retains a nonexclusive, paid-up, irrevocable, worldwide license to publish or reproduce the published form of this manuscript, or allow others to do so, for US government purposes. DOE will provide public access to these results of federally sponsored research in accordance with the DOE Public Access Plan (http://energy.gov/downloads/doe-public-access-plan).
Author Contributions
BS and RC developed the model, designed the scenarios, and performed model runs. BS with help from MH analyzed and interpreted the modeling results. BS prepared the manuscript with input from all authors. EW conceived the study and was in charge of overall direction and planning.
Funding
This material is based upon work supported by the U.S. Department of Energy, Office of Energy Efficiency and Renewable Energy, Bioenergy Technologies Office.
Conflict of Interest Statement
The authors declare that the research was conducted in the absence of any commercial or financial relationships that could be construed as a potential conflict of interest.
Acknowledgments
This project was funded by United States Department of Energy, Bioenergy Technologies Office. We thank Dr. Mahmood Ebadian (Biomass and Bioenergy Supply Chain Specialist), Magen E. Shedden (Post-masters: Biomass logistics), Devita D. Amal (Ph.D. Candidate: Biomass supply risk) in the Environmental Sciences Division, Oak Ridge National Laboratory and Amit Khanchi (Post-doctoral Research Associate: Biomass post-harvest), Iowa State University for their scientific guidance and reviewing the manuscript.
References
ASAE (2003). D497.4 Agricultural Machinery Management Data. ASAE Standards 2003. St. Joseph, MI: ASAE.
Atashbar, N. Z., Labadie, N., and Prins, C. (2016). Modeling and optimization of biomass supply chains: a review and a critical look. IFAC-PapersOnLine 49, 604–615. doi: 10.1016/j.ifacol.2016.07.742
Bai, Y., Li, X., Peng, F., Wang, X., and Ouyang, Y. (2015). Effects of disruption risks on biorefinery location design. Energies 8:1468. doi: 10.3390/en8021468
Berven, D. (2009). The Path to LIBERTY: An Update on POET's Cellulosic Project. Available online at: https://www.ag.ndsu.edu/BioEPIC/documents/2009-ind.-pres/Berven.pdf
Brandes, E., Mcnunn, G. S., Schulte, L. A., Bonner, I. J., Muth, D. J., Babcock, B. A., et al. (2016). Subfield profitability analysis reveals an economic case for cropland diversification. Environ. Res. Lett. 11:014009. doi: 10.1088/1748-9326/11/1/014009
Cafferty, K. G., Jacobson, J. J., Searcy, E., Kenney, K. L., Bonner, I. J., Gresham, G. L., et al. (2014). Feedstock Supply System Design And Economics For Conversion Of Lignocellulosic Biomass To Hydrocarbon Fuels: Conversion Pathway: Fast Pyrolysis And Hydrotreating Bio-Oil Pathway The 2017 Design Case. INL/EXT-14-31211. Idaho Falls, ID: Idaho National Laboratory, Bioenergy Program. Available online at: https://inldigitallibrary.inl.gov/sites/sti/sti/6038147.pdf
Darr, M., Peyton, K., and Webster, K. (2014). Corn Stover Storage Methods. Iowa State University Extension and Outreach. PM 3051D. Available online at: https://store.extension.iastate.edu/product/14077
Darr, M., and Webster, K. (2014). Corn Stover Harvest Window. Iowa state university extension and outreach. PM 3051B. Available online at: https://store.extension.iastate.edu/product/14075
Darr, M. J., and Shah, A. (2012). Biomass storage: an update on industrial solutions for baled biomass feedstocks. Biofuels 3, 321–332. doi: 10.4155/bfs.12.23
Diamond, B., Krahl, D., Nastasi, A., and Tag, P. (2010). “Extendsim advanced techology: integrated simulation database,” in Proceedings of the 2010 Winter Simulation Conference (San Jose, CA: Imagine That, Inc).
Ebadian, M., Sokhansanj, S., and Webb, E. (2017). Estimating the required logistical resources to support the development of a sustainable corn stover bioeconomy in the USA. Biofuels Bioprod. Bioref. 11, 129–149. doi: 10.1002/bbb.1736
Ebadian, M., Sowlati, T., Sokhansanj, S., Stumborg, M., and Townley-Smith, L. (2011). A new simulation model for multi-agricultural biomass logistics system in bioenergy production. Biosyst. Eng. 110, 280–290. doi: 10.1016/j.biosystemseng.2011.08.008
Edwards, W. (2014). Economics of Harvesting And Transporting Corn Stover. Iowa state university extension and outreach. PM 3053B. Available online at: https://store.extension.iastate.edu/product/14060
Esri (2016). Location-Allocation Analysis. Available online at: http://desktop.arcgis.com/en/arcmap/latest/extensions/network-analyst/location-allocation.htm (Accessed September 6, 2017).
Foody, B. (2014). The Strategic View What's Next in Biofules. Advanced Bioeonomy Leadership Conference on Next Genreation Technologies. San Fransisco, CA: Logen Corporation.
Hansen, J. K., Jacobson, J. J., and Roni, M. S. (2015). “Quantifying supply risk at a cellulosic biorefinery,” in 33rd International Conference of the System Dynamics Society (Cambridge, MA).
Hess, J. R., Kenney, K. L., Ovard, L. P., Searcy, E. M., and Wright, C. T. (2009). Commodity-Scale Production Of An Infrastructure-Compatible Bulk Solid From Herbaceous Lignocellulosic Biomass: Uniform-Format Bioenergy Feedstock Supply System Design Report Series. INL/EXT-09-17527. Idaho Falls, ID: Idaho National Laboratory. Available online at: https://bioenergy.inl.gov/Reports/Uniform%20Format%20Bioenergy%20Feedstock.pdf
Jacobson, J., Lamers, P., Cafferty, K., Kenney, K., Heath, B., Hansen, J., et al. (2014). Techno-Economic Analysis of Biomass Depot. INL/EXT-14-33225. Idaho Falls, ID: Idaho National Laboratory. Avaialable online at: https://www.osti.gov/biblio/1369631-techno-economic-analysis-biomass-depot
Jessen, H. (2015). Cellulosic Feedstocks of the Future. Available online at: http://ethanolproducer.com/articles/12597/cellulosic-feedstocks-of-the-future (Accessed March 12, 2018).
Lamers, P., Roni, M. S., Tumuluru, J. S., Jacobson, J. J., Cafferty, K. G., Hansen, J. K., et al. (2015a). Techno-economic analysis of decentralized biomass processing depots. Bioresour. Techno. 194, 205–213. doi: 10.1016/j.biortech.2015.07.009
Lamers, P., Tan, E. C. D., Searcy, E. M., Scarlata, C. J., Cafferty, K. G., and Jacobson, J. J. (2015b). Strategic supply system design-a holistic evaluation of operational and production cost for a biorefinery supply chain. Biofuels, Bioprod. Bioref. 9, 648–660. doi: 10.1002/bbb.1575
Liu, Z., Wang, S., and Ouyang, Y. (2017). Reliable biomass supply chain design under feedstock seasonality and probabilistic facility disruptions. Energies 10, 1895. doi: 10.3390/en10111895
Lorenz, A. J., Gustafson, T. J., Coors, J. G., and Leon, N. D. (2010). Breeding maize for the bioeconomy: a literature survey examining harvest index and stover yield and their relationship to grain yield. Crop Sci. 50, 1–12. doi: 10.2135/cropsci2009.02.0086
Marufuzzaman, M., Eksioglu, S. D., Li, X., and Wang, J. (2014). Analyzing the impact of intermodal-related risk to the design and management of biofuel supply chain. Transport. Res. E. Log. 69, 122–145. doi: 10.1016/j.tre.2014.06.008
McGill, J., and Darr, M. (2014). Transporting Biomass on Iowa Roadways. Iowa state university extension and outreach. PM 3051G Available online at: https://store.extension.iastate.edu/Product/Transporting-Biomass-on-Iowa-Roadways
Miller, G. A., Fenton, T. E., Oneal, B. R., Tiffany, B. J., and Burras, C. L. (2010). Iowa Soil Properties and Interpretations Database (ISPAID). Ames, IA: Iowa agriculture and home economics experiment station, university extension.
Muchiri, P., and Pintelon, L. (2008). Performance measurement using overall equipment effectiveness (OEE): literature review and practical application discussion. Int. J. Prod. Res. 46, 3517–3535. doi: 10.1080/00207540601142645
Pennington, D. (2013). Harvest Index: A Predictor of Corn Stover Yield. Michigan state university extension. Available online at: http://msue.anr.msu.edu/news/harvest_index_a_predictor_of_corn_stover_yield (Accessed June, 19 2018).
Rosen, W. B. (2012). Dupont Advances Commercialization of Cellulosic Ethanol With Iowa Biorefinery Groundbreaking. Available online at: http://www.dupont.com/products-and-services/industrial-biotechnology/press-releases/iowa-biorefinery.html (Accessed May 9, 2018).
Sahoo, K., and Mani, S. (2017). Techno-economic assessment of biomass bales storage systems for a large-scale biorefinery. Biofuels Bioprod. Bioref. 11, 417–429. doi: 10.1002/bbb.1751
Satlewal, A., Agrawal, R., Bhagia, S., Das, P., and Ragauskas, A. J. (2018). Rice straw as a feedstock for biofuels: Availability, recalcitrance, and chemical properties. Biofuels Bioprod. Bioref. 12, 83–107. doi: 10.1002/bbb.1818
Shah, A., and Darr, M. (2016). A techno-economic analysis of the corn stover feedstock supply system for cellulosic biorefineries. Biofuels Bioprod. Bioref. 10, 542–559. doi: 10.1002/bbb.1657
Sharma, B., Birrell, S., and Miguez, F. E. (2017). Spatial modeling framework for bioethanol plant siting and biofuel production potential in the U.S. Appl. Energy 191, 75–86. doi: 10.1016/j.apenergy.2017.01.015
Sharma, B., Ingalls, R. G., Jones, C. L., and Khanchi, A. (2013). Biomass supply chain design and analysis: Basis, overview, modeling, challenges, and future. Renew. Sust. Energ. Rev. 24, 608–627. doi: 10.1016/j.rser.2013.03.049
Sokhansanj, S., Kumar, A., and Turhollow, A. F. (2006). Development and implementation of integrated biomass supply analysis and logistics model (IBSAL). Biomass Bioenerg. 30, 838–847. doi: 10.1016/j.biombioe.2006.04.004
Stinger Inc. (2018). Stinger Stacker 6500. Available online at: http://www.stingerltd.com/faq.php
Turhollow, A. F., Webb, E., and Sokhansanj, S. (2009). Cost Methodology for Biomass Feedstocks: Herbaceous Crops and Agricultural Residues. ORNL/TM-2008/105. Oak Ridge, TN: Oak Ridge National Laboratory.
U.S.Department of Energy (2016). Biorefinery Optimization Workshop Summary Report. Chicago, IL. Avaialble Online at: https://www.energy.gov/sites/prod/files/2017/02/f34/biorefinery_optimization_workshop_summary_report.pdf
United States Census Bureau, (2016). TIGER Geodatabases: Road National Geodatabase. U.S. Department of Commerce. Available online at: https://www.census.gov/geo/maps-data/data/tiger-geodatabases.html (Accessed September 5, 2017).
USDA National Agricultural Statistics Service (2016). Cropland Data Layer. Washington, DC: Published Crop-Specific Data Layer USDA-NASS. Available online at: https://nassgeodata.gmu.edu/CropScape/ (Accessed September 5, 2017).
Valdivia, M., Galan, J. L., Laffarga, J., and Ramos, J. (2016). Biofuels 2020: biorefineries based on lignocellulosic materials. Microb. Biotechnol. 9, 585–594. doi: 10.1111/1751-7915.12387
Wan, L., Wang, F., Oral, S., Vazhkudai, S., and Cao, Q. (2014). A Report on Simulation-Driven Reliability and Failure Analysis of Large-Scale Storage Systems. Oak Ridge, TN: Oak Ridge National Laboratory. Available online at: https://info.ornl.gov/sites/publications/files/Pub51728.pdf
Wang, Y., Ebadian, M., Sokhansanj, S., Webb, E., and Lau, A. (2017). Impact of the biorefinery size on the logistics of corn stover supply-A scenario analysis. Appl. Energy. 198, 360–376. doi: 10.1016/j.apenergy.2017.03.056
Wang, Y., Ebadian, M., Sokhansanj, S., Webb, E., Zerriffi, H., and Lau, A. (2018). A novel risk analysis methodology to evaluate the economic performance of a biorefinery and to quantify the economic incentives for participating biomass producers. Biofuels Bioprod. Bioref. 12, 453–473. doi: 10.1002/bbb.1862
Ward, L. (2015). IBR Project Peer Review: POET-DSM Project LIBERTY. 2015 DOE Bioenergy Technologies Office (BETO). Available online at: https://energy.gov/sites/prod/files/2015/04/f22/demonstration_market_transformation_ward_3433.pdf
Wirt, A. Biomass Program Overview. Available online at: http://poet-dsm.com/resources/docs/POET-DSM%20Biomass%20Program%20Overview.pdf (Accessed April 9, 2018).
Keywords: operational disruptions, biorefinery, pre-processing, biomass, depots, simulation
Citation: Sharma B, Clark R, Hilliard MR and Webb EG (2018) Simulation Modeling for Reliable Biomass Supply Chain Design Under Operational Disruptions. Front. Energy Res. 6:100. doi: 10.3389/fenrg.2018.00100
Received: 10 May 2018; Accepted: 05 September 2018;
Published: 25 September 2018.
Edited by:
J. Richard Hess, Idaho National Laboratory (DOE), United StatesReviewed by:
Alok Satlewal, Indian Oil Corporation, IndiaDavid R. Shonnard, Michigan Technological University, United States
Copyright © 2018 Sharma, Clark, Hilliard and Webb. This is an open-access article distributed under the terms of the Creative Commons Attribution License (CC BY). The use, distribution or reproduction in other forums is permitted, provided the original author(s) and the copyright owner(s) are credited and that the original publication in this journal is cited, in accordance with accepted academic practice. No use, distribution or reproduction is permitted which does not comply with these terms.
*Correspondence: Erin G. Webb, d2ViYmVnQG9ybmwuZ292
 Bhavna Sharma
 Robin Clark2
 Michael R. Hilliard
 Erin G. Webb
