 Charles W. Edmunds1*
 Eliezer A. Reyes Molina2
 Nicolas André1
 Choo Hamilton1Sunkyu Park2Oladiran Fasina3
 Sushil Adhikari3Stephen S. Kelley2
 Jaya S. Tumuluru4
 Timothy G. Rials1
 Nicole Labbé1*
- 1Center for Renewable Carbon, University of Tennessee, Knoxville, TN, United States
- 2Department of Forest Biomaterials, North Carolina State University, Raleigh, NC, United States
- 3Department of Biosystems Engineering, Auburn University, Auburn, AL, United States
- 4Idaho National Laboratory, Biofuels and Renewable Energy Technologies Division, Idaho Falls, ID, United States
An abundant, low-cost, and high-quality supply of lignocellulosic feedstock is necessary to realize the large-scale implementation of biomass conversion technologies capable of producing renewable fuels, chemicals, and products. Barriers to this goal include the variability in the chemical and physical properties of available biomass, and the seasonal and geographic availability of biomass. Blending several different types of biomass to produce consistent feedstocks offers a solution to these problems and allows for control over the specifications of the feedstocks. For thermochemical conversion processes, attributes of interest include carbon content, total ash, specific inorganics, density, particle size, and moisture content. In this work, a series of switchgrass and pine residues blends with varying physical and chemical properties were evaluated. Physical and chemical properties of the pure and blended materials were measured, including compositional analysis, elemental analysis, compressibility, flowability, density, and particle size distribution. To screen blends for thermochemical conversion behavior, the analytical technique, pyrolysis gas chromatography mass spectrometry (Py-GC/MS), was used to analyze the vapor-phase pyrolysis products of the various switchgrass/pine residues blends. The py-GC/MS findings were validated by investigating the bio-oils produced from the selected blends using a lab-scale fluidized-bed pyrolysis reactor system. Results indicate that the physical properties of blended materials are proportional to the blend ratio of pure feedstocks. In addition, pyrolysis of pine residues resulted in bio-oils with higher carbon content and lower oxygen content, while switchgrass derived pyrolysis products contained relatively greater amount of anhydrosugars and organic acids. The distribution of the pyrolysis vapors and isolated bio-oils appear to be a simple linear combination of the two feedstocks. The concentration of alkali and alkaline earth metals (Ca, K, Mg, and Na) in the blended feedstocks were confirmed to be a critical parameter due to their negative effects on the bio-oil yield. This work demonstrates that blending different sources of biomass can be an effective strategy to produce a consistent feedstock for thermochemical conversion.
Introduction
Lignocellulosic biomass represents a renewable and sustainable resource that can be utilized to produce fuels, chemicals, and other products. Over the past few decades, research interest in bio-oil derived from fast pyrolysis of lignocellulosic biomass has attracted attention as a potential renewable and sustainable alternative for hydrocarbon transportation fuels or chemical products (Chiaramonti et al., 2007). Generally, bio-oil is an acidic, dark-colored liquid composed of hundreds of oxygen-containing compounds derived from the rapid depolymerization, dehydration, and fragmentation of the carbohydrate and lignin components present in the feedstock biomass (Mohan et al., 2006). The high acidity and low miscibility of bio-oil with petroleum derived products make their direct application difficult (Lehto et al., 2014), and thus upgrading of the bio-oil is a necessity (Zhang et al., 2007).
The United States have the potential to supply 1 billion ton per year of diverse biomass feedstocks including dedicated bioenergy crops, agricultural residues, and forestry residues (U. S. Department of Energy, 2016). However, there are challenges associated with the implementation and commercialization of biomass conversion technologies that need to be overcome for this to become a reality. A high quality, low-cost, and consistent supply of biomass is required to feed biorefineries (Thompson et al., 2016). Other issues in feedstock supply logistics include the regional and seasonal factors that affect the availability and supply of different biomass resources (Sultana and Kumar, 2011).
Blending multiple biomass sources offers a solution to the challenges associated with feedstock quality, variability, supply, and cost (Kenney et al., 2013; Thompson et al., 2013; Ray et al., 2017). Benefits of biomass blending or formulation include increasing the potential biomass supply in a given area surrounding a biomass processing facility or biorefinery. In addition, blending has been demonstrated to provide favorable feedstock flowability and pelleting characteristics (Yancey et al., 2013; Crawford et al., 2015). Recently, several different pretreatments and bioprocesses have been applied to blended feedstocks in the scope of biochemical conversion. These comprise pretreatments such as steam, SO2-catalyzed steam, dilute acid, ionic liquid, and bioconversion processes including enzymatic hydrolysis, fermentation, and organosolv fractionation (Shi et al., 2013; Astner et al., 2015; Vera et al., 2015; Wolfrum et al., 2017).
Blending different sources of lignocellulosic biomass to produce feedstocks for thermochemical conversion has also received recent attention. For example, Mahadevan et al. (2016a) reported that bio-oil from a blend of switchgrass and southern pine wood that contained greater proportions of switchgrass had the beneficial characteristics of lower acidity and viscosity; however, the bio-oil had higher water content. Carpenter et al. (2017) demonstrated that pyrolytic bio-oil yields and hydrodeoxygenated product yields from blended samples composed of clean pine, tulip poplar, and switchgrass in different combinations showed a linear trend based on the blends' components. In addition, Ren et al. (2017) reported on blending loblolly pine wood and bark for pyrolysis feedstocks, and indicated that as the ratio of bark increased, the organic yields decreased, char yields increased, and levoglucosan yields increased.
Due to the challenges that feedstock supply and logistics are facing for the biomass conversion industry, and the emergence of blending as a solution to these challenges, we recognize the need to integrate different aspects regarding feedstock processing, biomass chemistry, and thermochemical conversion. Therefore, in this work, we integrate several topics addressing the suitability of blending switchgrass and pine residues to produce feedstocks for thermochemical conversion. These topics include (a) biomass physical characteristics relevant to processability and feeding of the blends, (b) biomass chemical properties related to thermochemical conversion, (c) the analysis of vapor-phase pyrolysis products, and (d) pyrolysis product yields.
Materials and Methods
Biomass Feedstocks
Feedstock Harvesting and Preprocessing
Switchgrass and pine residues feedstocks were selected for this study based on their potential suitability for bioenergy feedstocks (Perlack and Stokes, 2011). The switchgrass, (P. virgatum L.) cv. Alamo, was field-grown and harvested in Vonore, TN, and processed with a tubgrinder by Genera Energy Inc. (Vonore, TN). Switchgrass is denoted as “SG.” The pine residues samples were harvested from forest stands near Auburn, AL, and consisted of composite samples of small diameter tree tops, limbs, and needles from 50 Loblolly pine trees. Two large batches (2,000–3,000 kg) of pine residues were collected by Auburn University with two different tree top (or stem) diameters that were included as the pine residues material. Residues harvested from 2 in. (50.8 mm) diameter tree tops are denoted as “2PN” and residues generated from 6 in. (152.4 mm) diameter tree tops are denoted as “6PN.” The pine residues were dried and both, pine residues and switchgrass, were hammer-milled to pass through a 3/16 in. (4.76 mm) screen at Herty Advanced Biomaterials (Savannah, GA). Prior to chemical analysis, representative samples were knife-milled using a Wiley mill to pass through a 0.425 mm (40-mesh) screen.
Blended Feedstock Preparation
Binary blends of (a) SG and 2PN, and (b) SG and 6PN were prepared by weighing the appropriate amount of each respective feedstock to achieve the desired weight ratio. Blends were prepared by mixing SG and PN in 12.5% (0.125 wt. fraction) increments, resulting in 7 blends in addition to the two pure feedstocks for each binary blend (Table 1). Samples designated for Py-GCMS experiments were further homogenized with a rotating ball mill (PM 100, Retsch, Germany) using zirconium oxide balls and milling cup. The ball mill program was designed as to not induce heat-related degradation to the biomass and consisted of 3 cycles of 60 sec of milling at 500 rpm with a 10 min rest time between cycles. Samples designated for fluidized bed pyrolysis experiments were milled further to pass through 0.5 mm screen using a Wiley mill.
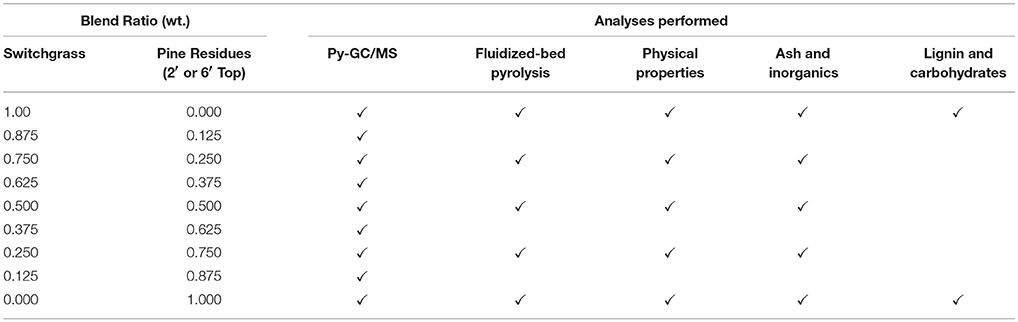
Table 1. Weight ratios of prepared switchgrass/pine residues blends and associated analyses performed for each blend ratio.
Biomass Chemical Analysis
Ash, Structural Carbohydrates, and Lignin Content
The total ash content was measured by combustion at 575°C following the standard laboratory procedure developed by the National Renewable Energy Laboratory (NREL; Sluiter et al., 2008). Biomass was sequentially extracted with water and ethanol using an ASE 350 accelerated solvent extractor (Dionex, Sunnyvale, CA), and the cellulose, hemicellulose, and lignin content of the extractives-free material were measured by following the standard NREL protocol (Sluiter et al., 2010). Sugars were quantified by high-performance liquid chromatography (Flexar, PerkinElmer, Shelton, CT) equipped with a deashing guard column (125-0118, Bio-Rad, Hercules, CA) and Aminex HPX-87P carbohydrate column (300 x 7.8 mm ID) with a column temperature of 85°C. Deionized water was used as the mobile phase with a flow rate of 0.25 mL/min. Acid insoluble lignin was measured gravimetrically, and acid soluble lignin was measured with a UV/VIS spectrometer (Thomas Fisher Scientific, Pittsburgh, PA). Total lignin content is reported as the sum of acid soluble and acid insoluble lignin. Analysis was performed in triplicate.
Inorganic and CHN Analysis
The concentration of inorganics was measured by microwave-assisted acid digestion and inorganics were detected by inductively coupled plasma-optical emission spectroscopy (ICP-OES) in accordance with the US Environmental Protection Agency (EPA) standard protocol (EPA, 1996). Milled biomass (0.5 g) was added to a solution of HNO3 (4 mL, 67-70%), of H2O2 (3 mL, 35%), and of HF (0.2 mL, 48%) in a PTFE pressure tube, and 1200 W of microwave power was applied using a Multiwave 3000 microwave digester (Anton Paar, Richmond, VA) to achieve a digestion temperature of 180–210°C. After digestion, the reaction solution was filtered with PTFE syringe filters (0.20 μm), then analyzed by ICP-OES (Optima 7300 Dual View, Perkin Elmer, Shelton, CT). The carbon, hydrogen, and nitrogen content were measured in duplicate with an elemental analyzer (Vario MICRO cube, Elementar, Ronkonkoma, NY), and the oxygen content was calculated by difference. Analysis was performed in triplicate.
Feedstock Physical Properties Characterization
The particle size distribution of each sample was measured using a Camsizer particle analyzer (Retsch Technology, Hann, Germany). Approximately 100 g of a material were loaded into the instrument hopper, then a vibratory feeder conveyed the biomass into the analyzer. The diameters in which 90%, 50%, and 10% of the particles are smaller than are reported as d90, d50, and d10. The span (defined below) was used as a measure of the variability, and hence the distribution, of the sizes of particles in each sample.
Bulk density was determined by a bulk density measuring apparatus (Burrows Co., Evanston, IL). This method involved pouring the bulk sample into a container (volume of 1,137 mm3) from a funnel (positioned at a height of 610 mm above the top edge of the container). The heap formed by the sample was then carefully leveled with the top of the surface of the container. The sample in the container was then weighed. Bulk density was calculated as the ratio of the sample mass to the container volume. The particle density of each sample was measured with an AccuPyc 1340 gas pycnometer (Micromeritics Instrument Corp., Norcross, GA). A model TD-12 automated tap density tester (Pharma Alliance Group Inc., Valencia, CA) was used to measure the tap density of the feedstock samples according to ASTM B527 (ASTM, 2015). Samples were weighted to a precision of 0.001 g using a digital balance.
The compressibility (CM) was determined by filling a compression cell (height = 101.83 mm and internal diameter = 49.55 mm) with biomass, and using a fitted piston (diameter = 49.00 mm) attached to the cross-head of a model TA-HD texture analyzer (Stable MicroSystems, Surrey, U.K.). The piston was operated at a 1 mm/s compression rate and 6 kPa consolidating pressure. The following equation was used to calculate compressibility (Littlefield et al., 2011):
where Vi and Vf are the initial and final volume of the sample, respectively. All of the physical properties analyses were carried out in duplicate.
Pyrolysis Experiments
Py-GC/MS and Multivariate Data Analysis
The composition of the vapor-phase pyrolysis products of the pure and blended feedstocks was screened by using analytical pyrolysis-gas chromatography-mass spectrometry (Py-GC/MS). The Py-GC/MS instrumentation consisted of an EGA/Py-3030 D micropyrolyzer (Frontier Lab, Japan) attached to a Clarus 680 gas chromatograph and Clarus SQ 8C mass spectrometer (PerkinElmer, Shelton, CT). Biomass samples (0.5 mg) were added to a metal sample cup and an autosampler was used to drop the samples into the pyrolysis furnace heated to 500°C. After a pyrolysis furnace residence time of 12 s, the vapors were swept into the GC via direct attachment to the injection port [unpacked 2 mm quartz liner, split ratio 80:1, and injector temperature of 270°C via the carrier gas (ultrahigh-purity helium, 99.9999%)]. An Elite 1701 MS gas capillary column (60 m length, 0.25 mm ID, and 0.25 μm film thickness) was used with He carrier gas (1 cm3/min flow rate and 17.3 psi pressure). The GC furnace used a time temperature ramp program of 4 min at 50°C, followed by a ramp of 5°C/min to 280°C, and then hold at 280°C for 5 min. The MS was operated with an ionization energy of 70 eV and temperature of 280°C. Two-hundred pyrogram peaks and associated peak areas were extracted using the TurboMass GC/MS software with a Signal/Noise ≥ 2,000 and identified with the National Institute of Standards and Technology (NIST) library. Five replicates per sample were performed.
In order to visualize trends in the vapor-phase pyrolysis products derived from pure and blended biomass samples, we performed the multivariate statistical analysis, principal component analysis (PCA) using the statistical software, The Unscrambler X ver. 10.4 (Camo software Inc., Woodbridge, NJ). In total, 166 pyrogram peaks were selected and assigned a peak number corresponding to its order based on retention time. Pyrogram peak areas were normalized based on the total peak area prior to PCA.
Fluidized-Bed Pyrolysis Reactor and Bio-Oil Characterization
A schematic of the lab-scale fluid-bed reactor is shown in Figure 1 (Meng et al., 2012). The system consists of a screw feeder, an externally heated fluid bed, a char collection cyclone, and a bio-oil collection system consisting of two water-cooled condensers and an electrostatic precipitator (ESP). Sand was used in the fluidized bed as the heat transfer media. Nitrogen was introduced from the bottom of the reactor at a flow rate of 4.5 L/min, and a secondary nitrogen stream was introduced prior to the screw auger feeding the reactor with a flow rate of 6.5 L/min. These nitrogen streams maintain an oxygen-free environment to maximize the yield of bio-oil. The fluid-bed was maintained at 510°C and the residence time in the reactor was calculated to be between about 1.2–1.5 s (Basu, 2010). The biomass feeding rate was 150 g/hr and the total run time was approximately 60 min. The pyrolysis vapors were rapidly quenched and collected in the two condensers which were chilled to 2–4°C (Freel and Graham, 1998), and aerosol particles were collected in the ESP. The yields of biochar and bio-oil were measured gravimetrically, while the non-condensable gases (NCG) were measured by difference. Furthermore, the yield of reaction water was calculated by normalizing the measured water content in the bio-oil by the total bio-oil yield, and the bio-oil organic yield is calculated as the total bio-oil yield minus the reaction water. All pyrolysis runs were performed in duplicate.
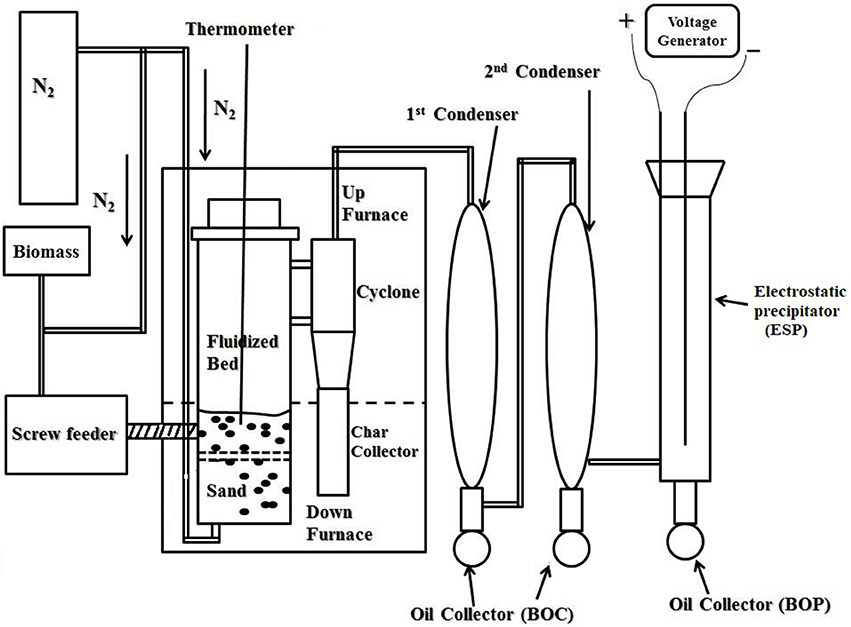
Figure 1. Lab-scale fluidized-bed fast pyrolysis reactor (Meng et al., 2012).
The carbon, hydrogen, and nitrogen (CHN) content of bio-oil samples were measured with a CHN Elemental Analyzer (2400 Series II, Perkin Elmer, Shelton, CT), and the oxygen content was calculated by difference. The molecular weight of the produced bio-oils were determined by the gel permeation chromatography (GPC). The GPC instrument (Shimadzu, Kyoto, Japan) was equipped with two columns (Waters Styragel HR 5E and Styragel HR 1). Calibration was achieved with polystyrene standards using a refractive index detector. Approximately 3 mg of bio-oil sample were dissolved into 10 mL of tetrahydrofuran (THF) and then passed through a 0.2 μm PTFE syringe filter. An aliquot of the solution (20 μL) was injected into the GPC, and THF was used as the eluent at flow rate of 0.7 mL/min. The number-average molecular weight (Mn) and average molecular weight (Mw) were calculated using the instrument software (Shimadzu LC solution-GPC Postrum).
Results and Discussion
Physico-Chemical Characteristics of Pure and Blended Feedstocks
Feedstock Composition
Switchgrass (SG) and pine residues (PN) were used for this study based on their availability and suitability as bioenergy feedstocks in the southeastern United States. Switchgrass is recognized as a good bioenergy crop due to its high biomass output and ability to be grown on marginal soils (Mitchell et al., 2016). Pine residues are defined as small diameter (2 or 6 inches) tree tops, limbs, and needles that are generally considered as waste during harvesting of pine forests. This material is potentially abundant and low-cost (Perlack and Stokes, 2011). We investigated two batches of pine residues, 6PN is derived from 6″ diameter tree tops, limbs, and needles and has a higher proportion of clean wood compared to 2PN, which is derived from 2″ tree tops, limbs, and needles, and has a higher proportion of bark and needles. We hypothesize that 6PN will be a higher value feedstock based on the higher proportion of clean wood, and associated decrease in ash and inorganics content compared to the 2PN feedstock.
The chemical composition, CHN content, and inorganic analysis for the three individual feedstocks are shown in Tables 2, 3. The cellulose and hemicellulose content are the highest in SG, followed by 6PN, while 2PN contains the least. Among the three feedstocks, SG has the highest ash content at 1.30%, followed by 2PN (1.13%), and 6PN the lowest ash content at 0.76%. The concentration of the combined alkali and alkaline earth metals (AAEMs), which includes Ca, K, Mg, and Na, follows the trend of 2PN>6PN>SG. When only considering the pine residues feedstocks, 6PN contains lower ash, inorganics (especially the AAEMs), and extractives compared to the 2PN, which can be explained by the higher proportion of clean wood found in larger stem diameter pine residues materials (6″ vs. 2″ stem diameter).
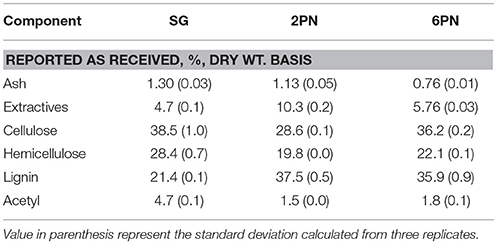
Table 2. Chemical composition of feedstock biomass.
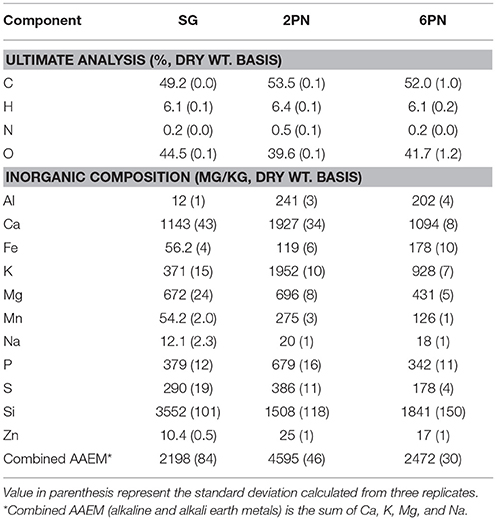
Table 3. CHNO content and inorganic composition of feedstock biomass.
Due to lessened ash and AAEMs content, we expect 6PN to be a higher quality feedstock compared to the 2PN material. Switchgrass (SG), despite having a higher ash content than the 2PN and 6PN feedstocks, shows the lowest concentration of AAEMs. The higher ash content in switchgrass can be largely attributed to its high silicon content, which is commonly reported in switchgrass (Vassilev et al., 2010). Silicon is inert under pyrolysis conditions, and while high content is undesirable due to the reduced amount of carbon available for conversion, it is not detrimental to the conversion reaction like the AAEMs (Fahmi et al., 2008; Patwardhan et al., 2010; Mahadevan et al., 2016b).
Carbon content is the highest in 2PN (53.5%), followed by 6PN (52.0%), and SG (49.2%) and the same order is observed for nitrogen, where nitrogen content is higher in 2PN (0.5%) compared to 6PN (0.2%) and SG (0.2%). Higher carbon contents have been correlated with increased heating value and energy content in biomass (Tillman, 1978) while increased N content in feedstock has been associated with reduced bio-oil acidity; but also with reduced bio-oil stability (Mante and Agblevor, 2014).
The chemical composition of the feedstocks can have a major impact on the resulting pyrolysis product yields and bio-oil quality (Mohan et al., 2006). Under typical pyrolysis conditions, structural carbohydrates (cellulose and hemicellulose) are converted to anhydrosugars, organic acids, furans, ketones, aldehydes, char, and non-condensable gases, while lignin is converted into phenolic compounds, light organic oxygenates, acids, char, and non-condensable gases (Carpenter et al., 2014). In addition, previous work demonstrates that the presence of ash, especially AAEMs, results in greater formation of organic acids, non-condensable gases, and char during pyrolysis (Fahmi et al., 2008; Patwardhan et al., 2010; Mahadevan et al., 2016b).
Physical Characteristics Relevant to Processability and Feeding
The mean values of the particle size characteristics, bulk, particle and tap densities, compressibility, and Hausner ratio (used as a measure of flowability) are summarized in Table 4. Tukey's multiple comparison tests (SAS Institute, Cary, NC) on these mean values show that switchgrass bulk and tap densities are significantly (p-value < 0.05) lower than the pine residues samples (2″ and 6″). When switchgrass is blended with the pine residues samples, the bulk and tap densities of the resulting blends are almost proportional to the ratios of the pine sample in the blend. A similar trend is observed for the d50 particle size (increasing with pine amount). The reverse trend is seen for the span (an indication of the variability in the size of particles in a particular sample), and as the amount of pine residues increased, the span was reduced (Figure 2).
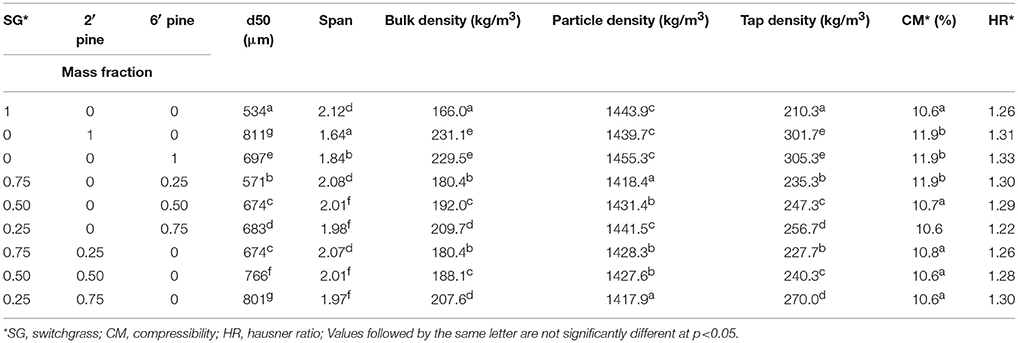
Table 4. Physical characteristics of grinds from switchgrass and pine residues blends.
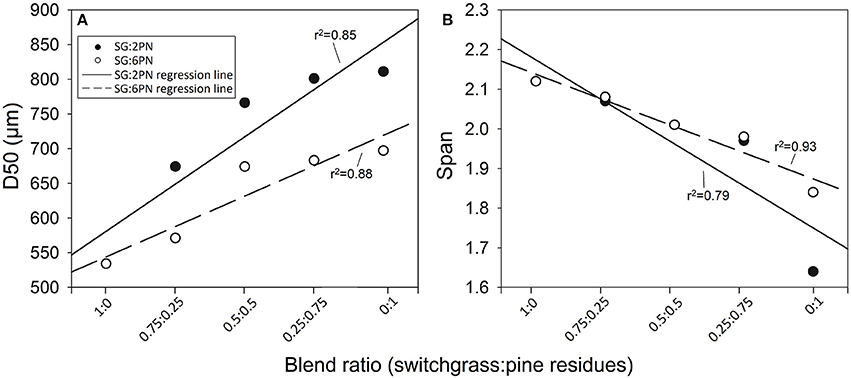
Figure 2. Linear trends between (A) the d50 particle size and (B) the span measured on pure and blended feedstocks.
The higher span of switchgrass particles is probably due to the elongated nature and higher aspect ratio of switchgrass grinds that was observed. We hypothesize that the more elongated nature of switchgrass causes entangling of the particles in a bulk sample and therefore may contribute to the lower densities of bulk switchgrass (i.e., bulk and tap densities). Even though there are significant differences in the particle densities of the samples, there is not an observable trend regarding the effect of sample type (switchgrass vs. pine residues) or relative amount of switchgrass in a switchgrass/pine residues blend.
The Hausner ratio (defined as tap density/bulk density) can be used as an indicator of the flowability of milled materials (Bernhart and Fasina, 2009). The Hausner ratio of the samples and the blends varies slightly from 1.26 to 1.33. According to Figura and Teixeira (2007), this indicates that the samples may have difficulty at flowing. Investigating densification techniques, such as pelletization, may be required to improve handling and flowability characteristics, and is discussed later. These results agree with Crawford et al. (2015), who demonstrated that flow properties of blends composed of switchgrass, corn stover, miscanthus, and hybrid poplar behaved in a linear fashion depending on the characteristics of the blend's individual components.
Py-GC/MS of Blended Samples
We used micro-scale pyrolysis gas chromatography mass spectrometry (Py-GC/MS) to analyze the vapor-phase pyrolysis products of the various switchgrass/pine residues blends. Using a small-scale pyrolysis system allows us to rapidly screen a larger number of samples in order to investigate blends for thermochemical conversion behavior. Due to the ambiguity of visual comparison of the numerous peaks in the Py-GC/MS pyrograms among many different samples, we used principal component analysis (PCA) to identify the sources of maximum variation and visualize trends in the vapor-phase pyrolysis products from the pure and blended samples. In addition, percent normalized peak areas for several pyrolysis products were compared among pure and blended samples.
Principal Component Analysis
Figure 3 shows the PCA scores and loadings plots for SG, 2PN, and their blends which vary by weight fraction increments of 0.125 (Table 1). The PCA for SG, 6PN, and their blends is provided in the Supplemental Material (Figure S1). The data input into this PCA consisted of 4–5 replicate pyrograms for each biomass sample, and 166 peaks were detected in each pyrogram. The same 166 peaks occurred in all sample pyrograms in varying intensities. The NIST library was used to identify as many compounds as possible based on the mass fragmentation pattern, and identified peaks are listed in Table 5. The pyrogram peaks areas were normalized based on total peak area prior to analysis; therefore, the PCA results indicate relative concentration of vapor-phase pyrolysis products.
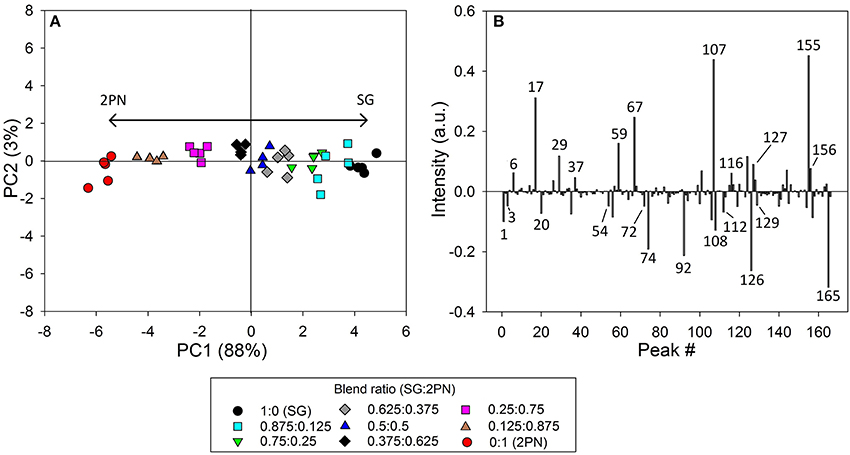
Figure 3. Principal component analysis (PCA) of Py-GC/MS pyrograms from switchgrass (SG), 2″ pine residues (2PN), and their corresponding blends; the PC1 vs. PC2 scores plot (A), and the PC1 loadings plot (B) are shown.
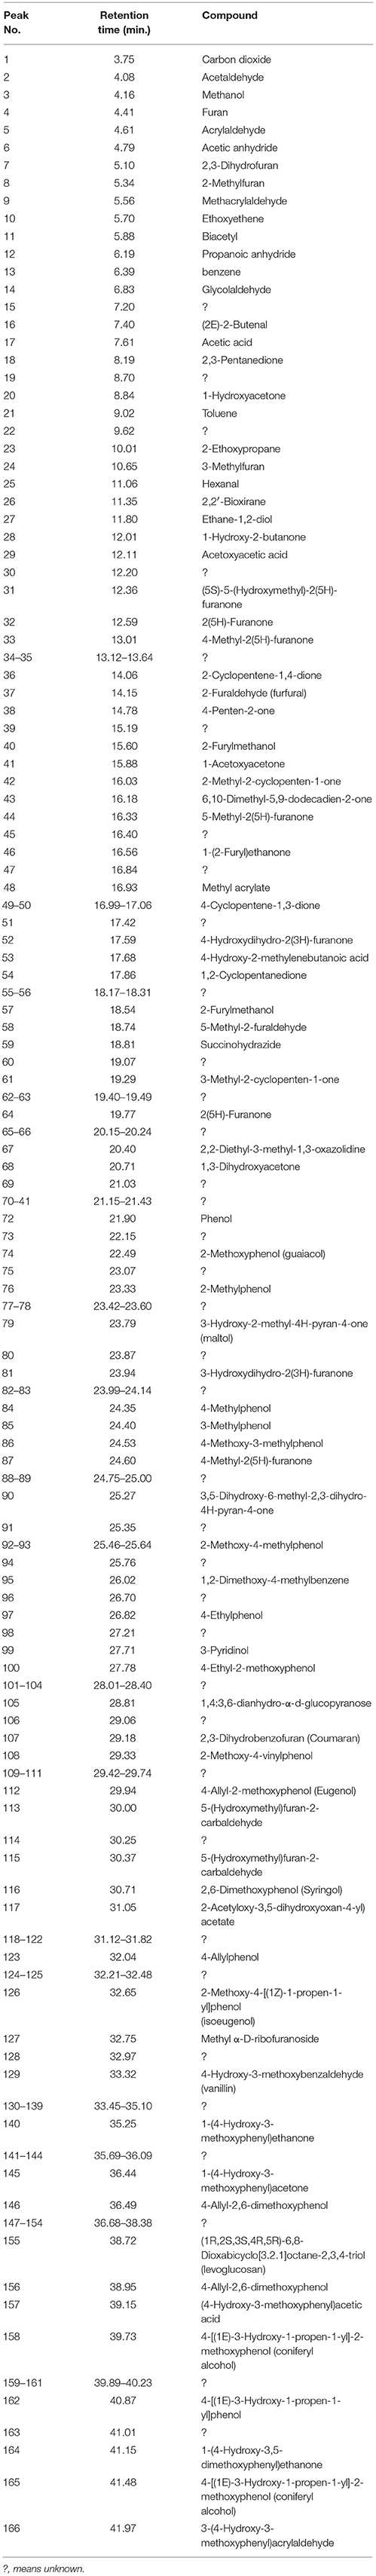
Table 5. Vapor-phase pyrolysis product compounds identified using pyrolysis gas chromatography mass spectrometry (Py-GC/MS) in pure switchgrass, 2PN, and 6PN biomass samples under identical pyrolysis conditions.
PC1 and PC2 accounted for 88 and 3% of the total variance in the dataset, respectively, indicating that most of the differences in the pyrolysis product distribution are represented by PC1. The scores plot shows that the pyrograms from 2PN are plotted at the most negative location and SG at the most positive location along the PC1 axis. The blended samples are plotted on the PC1 axis between the switchgrass and pine residues feedstocks in order of their blend ratio, with the trend of increasing PC1 score with higher ratios of switchgrass (Figure 3A).
The loadings plot for PC1, shown in Figure 3B, indicate which specific pyrogram peaks (representing chemical compounds) are the most significant in explaining the trends observed in the scores plot. For example, peaks in the loadings plot with positive intensities occur in greater relative amounts in the sample pyrograms with positive scores, and likewise, loadings with negative peaks occur in greater relative abundance in samples falling on the negative quadrant of PC1 in the scores plot. Therefore, compounds with positive intensity in the loadings plot have relatively greater abundant in pure SG and blends with higher proportions of SG. These compounds include light oxygenates such as acetic anhydride (6); organic acids including acetic acid (17), acetoxyacetic acid (29), and succinohydrazide (59); furans comprising furfural (37) and 2,3-dihydrobenzofuran (107); phenols such as 2,6-dimethoxyphenol (syringol) (116), 4-allyl-2,6-dimethoxyphenol (156); and sugars derived compounds such as methyl-α-D-ribofuranoside (127) and levoglucosan (155).
Similarly, peaks in the loadings plot with negative intensity occur in relatively greater amounts in 2PN and blends with higher proportions of 2PN. Phenolic compounds made up the majority of these and include phenol (72), 2-methoxyphenol (guaiacol) (74), 2-methoxy-4-methylphenol (92), 2-methoxy-4-vinylphenol (108), eugenol (112), 2-Methoxy-4-[(1Z)-1-propen-1-yl]phenol (Isoeugenol) (126), vanillin (129), and coniferyl alcohol (165). Other compounds with negative loadings include CO2 (1), methanol (3), 1-hydroxyacetone (20), and 1,2-cyclopentanedione (54).
The pyrolysis products distributions from the switchgrass and pine residues feedstocks are related to their chemical compositions. Switchgrass contains a higher amount of cellulose and hemicellulose (Table 2), which have been shown to thermally degrade to organic acids, aldehydes, furans, ketones, and anhydrosugars (Carpenter et al., 2014). Specific phenolic compounds which are greater in SG pyrolysis vapors are associated mainly with the pyrolysis with syringyl lignin which is present in herbaceous feedstocks but not in softwoods (Evans and Milne, 1987). In addition, the relatively higher amount of methanol and phenolic compounds in pine residues pyrolysis vapors may be caused by the higher lignin content in the pine residues feedstocks compared to switchgrass (Table 2; Jegers and Klein, 1985).
Increased relative yields of CO2 and methanol in 2PN are indicated by negative PC1 loadings, which can be attributed to the higher ash and inorganics content in 2PN. Ash and particularly AAEMs are more reactive than other inorganics and effectively catalyze ring-breaking, depolymerization, and fragmentation reaction, which results in increased production of non-condensable gases, organic acids, and other light oxygenated compounds (Carpenter et al., 2014; Mahadevan et al., 2016b). Similar trends are observed in the PCA results obtained from the Py-GC/MS data for SG, 6PN, and their blends (Figure S1).
A linear trend across PC1 in relation to the blend ratio is observed in the PCA scores plots for both SG/2PN and SG/6PN blends. This implies that the pyrolysis products distribution in blended samples mainly behaves as a simple linear combination of the two feedstocks. This also demonstrates that there are no significant non-linear effects on the pyrolysis vapor products that occurred when using blended materials as pyrolysis feedstocks. Carpenter et al. (2017) reported a similar linear trend based on the blend components for yields of raw and upgraded bio-oil from blends of switchgrass, pine wood, tulip poplar, and oriented strand board. In addition, Mahadevan et al. (2016a) tested blends of southern pine and switchgrass as a pyrolysis feedstock, and reported similar blending effects for pyrolysis products yields and bio-oil characteristics.
Pyrogram Peak Area Analysis
To further investigate the effect of blending on the vapor-phase products formation, we analyzed some specific compounds which were identified as having high variability in the PCA loadings plot. Figure 4 shows the percent normalized Py-GC/MS pyrogram peaks areas for CO2, acetic acid, 2,3-dihydrobenzofuran, isoeugenol, levoglucosan, and coniferyl alcohol from the SG:2PN and SG:6PN blends. For all compounds shown, there is a distinct linear correlation, which further evidences that the pyrolysis products distribution of blended samples behave as a simple linear combination of its components. These trends are in agreement with the previously discussed PCA results (Figure 3). The relative production of CO2 is higher in the SG/2PN blends, which is most likely caused by the higher ash and inorganics content in 2PN compared to 6PN. This is significant because higher yields of non-condensable gases, such as CO2, will result in reduced yields of bio-oil.
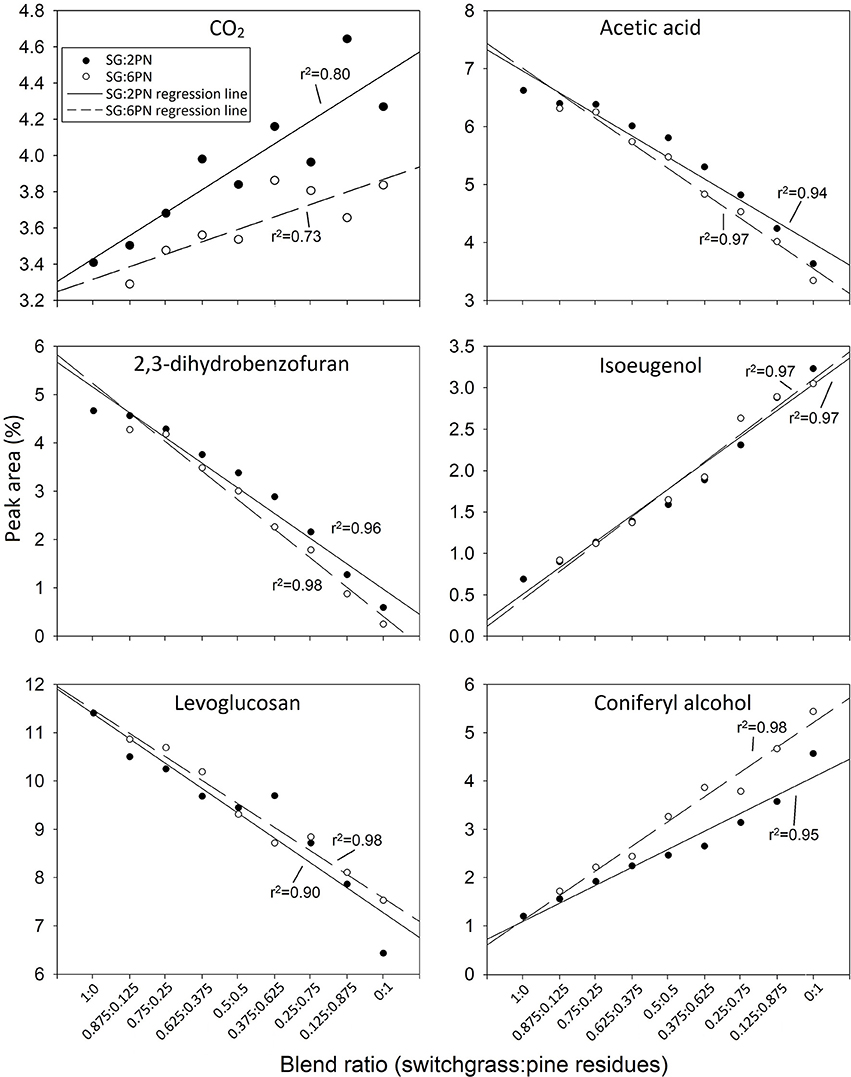
Figure 4. Trends between % peak area for several vapor-phase pyrolysis products measured by Py-GC/MS and biomass blend fraction for blended samples composed of switchgrass and pine residues.
The relative yields of coniferyl alcohol are greater for the SG/6PN blends compared to the SG/2PN blends. This is probably related to the relatively lower inorganics content in the 6PN compared to 2PN. Mahadevan et al. (2016b) demonstrated that increased concentrations of AAEMs result in decreased coniferyl alcohol yields in pyrolysis vapors. When comparing the SG/2PN and SG/6PN blends, the trends and % peak areas for acetic acid, 2,3-dihydrobenzofuran, isoeugenol, and levoglucosan are very similar between the two. This indicates that differences in the chemical composition between the 2PN and 6PN feedstocks did not strongly influence the relative yields for these specific compounds.
Fluidized-Bed Pyrolysis of Selected Blends
A fluidized-bed pyrolysis reactor was used to produce bio-oil from pure switchgrass, pure pine residues (2PN and 6PN), and 0.25/0.75, 0.5:0.5, and 0.75:0.25 (mass fraction) blends of the two.
The pyrolysis product yields are shown in Figure 5. The yield of biochar and reaction water range from 8.7 to 15.9% and 10.6 to 14.5%, respectively, and both increase as the pine residues content of the blends augment in both SG/2PN and SG/6PN blends. The yield of NCG ranges from 28.6 to 34.6% and decreases with increasing pine residues content in the blends. A decreasing trend of bio-oil organic yield is observed for the SG/2PN blends, while no clear trend is observed in SG/6PN blends. The content in AAEMs in the 2PN feedstock, compared to SG and 6PN, resulted in reduced bio-oil organic yields. Within error, there is a linear trend in the pyrolysis products yields, based on the blend proportions of the pure feedstocks. Other researchers have reported similar linear trends in pyrolysis products yields in blends from different lignocellulose species (Carpenter et al., 2017).
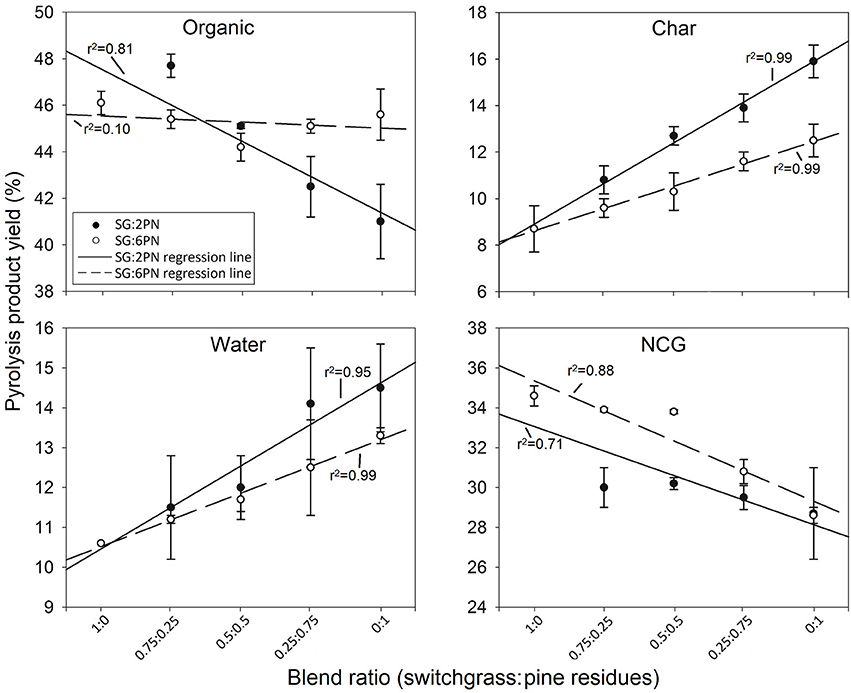
Figure 5. Pyrolytic product yields of biochar, organic-phase bio-oil “organic,” water, and non-condensable gases (NCG) obtained by pure feedstocks and binary blends of switchgrass and pine residues.
The content of carbon, hydrogen, nitrogen, and oxygen and molecular weight of the produced bio-oils are shown in Table 6. The carbon content and the average molecular weight (Mw) and number-average molecular weight (Mn) of bio-oil from the pure feedstocks is highest in 2PN, followed by 6PN, and lowest in SG. The inverse is observed for oxygen content where the trend is 2PN < 6PN < SG. The bio-oil molecular weight results are likely related to the feedstock lignin content. During pyrolysis, lignin is decomposed into higher molecular weight phenolic compounds (Evans and Milne, 1987), thus the trend in bio-oil molecular weight is the same as the trend for feedstock lignin content (2PN>6PN>SG). In addition, most of the oxygen contained in the feedstock is preserved in the bio-oil product (Mohan et al., 2006), thus feedstock with higher oxygen content produced bio-oils with higher oxygen content. Our results are in agreement with previous research which has demonstrated a positive correlation between lignin content and bio-oil molecular weight, and a negative correlation between lignin content and bio-oil oxygen content (Fahmi et al., 2008). In addition, Mahadevan et al. (2016a) reported higher carbon content and lower oxygen content bio-oil produced from southern pine compared to bio-oil from switchgrass. Similar to the other measured properties, the carbon and oxygen contents and molecular weight of bio-oil from blended feedstock behave as a linear combination based on the feedstock's blend ratio.
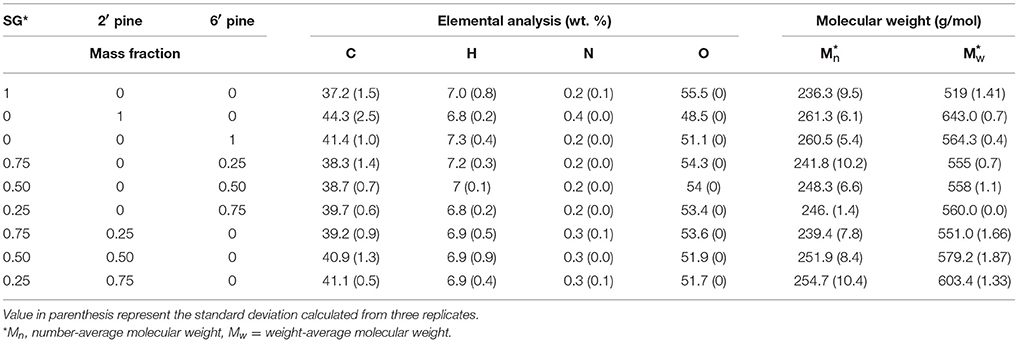
Table 6. Elemental analysis and molecular weight of bio-oils produced from pure and blended switchgrass and pine residues feedstocks.
To probe the relationship between the concentration of inorganics and pyrolysis product yields in the pure and blended samples, a Pearson correlation analysis (SAS Institute, Cary, NC) was performed (Table S1). Significant correlations (defined as having a p-value below 0.01) are found between several inorganics and the yield of pyrolysis products. For example, strong correlations are observed between the concentration of K and the yield of biochar, bio-oil organic fraction, and reaction water, having correlation coefficient (r) of 0.98, −0.83, and 0.92, respectively. In addition, the correlation plots for total AAEMs (the sum of Ca, K, Mg, and Na) and pyrolysis products yield are shown in Figure 6. The correlation (r) between the AAEM concentration and bio-oil organic fraction “Organic,” biochar, and water yield are strong with correlation coefficient of −0.80, 0.91, and 0.79, respectively. The correlation between AAEMs and non-condensable gases is moderate with r = −0.63. In addition, ash content is not significantly correlated with the pyrolysis products yields. Although high ash content is not desirable due to overall reduced carbon content in the biomass, it is not necessarily the best indicator of biomass quality parameter to use when assessing biomass for conversion via pyrolysis.
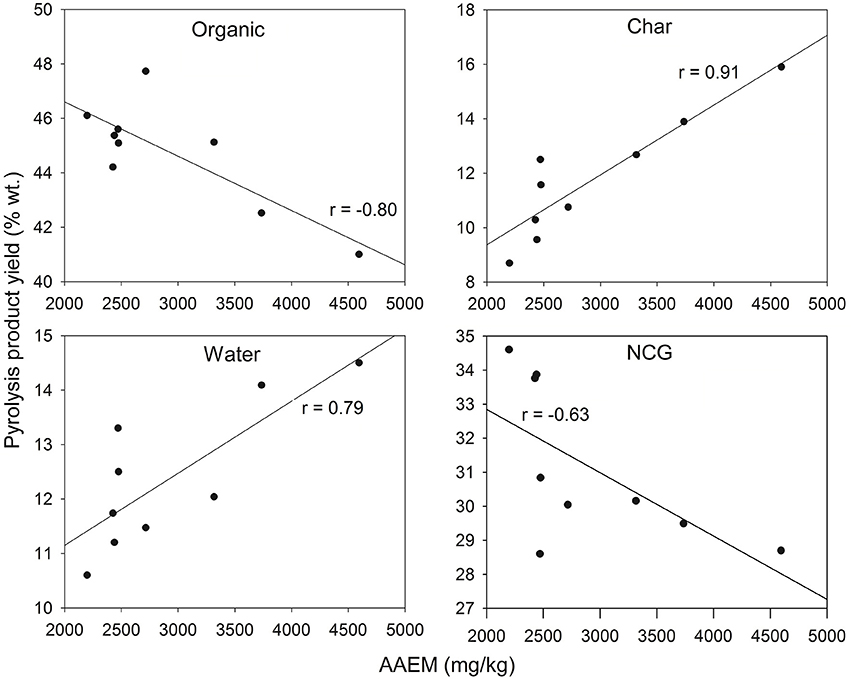
Figure 6. Plots showing the correlation between the AAEM and the pyrolysis product yields of organic phase bio-oil “Organic,” biochar, water, and non-condensable gases “NCG.” AAEM was calculated as the sum of Ca, K, Mg, and Na.
Feedstock properties that affect pyrolysis products yields include the organic composition of the feedstocks (cellulose, hemicellulose, and lignin) as well as the inorganic composition (ash and alkali and alkaline earth metals). However, given our current results, it is difficult to delineate the effects of organic vs. inorganic constituents. Previous research has reported that the inorganic composition (mainly the content of reactive AAEMs) of the feedstock has a greater influence on the pyrolysis product yields than the lignin content (Fahmi et al., 2008). Alkali and alkaline earth metals have been shown to result in increased reaction water, increased biochar yields, and decreased organic liquid yields (Das et al., 2004; Fahmi et al., 2008). This is agreeable to our observation of increased biochar yield with increasing pine residues, as the pine residues used in this work have higher inorganics content. In addition, decreased bio-oil organic fraction yields in the case of SG/2PN blends are likely a result of the higher AAEM content of the 2PN feedstock (Table 3).
Based on previous work, the effects of cellulose and lignin content in pyrolysis feedstocks on the pyrolysis products yields are not as clear. For example, several studies have reported increasing bio-oil yields and decreasing gas and biochar yields as feedstock lignin content increased (Fahmi et al., 2008; Tröger et al., 2013). Conversely, Lv et al. (2010) reported higher biochar and gas yields with increasing lignin content. There are likely interactions between the organic constituents and the inorganics of biomass (mainly reactive alkali and alkaline earth metals) which make understanding the relationship between biomass composition and pyrolysis products yields complex and difficult to delineate (Couhert et al., 2009; Tanger et al., 2013).
Blend Discussion/Recommendation
The Impact of Blending on Feedstock Physical and Chemical Properties and Densification
Woody and herbaceous biomass feedstocks both exhibit significant variability in their chemical and physical composition. Blending of different types of biomass can help to produce a consistent feedstock that meets specifications required for thermochemical conversion in terms of energy, volatiles, inorganics, and ash content (Tumuluru et al., 2012). Densification is often considered as a necessary step to increase the bulk density of the feedstock to facilitate its transportation and storage. In addition, densification has the benefit of improving particle uniformity, as well as improving handling and flowability characteristics (Tumuluru et al., 2011).
Lignin is considered as a natural binding agent and is an important component of biomass for densification. In general, grasses, which have lower lignin content, are difficult to pelletize, do not produce pellets with good density and durability, and require higher pelleting energy. In addition, many researchers have reported that grasses do not produce good quality pellets due to their low lignin and needle shape particles (Stelte et al., 2011). Woody biomass, given that is a cleanly harvested material, generally have higher lignin and lower ash content compared to straws or grasses. Therefore, the blending of straws or grasses with woody biomass can augment pellet properties and reduce the pelleting energy requirements (Tumuluru et al., 2012). The present research indicates that switchgrass has about 21% lignin content whereas the pine residues contain 37.5 and 35.9%, for 2PN and 6PN, respectively (Table 2). We hypothesize that blending switchgrass with pine residues can bring significant improvement in terms of lignin and particle size distribution and can help to produce good quality pellets with lower energy consumption. Thus, blending not only helps to achieve a specific chemical composition of feedstock but also has the potential to improve its mechanical preprocessing and flow characteristics.
Researchers has shown that the particle size distribution of milled material has a significant impact on the quality of the resulting pellets. For example, Tumuluru et al. (2011) reported a negative correlation between the material particle size and pellet density and durability. This phenomenon is caused by greater surface area in smaller particles resulting in reduced void space after densification. In addition, different densification techniques perform better with different particle sizes. For example, smaller particles are better suited for a pellet mill because the consolidation process is dependent on the inter-particle contact area, while larger particles are better suited for a briquette press as binding in this system is achieved by interlocking of particles (Tumuluru et al., 2012). It is critical to manage the particle size to meet the densification equipment requirements in order to produce high-quality densified materials while reducing energy consumption. Blending woody and herbaceous biomass can be utilized to alter the particle size distribution and produce feedstocks suitable for different densification systems.
According to Payne (1978), adding moisture through steam conditioning while pelleting of medium to fine-ground materials is suitable due to the high surface area involved, and this can result in greater gelatinization of starch and increased binding. The same authors also reported that a specific ratio of fines to medium sized particles can improve pelleting efficiency by reducing energy requirements during pelleting. In the present study, blending of pine residues and switchgrass at different ratios has resulted in different particle size distributions (Table 4). This change in the particle size can have significant impacts on pellet quality and energy consumption of pelleting process.
The Effect of Blended Feedstocks on Bio-Oil Yield and Quality
Results from our small-scale pyrolysis (Py-GCMS) experiments as well as the bench-scale fluidized-bed pyrolysis reactor experiments demonstrate that the vapor-phase pyrolysis product distribution and pyrolysis products yields behave as a simple linear combination of the two feedstocks. The trend of the pyrolysis behavior of blended samples being proportional to the pure feedstocks in which it is composed has been observed by several other researchers using several other types of lignocellulosic biomass, and is confirmed in this study. Thus, this behavior appears to be ubiquitous across blends created with different lignocellulosic species. In effect, predicting the pyrolysis behavior of blended feedstocks is straight-forward, which should make the utilization of blending as a feedstock preprocessing strategy more direct. In addition, we demonstrate that biomass ash content is not strongly correlated with pyrolysis product yields, while some specific inorganics show strong correlations. Therefore, the concentration of alkali and alkaline earth metals should be considered as more important for determining the quality of a feedstock.
This work demonstrates that blending switchgrass and pine residues is a promising method for producing consistent and high-quality feedstocks for thermochemical conversion. However, several aspects must be considered when defining the optimum feedstock blend ratios. These aspects include the availability and cost of the individual pure feedstocks, the final cost of the processed and blended feedstock, and the potential quality and value of the produced bio-oil. Future research is required to further assess the technical and economic aspects regarding harvesting, transportation, and processing of blended feedstocks.
Conclusions
Feedstocks for thermochemical conversion were prepared by blending low-ash pine residues and relatively higher-ash switchgrass biomass in several different ratios. Chemical and physical properties and thermochemical reactivity were investigated. Results indicate that physical properties such as bulk and tap densities and particle size distribution are proportional to the ratio of switchgrass and pine residues in the blended sample. The vapor-phase pyrolysis products of pine residues are higher in CO2 and phenolic compounds, while switchgrass produces more acetic acid, dihydrobenofuran, and levoglucosan. Lab-scale fluidized-bed pyrolysis experiments demonstrated that pyrolysis of pine residues resulted in bio-oils with greater carbon content and reduced oxygen content, and the bio-oil organic yield showed a strong correlation with the concentration of alkali and alkaline earth metals in the feedstock. Similar to the physical properties, the distribution of the vapor-phase pyrolysis products and pyrolysis products yields are proportional to the ratio of switchgrass and pine residues in the blended samples. These results indicate that blending different sources of biomass is a promising strategy to produce a consistent feedstock for thermochemical conversion.
Author Contributions
CE performed small-scale pyrolysis (Py-GCMS) experiments and data analysis, assisted in feedstock processing, and prepared and organized the manuscript. ER performed the fluidized-bed pyrolysis reactor experiments and bio-oil characterization. ER, SP, and SK assisted with pyrolysis data interpretation. CH conducted the chemical analysis of the biomass samples. NA and NL organized feedstock harvesting and processing and assisted with manuscript editing. OF and SA performed the physical characterization of the feedstocks. JT contributed discussion toward blending, physical properties, and densification of blended feedstocks. TR is the project director, and SK and NL are principal investigators, and assisted in project planning and experimental design. All authors jointly assisted in manuscript writing and editing.
Conflict of Interest Statement
The authors declare that the research was conducted in the absence of any commercial or financial relationships that could be construed as a potential conflict of interest.
Acknowledgments
This work was completed under the DOE-funded Logistics for Enhanced-Attribute Feedstocks (LEAF) Project, and this material is based upon work supported by the Department of Energy, Office of Energy Efficiency and Renewable Energy (EERE), under Award Number DE-EE0006639. We also acknowledge support from the USDA National Institute of Food and agriculture, Hatch Project 1012359.
Supplementary Material
The Supplementary Material for this article can be found online at: https://www.frontiersin.org/articles/10.3389/fenrg.2018.00079/full#supplementary-material
References
ASTM (2015). ASTM B527-15 Standard Test Method for Tap Density of metal Powders and Compounds. West Conshohocken, PA: ASTM International.
Astner, A. F., Young, T. M., and Bozell, J. J. (2015). Lignin yield maximization of mixed biorefinery feedstocks by organosolv fractionation using Taguchi robust product design. Biomass Bioenergy 73, 209–216. doi: 10.1016/j.biombioe.2014.12.021
Basu, P. (2010). Biomass Gasification and Pyrolysis - Practical Design and Theory. Oxford, UK: Elsevier.
Bernhart, M. E., and Fasina, O. (2009). Physical properties and pyrolysis behavior of fractionated poultry litter. Trans. ASABE 52, 531–538. doi: 10.13031/2013.26810
Carpenter, D., Westover, T. L., Czernik, S., and Jablonski, W. (2014). Biomass feedstocks for renewable fuel production: a review of the impacts of feedstock and pretreatment on the yield and product distribution of fast pyrolysis bio-oils and vapors. Green Chem. 16, 384–406. doi: 10.1039/C3GC41631C
Carpenter, D., Westover, T. L., Howe, D., Deutch, S., Starace, A., Emerson, R., et al. (2017). Catalytic hydroprocessing of fast pyrolysis oils: impact of biomass feedstock on process efficiency. Biomass Bioenergy 96, 142–151. doi: 10.1016/j.biombioe.2016.09.012
Chiaramonti, D., Oasmaa, A., and Solantausta, Y. (2007). Power generation using fast pyrolysis liquids from biomass. Renew. Sustain. Energy Rev. 11, 1056–1086. doi: 10.1016/j.rser.2005.07.008
Couhert, C., Commandre, J. M., and Salvador, S. (2009). Is it possible to predict gas yields of any biomass after rapid pyrolysis at high temperature from its composition in cellulose, hemicellulose and lignin? Fuel 88, 408–417. doi: 10.1016/j.fuel.2008.09.019
Crawford, N. C., Ray, A. E., Yancey, N. A., and Nagle, N. (2015). Evaluating the pelletization of pure and blended lignocellulosic biomass feedstocks. Fuel Process. Technol. 140, 46–56. doi: 10.1016/j.fuproc.2015.08.023
Das, P., Ganesh, A., and Wangikar, P. (2004). Influence of pretreatment for deashing of sugarcane bagasse on pyrolysis products. Biomass Bioenergy 27, 445–457. doi: 10.1016/j.biombioe.2004.04.002
EPA (1996). Microwave Assisted Acid Digestion of Sileceous and Organically Based Matrices, Test Methods for Evaluating Solid Waste. Washington, DC: The US Environmental Protection Agency.
Evans, R. J., and Milne, T. A. (1987). Molecular characterization of the pyrolysis of biomass. 1. fundamentals. Energy Fuels 1, 123–137. doi: 10.1021/ef00002a001
Fahmi, R., Bridgwater, A. V., Donnison, I., Yates, N., and Jones, J. M. (2008). The effect of lignin and inorganic species in biomass on pyrolysis oil yields, quality and stability. Fuel 87, 1230–1240. doi: 10.1016/j.fuel.2007.07.026
Figura, L. O., and Teixeira, A. A. (2007). Food Physics. Physical Properties – Measurement and Applications. Berlin; Heidelberg: Springer-Verlag.
Freel, B., and Graham, R. (1998). Method and Apparatus for a Circulating Bed Transport Fast Pyrolysis Reactor System. U.S. Patent 5,792,340. Ontario, CA: Ensyn Technologies Inc.
Jegers, H. E., and Klein, M. T. (1985). Primary and secondary lignin pyrolysis reaction pathways. Ind. Eng. Chem. Process Des. Dev. 24, 173–183. doi: 10.1021/i200028a030
Kenney, K. L., Smith, W. A., Gresham, G. L., and Westover, T. L. (2013). Understanding biomass feedstock variability. Biofuels 4, 111–127. doi: 10.4155/bfs.12.83
Lehto, J., Oasmaa, A., Solantausta, Y., Kytö, M., and Chiaramonti, D. (2014). Review of fuel oil quality and combustion of fast pyrolysis bio-oils from lignocellulosic biomass. Appl. Energy 116, 178–190. doi: 10.1016/j.apenergy.2013.11.040
Littlefield, B., Fasina, O. O., Shaw, J., Adhikari, S., and Via, B. (2011). Physical and flow properties of pecan shells - particle size and moisture effects. Powder Technol. 212, 173–180. doi: 10.1016/j.powtec.2011.05.011
Lv, D., Xu, M., Liu, X., Zhan, Z., Li, Z., and Yao, H. (2010). Effect of cellulose, lignin, alkali and alkaline earth metallic species on biomass pyrolysis and gasification. Fuel Process. Technol. 91, 903–909. doi: 10.1016/j.fuproc.2009.09.014
Mahadevan, R., Adhikari, S., Shakya, R., Wang, K., Dayton, D., Lehrich, M., et al. (2016b). Effect of alkali and alkaline earth metals on in-situ catalytic fast pyrolysis of lignocellulosic biomass: a microreactor study. Energy Fuels 30, 3045–3056. doi: 10.1021/acs.energyfuels.5b02984
Mahadevan, R., Shakya, R., Adhikari, S., Fasina, O., and Taylor, S. E. (2016a). Fast pyrolysis of biomass: effect of blending southern pine and switchgrass. Trans. ASABE 59, 5–10. doi: 10.13031/trans.59.11385
Mante, O. D., and Agblevor, F. A. (2014). Catalytic pyrolysis for the production of refinery-ready biocrude oils from six different biomass sources. Green Chem. 16, 3364–3377. doi: 10.1039/c4gc00555d
Meng, J., Park, J., Tilotta, D., and Park, S. (2012). The effect of torrefaction on the chemistry of fast-pyrolysis bio-oil. Bioresour. Technol. 111, 439–446. doi: 10.1016/j.biortech.2012.01.159
Mitchell, R. B., Schmer, M. R., Anderson, W. F., Jin, V., Balkcom, K. S., Kiniry, J., et al. (2016). Dedicated energy crops and crop residues for bioenergy feedstocks in the central and eastern USA. Bioenergy Res. 9, 384–398. doi: 10.1007/s12155-016-9734-2
Mohan, D., Pittman, C. U., and Steele, P. H. (2006). Pyrolysis of wood/biomass for bio-oil: a critical review. Energy Fuels 20, 848–889. doi: 10.1021/Ef0502397
Patwardhan, P. R., Satrio, J. A., Brown, R. C., and Shanks, B. H. (2010). Influence of inorganic salts on the primary pyrolysis products of cellulose. Bioresour. Technol. 101, 4646–4655. doi: 10.1016/j.biortech.2010.01.112
Perlack, R. D., and Stokes, B. J. (2011). US Billion-ton Update. Biomass Supply for a Bioenergy and Bioproducts Industry. Oak Ridge, TN: United States Department of Energy.
Ray, A. E., Li, C., Thompson, V. S., Dayna, L., Daubaras, D. L., Nagle, N. J., et al. (2017). “Biomass blending and densification: impacts on feedstock supply and biochemical conversion performance,” in Biomass Volume Estimation and Valorization for Energy, ed J. S. Tumuluru, (InTech Open), 341–359.
Ren, X., Meng, J., Chang, J., Kelley, S. S., Jameel, H., and Park, S. (2017). Effect of blending ratio of loblolly pine wood and bark on the properties of pyrolysis bio-oils. Fuel Process. Technol. 167, 43–49. doi: 10.1016/j.fuproc.2017.06.025
Shi, J., Thompson, V. S., Yancey, N. A., Stavila, V., Simmons, B. A., and Singh, S. (2013). Impact of mixed feedstocks and feedstock densification on ionic liquid pretreatment efficiency. Biofuels 4, 63–72. doi: 10.4155/bfs.12.82
Sluiter, A., Hames, B., Ruiz, R., Scarlata, C., Sluiter, J., and Templeton, D. (2008). Determination of Ash in Biomass, Laboratory Analytical Procedure (LAP) NREL/TP-510-42622. Golden, CO: Office of Energy Efficiency and Renewable Energy, Department of Energy.
Sluiter, A., Hames, B., Ruiz, R., Scarlata, C., Sluiter, J., Templeton, D., et al. (2010). Determination of Structural Carbohydrates and Lignin in Biomass: Laboratory Analytical Procedure (LAP); NREL/TP-510-42618. Golden, CO: National Renewable Energy Laboratory.
Stelte, W., Holm, J. K., Sanadi, A. R., Barsberg, S., Ahrenfeldt, J., and Henriksen, U. B. (2011). A study of bonding and failure mechanisms in fuel pellets from different biomass resources. Biomass Bioenergy 35, 910–918. doi: 10.1016/j.biombioe.2010.11.003
Sultana, A., and Kumar, A. (2011). Optimal configuration and combination of multiple lignocellulosic biomass feedstocks delivery to a biorefinery. Bioresour. Technol. 102, 9947–9956. doi: 10.1016/j.biortech.2011.07.119
Tanger, P., Field, J. L., Jahn, C. E., Defoort, M. W., and Leach, J. E. (2013). Biomass for thermochemical conversion: targets and challenges. Front. Plant Sci. 4:218. doi: 10.3389/fpls.2013.00218
Thompson, D. N., Campbell, T., Bals, B., Runge, T., Teymouri, F., and Ovard, L. P. (2013). Chemical preconversion: application of low-severity pretreatment chemistries for commoditization of lignocellulosic feedstock. Biofuels 4, 323–340. doi: 10.4155/bfs.13.15
Thompson, V. S., Lacey, J. A., Hartley, D., Jindra, M. A., Aston, J. E., and Thompson, D. N. (2016). Application of air classification and formulation to manage feedstock cost, quality and availability for bioenergy. Fuel 180, 497–505. doi: 10.1016/j.fuel.2016.04.040
Tröger, N., Richter, D., and Stahl, R. (2013). Effect of feedstock composition on product yields and energy recovery rates of fast pyrolysis products from different straw types. J. Anal. Appl. Pyrolysis 100, 158–165. doi: 10.1016/j.jaap.2012.12.012
Tumuluru, T. S., Hess, J. R., Boardman, R. D., Wright, C. T., and Westover, T. L. (2012). Formulation, pretreatment, and densification options to improve biomass specifications for co-firing high percentages with coal. Industr. Biotechnol. 8, 113–132. doi: 10.1089/ind.2012.0004
Tumuluru, Y. S., Wright, C. T., Hess, J. R., and Kenney, K. L. (2011). A review of biomass densification systems to develop uniform feedstock commodities for bioenergy application. Biofuels Bioprod. Biorefining 5, 683–707. doi: 10.1002/bbb.324
U. S. Department of Energy (2016). Billion-Ton Report: Advancing Domestic Resources for a Thriving Bioeconomy. Vol. 1. Economic Availability of Feedstocks.
Vassilev, S. V., Baxter, D., Andersen, L. K., and Vassileva, C. G. (2010). An overview of the chemical composition of biomass. Fuel 89, 913–933. doi: 10.1016/j.fuel.2009.10.022
Vera, R. M., Bura, R., and Gustafson, R. (2015). Synergistic effects of mixing hybrid poplar and wheat straw biomass for bioconversion processes. Biotechnol. Biofuels 8:226. doi: 10.1186/s13068-015-0414-9
Wolfrum, E. J., Nagle, N. J., Ness, R. M., Peterson, D. J., Ray, A. E., and Stevens, D. M. (2017). The effect of biomass densification on structural sugar release and yield in biofuel feedstock and feedstock blends. BioEnergy Res. 10, 478–487. doi: 10.1007/s12155-017-9813-z
Yancey, N. A., Tumuluru, J. S., and Wright, C. T. (2013). Drying, grinding and pelletization studies on raw and formulated biomass feedstock's for bioenergy applications. J. Biobased Mater. Bioenergy 7, 549–558. doi: 10.1166/jbmb.2013.1390
Keywords: fast pyrolysis, biofuels, biomass, ash content, yield, inorganic metals
Citation: Edmunds CW, Reyes Molina EA, André N, Hamilton C, Park S, Fasina O, Adhikari S, Kelley SS, Tumuluru JS, Rials TG and Labbé N (2018) Blended Feedstocks for Thermochemical Conversion: Biomass Characterization and Bio-Oil Production From Switchgrass-Pine Residues Blends. Front. Energy Res. 6:79. doi: 10.3389/fenrg.2018.00079
Received: 11 April 2018; Accepted: 20 July 2018;
Published: 17 August 2018.
Edited by:
Gordon Graham Allison, Aberystwyth University, United KingdomReviewed by:
Selhan Karagoz, Karabük University, TurkeyTianju Chen, Qingdao Institute of Bioenergy and Bioprocess Technology, Chinese Academy of Sciences (CAS), China
Copyright © 2018 Edmunds, Reyes Molina, André, Hamilton, Park, Fasina, Adhikari, Kelley, Tumuluru, Rials and Labbé. This is an open-access article distributed under the terms of the Creative Commons Attribution License (CC BY). The use, distribution or reproduction in other forums is permitted, provided the original author(s) and the copyright owner(s) are credited and that the original publication in this journal is cited, in accordance with accepted academic practice. No use, distribution or reproduction is permitted which does not comply with these terms.
*Correspondence: Charles W. Edmunds, cedmund1@utk.edu
Nicole Labbé, nlabbe@utk.edu