
95% of researchers rate our articles as excellent or good
Learn more about the work of our research integrity team to safeguard the quality of each article we publish.
Find out more
ORIGINAL RESEARCH article
Front. Energy Res. , 04 July 2018
Sec. Electrochemical Energy Storage
Volume 6 - 2018 | https://doi.org/10.3389/fenrg.2018.00059
This article is part of the Research Topic In-situ and In-operando Techniques for Material Characterizations during Battery Operation View all 12 articles
For the development of next-generation batteries it is important to understand the structural changes in electrodes under realistic non-equilibrium conditions. With microbeam X-ray diffraction it is possible to probe many individual electrode grains concurrently under non-equilibrium conditions in realistic battery systems. This makes it possible to capture phase transformation behavior that is difficult or even impossible with powder diffraction. By decreasing the X-ray beam size, the diffraction powder rings fall apart in the (hkl) reflections belonging to individual electrode crystallites. Monitoring these reflections during (dis)charging provides direct insight in the transformation mechanism and kinetics of individual crystallite grains. Here operando microbeam diffraction is applied on two different cathode materials, LiFePO4 (LFP) displaying a first-order phase transformation and LiNi1/3Co1/3Mn1/3O2 (NCM) displaying a solid solution transformation. For LFP four different phase transformation mechanisms are distinguished within a single crystallite: (1) A first-order phase transformation without phase coexistence, (2) with phase coexistence, (3) a homogeneous solid solution phase transformation and (4) an inhomogeneous solid solution crystal transformation, whereas for NCM only type (3) is observed. From the phase transformation times of individual crystallites, the local current density is determined as well as the active particle fractions during (dis)charge. For LFP the active particle fraction increases with higher cycling rates. At low cycling rates the active particle fraction in NCM is much larger compared to LFP which appears to be related to the nature of the phase transition. In particular for LFP the grains are observed to rotate during (dis)charging, which can be quantified by microbeam diffraction. It brings forward the mechanical working of the electrodes due to the volumetric changes of the electrode material possibly affecting electronic contacts to the carbon black conducting matrix. These results demonstrate the structural information that can be obtained under realistic non-equilibrium conditions, combining local information on single electrode crystallites, as well as global information through the observation in many crystallites concurrently. This provides new and complementary possibilities in operando battery research, which can contribute to fundamental understanding as well as the development of electrodes and electrode materials.
Li-ion batteries have driven the development of today's portable electronics and electrical vehicles. More generally, next-generation electrochemical storage is expected to be a key technology for our renewable energy future, including large scale introduction of electrical mobility and lifting the difference between supply and demand of renewable energy sources. This puts significant pressure on the development of battery chemistries, which requires comprehensive atomic scale understanding of electrochemical processes. A crucial aspect for many battery chemistries is the formation, decomposition and transformation of electrochemically active crystalline phases, which typically determine a battery's cycle life, practical capacity and kinetic performance. To understand these structural processes, powder diffraction experiments are applied intensively (Harks et al., 2015; Ma et al., 2016). With ex-situ experiments non-equilibrium states and processes are not captured, and often the reactivity of the components during the process toward ex-situ measurements hinder the observation of the true equilibrium state. As a consequence there is a strong demand to do operando structural investigations, that is to perform diffraction during battery charging and discharging.
Operando powder diffraction, both neutron and X-ray (Harks et al., 2015; Ma et al., 2016; Lin et al., 2017; Peterson et al., 2017; Tan et al., 2017) have contributed to the understanding of the solid state reactions taking place in batteries. Powder diffraction provides average structural properties over a large ensemble of electrode crystallites present in realistic electrodes. This inevitably obscures the transformation mechanism of individual electrode crystallites and how these collectively contribute to the macroscopic phase transition, which is key information for thoroughly understanding the relation between materials properties and the performance of battery electrodes. The potentially (dis)charge rate dependent transformation mechanisms of individual crystallites provides insight in the electrode material cycle life and what limits the (dis)charge rate of the material. The collective behavior of many individual electrode particles provides insight in how the total battery current is distributed over the individual grains, potentially creating detrimental hotspots. An inhomogeneous current distribution enhances local electrolyte decomposition and overcharge behavior, making the lifetime shorter and the safety lower (Kerlau et al., 2007; Maire et al., 2008; Katayama et al., 2014; Taminato et al., 2016; Tanida et al., 2016).
Recently, operando microbeam diffraction has been introduced, which is able to probe the phase transformation of many individual electrode grains in realistic battery systems under non-equilibrium battery conditions (Zhang et al., 2015; Ganapathy et al., 2016; Niwa et al., 2017). By reducing the X-ray beam size to micron scale, fewer crystallites will be in Bragg condition and as a result diffract. As a consequence, the powder diffraction rings fall apart in single crystal reflections, each originating from a single electrode crystallite. Along operando experiments on two types of electrodes, (1) LiFePO4 and (2) LiNi1/3Co1/3Mn1/3O2, we demonstrate the principle, data analysis and interpretation, and hence the information that can be extracted from operando microbeam diffraction. These experiments reveal various crystal transformation mechanisms as well as the transformation times of individual crystallites, occurring concurrently in the many crystallites that are monitored. In addition this brings forward the active particle fraction and also the mechanically induced rotations of the electrode crystallites in the electrode matrix providing new insights in the working of electrodes. The non-invasive nature of these operando microbeam experiments, provides the ability to obtain more understanding of the structural transformations in realistic battery electrodes, that will help understanding the fundamental processes that determine the performance of batteries.
The starting material is carbon coated LiFePO4 from Phostech with an average particle size of 140 nm. Regular LiFePO4 cathodes were prepared through mixing a slurry of LiFePO4, Carbon Black (Super P), PVDF, (polyvinylidene fluoride, Solvay) in NMP (N-methylpyrrolidone), with a mass ratio of the active material (LiFePO4), carbon black (SuperP) and binder (PVDF) of 75:15:10. In addition carbonate template electrodes were prepared to reach high capacities at high rates as reported recently (Singh et al., 2013). For the electrodes, 40 wt% NaHCO3 (Aldrich) is added to the electrode slurry mixing, a large part of which is lost by dissolution in the solvent. The final slurry was casted on carbon coated Aluminium current collectors by doctor blading. The coatings were dried on a heater plate under air at approximately 155°C overnight followed by drying under vacuum at around 60°C for more than 24h. The resulting coatings were pressed using a roller hand press to enhance the electronic contact. After mechanical compaction the NaHCO3 templated electrodes were washed in demineralized water that reacts with the NaHCO3 to form NaOH and gaseous CO2, resulting in a an electrode where the interconnectivity of the porosity in the electrodes is improved as demonstrated previously (Singh et al., 2013). Finally, the electrodes are dried for at least 3h under vacuum at 100°C. The results are reported on electrodes with loading density between 2 and 4 mg/cm2 and with a thickness of approximately 10–20 μm. For preparing the LiNi1/3Co1/3Mn1/3O2 cathodes the same method with ratio, 80:10:10, of active material, Carbon Black and PVDF were used. No templating was applied.
The electrodes were assembled in coffee-bag type cells all assembled under argon atmosphere (<0.1 ppm O2/H2O). The electrodes were separated by glass microfiber filters (Whatman) with a few droplets of 1 mol/liter LiPF6 (EC:DMC 1:1, Novolyte) electrolyte.
At the European Synchrotron Radiation Facility in Grenoble, France the operando microbeam X-ray experiments were conducted at beamline ID11. For the LiFePO4 experiments using a combination of beryllium and aluminum mirrors a monochromatic X-ray microbeam with an energy of 45 keV (wavelength 0.27552 Å) and a beam size of ~2x3μm was configured. For NCM an energy of 42 keV (wavelength 0.29519 Å) and a beam-size of ~8x8μm was used (NCM crystallites are ~1−2 μm in size). Figure 2 shows a schematic experiment setup where the X-ray beam transmits through two layers of Al, the cathode material of interest, the solipor separator soaked in EC/DMC electrolyte, a disc of Li-metal and two layers of Cu. All the electrochemical tests were performed galvanostatically within a voltage window of 4.3 and 2.5 V vs. Li/Li+ for the LiFePO4 electrodes and of 4.3 and 3.0 V vs. Li/Li+ for the NCM electrodes using an Autolab PGSTAT302N potentiostat/galvanostat.
With microbeam X-ray diffraction it is possible to follow reflections of individual grains over time. Initial beam exposure tests were conducted to make sure that the material, electrode and electrolyte do not decompose/degrade. As an additional measure the sample was moved between two points after each omega scan, to spread the beam exposure. In Table 1 an overview of the experiment details is provided. For the LFP 1C experiment, with C/n denoting the rate at which a full charge or discharge takes n hours, an omega scan from –2.5 to 2.5 degrees was performed, hence the sample was rotated along the z-axis in ten steps of each half a degree (see Figure 1 for the experiment geometry). Each rotation step of half a degree takes 5 s, which is also the frame exposure time. As a result the average temporal resolution for individual omega scans is 13.5 s and for a complete omega scan 135 s. By monitoring the intensity of the reflection during the omega scan, it is possible to derive the direction and speed of the grain rotation, and when the omega scan completely crosses the reflection of the individual grain, its grain volume can be determined, see supplement of Zhang et al. (2015).
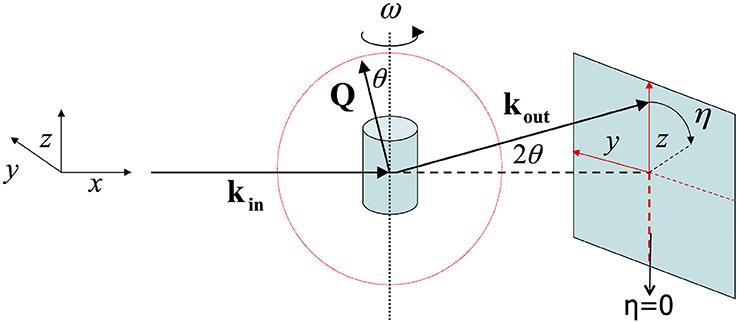
Figure 1. In the geometry of 2D X-ray diffraction the X-ray beam lies along the x-axis. ω reflects the angle with which the sample is rotated along the z-axis. And η is the angle along the diffraction ring.
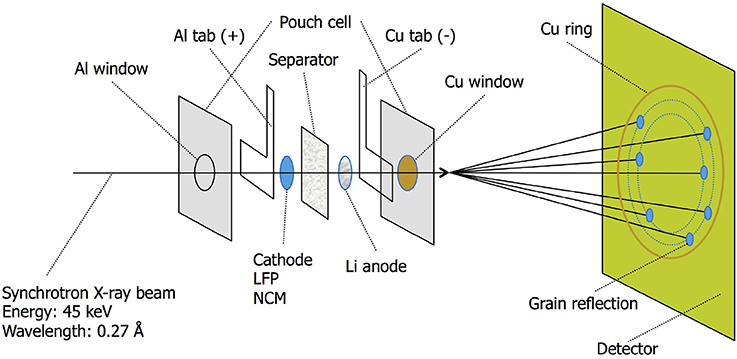
Figure 2. ID11 X-ray synchrotron beamline passing through the various layers of the pouch cell. The microbeam causes the diffraction ring to break up in spots originating from single electrode grains.
Each reflection is indexed based on its 2Θ angle and its position on the diffraction ring, defined by its η angle along this ring. In addition the size and the total intensity of each reflection is determined. Figure 3 shows an EDF (ESRF Data Format) frame that was collected during the experiment. It records the intensity of each of the 2,048 × 2,048 pixels of the detector. The X-ray beam is small enough for the diffraction rings to break up in individual grain reflections. The Al and Cu layers show up as strong rings in the corners. In Table S1 the reflections of a few grains and their properties are listed. To identify and follow grain reflections over time Matlab®; was used to process the experiment data consisting of the collected EDF frames for each experiment. Three steps were followed: (1) finding grain reflections per frame, (2) labeling grain reflections in different frames and (3) add meta data which includes the number of reflections, initial, minimum and maximum 2Θ values. The reflections gathered in step (1) make it possible to break down the reflections according to hkl index. In Figure S1 the average number of reflections per frame per hkl is shown. Connecting the reflections occurring in different frames, step (2), is the most challenging to automate. Here the approach was chosen to start with a reflection from the first frame and to look for reflections in subsequent frames that have the same hkl and fall within a certain η range (a certain section of the diffraction ring). This process is repeated until all reflections are labeled. The last step is to add meta data including number of reflections, min/max 2Θ, η and ω angles. In Table S2 a few labels and their meta data are shown. The integrated intensity of a reflection can be used to derive the crystal volume (Zhang et al., 2015). After determining the incident flux of photons Φ0 from the intensity of a powder ring of your material of interest it is possible to directly calculate the crystal volume from the observed reflection intensity, see Zhang et al. (2015) supplement note 3 for a detailed explanation.
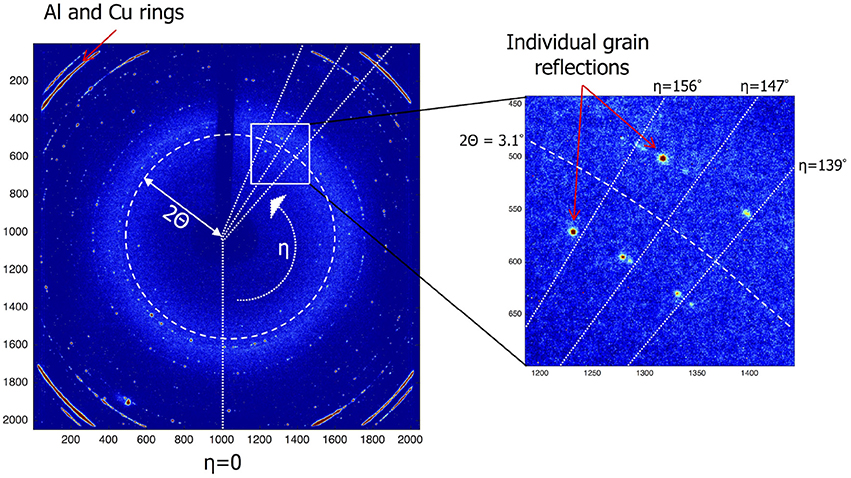
Figure 3. Sample of an EDF Frame which is a read-out of the detectors 2,048 × 2,048 pixels. The location of each grain reflection is a unique combination of the polar coordinates η and 2Θ. Using the 2Θ angle the miller index can be derived. The η angle can be used to find reflections of the same grain in subsequent frames.
Reduction of the X-ray beam size toward micron size makes that fewer crystallites are in Bragg condition. As a consequence, the powder diffraction rings fall apart in single crystal reflections, each originating from a single electrode crystallite. By performing microbeam X-ray diffraction during battery operation it is possible to track many individual reflections concurrently during a charge/discharge cycle. In Figure 4 the number of LiFePO4 (LFP) and FePO4 (FP) crystallites are shown as a function of time during a full 1C charge discharge cycle. The decreasing amount of observed LFP domains, and increasing FP domains during charge, and vice versa during discharge reflects the expected first-order phase transition of this material upon lithium extraction and insertion. However, to gain insight how this proceeds within single grains we can monitor individual reflections. Here we discuss experiment data obtained from three LFP experiments with C-rates 1C, 5C and 10C, and one NCM C/4 experiment. Details on the charge/discharge regime as well as material loading and Coulombic efficiency for of each of these experiments are given in Table S3.
In presenting the results it is useful to first look at compounded data where frames belonging to the same ω scan are added up and averaged (see frame numbers in brackets in Table 1). In Figure 5A the (200) reflection of an LFP grain is shown at various states of charge. During charge both LFP and FP phases are visible between t = 18–55 min. A first observation is the stretched shape of the reflection along the diffraction ring. Where broadening in the 2Θ directions relates to the crystallite domains size and strain, in this case perpendicular to the (200) lattice plain direction, the distribution of intensity over η suggests mosaicity in the a-lattice direction for both the LFP and FP domains. The intensity of the LFP phase reflection decreases while at the same time that of the FP phase is growing, clearly representing the well-known phase transition, but in this case monitored operando for an individual crystallite electrode particle. During this 1C experiment the LFP-FP phase transition in this specific grain takes around 37 min, 62% of total charging time. From the intensity of the reflections it is possible to approximate the volume of the grain (see 2.4), and thereby the phase-volume transition-rate. This allows us to calculate the current this individual grain is contributing, and hence the local current density. After the complete transformation from LFP to FP during charging, discharging is initiated at t = 95 min. As expected the intensity of the FP reflection weakens, but also moves along the η angle. After t = 146 min the reflection completely disappears, and the LFP reflection does not reappear. In Figure S3, which shows the omega sensitive data for this reflection, we can see that the FP domain remains within the visible omega range. This makes it reasonable to assume that the FP domain is shrinking but at the same that the LFP domain that is forming is not in Bragg condition (perhaps the phase transition to LFP causes a rotational shift) and therefore not visible. At first η slightly increases from 47.5 to 48.5 deg (indicating a counter clockwise rotation along the x-axis). At t = 60 min, at the end of constant-current charge, η steadily decreases to 45 deg, evidence of a clockwise rotation. In reality the effective rotation of this grain is a combination of rotations along all three axis. Especially rotation along the y-axis will bring the grain out of Bragg condition resulting in decreasing intensity, which is what seems to happen for this particular grain after t = 60 min. These observations imply that LiFePO4 grains embedded in the electrode matrix are rotating during (dis)charging, as will be quantified and discussed below. In Figure 5B a (020) reflection is shown, representing another LFP grain, again during a 1C charge/discharge cycle. This grain displays only very limited rotation along the x-axis (<1° in variation for the η angle). However, the steadily increasing intensity suggests that it rotates along the y-axis into the Bragg condition. The transformation toward FP takes only 9 min, between t = 65 – 74 min (15% of total charging time) and is not complete as at t = 74 min the LFP phase remains vaguely visible. Upon discharge, starting at t = 98 min, the transformation back from FP to LFP is very different because in this case significant intensity appears between the reflections that represent the FP and LFP end-member phases. This implies that the individual grain upon discharge has a distribution of b-lattice parameters, most likely indicating that part of the material has an intermediate Li composition as has been observed for the average behavior under high rate conditions (Orikasa et al., 2013; Zhang et al., 2014; Li et al., 2017) and in individual crystallites by microbeam diffraction previously (Zhang et al., 2015). Surprisingly however, is that this is observed at 1C rate, where the rate induced solid solution behavior has not been observed, and that it occurs on discharge (lithiation) and not on charge. This non-symmetric behavior is in line with the composition dependence of the charge transfer rate constants, and lithiation/delithiation behavior of large individual crystallites investigated with STXM nano-imaging (Bai et al., 2016). Such behavior will not be observed with powder diffraction experiments, as the deviating behavior of a few grains will be masked by the bulk of the transformation. Surprisingly, even 30 min after constant-current discharge is succeeded by constant-voltage discharge (V = 2.5 V), the intensity profile has barely changed, indicating that part of this crystallite is stuck in this solid solution state, which typically relaxes away quickly when no current is applied (Orikasa et al., 2013; Zhang et al., 2014; Li et al., 2017). The average 2Θ angle of the reflection at and after t = 150 min is around 5.35°, well above the equilibrium value of 5.25° for the LFP (020) reflection. Currently there appears no framework to understand this condition, unless the present solid solution phase observed represents an extensive diffuse interface between the end-member phases. Detailed analysis of these observations is outside the scope of this work and will be the subject of follow-up publications. In the 5C and 10C experiments in Figure 6 the 2Θ profile at the end of discharge also indicates a rate induced solid solution transformation. In the 5C experiment however, the FP-LFP crystal transformation (during discharge) is more homogeneous showing no significant intensity of the end-member reflections, which points to a more homogeneous change in the a-lattice parameter within this single crystallite. In line with earlier findings, this demonstrates that rate induced solid solution transformation takes place in individual grains (Zhang et al., 2015). Where the integrated intensity of the 10C grain is rather constant during the charge discharge cycle, the integrated intensity of the reflection followed in the 5C experiment shows a significant drop at the end of charge during the constant-voltage regime (V = 4.2). This reflection is observed at η = 275°, which is around the equator (η = 90 or η = 270°). Reflections observed around the equator will move out of Bragg condition when they rotate along ω (the z-axis). In this 5C experiment the sample is only rotated for one degree ω. If a larger ω rotation was used it would have been possible to record similar integrated intensities for neighboring omegas. The small omega range chosen here is a trade-off against better capturing the transformation dynamics of grain reflections that do stay in Bragg condition.
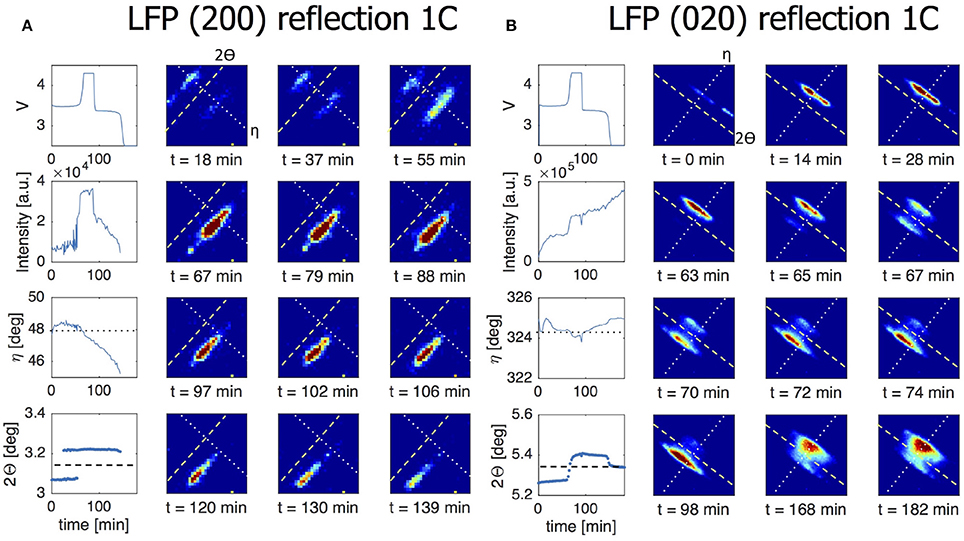
Figure 5. The line charts in the left most column of both figures show from top to bottom the voltage of the battery, the intensity of the grain reflection, the change in the η angle and the change in the 2Θ angle for this particular grain reflection. All for a 1C charge/discharge cycle. The dotted line in the η graph corresponds to the dotted line shown in the 2D plots. The dashed line in the 2Θ graph corresponds to the dashed line in the 2D plots. (A) Direct view on a (200) reflection of an LFP grain during a 1C constant-current experiment. At t = 18 min both LFP and FP phases are visible, indicating phase coexistence occurs in this particular grain. The LFP phase is is visible from t = 0 – 55 min and the FP phase is visible from t = 18 – 146 min. (B) Here a (020) grain reflection is tracked during a 1C experiment. The phase transition from LFP to FP at the end of charge is not complete as some intensity is still visible for LFP. At the end of discharge clear solid solution behavior is on display where this grain never fully transitions back to LFP.
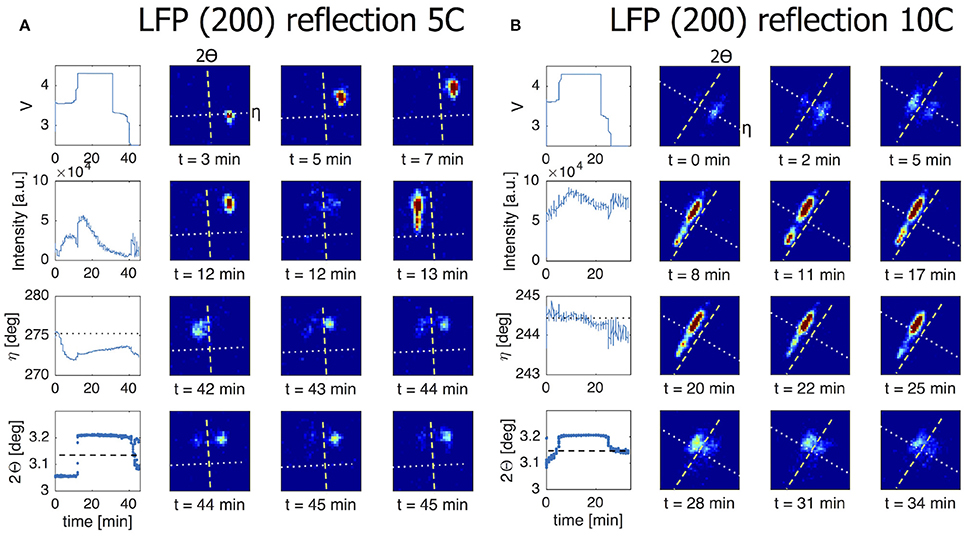
Figure 6. The line charts in the left most column of both figures show from top to bottom the voltage of the battery, the intensity of the grain reflection, the change in the η angle and the change in the 2Θ angle for this particular grain reflection. All for a 5C/10C charge/discharge cycle. The dotted line in the η graph corresponds to the dotted line shown in the 2D plots. The dashed line in the 2Θ graph corresponds to the dashed line in the 2D plots. (A) The (200) reflection in this 5C experiment shows significant η movement at the beginning of charge. This continues until LFP-FP phase transition takes place without phase coexistence and within 2 min. During the transition back from FP to LFP the a-lattice is changing in a homogeneous way although a part of the crystallite remains in the FP phase. The observed decrease in integrated intensity during the upper voltage hold is likely caused by the grain rotating out of Bragg condition. Since this reflection is seen around the equator (η = 90 or η = 270) a rotation along the z-axis will remove the Bragg condition. (B) In a 10C experiment we are following a (200) reflection. At t = 5 min there is clear phase coexistence during the LFP-FP phase transition. At the FP-LFP phase transition the intensity is spread and this grain remains inhomogeneous for the a-lattice well after discharging has stopped.
Where LiFePO4 is known to display a first-order phase transition upon charge and discharge which is driven toward a complex solid solution reaction a larger currents, LiNi1/3Co1/3Mn1/3O2 (NCM) displays a solid solution transformation even near equilibrium conditions. In Figure 7A the (108) reflection of an individual NCM grain is monitored during C/4 charge/discharge experiment. The gradual change in battery voltage during charge and discharge, reflects the well-known solid solution reaction of NCM. Consistently, the (108) reflection gradually shifts, representing a gradual change in d-spacing of the (108) plane within a single grain. 2Θ is decreasing in line with the increase in c-lattice parameter upon charging (delithiation) (Yin et al., 2006). Upon discharge, the reflection moves reversibly back toward the position associated with the lithiated state. The observed solid solution transformation within a single NCM grain takes the complete charge and discharge time. This is the case for all transforming grains (see Figure S2), signifying that the current is distributed equally over all grains for this material during the course of the complete cycle. This in contrast to the LiFePO4 grains that (de)intercalate for only part of the cycle, indicating more localized transformations. In Figure 7B the (110) reflection of another NCM grain consistently shows the gradual shift, in this case toward larger 2Θ angles upon charging (delithiations), a consequence of the decreasing a and b lattice parameters. Both the intensity and the η angle are stable throughout the cycle which implies that this particular grain does not rotate along the y and x-axis, respectively.
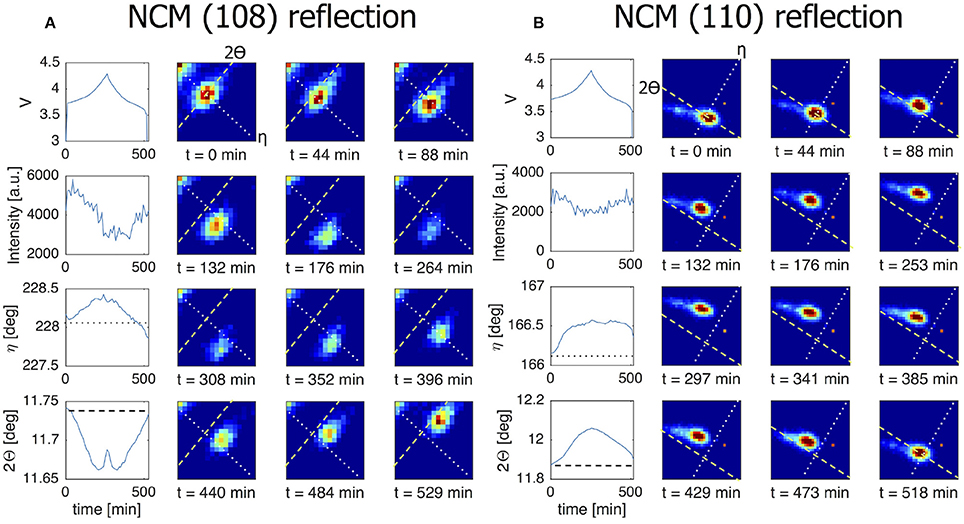
Figure 7. The line charts in the left most column of both figures show from top to bottom the voltage of the battery, the intensity of the grain reflection, the change in the η angle and the change in the 2Θ angle for this particular grain reflection. All for a C/4 charge/discharge cycle. The dotted line in the η graph corresponds to the dotted line shown in the 2D plots. The dashed line in the 2Θ graph corresponds to the dashed line in the 2D plots. (A) NCM (108) reflection that is active throughout the charge/discharge cycle. Here the 2Θ profile reveals the solid solution nature of the material. (B) This (110) reflection also perfectly follows the electrochemistry. The intensity practically does not change throughout the cycle pointing to a constant crystal volume.
These results demonstrate that microbeam X-ray diffraction can be used to distinguish different phase transformation mechanisms taking place in an individual crystallites. LiFePO4 grains display four different mechanisms, and only one type is observed in NCM grains: (1) A phase transition without phase coexistence, LFP-FP in Figure 6A, (2) A phase transition with phase coexistence, LFP-FP in both Figures 5A,B, (3) solid solution phase transition where the grain remains homogeneous in structure, Figure 7 and (4) solid solution phase transition with an inhomogeneous crystal lattice, FP-LFP in Figure 5B. With X-ray powder diffraction, it is hard to deconvolute the contribution of the different phase transition types to the observed intensity between the end member states, as noted in Liu et al. (2014). Microbeam diffraction enables this distinction through the ability to monitor individual grains, which compared to microscopic techniques has the advantage that this can be done for many crystallites at the same time under realistic battery conditions.
By following the individual reflections during (dis)charge, as shown in Figures 5–7, of the LiFePO4 and NCM individual crystallites, their phase transformation rates can be determined. From the intensity it is possible to approximate the volume of the observed domains, which, in combination with the transformation rate, results in the local current exposed to a single electrode grain. Through the average transformation times of many individual grains the active grain fractions can be determined, as well as the average local current density over the actively transforming grains.
This is hard to determine by other techniques, in particular under operando conditions, and has previously been performed ex-situ at for instance 50% state of charge (Li et al., 2014; Bai et al., 2016). Using microbeam diffraction this was recently reported as a function of charge rate for LiFePO4 (Zhang et al., 2015), as shown in Figure 8. As observed, at low charging rates the active particle fraction is low. The increasing current, associated with the increasing charge rate, is realized by increasing the active particle fraction, and to a lesser extent by increasing the average local current density at individual electrode grains. For LFP we determined the active particle fraction for 1C, 5C, and 10C rate experiments by assessing which fraction of the observed particles was active. This resulted in active particle fractions of approximately 24, 29, and 36% for 1C, 5C, and 10C during the constant-current regime, respectively, in good agreement with the results shown in Figure 8. For the NCM C/4 charging/discharging experiment shown in Figure 7 the average transformation time during charge is ~ 232 min and during discharge is ~199 min, resulting in an overall active particle fraction of ~80%, which is much larger than observed for LiFePO4 at similar (and even higher) charging rates. In the first place charge transport of both electrons and Li-ions is expected to determine the active particle fraction (and hence the inhomogeneity of the reactions) in an electrode. The charge transport depends on many factors including the electrode configuration, porosity, thickness, amount and distribution of conductive additive and the current rate (Kerlau et al., 2007; Maire et al., 2008; Liu et al., 2010; Fleckenstein et al., 2011; Mima et al., 2012; Nishi et al., 2013; Katayama et al., 2014; Taminato et al., 2016). However, another interesting factor is the nature of the phase transition, either being solid solution, as occurring in NCM, or a first-order phase transition, such as occurring in LFP at low rates. Compositional differences in electrodes that display a solid solution reaction should be expected to be leveled based on the difference in electrochemical potential, whereas there is no electrochemical driving force to level the difference in local state of (dis)charge in first-order phase transition electrodes, as observed experimentally (Tanida et al., 2016). As a consequence solid solution materials are expected to result in more homogeneous reactions throughout the electrodes, and therefore also in a larger active particle fraction as compared to first-order phase transition electrode materials. This may provide a rational for the larger active particle fraction observed for NCM as compared to LFP at low charging rates, where charge transport induced inhomogeneities are less likely to be dominant.

Figure 8. (A) Active fraction and current density of the particles resulting from the average transformation times. (B): Sketch of the rate-dependent transformation upon charge as follows from the microbeam diffraction experiments (similar upon discharge only with a smaller active particle fraction, see A). This figure is reproduced from (Zhang et al., 2015) and licensed by CC-BY.
In 3.1 we used compounded data where grain data of a complete omega scan is averaged. When looking at the omega sensitive data it is possible to detect grain rotation along the z-axis. Figure 9A shows the intensity of the LFP (020) reflection as function of time and omega. The shift in ω = −2.25 to 0.25 implies that this grain is turning around its z-axis by about 2.5° in total. Also taking into account the change in η the total grain rotation can be calculated, the result of which is shown in Figure 9B. (See equation S1 in the Supplement for details on how the total grain rotation is estimated). The ability of microbeam diffraction to monitor the crystallite rotations during (dis)charging provides the opportunity to consider the mechanical working in electrodes, most likely induced by the volumetric changes of the grains itself upon lithium insertion and extraction. It has been shown that the local electron transport between the electrode particles and the carbon black network can be rate limiting, strongly depending on the electronic percolation, homogeneity of the electronic network and the electrode particle size (Awarke et al., 2011; Li et al., 2014). The observed rotations may introduce another factor in the electronic transport, as it may lead to fluctuations in the electronic contact with the carbon black matrix. The observed grain rotation can not be attributed to the experiment set up (e.g., beam energy transfer) as it is not observed when the battery is only exposed to the X-ray beam and no current is applied. Furthermore, not all observed grains rotate during the charge/discharge regime. At this stage very little knowledge exists on these phenomena, where microbeam diffraction may play an important role in the future.
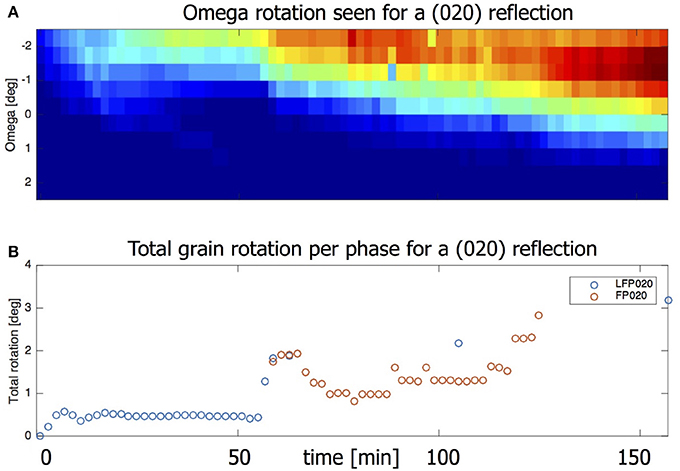
Figure 9. (A) Heat map showing the omegas for which this is reflection is visible. Intensity first appears for ω = –2.5. At the end intensity is strongest for ω = –1 but is visible all the way to ω = 0.5. (B) The omega rotation taken together with the eta movement gives the total grain rotation.
With microbeam diffraction it is possible to investigate the transformation behavior of individual electrode grains while they are being cycled in a realistic battery system. For LiFePO4, a first-order phase transition material, this is demonstrated by four different transformation mechanisms from LiFePO4 to FePO4 and vice versa. Tracking individual LiNi1/3Co1/3Mn1/3O2 crystallites displays the expected solid solution transformation mechanism, revealing that almost all grains actively participate during the charge/discharge cycle. In comparison with LFP where a much smaller part of the grains is active, this indicates a relation between the homogeneity of the reaction and the phase transformation mechanism. The more localized transformations in LFP electrodes also result in considerable rotations of the grain, most likely due to the local volumetric changes, which may influence the local electronic contact of the grains. Microbeam diffraction makes it possible to directly monitor changes in the crystal phase volume, derived from the reflection intensity, which quantifies the local current. This provides insight in how the total current is distributed over the electrodes depending on the (dis)charging conditions, which is an important parameter that determines the cycle life. Microbeam diffraction is a non-invasive technique, allowing to monitor up to a few hundred grains concurrently with a temporal resolution of a few seconds. Thereby it offers the possibility to obtain better understanding on the transformation mechanics and kinetics in Li-ion electrodes and battery electrodes in general.
The dataset generated while analyzing the grain diffraction data can be found in the 4TU. Centre for Research Data with this link. Here you will find the complete dataset as presented in Tables S1 and S2. The grain diffraction data itself, collected during the ESRF experiments, is not included in this dataset.
MvH and MW wrote the manuscript, MvH processed and analyzed the data, MvH and FO prepared the electrodes and the pouch cell batteries, MvH, FO, MW, and JW performed the experiments at the ESRF beamline.
The research leading to these results has received funding from the European Research Council under the European Union's Seventh Framework Programme (FP/2007–2013)/ERC Grant Agreement n. [307161] of MW.
The authors declare that the research was conducted in the absence of any commercial or financial relationships that could be construed as a potential conflict of interest.
We acknowledge the European Synchrotron Radiation Facility for provision of synchrotron radiation facilities and thank the beamline staff for assistance in using beamline ID11.
The Supplementary Material for this article can be found online at: https://www.frontiersin.org/articles/10.3389/fenrg.2018.00059/full#supplementary-material
Awarke, A., Lauer, S., Pischinger, S., and Wittler, M. (2011). Percolation–tunneling modeling for the study of the electric conductivity in LiFePO4 based Li-ion battery cathodes. J. Power Sources 196, 405–411. doi: 10.1016/j.jpowsour.2010.07.048
Bai, P., Cogswell, D. A., Liu, X., Jin, N., Yu, Y.-s., Tyliszczak, T., et al. (2016). Origin and hysteresis of lithium compositional spatiodynamics within battery primary particles. Science 353, 566–571. doi: 10.1126/science.aaf4914
Fleckenstein, M., Bohlen, O., Roscher, M. A., and Bäker, B. (2011). Current density and state of charge inhomogeneities in Li-ion battery cells with LiFePO4 as cathode material due to temperature gradients. J. Power Sources 196, 4769–4778. doi: 10.1016/j.jpowsour.2011.01.043
Ganapathy, S., Heringa, J. R., Anastasaki, M. S., Adams, B. D., van Hulzen, M., Basak, S., et al. (2016). Operando Nano-beam Diffraction to Follow the Decomposition of Individual Li2O2 Grains in a Non-aqueous Li-O2 Battery. J. Phys. Chem. Lett. 7, 3388–3394. doi: 10.1021/acs.jpclett.6b01368
Harks, P. P., Mulder, F. M., and Notten, P. H. (2015). In situ methods for Li-ion battery research: a review of recent developments. J. Power Sources 288, 92–105. doi: 10.1016/j.jpowsour.2015.04.084
Katayama, M., Sumiwaka, K., Miyahara, R., Yamashige, H., and Arai, H. (2014). X-ray absorption fine structure imaging of inhomogeneous electrode reaction in LiFePO4 lithium-ion battery cathode. J. Power Sources 269, 994–999. doi: 10.1016/j.jpowsour.2014.03.066
Kerlau, M., Marcinek, M., Srinivasan, V., and Kostecki, R. M. (2007). Studies of local degradation phenomena in composite cathodes for lithium-ion batteries. Electrochim. Acta 52, 5422–5429. doi: 10.1016/j.electacta.2007.02.085
Li, Y., Gabaly, F. E., Ferguson, T. R., Smith, R. B., Bartelt, N. C., Sugar, J. D., et al. (2014). Current-induced transition from particle-by-particle to concurrent intercalation in phase-separating battery electrodes. Nat. Mater. 13, 1149–1156. doi: 10.1038/nmat4084
Li, Y., Li, Y., Pei, A., Yan, K., Sun, Y., Wu, C. L., et al. (2017). Atomic structure of sensitive battery materials and interfaces revealed by cryoelectron microscopy. Science 358, 506–510. doi: 10.1126/science.aam6014
Lin, F., Liu, Y., Yu, X., Cheng, L., Singer, A., Shpyrko, O. G., et al. (2017). Synchrotron X-ray analytical techniques for studying materials electrochemistry in rechargeable batteries. Chem. Rev. 117, 13123–13186. doi: 10.1021/acs.chemrev.7b00007
Liu, H., Strobridge, F. C., Borkiewicz, O. J., Wiaderek, K. M., Chapman, K. W., Chupas, P. J., et al. (2014). Capturing metastable structures during high-rate cycling of LiFePO4 nanoparticle electrodes. Science 344, 1451–1452. doi: 10.1126/science.1252817
Liu, J., Kunz, M., Chen, K., Tamura, N., and Richardson, T. J. (2010). Visualization of charge distribution in a lithium battery electrode. J. Phys. Chem. Lett. 1, 2120–2123. doi: 10.1021/jz100634n
Ma, X., Luo, W., Yan, M., He, L., and Mai, L. (2016). In situ characterization of electrochemical processes in one dimensional nanomaterials for energy storages devices. Nano Energy 24, 165–188. doi: 10.1016/j.nanoen.2016.03.023
Maire, P., Evans, A., Kaiser, H., Scheifele, W., and Novák, P. (2008). Colorimetric determination of lithium content in electrodes of lithium-ion batteries. J. Electrochem. Soc. 155, 862–865. doi: 10.1149/1.2979696
Mima, K., Azuma, H., Yamazaki, A., Okuda, C., Ukyo, Y., Sawada, H., et al. (2012). Li distribution characterization in Li-ion batteries positive electrodes containing LixNi0.8Co0.15Al0.05O2 secondary particles (0.75 ≤ x ≤ 1.0). Nuclear Inst. Methods Phys. Res. B 290, 79–84. doi: 10.1016/j.nimb.2012.08.016
Nishi, T., Nakai, H., and Kita, A. (2013). Visualization of the state-of-charge distribution in a LiCoO2 cathode by in situ Raman imaging. J. Am. Chem. Soc. 160, 1785–1788. doi: 10.1149/2.061310jes
Niwa, H., Shibata, T., Imai, Y., Kimura, S., and Moritomo, Y. (2017). Domain size of phase-separated NaxCoO2 as investigated by X-ray microdiffraction. Batteries 3, 5. doi: 10.3390/batteries3010005
Orikasa, Y., Maeda, T., Koyama, Y., Murayama, H., Fukuda, K., Tanida, H., et al. (2013). Direct observation of a metastable crystal phase of LixFePO4 under electrochemical phase transition. J. Am. Chem. Soc. 135, 5497–5500. doi: 10.1021/ja312527x
Peterson, V. K., Auckett, J. E., and Pang, W.-K. (2017). Real-time powder diffraction studies of energy materials under non-equilibrium conditions. IUCrJ 4, 540–554. doi: 10.1107/S2052252517010363
Singh, D. P., Mulder, F. M., Abdelkader, A. M., and Wagemaker, M. (2013). Facile micro templating LiFePO4 electrodes for high performance Li-ion batteries. Adv. Energy Mater. 3, 572–578. doi: 10.1002/aenm.201200704
Taminato, S., Yonemura, M., Shiotani, S., Kamiyama, T., and Torii, S. (2016). Real-time observations of lithium battery reactions–operando neutron diffraction analysis during practical operation. Nat. Pub. Group 6:28843. doi: 10.1038/srep28843
Tan, J., Liu, D., Xu, X., and Mai, L. (2017). In situ/operando characterization techniques for rechargeable lithium-sulfur batteries: a review. Nanoscale 9, 19001–19016. doi: 10.1039/C7NR06819K
Tanida, H., Yamashige, H., Orikasa, Y., Gogyo, Y., Arai, H., Uchimoto, Y., et al. (2016). Elucidating the Driving Force of Relaxation of Reaction Distribution in LiCoO2 and LiFePO4 Electrodes Using X-ray Absorption Spectroscopy. J. Phys. Chem. C 120, 4739–4743. doi: 10.1021/acs.jpcc.5b10210
Yin, S.-C., Rho, Y.-H., Swainson, I., and Nazar, L. F. (2006). X-ray/neutron diffraction and electrochemical studies of lithium. Chem. Mater. 2, 1901–1910. doi: 10.1021/cm0511769
Zhang, X., Van Hulzen, M., Singh, D. P., Brownrigg, A., Wright, J. P., Van Dijk, N. H., et al. (2014). Rate-induced solubility and suppression of the first-order phase transition in olivine LiFePO4. Nano Lett. 14, 2279–2285. doi: 10.1021/nl404285y
Keywords: microbeam X-ray diffraction, operando, transformation kinetics, Li-ion, X-ray diffraction, electrodes, phase transitions
Citation: van Hulzen M, Ooms FGB, Wright JP and Wagemaker M (2018) Revealing Operando Transformation Dynamics in Individual Li-ion Electrode Crystallites Using X-Ray Microbeam Diffraction. Front. Energy Res. 6:59. doi: 10.3389/fenrg.2018.00059
Received: 04 April 2018; Accepted: 05 June 2018;
Published: 04 July 2018.
Edited by:
Neeraj Sharma, University of New South Wales, AustraliaReviewed by:
Matthew Ryan Rowles, Curtin University, AustraliaCopyright © 2018 van Hulzen, Ooms, Wright and Wagemaker. This is an open-access article distributed under the terms of the Creative Commons Attribution License (CC BY). The use, distribution or reproduction in other forums is permitted, provided the original author(s) and the copyright owner(s) are credited and that the original publication in this journal is cited, in accordance with accepted academic practice. No use, distribution or reproduction is permitted which does not comply with these terms.
*Correspondence: Marnix Wagemaker, bS53YWdlbWFrZXJAdHVkZWxmdC5ubA==
Disclaimer: All claims expressed in this article are solely those of the authors and do not necessarily represent those of their affiliated organizations, or those of the publisher, the editors and the reviewers. Any product that may be evaluated in this article or claim that may be made by its manufacturer is not guaranteed or endorsed by the publisher.
Research integrity at Frontiers

Learn more about the work of our research integrity team to safeguard the quality of each article we publish.