
94% of researchers rate our articles as excellent or good
Learn more about the work of our research integrity team to safeguard the quality of each article we publish.
Find out more
ORIGINAL RESEARCH article
Front. Energy Res. , 19 June 2018
Sec. Bioenergy and Biofuels
Volume 6 - 2018 | https://doi.org/10.3389/fenrg.2018.00054
This article is part of the Research Topic Advancements in Biomass Feedstock Preprocessing: Conversion Ready Feedstocks View all 24 articles
 Amber Hoover1*
 Rachel Emerson1
 Allison Ray1
 Daniel Stevens1Sabrina Morgan1Marnie Cortez1Robert Kallenbach2Matthew Sousek3Rodney Farris4Dayna Daubaras1
Environmental factors like drought impact the quality of biomass entering a bioconversion process. Drought often reduces the sugar content in lignocellulosic biomass, which could have economic impacts, particularly when compounded with losses in dry biomass yield; however, the effects on conversion efficiency are not completely understood. This study investigated how drought may impact biomass composition and sugar yields from dilute-acid pretreatment and enzymatic hydrolysis of Miscanthus, a tall fescue mixture, and switchgrass from Nebraska, Missouri, and Oklahoma, respectively, grown as part of Regional Feedstock Partnership field trials. Samples were grown and harvested in 2010 during non-drought conditions and in 2012 during extreme drought conditions. Non-structural glucose and proline were significantly greater in 2012 compared with 2010 for Miscanthus, which suggests drought stress occurred. Structural glucan and xylan were significantly decreased in 2012 for Miscanthus; however, reactivity and sugar yields from dilute-acid pretreatment and enzymatic hydrolysis were significantly greater in 2012 compared with 2010, suggesting that although structural sugars may decrease during drought conditions, sugar yields and reactivity may increase. For the tall fescue mixture, proline was greater, and structural sugars were lower in 2012, indicating drought stress, but minimal differences were observed in the conversion experiments. Few differences were observed for switchgrass composition and reactivity between years. The observed patterns are likely because of site-specific climatic conditions combined with the tolerance each species may have to drought. As drought occurrence and severity have increased, it is necessary to understand drought impacts to mitigate risks to future bioenergy industry growth.
Lignocellulosic biomass is a promising renewable resource that can help meet U.S. energy demands and support domestic production of fuels and chemicals (U. S. Department of Energy, 2016). A supply of high-quality, consistent feedstock is needed for each biorefinery, which can require upwards of 680,000 Mg of dry feedstock per year (Humbird et al., 2011; Turhollow et al., 2014). Valuation of biomass on cost per dry ton that ignores biomass quality could result in highly variable feedstock quality and performance contributing to market uncertainty (Sokhansanj et al., 2002; Kenney et al., 2013; Li et al., 2016; Williams et al., 2016). Understanding the impact of location, environmental conditions, harvesting methods, and other agronomic treatments on both biomass quality and quantity is therefore important for ensuring a high-quality, consistent feedstock supply to biorefineries.
Based on historical trends, corn yields have a greater risk of decline than oil imports, with weather being a primary source of volatility in corn and ethanol production (Eaves and Eaves, 2007). During every decade from 1900 to 2011, drought events covered at least 30% of the U.S. (Peterson et al., 2013), and drought has occurred more frequently in the last 30 years than over the previous 100 (Stone et al., 2010). In 2012, according to the U.S. Drought Monitor, the U.S. experienced drought conditions across 65% of the continental U.S.; the largest coverage since the 1950s (Rippey, 2015). The 2012 drought reduced U.S. grain yield from corn by 27% (Rippey, 2015), increased competition for corn grain, and impacted ethanol production and cost (Cushman, 2012). The National Centers for Environmental Information estimates that the 2012 drought caused $30 billion in losses, primarily in agriculture (Rippey, 2015). Climate studies indicate that more extreme weather abnormalities will occur in the future, including increases in drought frequency and severity (Wehner et al., 2011; Hansen et al., 2012; Williams et al., 2014). The increases in extreme weather will necessarily impact the biomass supply for the biorefining industry, causing reductions in yields of agricultural crops and increases in the price of crops and biofuels (Langholtz et al., 2014). In modeled scenarios, biofuel production costs increased 35% from a wet year compared to a dry year (Morrow et al., 2014), demonstrating the significant economic risk from drought. In addition, proposed risk mitigation strategies, such as sourcing material from a larger area or storing biomass from non-drought years, showed little impact on reducing risk associated with drought conditions (Morrow et al., 2014).
It has been well documented that drought decreases crop yields, with examples in the literature for corn grain and stover (Earl and Davis, 2003; Sanford et al., 2016); Miscanthus (Sanford et al., 2016); mixed perennial grasses (Emerson et al., 2014); native grasses (Sanford et al., 2016); barley grain and tillers (Samarah, 2005); vegetative growth and yield of rice (Mostajeran and Rahimi-Eichi, 2009); and wheat grain (Keyvan, 2010). Drought sensitivity is present in the fast-growing, second-generation bioenergy crops, such as Miscanthus (Emerson et al., 2014), partly because of the limited trials for improvement of these crops (Karp and Shield, 2008; Oliver et al., 2009); however, individual species and cultivars vary in how they respond to drought conditions (Lewandowski et al., 2003; Karp and Shield, 2008). Miscanthus × giganteus has displayed a stronger response to water deficiencies than switchgrass (Heaton et al., 2004), which has often been reported to be drought tolerant (Lewandowski et al., 2003). Low water requirements for switchgrass have been reported in screening trials on different soil types across 31 U.S. states (Wright and Turhollow, 2010). In contrast, other studies found that switchgrass had low yields during extreme drought, and biomass production decreased 80% in one case; however, plant survival was high, and plants responded well to increased soil moisture following drought, indicating switchgrass may be well suited for many environments following breeding or other improvement studies (McLaughlin and Kszos, 2005; Barney et al., 2009). Similar patterns have been reported for tall fescue, where fall and spring growth increased following summer drought, but the increased growth was not enough to counter low summer yields (Horst and Nelson, 1979). Tall fescue is a cool-season grass that has been used for forage and erosion control and is grown on grasslands that may have potential for biofuel production (Tilman et al., 2006, 2009) as little land use alterations would be required (Walsh et al., 2003). Potential energy crops that have been reported to have some level of drought tolerance include sorghum, which had improved yields in the absence of recurring drought (Gill et al., 2014), and reed canary grass (Lewandowski et al., 2003).
Drought has clear negative consequences for crop yields, but the effect of drought on biomass quality for biofuel production is less well understood. Plant responses to drought include a variety of complex physiological and biochemical responses that could affect biomass composition (Farooq et al., 2009), and biomass composition is directly linked to recalcitrance and conversion performance. Plant nutrient intake is impacted by water stress since nutrients are generally taken up with water (Lipiec et al., 2013). Drought-induced reactive oxygen species cause membrane injuries, protein degradation, and enzyme inactivation (Liu and Huang, 2000; Zlatev and Lidon, 2012). Production of antioxidant metabolites, such as lignins, were reported to alleviate cellular injury (Wahid, 2007; Zlatev and Lidon, 2012). Drought-stressed plants maintain water absorption and cell turgor by synthesizing compatible solutes, thus retaining tissue metabolic activity and allowing for regrowth if conditions improve (Chaves et al., 2003). Compatible solutes include proteins and amino acids (Samuel et al., 2000; Hamilton and Heckathorn, 2001), carbohydrates (Vijn and Smeekens, 1999), organic acids (Farooq et al., 2009), and cyclitols (Anderson and Kohorn, 2001). Proline, a compatible solute, can significantly accumulate during water stress and has been suggested for use as a drought-injury sensor (Iannucci et al., 2000). Proline accumulation as a result of drought has been reported in wheat (Keyvan, 2010) and rice (Mostajeran and Rahimi-Eichi, 2009). Carbohydrates also serve a role in signal transduction that represses genes associated with photosynthesis and reserve mobilization (Koch, 1996). Drought induced accumulation of soluble carbohydrates has been reported in studies of switchgrass (Ong et al., 2016), wheat (Keyvan, 2010), and rice (Mostajeran and Rahimi-Eichi, 2009), but was not observed in shoots of soybeans (Al-Hakimi, 2006).
Glucan, xylan, and lignin are of particular importance in a bioconversion process. A reduction in cellulose, lignin, and soluble carbohydrates was reported for shoots of drought-stressed soybeans, but hemicellulose increased (Al-Hakimi, 2006). Reduced cellulose and increased hemicellulose content were also observed for Miscanthus (Van Der Weijde et al., 2017). Corn stover, Miscanthus, switchgrass, and mixed perennial grasses grown under drought conditions had significantly more extractives, which would include soluble carbohydrates, and lower glucan, xylan, and lignin (Emerson et al., 2014; Ong et al., 2016). Emerson et al. (2014) reported that mixed perennial grasses had similar trends, and although no change in glucan occurred, increased xylan was observed. Following the 2012 drought, compositional changes in glucan and xylan for corn stover, Miscanthus, and mixed perennial grasses decreased theoretical ethanol yield (L Mg−1) by 10–15%. This decrease was extrapolated to an economic loss of greater than $283 Mg−1 of biomass, with an assumed minimum ethanol selling price of $8.37 L−1 (Tao et al., 2013; Emerson et al., 2014). Studies that investigate the impact of drought on bioconversion of feedstocks, particularly field-scale studies, are limited.
This study investigates the impacts of drought conditions on biomass composition and sugar yields from dilute-acid pretreatment and enzymatic hydrolysis of crops grown at field scale. The study capitalized on samples already being collected as part of the Regional Feedstock Partnership, which was an initiative started by the U.S. Department of Energy and the Sun Grant Institute to address the barriers associated with supplying a sustainable and reliable source of feedstock to a large-scale biorefining industry. The Regional Feedstock Partnership was a series of field trials that each lasted for five to seven years for nine biomass types. These field trials were ongoing during 2010, a year without drought, and 2012, during which a nationwide drought occurred. The crop types included in this study were Miscanthus grown in Nebraska, a tall fescue mixture harvested from Missouri, and switchgrass grown in Oklahoma. The goal of the study was to observe the similarities and differences for biomass collected in 2010 and 2012 for each crop type individually, as the crops were grown in different locations and cannot directly be compared. To the authors' knowledge, this is the first study investigating impacts of drought on dilute-acid pretreatment and enzymatic hydrolysis of biomass.
For each of the three species three aspects were considered to determine the location-specific drought conditions and the drought stress reactions for each of the biomass types. First, the precipitation and temperature trends during the growing season were considered. As plants that experience drought conditions can recover if favorable conditions return prior to harvest (McLaughlin and Kszos, 2005), it is important to look at the environmental conditions throughout the year prior to the time of harvest. Second, chemical changes including multiple types of compatible solutes, structural components, and inorganic elements were assessed. Compatible solutes are produced during drought stress to help maintain turgor pressure by lowering water potential (Chaves et al., 2003; Farooq et al., 2009). Studying the levels of compatible solutes, or osmolytes, has two purposes. First, knowledge of compatible solute levels can be used to help determine whether plants were drought stressed, explaining the patterns observed in other chemical-composition parameters or carbohydrate yields from conversion tests. Second, changes in composition of compatible solutes during drought could impact downstream processing of biomass to fuels. Increases in composition parameters, such as extractives, could be at the expense of more desirable characteristics, such as structural carbohydrates, and may lead to formation of microbial inhibitors (Ong et al., 2016). Structural components such as structural sugars and lignin are critical for understanding biomass value to a biorefinery. Ash in biomass feedstock can be an issue because it is not convertible into fuels. Ash causes many issues; it accumulates as waste in biorefineries, adding disposal costs; it can increase the neutralization capacity of the biomass during dilute-acid pretreatment; and it can cause wear on feeding and handling systems (Weiss et al., 2010). Last, conversion efficiencies, fermentation inhibitor formation, and calculated theoretical ethanol yields were used to determine each sample's reaction to drought and estimate the overall impact on a bioconversion process.
The Regional Feedstock Partnership field trials for a variety of energy crops began in 2008. Regional Feedstock Partnership sample sets were selected for analysis from field-study locations that had minimal to no drought during 2010 and also from locations with drought conditions during 2012 for three feedstocks, switchgrass, Miscanthus, and a tall fescue mixture. Drought conditions were determined according to the University of Nebraska-Lincoln U.S. Drought Monitor1. The five drought condition categories, from least to most severe, were abnormally dry, moderate drought, severe drought, extreme drought, and exceptional drought. Numerous values were used to calculate these drought conditions, including the Palmer Drought Index, the Climate Prediction Center Soil Moisture Model, the U.S. Geological Survey Weekly Streamflow, the Standardized Precipitation Index, drought duration, and additional region-specific information1. Biomass was harvested in the fall for the selected sample sets; therefore, the end of October was used for observation of drought conditions in the counties of interest (Figure 1). In addition, drought-index data were analyzed from January 2010 until December 2012.
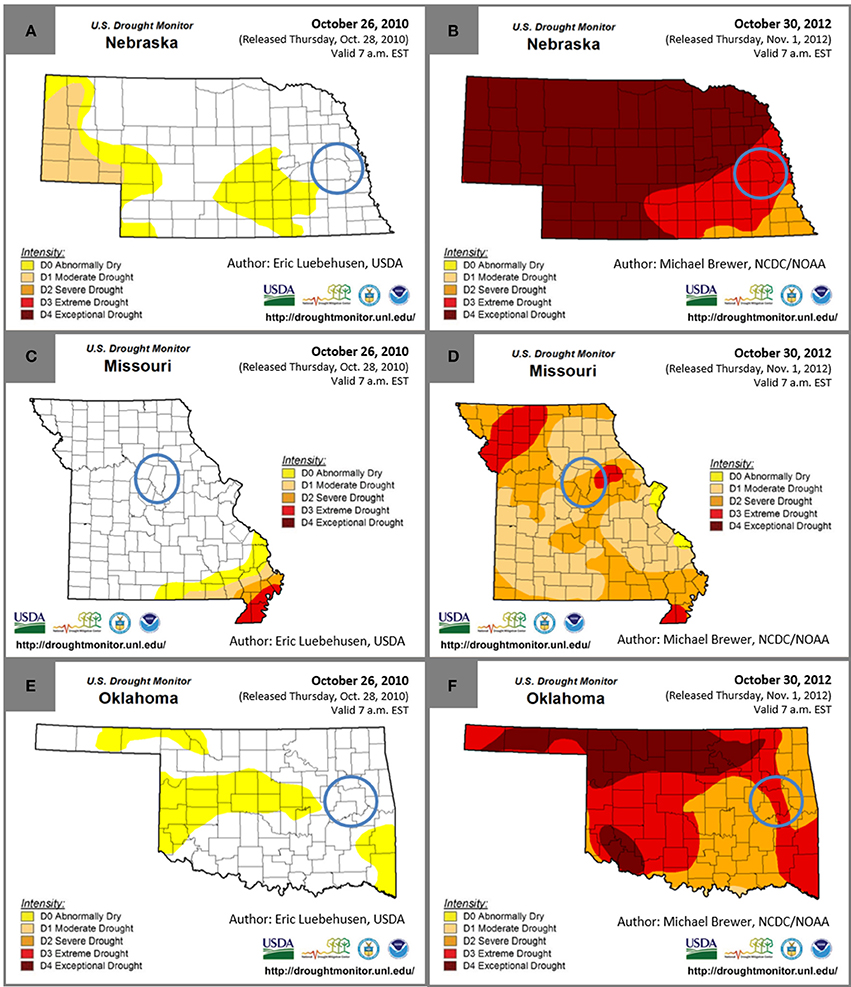
Figure 1. Drought conditions at the end of October in 2010 and 2012 for Nebraska (A,B), Missouri (C,D), and Oklahoma (E,F). Blue circles indicate the county that Miscanthus was grown in Nebraska, the tall fescue mixture was grown in Missouri, and switchgrass was grown in Oklahoma.
Three replicate 10 m2 plots of Miscanthus × giganteus were established in summer 2008 and grown with no nitrogen amendment in Saunders County, Nebraska, as part of the field trials conducted by the Regional Feedstock Partnership. Biomass was harvested annually, and samples used in this study were harvested on December 2, 2010, and November 8, 2012. Dry biomass yield was determined by harvesting Miscanthus from the 10 m2 plot, taking a subsample from the harvested biomass, drying the subsample at 60°C for 48 h, weighing the dry subsample, and then extrapolating the dry weight of the subsample to the entire plot.
The tall fescue mixture was a cool-season perennial grass mixture (Lee et al., 2013) grown in Boone County, Missouri, on a site managed in accordance with Conservation Reserve Program regulations since 2004. Three replicate 0.4 ha plots were established in spring 2008 and grown with no nitrogen amendment as part of the Regional Feedstock Partnership field trials. Biomass was harvested from 0.2 ha split plots annually in the spring and fall. The samples used in this study were harvested on November 4, 2010, and October 29, 2012. Species composition measured in June 2009 and averaged across the three plots was 48% tall fescue (Schedonorus phoenix), 24% red clover (Trifolium pratense), 12% yellow sweetclover (Melilotus officinalis), and 8% white clover (Trifolium repens). Grass weed and broadleaf plants made up the remaining 8% of the plots. To determine dry biomass yield, the tall fescue mixture was harvested at a height of 10–15 cm, baled, and weighed. Bales were then subsampled using a 5 cm diameter and 50 cm long electric corer. Subsamples were dried at 60°C for 48 h, and the subsample dry weight and bale weight were used to calculate dry biomass for the entire plot.
Three replicate 0.4 ha plots of “Blackwell” Panicum virgatum L. (switchgrass) were planted on September 2, 2008, and grown with no nitrogen amendment in Muskogee County, Oklahoma, as part of the Regional Feedstock Partnership field trials. Switchgrass was harvested annually, and samples in this study were harvested on October 28, 2010, and November, 5, 2012. Switchgrass was harvested at a height of 10–15 cm from 0.4 ha of each plot, baled, and weighed. Approximately 300 g cores were taken from the bales using a hay probe, and dry matter was determined by weighing the biomass from each core, drying the sample at 60°C for 48 h, and then reweighing the sample.
All biomass samples were milled to pass through a 2 mm sieve using a Thomas Model 4 Wiley Mill (Thomas Scientific, Swedesboro, NJ).
Precipitation and temperature are key contributing factors to drought conditions. Emerson et al. (2014) reported total monthly precipitation and average monthly maximum temperature for 2010 and 2012 along with thirty-year averages (1981–2010) from the nearest Midwestern Regional Climate Center2,3 for Saunders County, NE (station: Mead 6 S Station USC00255362), and Boone County, MO (station: Columbia Regional Airport Station USW00003945). Total monthly precipitation in 2010 and 2012, average monthly maximum temperature for 2010 and 2012, and thirty-year averages for precipitation and temperature (1981–2010) for Muskogee County, OK (station: COOP:346130), were obtained from the National Oceanic and Atmospheric Administration3. Data for Muskogee County, OK, is provided in Figure S1 in the Supplementary Material.
Chemical composition was determined for all untreated biomass samples in duplicate according to the National Renewable Energy Laboratory's laboratory analytical procedures for standard biomass analysis (Sluiter et al., 2010). Briefly, the extractions detailed in the laboratory analytical procedures were done using an accelerated solvent extractor (ASE) 350 (ThermoFisher, Scientific, Waltham, MA) three times for both water and ethanol for all samples to ensure adequate and consistent extraction of the material. To determine non-structural sugars content in water extractions, the liquid samples were analyzed via high-performance liquid chromatography (HPLC). To determine total extractable sugars and organic acids content in water extractions, the liquid samples were acid hydrolyzed prior to HPLC. The water extractives were adjusted to 4% acid using 72% sulfuric acid and autoclaved at 121°C for 1 h. Acid-hydrolyzed samples were filtered through a 0.2 μm filter and analyzed for organic acids. The remaining sample was neutralized using calcium carbonate, filtered through a 0.2 μm filter, and analyzed for non-structural sugars. Sugars were analyzed on an Aminex HPX-87P column (BioRad Laboratories, Hercules, CA) with a column temperature of 85°C using a refractive index detector, a mobile phase of 18 MΩ ultrapure water and a flow rate of 0.6 mL min−1. Organic acids were analyzed on an Aminex HPX-87H column (BioRad Laboratories, Hercules, CA), with a column temperature of 55°C, using a diode array detector, a mobile phase of 0.01 M sulfuric acid, and a flow rate of 0.6 mL min−1. Duplicate injections were performed for all samples. For the two-stage acid hydrolysis of the extracted solids, specified in the laboratory analytical procedure, the resulting hydrolysis liquor was analyzed for monomeric sugars and organic acids using the same HPLC methods previously described. Acid-soluble lignin was determined by measuring absorbance at 320 nm with an ultraviolet-visible spectrophotometer (Varian Cary 50, Agilent, Santa Clara, CA) and calculating the concentration using Beer's Law with an extinction coefficient of 30. Protein was determined by measuring percent nitrogen using a LECO TruSpec CHN (St. Joseph, MI) and then multiplying that value by a nitrogen-protein conversion factor of 4.6.
Samples were milled to pass through a 0.08 mm sieve using a Retsch ZM 200 (Haan, Germany). Amino acids were analyzed based on three AOAC methods. AOAC 994.12 (AOAC International, 1997) was followed to measure all of the amino acids except for tryptophan, which required a base hydrolysis using AOAC 988.15 (AOAC International, 1988b), and methionine and cysteine, which required a pre-oxidation step using modified AOAC 985.28 (AOAC International, 1988a). Samples were analyzed using an ion-exchange post column ninhydrin method. Specifically, following hydrolysis of the samples according to the AOAC methods mentioned previously, the extracts were filtered to remove particulates and analyzed by HPLC. After the amino acids exited the HPLC column, they were reacted with ninhydrin prior to detection and quantification.
Conversion performance was determined using a bench-scale, dilute-acid pretreatment and enzymatic hydrolysis assay. Chemical composition of the untreated biomass was determined as described in the previous methods section on composition. Laboratory-scale, dilute-acid pretreatment was performed using an ASE 350 (ThermoFisher Scientific, Waltham, MA) according to Wolfrum et al. (2013). Wolfrum et al. (2013) determined that 130°C was the optimal temperature for comparing biomass reactivity after conducting pretreatment experiments with temperatures ranging from 110 and 200°C; therefore, a pretreatment temperature of 130°C was selected for this study. Experiments were performed using 66-mL zirconium cells and a 10% (w/w) solids loading with an acid-to-biomass loading of 0.08 g g−1. Each cell was filled with 3.0 +/− 0.03 g biomass and 30 mL of 1% sulfuric acid (w/w). Cells were subjected to a 7 min heating period followed by a 7 min static time with a reaction temperature of 130°C. Then cells were purged for 200 s with nitrogen. The temperature was reduced to 100°C and 100 to 150 mL of nanopure water was rinsed through the cell with a 200 s nitrogen gas purge. Aliquots of the liquors rinsed from the solid biomass were collected for determination of total and monomeric sugars in the pretreatment liquors using the same HPLC methods previously described in the composition section. Fermentation inhibitors—acetic acid, levulinic acid, 5-hydroxymethylfurfural, and furfural—in the pretreatment liquors were also measured using HPLC. Measurement of degradation products like 5-hydroxymethylfurfural from the degradation of hexose sugars and furfural from the degradation of pentose sugars can inform whether degradation of sugars occurred; however, the methods used in this study cannot determine the exact amount of degraded sugars, which could be done by measuring the sugar content in the solids before and after pretreatment. Three ASE cells were extracted for each sample, and the pretreatment liquors were removed for analysis as described above. The remaining pretreated solids for the three samples were then used as the triplicates for subsequent enzymatic hydrolysis. Compositional analysis was not conducted on the pretreated solids, because there was limited solid sample remaining after pretreatment to conduct this analysis. Therefore, enzymes were loaded on a per gram dry biomass basis described in the subsequent paragraph and in Wolfrum et al. (2013).
Enzymatic hydrolysis was conducted according to the procedure described in Selig et al. (2008) at 1.5% solid loading (w/v, on a 105°C dry weight basis) in a 20 mL scintillation vial with a final reaction volume of 10 mL. Enzymes were added at 40 mg protein/g dry biomass for Cellic CTec2 (Novozymes, Franklin, NC) and 4 mg protein/g biomass for Cellic HTec2. Cellic CTec2 had a protein concentration of 155 mg mL−1 and a cellulase activity of 99 FPU mL−1. HTec2 had protein concentrations of 175 mg mL−1 and a cellulase activity of 77 FPU mL−1. The low percent solids and high enzyme loadings used in the study were intended to determine the maximum sugar release from each sample. Enzyme and substrate blanks were prepared as controls. After an incubation period of 120 h at 50°C, aliquots of liquor were removed, filtered through a 0.2 μm filter, and analyzed for monomeric sugars using Megazyme assay kits (D-Glucose [GOPOD Format] Kit for glucose, D-Xylose Assay Kit for xylose; Bray, Ireland). Sugar yields were calculated by dividing the sugar released in dilute-acid pretreatment and enzymatic hydrolysis liquors by the initial sugar content in the biomass sample.
Theoretical ethanol yields (TEYs) were completed as described in Emerson et al. (2014) using grams of sugar from enzymatic hydrolysis described in the previous Dilute-acid Pretreatment and Enzymatic Hydrolysis section. Total TEY was defined as TEY per hectare of harvested biomass and was calculated as described in Emerson et al. (2014).
Statistical analysis was done in SigmaPlot 12.3 (Systat Software, Inc., San Jose, CA). A one-way, repeated measures analysis of variance (ANOVA) was used to determine the effect of year (2010, 2012) on components described in previous sections for Miscanthus, the tall fescue mixture, and switchgrass for each biomass type and component separately (n = 3). To determine whether residuals met ANOVA assumptions of normality and homogeneity of residuals, a Shapiro-Wilk test and an equal variance test were done, respectively (p > 0.05). To meet either assumption of normality or homogeneity of residuals, Miscanthus L-Serine was reciprocal transformed and non-structural xylose and arabinose were natural-log transformed; switchgrass L-Aspartic acid was natural-log transformed; and the tall fescue mixture extracted succinic acid, non-structural galactose, and non-structural arabinose were natural-log transformed. Differences were considered significant if p ≤ 0.05. Non-transformed values were displayed in all tables and figures.
Precipitation for Miscanthus grown in Mead, NE, reported by Emerson et al. (2014), totaled 96 cm in 2010 and only 47 cm in 2012. Monthly precipitation in 2010 was on average greater than the 30-year average, but in 2012 the precipitation was lower than the 30-year average for the majority of the growing season, including the harvest month of November. The lack of precipitation, primarily between July and November, was coupled with temperatures greater than the 30-year average in 2012 for most months leading to the drought conditions displayed in Figures 1A,B.
Proline, a known compatible solute that accumulates in plants during water stress, was three times greater following drought for Miscanthus, indicating that this crop experienced drought stress (p ≤ 0.05, Table 1). Glycine, phenylalanine, and tryptophan levels were also significantly greater in the drought-stressed Miscanthus, which corroborates previous results for drought-stressed switchgrass (Meyer et al., 2014; Ong et al., 2016). The other amino acids analyzed in this study have not necessarily been identified in literature as indicators of drought stress in plants; however, significant changes were seen in these components along with proline, phenylalanine, and tryptophan. Of the 14 other amino acids measured, 10 were significantly greater in 2012 compared with 2010 for Miscanthus (Table 1).
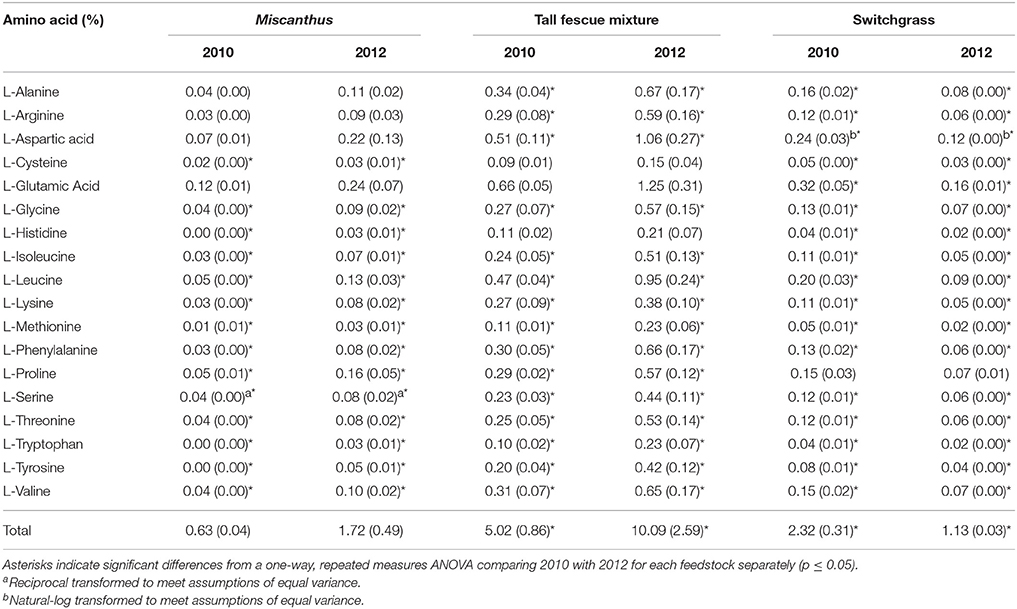
Table 1. Percent of each amino acid in Miscanthus, the tall fescue mixture, and switchgrass grown in 2010 and 2012 [n = 3; mean (1 SD)].
Non-structural glucose, another drought stress indicator, was over two and a half times greater for Miscanthus harvested after drought in 2012 compared with Miscanthus harvested in the non-drought year (Table 2). Similar changes in non-structural glucose have been reported by Timpa et al. (1986) for cotton plants and Kang et al. (2011) for alfalfa shoots. This trend was also present for fructose, but was not significant (Table 2). In addition, extracted glucose following acid hydrolysis, water extractives that include non-structural carbohydrates, and ethanol extractives were 3, 1.5, and 2 times greater, respectively, in the drought year (Table 3). The results exemplify how an increase in extractives, including compatible solutes, might affect downstream processing to fuels because there was a 10% higher extractives content and a corresponding 10% lower structural content (i.e., lignin, structural sugars) for Miscanthus in a drought year compared to a normal year.
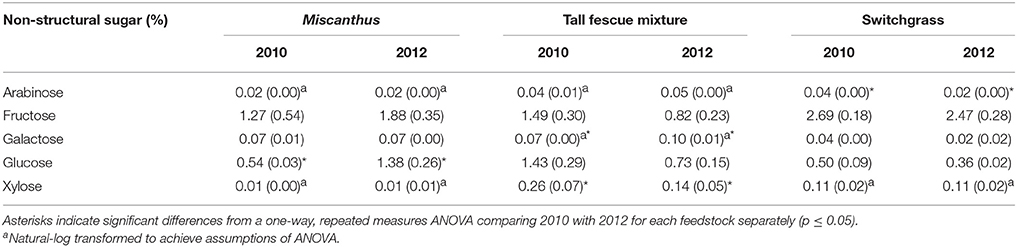
Table 2. Percent of each non-structural sugar in Miscanthus, the tall fescue mixture, and switchgrass grown in 2010 and 2012 [n = 3; mean (1 SD)].
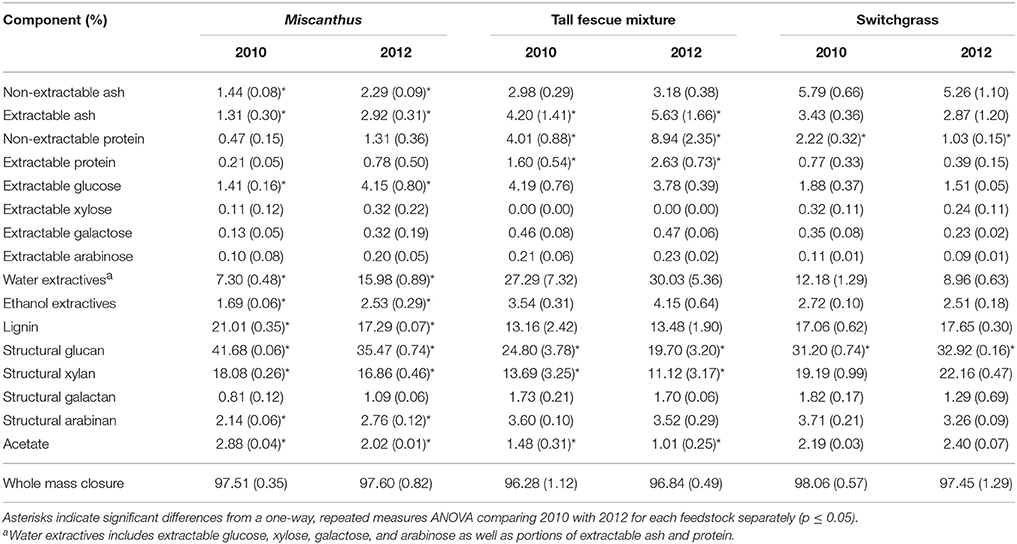
Table 3. Percent of each compositional-analysis component for Miscanthus, the tall fescue mixture, and switchgrass grown in 2010 and 2012 [n = 3; mean (1 SD)].
Non-extractable ash was slightly greater (0.85%) in the 2012 drought compared to the non-drought year, 2010 (p ≤ 0.05; Table 3). This trend is not likely to be due to ash from soil as the samples were harvested consistently between years, and most of the soil was removed during the water and ethanol extractions. Ions like potassium help in osmotic adjustment in plant cells (Farooq et al., 2009), and may explain the minor increase in ash, but the elemental composition of the ash was not determined in this study. Additional experiments would need to be done to determine the physiological mechanisms behind these trends.
Miscanthus had significantly lower structural glucan and xylan during the drought year (Table 3). This result is similar to that previously reported for corn stover, Miscanthus, switchgrass, and mixed perennial grasses (Emerson et al., 2014; Ong et al., 2016). The impact of drought stress on plant cellulose and hemicellulose sugars has varied in the literature, however. Drought-stressed plants had decreased cellulose sugars and increased hemicellulose sugars for soybeans (Al-Hakimi, 2006), mixed perennial grasses (Emerson et al., 2014), and Miscanthus (Van Der Weijde et al., 2017). Lower structural sugars have negative implications for potential biofuel yield if it is assumed 100% of the sugars can be converted to fuels; however, rarely are 100% of available sugars converted to fuels. The impact of known recalcitrance factors in biomass must be accounted for. Lignin, a component known to cause recalcitrance (Davin et al., 2008), was also lower for drought-impacted Miscanthus (Table 3), which could lead to decreased recalcitrance offsetting the negative impact of reduced structural carbohydrates on conversion yields. Decreased lignin after drought was also found in previous studies of corn stover, mixed perennial grasses, Miscanthus, and corn leaves (Vincent et al., 2005; Emerson et al., 2014). In addition, certain phenylpropanoids (monomeric units of lignin) and peroxidases were increased in maize during drought, indicating decreased structural lignin (Alvarez et al., 2008). Similar to structural sugars, trends from previous studies vary. For example, a study of 50 Miscanthus genotypes reported only a slight decrease in lignin for stem tissue from drought-treated plants compared to the control, and no difference was observed for leaf tissue (Van Der Weijde et al., 2017).
Glucose yields from dilute-acid pretreatment and enzymatic hydrolysis were significantly greater for Miscanthus grown during the 2012 drought compared with 2010, the non-drought year (p ≤ 0.05, Table 4). In addition, total xylose yield was greater after drought for enzymatic hydrolysis and pretreatment and enzymatic hydrolysis combined (p ≤ 0.05, Table 4), and this trend was present for xylose yield from pretreatment, but it wasn't significant (p > 0.05, Table 4). In 2012, on average 0.2 grams of glucose were released during pretreatment and enzymatic hydrolysis per gram of dry biomass, which is over twice the average glucose release in 2010 (0.1 g g−1), and this trend was also present for xylose release (0.1 g g−1 in 2012 versus 0.08 g g−1 in 2010). These results are somewhat counterintuitive given the lower structural glucan and xylan in 2012; however, Miscanthus after the 2012 drought had significantly greater extractable glucose and lower lignin than Miscanthus from the non-drought year, which might explain the higher sugar release in 2012 Miscanthus (Table 3). In particular, the glucose released in pretreatment for 2010 samples averaged 0.018 g g−1 (dry biomass), which is similar to the average non-structural glucose in the samples (0.014 g g−1). In 2012, glucose released during dilute-acid pretreatment was 0.06 g g−1 (dry biomass), mirroring the higher non-structural glucose content in the samples (0.04 g g−1). The reactivity experiment was designed to determine differences in reactivity based on consistent enzyme loadings per gram of dry biomass and not per gram of glucan in the pretreated biomass. This caused higher enzyme loadings for samples that had lower glucan contents in the drought years; however, the enzymatic hydrolysis glucose yield almost doubled in the drought year (Table 4), but milligrams of Cellic CTec2 per gram glucan only increased by 22% (Table 5). Similarly, milligrams of Cellic HTec2 per gram xylan increased by 25% in the drought year, but enzymatic hydrolysis xylose yield increased by 46% (Table 4). The enzyme loadings explain part of the increase in sugar yields, but compositional differences likely play a role as well, given that lignin decreased by 18% in the drought year. This is the first study to show these relationships for dilute-acid pretreated Miscanthus; however, increased degradability of drought-treated Miscanthus has been previously observed when a mild alkali pretreatment was used prior to enzymatic saccharification (Van Der Weijde et al., 2017).
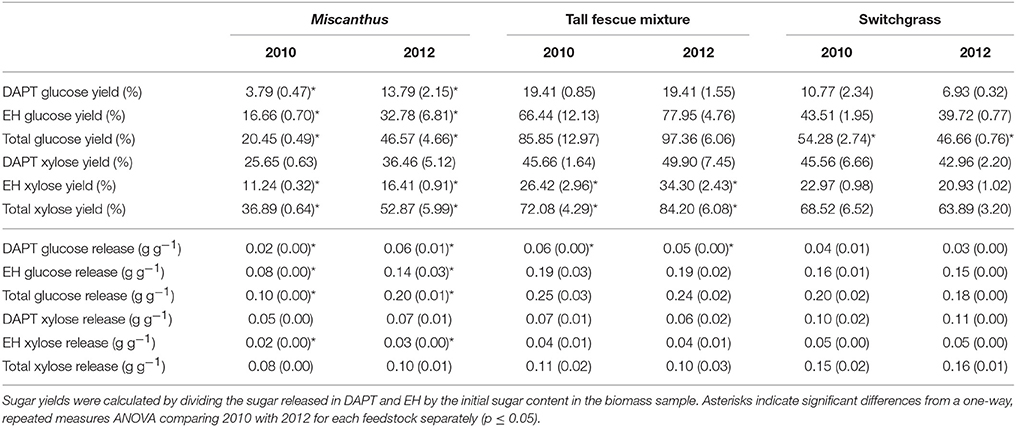
Table 4. Glucose and xylose yield (%) and release (grams per gram dry biomass) from dilute-acid pretreatment (DAPT), enzymatic hydrolysis (EH), and both DAPT and EH (total) for Miscanthus, the tall fescue mixture, and switchgrass grown in 2010 and 2012 [n = 3; mean (1 SD)].
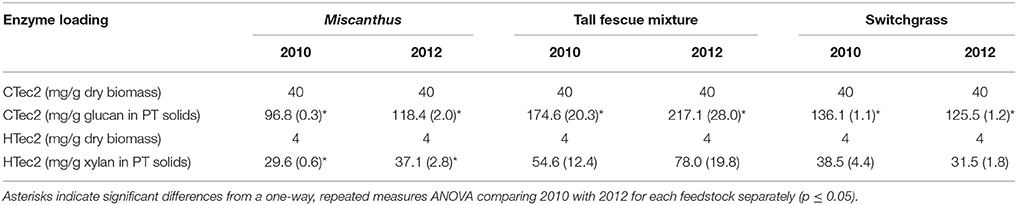
Table 5. Enzyme loadings for hydrolysis on a per gram dry biomass basis and per grams of sugar in the pretreated (PT) solids for Miscanthus, the tall fescue mixture, and switchgrass grown in 2010 and 2012 [n = 3; mean (1 SD)].
This study did not assess performance of drought-stressed biomass through fermentation, but changes in composition of compatible solutes during drought could impact downstream processing of biomass to fuels. A recent study by Ong et al. (2016) found increased fermentation inhibitors from soluble sugars that degraded into pyrazines and imidazoles in drought-stressed switchgrass pretreated using ammonia fiber expansion. Inhibitors formed by dilute-acid pretreatment are different from those formed in ammonia fiber-expansion pretreatment, but could still form due to the increase in soluble sugars. Acetic acid was the only inhibitor measured in the pretreatment liquors of Miscanthus, and it was significantly reduced by 0.002 g g-1 (dry biomass) in drought stressed Miscanthus (p ≤ 0.05, Table 6). Organic acids can cause enzyme inhibition leading to decreased carbohydrate yields (Li et al., 2016), and this may partially explain the lower sugar yields for Miscanthus in 2010. The lack of 5-hydroxymethylfurfural, furfural, and levulinic acid formation in the pretreatment liquors may be due to the low pretreatment temperature of 130°C (Table 6). Understanding the changes in biomass properties due to the environmental conditions during the growing season may affect the selection of pretreatment, enzymatic hydrolysis, and fermentation conditions. More research is necessary to understand how soluble components formed during drought affect enzyme and fermentation-inhibitor formation in the variety of pretreatments used to breakdown the lignocellulosic structure during biochemical conversion processes.
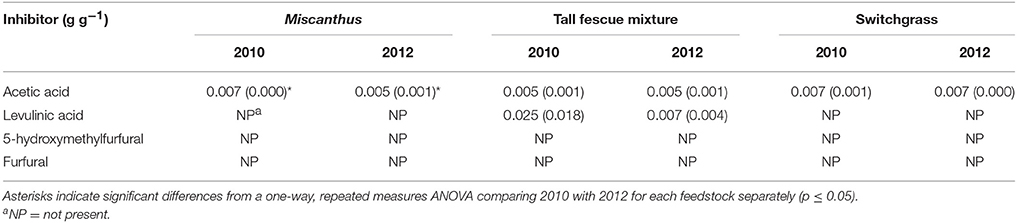
Table 6. Enzymatic hydrolysis and fermentation inhibitors (grams per gram dry biomass) measured in the dilute-acid pretreatment (DAPT) hydrolysates for Miscanthus, the tall fescue mixture, and switchgrass grown in 2010 and 2012 [n = 3; mean (1 SD)].
The theoretical ethanol yield (TEY), based on glucose and xylose released from enzymatic hydrolysis of the dilute-acid pretreated biomass, was 76% greater for drought-impacted Miscanthus compared with biomass grown in a non-drought year (p ≤ 0.05, Figure 2A). In contrast, Emerson et al. (2014) actually reported a decrease in TEY following drought; however, this analysis was based solely on composition. A decrease in structural carbohydrates was seen in the experiments in the present study, but the TEY is based on sugar yields from reactivity experiments, rather than calculated assuming 100% conversion of the analyzed composition. Average dry biomass yield collected from the field was similar for Miscanthus in 2010 and 2012. This may be due to the fact that only two of the three plots had yields 6 Mg ha−1 lower in 2012, compared with 2010, as would be expected in drought-stressed plants (Figure 2B). It is unclear why one plot yielded 5 Mg ha−1 greater after the 2012 drought, but there can be significant plot-to-plot variation in field studies. Total TEY (L ha−1), calculated by multiplying TEY and dry biomass yields, can be used to understand the amount of ethanol a hectare of biomass might produce. Miscanthus had 61% higher total TEY following the drought; however, the difference was not significant (Figure 2C). This is because of the greater TEY in the drought year and minimal change in dry biomass (Figures 2A-C), and if all three replicate plots had lower dry biomass yield after drought the difference in total TEY between the 2 years would have been noticeably less.
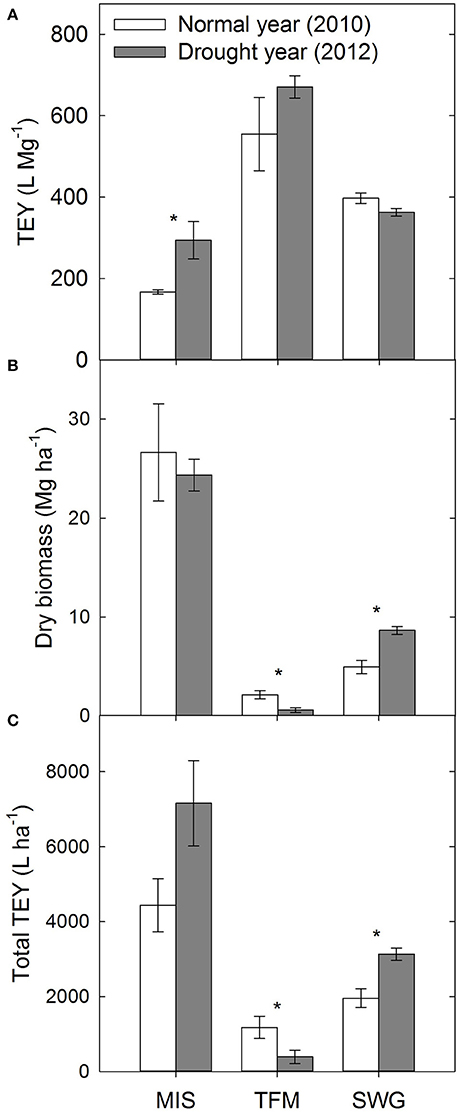
Figure 2. Theoretical ethanol yield (TEY) based on enzymatic hydrolysis glucose yields (A), dry biomass yield (B), and total TEY per hectare of dry biomass (C) for Miscanthus (MIS), a tall fescue mixture (TFM), and switchgrass (SWG) grown during a normal year (2010) and a drought year (2012). Asterisks indicate significant differences from a one-way, repeated measures ANOVA comparing 2010 with 2012 for each feedstock separately (p ≤ 0.05).
Precipitation and temperature data for the tall fescue mixture grown in Columbia, MO, was reported by Emerson et al. (2014). Total yearly precipitation in Columbia, MO, was 116 cm in 2010 and 78 cm in 2012. Spring precipitation was greater than the 30-year average in 2012, but for every month from May through December, the precipitation was below the 30-year average and was also below 2010 monthly precipitation, except during October. The 2012 average maximum temperature was greater than the 30-year average from January through September while the 2010 average temperature was similar to the 30-year average. The sampled biomass was harvested in late October or early November, and the lack of precipitation and elevated temperatures are consistent with the drought conditions in Figures 1C,D.
The tall fescue mixture had proline levels twice as high following drought, indicating that the crop was impacted by drought conditions (p ≤ 0.05, Table 1). Other amino acids—glycine, phenylalanine, and tryptophan—also had significantly greater levels in the tall fescue mixture after drought, which has been observed previously for drought-stressed switchgrass (Meyer et al., 2014; Ong et al., 2016). Eleven of the 14 other amino acids measured were significantly greater in 2012 compared to 2010 for the tall fescue mixture (Table 1). Acetic acid significantly increased in 2012 for the tall fescue mixture, corroborating identification of organic acids as chemicals involved in osmotic regulation (Farooq et al., 2009); however, formic acid significantly decreased in 2012 (Table 7).
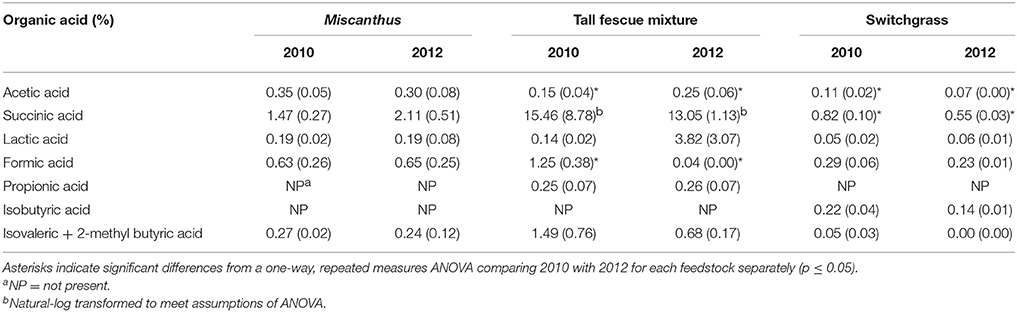
Table 7. Percent of each organic acid in the water extractions of Miscanthus, the tall fescue mixture, and switchgrass grown in 2010 and 2012 [n = 3; mean (1 SD)].
Counter to the proline results, extractives and extractable sugars were similar for the tall fescue mixture harvested after drought in 2012 and in a non-drought year (Table 3). Non-structural sugars were actually higher in the non-drought year; however, this increase was only significant for xylose (Table 2). This is in contrast to a previous lab study in which non-structural sugar concentrations in tall fescue were significantly greater after drought (Karsten and MacAdam, 2001), which indicated a plant osmotic response. The difference in these results could be that the tall fescue mixture plots in this study were composed of 48% tall fescue and 44% clover. White clover has been reported to hydrolyze carbohydrates less in response to osmotic stress than tall fescue (Karsten and MacAdam, 2001). The increase in proline concentration best explained white clover response to water stress (Turner, 1990). The different mechanism of response to water stress in a cool-season grass compared with a cool-season forb may explain the significant increase in proline after drought for the tall fescue mixture, combined with no increase in non-structural glucose.
The structural glucan and xylan were significantly lower for the tall fescue mixture during the drought year (Table 3). Similar to results for Miscanthus reported by Van Der Weijde et al. (2017), there was no reduction in lignin content in 2012 as has been reported in other studies (Table 3) (Vincent et al., 2005; Emerson et al., 2014). This may be due to more moderate drought conditions during 2012 at this site (Figures 1E,F).
An increase in glucose yield during 2012 was observed for the tall fescue mixture for enzymatic hydrolysis and total glucose yield (Table 4), but these patterns were not significant (p > 0.05). Total xylose yield for the tall fescue mixture was greater after drought for enzymatic hydrolysis and pretreatment and enzymatic hydrolysis combined (p ≤ 0.05, Table 4). These trends were not evident for grams glucose and xylose released from pretreatment and enzymatic hydrolysis per gram dry biomass (p > 0.05, Table 4). As stated previously the reactivity experiment was designed to determine differences in reactivity based on consistent enzyme loadings per gram of dry biomass and not per gram of glucan in the pretreated biomass. Milligrams of Cellic CTec2 per gram glucan was 24% greater in the drought year compared with 2010, which is similar to the 17% increase in enzymatic hydrolysis glucose yield, although not significant (Tables 4, 5). Similarly, milligrams of Cellic HTec2 per gram xylan increased by 43% in the drought year, and enzymatic hydrolysis xylose yield increased by 30% (Tables 4, 5). The percent increase in enzyme loading per gram glucan in the pretreated biomass is similar to or greater than the percent increase in sugar yields in 2012 for the tall fescue mixture. In addition, it is theorized that the tall fescue mixture had moderate trends for conversion yields due to the less-severe drought conditions in the county where the tall fescue mixture was grown (Figures 1E,F). Finally, fermentation inhibitors−5-hydroxymethylfurfural and furfural—were not present in the pretreatment liquors, indicating that fermentation would not be impacted by these components for the tall fescue mixture grown in either year (Table 6). However, the tall fescue mixture did have levulinic acid levels in the pretreatment liquors that were three times higher in samples grown in drought conditions, but this difference was not statistically significant (p > 0.05, Table 6).
There was no significant difference between TEY in 2010 and 2012 for the tall fescue mixture, even though the average TEY did increase 21% (p > 0.05, Figure 2A). The dry biomass yields from the tall fescue mixture were 1.6 Mg ha−1 lower (73%) in the drought year compared with the non-drought year, and this trend affected the total TEY, which was decreased by 67% in the drought year (p ≤ 0.05, Figures 2B-C).
Precipitation in Muskogee County, OK, where the switchgrass samples were grown, totaled 95 cm in 2010 and 77 cm in 2012 (Figure S1). Precipitation in 2012 was lower than the 30-year average from April through December, except for September, and the temperatures were higher than average during this time as well, except for October, leading to the drought conditions shown in Figures 1E,F. In 2010, precipitation was much closer to average during the growing season from May through July and in September; however, precipitation was similar to 2012 from September through October. Temperatures in 2010 were similar to the 30-year average for much of the growing season, with higher than average temperatures in June, August, and October.
In the present study, switchgrass compatible solutes were not impacted by drought. Switchgrass proline levels indicate that it did not experience drought stress during the drought in 2012, as proline concentrations did not differ compared to 2010. All other amino acids measured for switchgrass were significantly greater, approximately 50%, in the non-drought year compared with the drought year (p ≤ 0.05, Table 1). In addition, organic acids were, in the cases of acetic and succinic acid, significantly lower after drought (Table 7). Switchgrass from 2010 and 2012 had similar non-structural sugars, water extractives, extracted/acid-hydrolyzed sugar concentration, and ethanol extractives (Tables 2–3). In general, the cell-wall components measured for switchgrass were not altered during the 2012 drought, but glucan was significantly, by 1.7%, greater in 2012 (Table 3), which is a minimal increase given typical analytical error for this measurement (Templeton et al., 2010).
Switchgrass had little to no change in composition as a result of drought, and this may be due to the drought tolerance and low water requirements of this plant species (Lewandowski et al., 2003; Wright and Turhollow, 2010) and the weather patterns in 2010 and 2012. Precipitation was lower and temperatures were higher than average during the drought year in Muskogee County, OK (Figure S1), but the month before harvest, in September, rainfall was greater than average even though temperatures were still elevated. In addition, La Niña triggered drought conditions across the southern U.S. in late 2010 (Rippey, 2015); consequently, the Oklahoma field site had total yearly rainfall of 95 cm, which is less than the 30-year average (106 cm), and had monthly precipitation similar to 2012 in August, September, and October, while May through July precipitation was much lower in 2012 than in 2010. Switchgrass plants have been found to respond well to favorable conditions following drought; therefore, these similar climate patterns near the end of the growing season may be the reason for similar composition in both years, despite the fact that most of Oklahoma was still under drought conditions at the time of harvest in 2012 (Figures 1E,F) (McLaughlin and Kszos, 2005).
For switchgrass, pretreated glucose yield and enzymatic hydrolysis glucose yield were similar in 2010 and 2012, but total glucose yield was actually slightly higher in 2010 compared with 2012 (p ≤ 0.05, Table 4). This result is consistent with the changes in composition (Table 3). The xylose yield was similar for switchgrass grown in 2010 and 2012 (Table 4), which is consistent with the lack of differences in glucose yields and structural sugars in both years. There were also no differences in the enzymatic and fermentation inhibitors measured in the pretreatment liquors (p > 0.05, Table 6). This matches the composition and conversion results from this study, but inhibitors were increased for drought-impacted switchgrass pretreated with ammonia fiber expansion in a recent study (Ong et al., 2016). The difference likely lies in the timing and severity of the drought conditions experienced by the switchgrass samples as well as the pretreatment type and conditions used in each study.
There was no significant difference in TEY between 2010 and 2012 switchgrass (p > 0.05, Figure 2A). Switchgrass actually had slightly greater dry biomass yields in 2012 compared to 2010, and a higher total TEY following drought because of the higher dry biomass yield in 2012 (p ≤ 0.05, Figures 2B,C). This may be due to some level of drought tolerance for switchgrass described previously. Other more drought-tolerant crops, such as soybeans, only had a 9% reduction in yield in the U.S. during the 2012 drought because of their ability to shutdown processes during adverse conditions and reproduce when favorable conditions return (Rippey, 2015). Another contributing factor to the similar yields between 2010 and 2012 is that the non-drought year, 2010, had total yearly rainfall 11 cm less than the 30-year average, and monthly precipitation was similar to 2012 in the 3 months leading up to harvest (Figure S1). Finally, the time when the switchgrass crop was established may also be a contributing factor. The non-drought comparison year was 2010, which was the second year after establishment of the perennial switchgrass crop, and the 2012 drought occurred during the fourth year of the switchgrass crop. Yield of switchgrass generally increases each year until a peak potential is met, and this can often be about 3 years (Parrish and Wolf, 1992; Hong et al., 2014).
Overall, the results of this study indicate that drought conditions have the potential not only to decrease dry-biomass yield, but also to alter biomass chemical composition including components related to recalcitrance. Miscanthus results demonstrate that biomass can have a decrease in structural sugars during drought while simultaneously having lower recalcitrance components, making the remaining sugars more readily available for conversion. These results indicate that the severity of drought conditions may be mitigated by the decrease in recalcitrance for some biomass types, which could offset some of the loss of biomass yield. The tall fescue mixture collected after drought had higher proline concentration, lower structural sugars, and lower dry biomass yield, but minimal significant differences in sugar release following dilute-acid pretreatment and enzymatic hydrolysis in samples collected after drought, possibly as a result of less-severe drought conditions at the field site. Few differences were observed for switchgrass composition and conversion performance, possibly because of its tolerance to drought or the climatic conditions at the field site during 2010 and 2012. Complementary experiments are necessary to confirm the results of this observational study by controlling the drought conditions during plant growth and testing the impact on composition and conversion performance, including fermentation. In addition, more research and development is suggested to understand drought impacts on potential bioenergy crops and strategies to mitigate these impacts.
AH, RE, AR, and DS formed the research objective. RK, MS, and RF conducted field experiments and collected biomass samples and yield data. AH, RE, AR, DS, SM, DD, and MC coordinated samples and conducted laboratory experiments and data analysis. AH performed statistical analysis and drafted the initial article. RE, AR, and MC contributed section content and edits to subsequent drafts, while all authors reviewed and provided feedstock on the submitted article.
This research was supported by the U.S. Department of Energy (DOE), Office of Energy Efficiency and Renewable Energy (EERE), Bioenergy Technologies Office (BETO), under DOE Idaho Operations Office Contract DE-AC07-05ID14517. The views expressed in the article do not necessarily represent the views of the U.S. Department of Energy or the United States Government. The U.S. Government retains and the publisher, by accepting the article for publication, acknowledges that the U.S. Government retains a nonexclusive, paid-up, irrevocable, worldwide license to publish or reproduce the published form of this manuscript, or allow others to do so, for U.S. Government purposes.
The authors declare that the research was conducted in the absence of any commercial or financial relationships that could be construed as a potential conflict of interest.
The authors would like to thank Roch Gaussoin from University of Nebraska and the following INL colleagues for their assistance: Garold Gresham, David Muth, Kastli Schaller, Karen Delezene-Briggs, and Matthew Bryant. The maps displayed in Figure 1 were courtesy of the U.S. Drought Monitor, which is jointly produced by the National Drought Mitigation Center at the University of Nebraska-Lincoln, the United States Department of Agriculture, and the National Oceanic and Atmospheric Administration. This research was supported by the U.S. Department of Energy under Department of Energy Idaho Operations Office Contract No. DE-AC07-05ID14517.
The Supplementary Material for this article can be found online at: https://www.frontiersin.org/articles/10.3389/fenrg.2018.00054/full#supplementary-material
Datasets used in this article are stored in the Bioenergy Feedstock Library (bioenergylibrary.inl.gov). Samples in the Bioenergy Feedstock Library are identified using a globally unique identifier (GUID). The GUIDs for this dataset are in Table S1.
1. ^US Drought Monitor, National Drought Mitigation Center, University Nebraska-Lincoln, http://droughtmonitor.unl.edu/MapsandDataServices/MapService.aspx
2. ^Midwestern Regional Climate Center, University of Illinois at Urbana-Champaign, http://mrcc.sws.uiuc.edu
3. ^National Oceanic and Atmospheric Administration, National Climatic Data Center, www.nws.noaa.gov/climate
Al-Hakimi, A. (2006). Counteraction of drought stress on soybean plants by seed soaking in salicylic acid. Int. J. Bot. 2, 421–426. doi: 10.3923/ijb.2006.421.426
Alvarez, S., Marsh, E. L., Schroeder, S. G., and Schachtman, D. P. (2008). Metabolomic and proteomic changes in the xylem sap of maize under drought. Plant Cell Environ. 31, 325–340. doi: 10.1111/j.1365-3040.2007.01770.x
Anderson, C. M., and Kohorn, B. D. (2001). Inactivation of Arabidopsis SIP1 leads to reduced levels of sugars and drought tolerance. J. Plant Physiol. 158, 1215–1219. doi: 10.1078/S.0176-1617(04)70149-2
AOAC International (1988a). AOAC Official Method 985.28-1988, Sulfur Amino Acids in Food, Feed Ingredients, and Processed Foods-Ion Exchange Chromatographic Method. Rockville, MD: AOAC International.
AOAC International (1988b). AOAC Official Method 988.15-1988, Tryptophan in Foods and Food and Feed Ingredients-Ion Exchange Chromatographic Method. Rockville, MD: AOAC International.
AOAC International (1997). AOAC Official Method 994.12-1997: Amino Acids in Feeds. Performic Acid Oxidation With Acid Hydrolysis-Sodium Metabisulfite Method. Rockville, MD: AOAC International.
Barney, J. N., Mann, J. J., Kyser, G. B., Blumwald, E., Van Deynze, A., and DiTomaso, J. M. (2009). Tolerance of switchgrass to extreme soil moisture stress: ecological implications. Plant Sci. 177, 724–732. doi: 10.1016/j.plantsci.2009.09.003
Chaves, M. M., Maroco, J. P., and Pereira, J. S. (2003). Understanding plant responses to drought - from genes to the whole plant. Funct. Plant Biol. 30, 239–264. doi: 10.1071/FP02076
Davin, L. B., Patten, A. M., Jourdes, M., and Lewis, N. G. (2008). “Lignins: a twenty-first century challenge,” in Biomass Recalcitrance: Deconstructing the Plant Cell Wall for Bioenergy, ed M. E. Himmel (Oxford: Blackwell Publishing Ltd.), 93.
Earl, H. J., and Davis, R. F. (2003). Effect of drought stress on leaf and whole canopy radiation use efficiency and yield of maize. Agron. J. 95, 688–696. doi: 10.2134/agronj2003.0688
Eaves, J., and Eaves, S. (2007). Renewable corn-ethanol and energy security. Energy Policy 35, 5958–5963. doi: 10.1016/j.enpol.2007.06.026
Emerson, R., Hoover, A., Ray, A., Lacey, J., Cortez, M., Payne, C., et al. (2014). Drought effects on composition and yield for corn stover, mixed grasses, and Miscanthus as bioenergy feedstocks. Biofuels 5:17. doi: 10.1080/17597269.2014.913904
Farooq, M., Wahid, A., Kobayashi, N., Fujita, D., and Basra, S. (2009). “Plant drought stress: effects, mechanisms and management,” in Sustainable Agriculture, eds E. Lichtfouse, M. Navarrete, P. Debaeke, S. Véronique, C. Alberola (Dordrecht: Springer), 153–188.
Gill, J. R., Burks, P. S., Staggenborg, S. A., Odvody, G. N., Heiniger, R. W., Macoon, B., et al. (2014). Yield results and stability analysis from the sorghum regional biomass feedstock trial. Bioenergy Res. 7, 1026–1034. doi: 10.1007/s12155-014-9445-5
Hamilton, E. W., and Heckathorn, S. A. (2001). Mitochondrial adaptations to NaCl. Complex I is protected by anti-oxidants and small heat shock proteins, whereas complex II is protected by proline and betaine. Plant Physiol. 126, 1266–1274. doi: 10.1104/pp.126.3.1266
Hansen, J., Sato, M., and Ruedy, R. (2012). Perception of climate change. Proc. Natl. Acad. Sci. U.S.A. 109, E2415–E2423. doi: 10.1073/pnas.1205276109
Heaton, E., Voigt, T., and Long, S. P. (2004). A quantitative review comparing the yields of two candidate C-4 perennial biomass crops in relation to nitrogen, temperature and water. Biomass Bioener. 27, 21–30. doi: 10.1016/j.biombioe.2003.10.005
Hong, C. O., Owens, V. N., Bransby, D., Farris, R., Fike, J., Heaton, E., et al. (2014). Switchgrass response to nitrogen fertilizer across diverse environments in the USA: a regional feedstock partnership report. Bioenergy Res. 7, 777–788. doi: 10.1007/s12155-014-9484-y
Horst, G. L., and Nelson, C. J. (1979). Compensatory growth of tall fescue following drought. Agron. J. 71, 559–563. doi: 10.2134/agronj1979.00021962007100040010x
Humbird, D., Davis, R., Tao, L., Kinchin, C., Hsu, D., Aden, A., et al. (2011). Process Design and Economics for Biochemical Conversion of Lignocellulosic Biomass to Ethanol. Dilute-acid Pretreatment and Enzymatic Hydrolysis of Corn Stover, (NREL/TP-5100–47764), National Renewable Energy Laboratory, Golden, CO.
Iannucci, A., Rascio, A., Russo, M., Di Fonzo, N., and Martiniello, P. (2000). Physiological responses to water stress following a conditioning period in berseem clover. Plant Soil 223, 219–229. doi: 10.1023/A:1004842927653
Kang, Y., Han, Y., Torres-Jerez, I., Wang, M., Tang, Y., Monteros, M., et al. (2011). System responses to long-term drought and re-watering of two contrasting alfalfa varieties. Plant J. 68, 871–889. doi: 10.1111/j.1365-313X.2011.04738.x
Karp, A., and Shield, I. (2008). Bioenergy from plants and the sustainable yield challenge. New Phytol. 179, 15–32. doi: 10.1111/j.1469-8137.2008.02432.x
Karsten, H., and MacAdam, J. W. (2001). Effect of drought on growth, carbohydrates, and soil water use by perennial ryegrass, tall fescue, and white clover. Crop Sci. 41, 156–166. doi: 10.2135/cropsci2001.411156x
Kenney, K. L., Smith, W. A., Gresham, G. L., and Westover, T. L. (2013). Understanding biomass feedstock variability. Biofuels 4:17. doi: 10.4155/bfs.12.83
Keyvan, S. (2010). The effects of drought stress on yield, relative water content, proline, soluble carbohydrates and chlorophyll of bread wheat cultivars. J. Anim. Plant Sci. 8, 1051–1060.
Koch, K. (1996). Carbohydrate-modulated gene expression in plants. Annu. Rev. Plant Biol. 47, 509–540. doi: 10.1146/annurev.arplant.47.1.509
Langholtz, M., Webb, E., Preston, B. L., Turhollow, A., Breuer, N., Eaton, L., et al. (2014). Climate risk management for the US cellulosic biofuels supply chain. Clim. Risk Manage. 3, 96–115. doi: 10.1016/j.crm.2014.05.001
Lee, D., Aberle, E., Chen, C., Egenolf, J., Harmoney, K., Kakani, G., et al. (2013). Nitrogen and harvest management of Conservation Reserve Program (CRP) grassland for sustainable biomass feedstock production. Glob. Change Biol. Bioenerg. 5, 6–15. doi: 10.1111/j.1757-1707.2012.01177.x
Lewandowski, I., Scurlock, J. M. O., Lindvall, E., and Christou, M. (2003). The development and current status of perennial rhizomatous grasses as energy crops in the US and Europe. Biomass Bioenerg. 25, 335–361. doi: 10.1016/S0961-9534(03)00030-8
Li, C., Aston, J. E., Lacey, J. A., Thompson, V. S., and Thompson, D. N. (2016). Impact of feedstock quality and variation on biochemical and thermochemical conversion. Renew. Sustain. Energy Rev. 65, 525–536. doi: 10.1016/j.rser.2016.06.063
Lipiec, J., Doussan, C., Nosalewicz, A., and Kondracka, K. (2013). Effect of drought and heat stresses on plant growth and yield: a review. Int. Agrophys. 27, 463–477. doi: 10.2478/intag-2013-0017
Liu, X., and Huang, B. (2000). Heat stress injury in relation to membrane lipid peroxidation in creeping bentgrass. Crop Sci. 40, 503–510. doi: 10.2135/cropsci2000.402503x
McLaughlin, S. B., and Kszos, L. A. (2005). Development of switchgrass (Panicum virgatum) as a bioenergy feedstock in the United States. Biomass Bioenerg. 28, 515–535. doi: 10.1016/j.biombioe.2004.05.006
Meyer, E., Aspinwall, M. J., Lowry, D. B., Palacio-Mejía, J. D., Logan, T. L., Fay, P. A., et al. (2014). Integrating transcriptional, metabolomic, and physiological responses to drought stress and recovery in switchgrass (Panicum virgatum L.). BMC Genomics 15:527. doi: 10.1186/1471-2164-15-527
Morrow, W. R. III., Gopal, A., Fitts, G., Lewis, S., Dale, L., et al. (2014). Feedstock loss from drought is a major economic risk for biofuel producers. Biomass Bioenerg. 69, 135–143. doi: 10.1016/j.biombioe.2014.05.006
Mostajeran, A., and Rahimi-Eichi, V. (2009). Effects of drought stress on growth and yield of rice (Oryza sativa L.) cultivars and accumulation of proline and soluble sugars in sheath and blades of their different ages leaves. Am. Euras. J. Agric. Environ. Sci. 5, 264–272.
Oliver, R. J., Finch, J. W., and Taylor, G. (2009). Second generation bioenergy crops and climate change: a review of the effects of elevated atmospheric CO2 and drought on water use and the implications for yield. Glob. Change Biol. Bioenerg. 1, 97–114. doi: 10.1111/j.1757-1707.2009.01011.x
Ong, R. G., Higbee, A., Bottoms, S., Dickinson, Q., Xie, D., Smith, S. A., et al. (2016). Inhibition of microbial biofuel production in drought-stressed switchgrass hydrolysate. Biotechnol. Biofuels 9, 237–250. doi: 10.1186/s13068-016-0657-0
Parrish, D., and Wolf, D. (1992). “Managing switchgrass for sustainable biomass production,” in Proc. Symp. Liquid Fuels From Renewable Resources (Nashville, TN), 13–14.
Peterson, T. C., Heim, R. R. Jr, Hirsch, R., Kaiser, D. P., Brooks, H., Diffenbaugh, N. S., et al. (2013). Monitoring and understanding changes in heat waves, cold waves, floods, and droughts in the United States: state of knowledge. Bull. Am. Meteorol. Soc. 94, 821–834. doi: 10.1175/BAMS-D-12-00066.1
Rippey, B. R. (2015). The U.S. drought of 2012. Weather Clim. Extrem. 10(Part A), 57–64. doi: 10.1016/j.wace.2015.10.004
Samarah, N. H. (2005). Effects of drought stress on growth and yield of barley. Agron. Sustain. Dev. 25, 145–149. doi: 10.1051/agro:2004064
Samuel, D., Ganesh, G., Yang, P. W., Chang, M. M., Wang, S. L., Hwang, K. C., et al. (2000). Proline inhibits aggregation during protein refolding. Protein Sci. 9, 344–352. doi: 10.1110/ps.9.2.344
Sanford, G. R., Oates, L. G., Jasrotia, P., Thelen, K. D., Robertson, G. P., and Jackson, R. D. (2016). Comparative productivity of alternative cellulosic bioenergy cropping systems in the North Central USA. Agric. Ecosyst. Environ. 216, 344–355. doi: 10.1016/j.agee.2015.10.018
Selig, M., Weiss, N., and Ji, Y. (2008). Enzymatic Saccharification of Lignocellulosic Biomass, Laboratory Analytical Procedure (LAP). Technical Report, NREL/TP-510–42629.
Sluiter, J. B., Ruiz, R. O., Scarlata, C. J., Sluiter, A. D., and Templeton, D. W. (2010). Compositional analysis of lignocellulosic feedstocks. 1. Review and description of methods. J. Agric. Food Chem. 58, 9043–9053. doi: 10.1021/jf1008023
Sokhansanj, S., Turhollow, A., Cushman, J., and Cundiff, J. (2002). Engineering aspects of collecting corn stover for bioenergy. Biomass Bioenerg. 23, 347–355. doi: 10.1016/S0961-9534(02)00063-6
Stone, K. C., Hunt, P. G., Cantrell, K. B., and Ro, K. S. (2010). The potential impacts of biomass feedstock production on water resource availability. Bioresour. Technol. 101, 2014–2025. doi: 10.1016/j.biortech.2009.10.037
Tao, L., Templeton, D. W., Humbird, D., and Aden, A. (2013). Effect of corn stover compositional variability on minimum ethanol selling price (MESP). Bioresour. Technol. 140, 426–430. doi: 10.1016/j.biortech.2013.04.083
Templeton, D. W., Scarlata, C. J., Sluiter, J. B., and Wolfrum, E. J. (2010). Compositional analysis of lignocellulosic feedstocks. 2. Method uncertainties. J. Agric. Food Chem. 58, 9054–9062. doi: 10.1021/jf100807b
Tilman, D., Hill, J., and Lehman, C. (2006). Carbon-negative biofuels from low-input high-diversity grassland biomass. Science 314, 1598–1600. doi: 10.1126/science.1133306
Tilman, D., Socolow, R., Foley, J. A., Hill, J., Larson, E., Lynd, L., et al. (2009). Beneficial biofuels—the food, energy, and environment trilemma. Science 325, 270–271. doi: 10.1126/science.1177970
Timpa, J. D., Burke, J. J., Quisenberry, J. E., and Wendt, C. W. (1986). Effects of Water Stress on the Organic Acid and Carbohydrate Compositions of Cotton Plants. Plant Physiol. 82, 724–728. doi: 10.1104/pp.82.3.724
Turhollow, A., Perlack, R., Eaton, L., Langholtz, M., Brandt, C., Downing, M., et al. (2014). The updated billion-ton resource assessment. Biomass Bioenerg. 70, 149–164. doi: 10.1016/j.biombioe.2014.09.007
Turner, L. (1990). The extent and pattern of osmotic adjustment in white clover (Trifolium repens L.) during the development of water stress. Ann. Bot. 66, 721–727. doi: 10.1093/oxfordjournals.aob.a088088
U. S. Department of Energy (2016). 2016 Billion-Ton Report: Advancing Domestic Resources for a Thriving Bioeconomy, Volume 1: Economic Availability of Feedstocks. Oak Ridge National Laboratory, Oak Ridge, TN, M.H. Langholtz, B.J. Stokes, and L.M. Eaton (Leads), ORNL/TM-2016/160, 448p.
Van Der Weijde, T., Huxley, L. M., Hawkins, S., Sembiring, E. H., Farrar, K., Dolstra, O., et al. (2017). Impact of drought stress on growth and quality of miscanthus for biofuel production. GCB Bioenerg. 9, 770–782. doi: 10.1111/gcbb.12382
Vijn, I., and Smeekens, S. (1999). Fructan: more than a reserve carbohydrate? Plant Physiol. 120, 351–360. doi: 10.1104/pp.120.2.351
Vincent, D., Lapierre, C., Pollet, B., Cornic, G., Negroni, L., and Zivy, M. (2005). Water deficits affect caffeate O-methyltransferase, lignification, and related enzymes in maize leaves. A proteomic investigation. Plant Physiol. 137, 949–960. doi: 10.1104/pp.104.050815
Wahid, A. (2007). Physiological implications of metabolite biosynthesis for net assimilation and heat-stress tolerance of sugarcane (Saccharum officinarum) sprouts. J. Plant Res. 120, 219–228. doi: 10.1007/s10265-006-0040-5
Walsh, M. E., Ugarte, D. G. D., Shapouri, H., and Slinsky, S. P. (2003). Bioenergy crop production in the United States - Potential quantities, land use changes, and economic impacts on the agricultural sector. Environ. Resour. Econ. 24, 313–333. doi: 10.1023/A:1023625519092
Wehner, M., Easterling, D. R., Lawrimore, J. H., Heim, R. R. Jr, Vose, R. S., and Santer, B. D. (2011). Projections of future drought in the continental United States and Mexico. J. Hydrometeorol. 12, 1359–1377. doi: 10.1175/2011JHM1351.1
Weiss, N. D., Farmer, J. D., and Schell, D. J. (2010). Impact of corn stover composition on hemicellulose conversion during dilute acid pretreatment and enzymatic cellulose digestibility of the pretreated solids. Bioresour. Technol. 101, 674–678. doi: 10.1016/j.biortech.2009.08.082
Williams, C. L., Westover, T. L., Emerson, R. M., Tumuluru, J. S., and Li, C. (2016). Sources of biomass feedstock variability and the potential impact on biofuels production. Bioenergy Res. 9, 1–14. doi: 10.1007/s12155-015-9694-y
Williams, I. N., Torn, M. S., Riley, W. J., and Wehner, M. F. (2014). Impacts of climate extremes on gross primary production under global warming. Environ. Res. Lett. 9, 1–10. doi: 10.1088/1748-9326/9/9/094011
Wolfrum, E. J., Ness, R. M., Nagle, N. J., Peterson, D. J., and Scarlata, C. J. (2013). A laboratory-scale pretreatment and hydrolysis assay for determination of reactivity in cellulosic biomass feedstocks. Biotechnol. Biofuels 6, 162–175. doi: 10.1186/1754-6834-6-162
Wright, L., and Turhollow, A. (2010). Switchgrass selection as a “model” bioenergy crop: a history of the process. Biomass Bioenerg. 34, 851–868. doi: 10.1016/j.biombioe.2010.01.030
Keywords: drought, conversion performance, composition, Miscanthus, switchgrass, tall fescue
Citation: Hoover A, Emerson R, Ray A, Stevens D, Morgan S, Cortez M, Kallenbach R, Sousek M, Farris R and Daubaras D (2018) Impact of Drought on Chemical Composition and Sugar Yields From Dilute-Acid Pretreatment and Enzymatic Hydrolysis of Miscanthus, a Tall Fescue Mixture, and Switchgrass. Front. Energy Res. 6:54. doi: 10.3389/fenrg.2018.00054
Received: 08 January 2018; Accepted: 30 May 2018;
Published: 19 June 2018.
Edited by:
Sachin Kumar, Sardar Swaran Singh National Institute of Renewable Energy, IndiaReviewed by:
Yaoping Zhang, University of Wisconsin-Madison, United StatesCopyright © 2018 Battelle Energy Alliance, LLC, contract manager for Idaho National Laboratory. This is an open-access article distributed under the terms of the Creative Commons Attribution License (CC BY). The use, distribution or reproduction in other forums is permitted, provided the original author(s) and the copyright owner are credited and that the original publication in this journal is cited, in accordance with accepted academic practice. No use, distribution or reproduction is permitted which does not comply with these terms.
*Correspondence: Amber Hoover, YW1iZXIuaG9vdmVyQGlubC5nb3Y=
Disclaimer: All claims expressed in this article are solely those of the authors and do not necessarily represent those of their affiliated organizations, or those of the publisher, the editors and the reviewers. Any product that may be evaluated in this article or claim that may be made by its manufacturer is not guaranteed or endorsed by the publisher.
Research integrity at Frontiers
Learn more about the work of our research integrity team to safeguard the quality of each article we publish.