- 1Centre for Product and Process Development (ZPP), Zurich University of Applied Sciences (ZHAW), Winterthur, Switzerland
- 2Institute of Materials and Process Engineering (IMPE), Zurich University of Applied Sciences (ZHAW), Winterthur, Switzerland
The Swiss government has signed the Paris Climate Agreement and various measures need to be implemented in order to reach the target of a 50% reduction in CO2 emissions in Switzerland by 2030 compared with the value for 1990. Considering the fact that the production of cement in Switzerland accounts around 2.5 million ton for CO2 emissions of which corresponds to roughly 7% of the country’s total CO2 emissions, the following article examines how this amount could be put to meaningful use in order to create a new value-added chain through CO2 methanation, and thus reduce the consumption and import of fossil fuels in Switzerland. With power-to-gas technology, this CO2, along with regenerative hydrogen from photovoltaics, can be converted into methane, which can then be fed into the existing natural-gas grid. This economic case study shows a cost prediction for conversion of all the CO2 from the cement industry into methane by using the technologies available today in order to replacing fossil methane imports.
Introduction
The Climate Background
The Climate Agreement negotiated in Paris came into force on November 4, 2016. The community laid down in this agreement that, up until 2030, there would have to be a 50% reduction in the emission of greenhouse gas compared with 1990 (Schweizerischer Bundesrat, 2016). Switzerland has signed the Paris Agreement and, through its Federal Council, has proposed ratifying it in the course of 2017 (Akademien der Wissenschaften Schweiz, 2017). The key statistics from 1990 and 2015 as well as the defined targets of Switzerland are listed in Table 1 and shown in Figure 1.
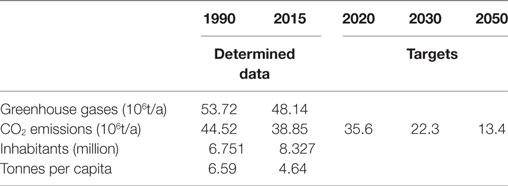
Table 1. Survey of the greenhouse gas and carbon dioxide emissions of Switzerland, population figures, and the determination of the output per capita (Bundesamt für Statistik, 2016; Bundesamt für Umwelt, 2017).
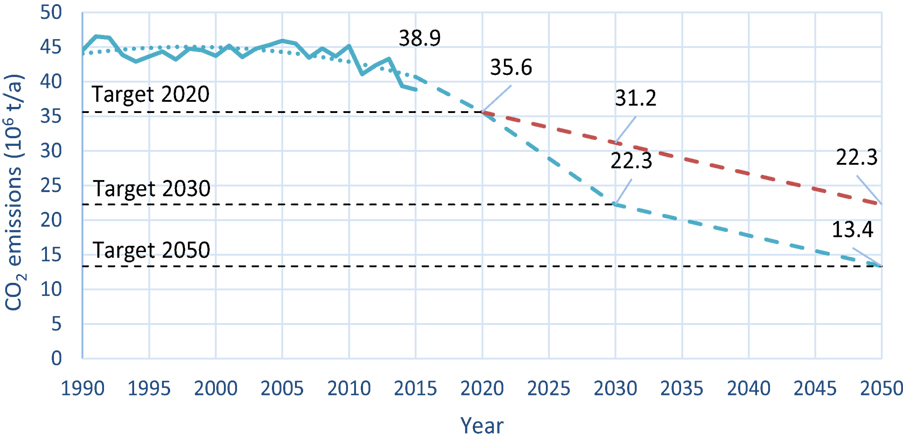
Figure 1. Trend in CO2 emissions resulting from the values laid down in the CO2 Act and also the Paris Climate Agreement. The blue line describes the real carbon dioxide emissions. Given the fluctuating figure, in particular between 2009 and 2015, the pattern of CO2 emissions has been smoothed between 1990 and 2015 (blue dotted line). The dashed lines describe the targets of the Paris Agreement (red: emissions within Switzerland and blue: include additional foreign measures) (Eidgenössisches Departement für Umwelt, 2016).
For the interested reader: In 2015, Switzerland ranked 23rd in the world with a per-capita output of 4.64 ton of CO2. In comparison, China, the world’s largest carbon emitter, has a per capita output of 6.59 ton, Germany 9.6 ton, and Qatar has an output of 35.77 tons per capita (Statista, 2017a; Umweltbundesamt, 2017). In Switzerland’s case, it is planned to achieve the target of a 50% reduction through 30% domestic measures and 20% foreign ones (Bundesamt für Umwelt, 2016). In addition, to showing the trend in CO2 emissions over recent years, Figure 1 indicates the future aims up to 2050. The shape of the curve is based on the aim of a 70% reduction, what is the most conservative assumption.
The curve points to the reduction in emissions inside Switzerland contributing to approximately 50% up to 2050. If further foreign measures were to be planned for 2030 and later, the final value inside Switzerland would be higher than 22.26 million ton. An emission target of zero inside Switzerland is thus excluded from the outset.
Origins of CO2 Sources in Switzerland
Figure 2 gives an overview on the distribution of the various CO2 emitters in Switzerland without gray emissions (Bundesamt für Umwelt, 2017).
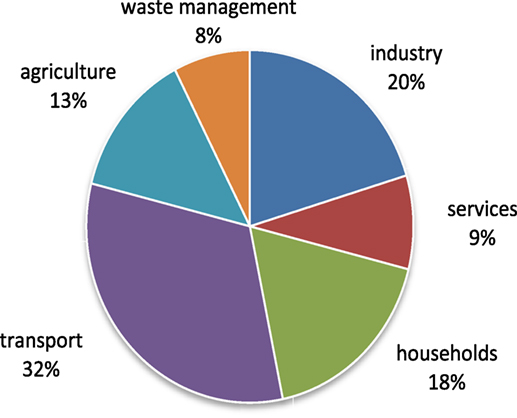
Figure 2. Distribution and percentage shares of the CO2 emitters in Switzerland in 2015 (Bundesamt für Umwelt, 2017).
Although the emission of CO2 is highly decentralized and irregular in the sectors of transport, households, services, and agriculture, emissions in the sectors of industry and waste management occur in large quantities both centrally and continuously. Particularly in industrial processes where CO2 emissions cannot currently be reduced through either substitution or renunciation, it would make sense to feed the emissions into Swiss power-to-gas and produce a reusable waste product. Therefore, this article deals with making use of the climate-damaging gas CO2 for producing a renewable energy vector, i.e., methane (CH4) by applying the well-known Sabatier reaction for a power-to-gas application (Sabatier and Senderens, 1902) and substitute fossil imports (c.f. chapter about technical considerations).
The Cement Industry and CO2 Emissions
In 2015, the industry sector itself alone emitted 7.5 million ton of carbon dioxide. After waste incineration the cement industry, with an output of 2.5 million ton CO2 is the second largest emitter in the industrial sector (E-PRTR, 2017). The waste gas (20–35% CO2 in variable N2 to O2 ratios) emitted by the cement industry is made up, firstly, of the CO2 from the combustion process (38.5%) and, secondly, from the CaCO3 dissociation of the feedstock (61.5%) (Locher, 2000). However, using these 2.5 million ton of mainly unavoidable CO2 would offer a possibility to replace large amounts of natural gas and reduce fossil imports with corresponding emissions.
In Switzerland, there are six large-scale installations for the production of cement. Given its centralized structure and the continuous occurrence of CO2 emissions, it is this industrial sector that is particularly appropriate for the downstream addition of power-to-gas plants for converting CO2 to methane in large quantities. Second, the process intrinsic high calcination temperatures (above 1,200°C) necessary for the CaCO3 processing are an ideal source of heat for some novel methanation reactor concepts, which are not self-sustaining at about 300°C. An additional source of heat can be avoided, what is a substantial economic benefit.
As remark to the reader, cement industry is conscious of the fact that it emits large amounts of CO2 and has been following various strategies for many years to counter these emissions. Measures implemented up until 2010 resulted in a reduction from 3.85 to 2.9 million ton CO2 a total cut of 25% in emissions (Eidgenössiches Departement für Umwelt, 2003; E-PRTR, 2017). Since only limited possibilities for further process optimizations are still available and since no alternative building material is going to exist for the near future, it is going to be necessary to consider additional approaches to reducing the high levels of CO2 emissions or to putting these to other uses. The here proposed reuse of the emitted CO2 in terms of its conversion to CH4 is one possible scenario to do so.
Power-to-Gas and its Role in CO2 Reduction
Power-to-gas technology offers the possibility of using technical or electrochemical conversion processes by use of electricity from renewable sources to produce hydrogen (H2), thereby turning the electric energy into a chemical energy carrier, such as H2 or subsequently to methane (CH4) that can be long-term stored for any period of time until it is needed again for use (Specht et al., 2010). The production of pure hydrogen faces challenges in the domains of storage, transport and shortage of consumers. Given the characteristics of the equipment currently installed by the end consumers, it is neither possible nor legally permissible to add large amounts of hydrogen to the natural-gas supply (max. 2 vol% H2), because a higher percentage of hydrogen in natural gas changes the gas feed, flame conditions and combustion properties, which strongly influences the operation of the end consumer devices.
In the case of the here presented Swiss power-to-gas model, the hydrogen produced is put to further use and reacted with carbon dioxide (CO2) to form methane, which is simpler to handle and transport. This process, which is also known as CO2 methanation, is already in use today in small to medium-sized installations (Zapf, 2017).
Figure 3 illustrates the process for the model subject to an economic investigation in this study. The only technologies included here, were technologies that are already technically mature today. The authors clearly want to state here, that this examination is focusing exclusively on power from photovoltaic (PV), since further PV installations are feasible in Switzerland, while, e.g., hydro and wind power has very limited potential to be further increased or installed. Furthermore, there are several alternative technologies which may be taken into account. But for the sake of a definite energy value chain, it is not further spread to other technologies. One example of this is large-scale electrolysis, which uses an alkaline electrolysis (AEL), a technology which provides since decades sufficient lifetimes and large hydrogen production rates (90,000 h with up to 750 m3/h) (Carmo et al., 2013). It might be based on polymer electrolyte membrane (PEM) technology in future at such large scales. However, it is believed that at an industrial scale, as it is evaluated here, PEM electrolysis is nowadays still not the most reliable path (Götz et al., 2016). Table 2 provides a brief comparison of AEL and PEM electrolysis with the main advantages and disadvantages for the interested reader.
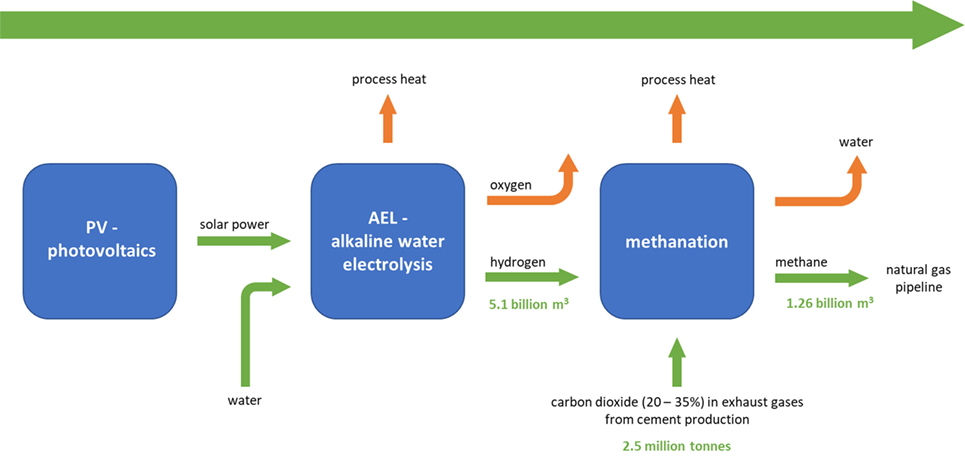
Figure 3. Illustration of the power-to-gas process for cement based CO2 emissions (Fischedick, 2015).
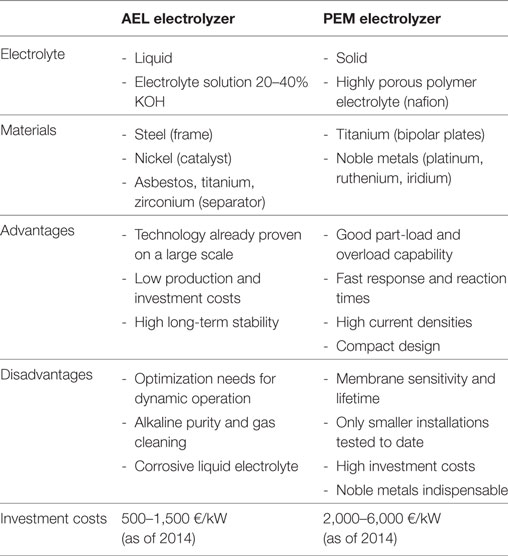
Table 2. Comparison of AEL and PEM (Schiller, 2012; Carmo et al., 2013; Zapf, 2017).
General Technical Considerations for the Applied Model
The authors investigated a possible and reliable way for the production of methane with commercially available technologies from CO2 emissions of the cement industry (Figure 3) (Matter et al., 2016).
In the scenario considered here, the electricity needed for operation of the alkaline electrolyzer is generated by conventional PV modules, attached to potentially appropriate roof surfaces (about 140 km2 in Switzerland) or on suitable facades (50 km2) (International Energy Agency, 2002; Akademien der Wissenschaften Schweiz, 2012). The technology used for electrochemical water splitting is the abovementioned AEL with the following reactions and characteristics (Zapf, 2017):
Once the hydrogen has been produced, it can be converted into methane by reacting it with CO2 in a catalytic fixed-bed reactor at atmospheric pressure according to the Sabatier reaction in Eq. 4. Atmospheric pressure is assumed here from the authors, since recent developments in catalysis showed methane yields up to 100% already at atmospheric pressure (Delmelle et al., 2016). By this, the compression energy is also significantly lower since only methane must be compressed to natural gas grid pressure instead of CO2 and H2, which needs five times more compression energy and a H2 suitable technology. The reaction of CO2 and H2 to form methane via the Sabatier reaction runs at temperatures of between 200 and 700°C and pressures from atmosphere up to 80 bar depending on the type of reactor and catalyst (Kopyscinski et al., 2010; Schaaf et al., 2014).
The supply of CO2 comes from the process of separating the cement exhaust waste gases. While CO2 concentration in the exhaust is between 20 and 35% (Fischedick, 2015), typical separation costs arise of about 35 CHF/t CO2 (European Cement Research Academy, 2009). Methane, produced from this purified CO2, has a composition corresponding to natural methane and can be stored as an interim measure in the gas grid and retrieved as needed. Switzerland’s gas grid is fundamentally designed to distribute natural gas rather than to store it in large quantities. In normal circumstances, a maximum of 2.7 million m3 can be accommodated in various storage devices. Thanks to good interconnections with the gas networks of neighboring countries, it is, however, possible to store considerably greater volumes of natural gas. The storage capacity of the Switzerland’s next neighbors are, e.g., Germany with 19.2 billion m3 and Italy with 17.4 billion m3 (Hochschule für Technik Rapperswil, 2014).
It is further recommended that the hydrogen production and methanation plant itself be installed in the immediate vicinity of the CO2 emitters in order to minimize the problems and costs associated with the transport of hydrogen and CO2. The entire design of the plant later on and the calculation of the costs associated with it are based on the fact that PV generation of electricity in Switzerland is only available for approximately 1,200 h per year (Verband Schweizer Elektrizitätsunternehmen VSE, 2015; Statista, 2017b). That means that the plant must be operated in standby mode for the rest of the 7,560 h. It is to mention here, that a plant in existence today has not been designed for on/off operation. Operating at full load for only 1,200 h a year, which is assumed for the purpose of this study, might have negative effects on the degree of efficiency, gas quality, gas production, and service life of the plant.
Energy Losses and Efficiencies
Each energy conversion step represents a technical process that is subject to a loss of efficiency. Table 3 shows the bandwidth between the best and worst case for the entire facility, both with and without the PVs. The technologies available today result, in dependency of the applied process chain, in an overall efficiency of between 41 and 65% as worst case and best case scenario (Stolten and Krieg, 2010; Schnurbein, 2012).

Table 3. Typical efficiency values and chain efficiency of the overall power-to-gas processes by provision of solar electricity according to Stolten and Krieg (2010) and Schnurbein (2012).
It might be possible to achieve further optimization of overall efficiency by using energy and mass flows between the individual process steps, for instance by using the waste heat from methanation for electrolysis. The interested reader may get further details from current research projects such as the Swiss “High Efficiency Power-to-Gas Plant” and EU project “Pentagon” (Institut für Energietechnik—HSR, 2017; Pentagon, 2017), integrating high temperature solid oxide electrolyzer cells into a demonstration plant.
Mass Flow Consideration
To calculate the annual masses of the reactants of CO2 (MCO2 = 44.01 g/mol), H2 (MH2 = 2.02 g/mol) as well as of the products CH4 (MCH4 = 16.05 g/mol) and H2O (MHH2O = 18.02 g/mol) (Wächter, 2012), one can simply scale up the stoichiometric reaction from Eqs. 1–4 to the addressed 2.5 million ton of CO2 from cement industry. The resulting mass flows in terms of per reaction and per cement plant and year are shown in Table 4. The methanation of these annual 2.5 million ton CO2 from the year 2015 requires 0.46 million ton of H2 (5.08 billion m3/a), which have to be produced through electrolysis. The reaction products are 0.9 million ton (1.26 billion m3/a) of CH4 and 2.04 million ton of H2O. This amount of methane produced corresponds to roughly 33% of the annual consumption of natural gas in Switzerland, which is as high as 119,420 TJ (3.821 billion m3/a) (Fachagentur Nachwachsende Rohstoffe e.V.—FNR, 2016; Verband der Schweizerischen Gasindustrie – VSG, 2017). By comparison with that, in 2015 Germany produced 3.8 million m3/a of CH4 by chemical methanation (Zapf, 2017).
For the needed 0.46 million ton of H2, the electrolyzer consumes 4.1 million ton of fresh and deionized water and produces another 3.6 million ton of oxygen (O2) according to Eq. 3 and Table 5. Further use and economic aspects of the oxygen as well as a possible water circulation from the methanation to the electrolyzer to compensate the water consumption were not considered in this study. If a suitable consumer for the oxygen would be available, e.g., ozone-based purification of waste water in sewage-treatment facilities, it might have a positive impact on the economic perspective. But the water purification process itself will have a negative economic impact.

Table 5. Overview of mass flows in electrolysis on a molar level and industry level for 2.5 million ton of CO2.
Energetic Consideration for H2 Production by AEL and its Conversion to CH4
The reaction in the electrolyzer as mentioned above is strongly endothermic and requires a great deal of energy to split water into H2 and O2. The specific energy consumption of an alkaline electrolyzer is given as 4.2 kWh/m3 and 4.7 kWh/m3 of H2 including the power electronics, respectively (Noack et al., 2015). For the production of a total mass of 0.46 million ton of H2, corresponding to 5.1 billion m3 (ρH2 = 0.0899 kg/m3), the necessary annual energy input is 23,900 GWh. Expressed in terms of the lower heating value or net calorific value (NCV) of H2 (Hi = 3.00 kWh/m3), the output amounts to 15,255 GWh, with an average electrolyzer efficiency of about 64%.
The subsequent conversion of this H2 with CO2 is assumed to take place at ambient pressure and 300°C, since these conditions are technically feasible to reach 100% CO2 conversion with state-of-the-art for common nickel catalysts (Delmelle et al., 2016). The authors furthermore assumed for this case study that compression of one unit of CH4 is more efficient and more economic than compressing 5 units of reactant gasses under stoichiometric conditions, i.e., 4 units H2 and one unit of CO2 and therefore, compression on gas grid conditions takes place after methanation. Despite that, an additional electrical energy of 0.4 kWh/m3 synthetic natural gas (Zapf, 2017) is calculated to heat the CO2 and H2 mixture (1:4) up to 300°C for the catalytic reaction. In best case, this energy can be saved, if exhaust heat from the cement kiln can be recuperated and used for this heating purpose.
Costs Estimation for the Power-to-Gas Model
As a general remark prior to the detailed cost analyses, is has to be mentioned that the cost calculation is based on the net present value method (Staehelin et al., 2007). The interest rate was set at 3.5% and the investment period has been fixed at 30 years.
Photovoltaics
According to the considerations made in 2.3 the annual energy needed for producing hydrogen via PV amounts to 24,403 GWh/a, from which 23,900 GWh are for electrolysis to receive H2 and 503 GWh for the conversion to CH4. Losses of about 5% occur in the inverter system, therefore, the system must be designed for 25,095 GWh/a. The following calculations that are summarized in Table 6, assume a PV module efficiency of 16%, but a loss of about 20% of the output in the course of a service life of 30 years has to be considered (Meyer Burger, 2017). For this reason, the plant was oversized by a further 10% to balance these losses off, and finally the whole system needs to be dimensioned for 27,604 GWh/a. With an operation of 1,200 full load hours per year a necessary system performance of 23 GW results. While the peak output per unit area of present-day modules is about 0.23 kW/m2 (Meyer Burger, 2017) an overall surface area of 100 km2 is required for the installation of these modules. One should know, that the roof area that can sensibly used for PVs in Switzerland is indicated as 100–150 km2 (Akademien der Wissenschaften Schweiz, 2012).
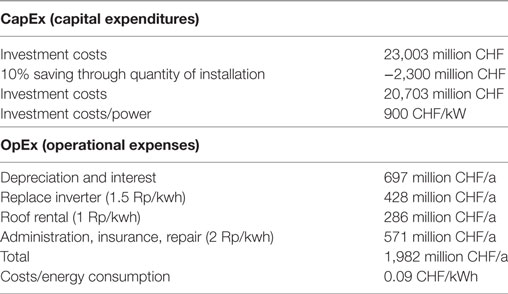
Table 6. Breakdown of the costs for the photovoltaic plant for a total installed plant power of 23 GW.
To calculate the investment costs, the first step is to estimate 1,000 CHF/kW of installed capacity (Mayer, 2015; Arnold et al., 2016). Considering the quantity of the installations involved and the resulting effective economies of scale, a 10% reduction is a commonly applicable reduction for the investment costs (Noack et al., 2015). The investment costs or capital expenditures (CapEx) for all the PV installations therefore amount to 20,703 million CHF.
The operating costs or operating expenditures (OpEx) consist of the cost depreciation and interest (697 million CHF/a), replacing the inverters twice during the total running time (428 million CHF/a), the roof rent (286 million CHF/a), as well as other costs such as administration, insurance, repair, cleaning and control (571 million CHF/a) (Baumgartner et al., 2015). Together, OpEx costs are 1,982 million CHF/a and for an annual production of 25,095 GWh/a mean operating costs are assumed to 0.09 CHF/kWh (c.f. Table 6).
Alkaline Electrolysis
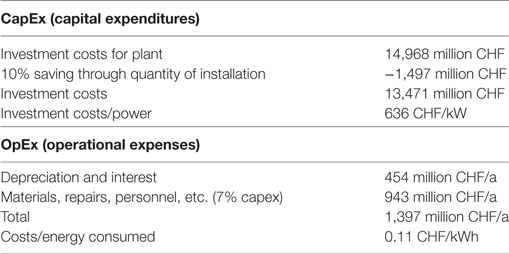
The economic appraisal for the AEL design is based on data of the German Aerospace Center (DLR) in its study into planning a demonstration plant for the production of hydrogen (Noack et al., 2015). The DLR study is evaluating plants designed for two different sizes, 5 and 100 MW, respectively. The cost estimation presented in this study is based on the data for a 100 MW plant, with an amortization time of 30 years. With a hydrogen production rate of 20,000 m3/h, which is typical for plant of this size and with the plant operating time of 1,200 h/a, the annual H2 production rate is 24 million m3. For production of the annual amount of 5.1 billion m3 of hydrogen calculated above, 212 installations like this are needed to reach a power of 21,188 MW. The DLR report indicates the investment costs for a 100 MW plant as being 52.1 million EUR or 56.5 million CHF (exchange rate used for the calculation: 1 EUR = 1.084 CHF from May 2017). The total investment sum for all 212 plants is 14,968 million CHF. Under consideration of a 10% cost reduction attributable to economies of scale, the necessary investments for the alkaline electrolyzers are 13,471 million CHF. With an overall system output of 21,188 MW, the result is 636 CHF/kW. In addition to the costs for depreciation and interests (454 million CHF/a), another 7% of the investment costs are estimated for the OpEx costs. The major part of these costs is the exchange of components in the electrolyzer at an interval of 8 years. In addition, there are costs for cleaning, evaluation and administration, summing up to 943 million CHF/a. The mean operating costs are assumed to 1,397 million CHF/a or 0.11 CHF/kWh (listed in Table 7).
Methanation
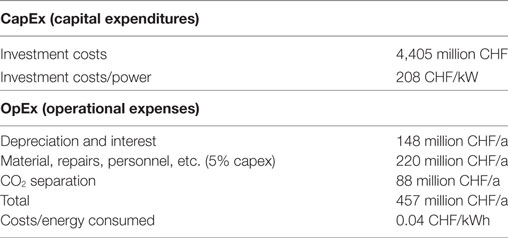
The cost estimation of the methanation process is based on today’s plants with a power consumption of up to 5 MW. These plants are generally composed of electrolyzers and methanation collectors. Based on this configuration, the cost of the methanation part is estimated to be between 208 and 440 CHF/kW (Zapf, 2017). Given the expected scale effects due to the enormous project size, the most optimistic value of 208 CHF/kW is used for further calculations and the resulting investment is 4,405 million CHF.
The costs for depreciation and interests are 148 million CHF/a. Due to a lack of experience, especially over long periods of time, there is currently little usable data available. However, various plant builders estimate a range of 1–3% of investment costs. A safety margin of 5% is additionally used and sum up to a total of 220 million CHF, required for the operation of the plants. These costs include the replacement of the catalysts, the cooling media and the handling of the necessary water. Another 88 million CHF/a are included the separation of CO2 from the exhaust gases of the cement industry (32.6 €/t CO2; Hermann et al., 2014; Schaaf et al., 2014). In summary, operating costs for the methanation plant add up to a total of 457 million CHF/a or 0.04 CHF/kWh (Table 8).
Is has to be mentioned explicitly that neither the waste heat of the methanation process at 300°C affects the cost estimation, since the methanation is expected to be heated from the exhaust heat of a cement kiln. Nor is the water produced catalytically during the methanation processes taken into account. In the best case, this relatively pure water can be recirculated to the electrolysis and used a water source. From an engineering point of view, a heat and mass flow exchange between two complex systems increases the system complexity even more. Therefore, the extent to which heat and water can be used as input into the electrolysis and how great the resulting benefit is, need to be clarified elsewhere. Decoupling the methanation processes from the electrolysis through the possible interim storage of the H2 may be a possible solution for better use of the electricity and for coping with the problems of modulating operation, but this additional infrastructure was not included in this activity.
Overall Costs
Everything considered, the investment volume required for the power-to-gas process in terms of an annual 2.5 million ton of CO2 conversion to methane amounts to CHF 38,579 million CHF. The annual operating costs are highest at 1,982 million CHF for PVs. Next come the operating costs for AEL at 1,397 million CHF, while methanation accounts for a further 457 million CHF per annum, including 88 million CHF/a for CO2 separation from the cement kiln exhaust gas. Additional annual operating costs for the whole plant have to be considered and amount to a total of 3,836 million CHF per annum. The overall economic calculations of the individual processes are aggregated in Table 9.
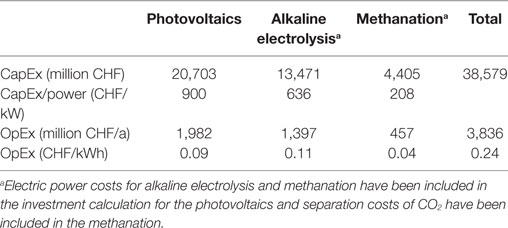
Table 9. Costs of the power-to-gas concept for the twofold use of CO2 from Swiss cement works, process chain: photovoltaics, alkaline electrolysis, and methanation.
For an annual processing of 2.5 million ton of CO2 from cement industry, the resulting costs per tonne of CO2 are about 1,500 CHF. 1.26 billion m3 of renewable methane are produced during the processing of the carbon dioxide. This results in methane costs of 3 CHF/m3 and 0.30 CHF/kWh, respectively. Costs related to the transport and storage of hydrogen as well as the feed-in costs of methane into the natural gas network were not included in this calculation. The energy price published for natural gas for 2016 was 0.084 CHF/kWh. Without including the conversion factor and taking the NCV of methane of 9.97 kWh/m3, the costs are calculated to be 0.84 CHF/m3. Consuming 1.26 billion m3 of methane from the natural-gas grid therefore costs 1.059 billion CHF a year. Synthetically produced methane from the power-to-gas process thus costs 3.6 times more than fossil methane costs.
These costs do vary with the economic assumptions, especially on such as electricity prices or PV operation hours per year for the H2 production. However, overall costs of 0.30 CHF/kWh for synthetic methane from cement based CO2 under the specific Swiss conditions, still is in the range of 0.07–0.42 CHF/kWh reported elsewhere (Brunner and Thomas, 2014; E and E Consultant, 2014; Graf et al., 2014; Ausfelder et al., 2015; Hannula, 2015; Vandewalle et al., 2015). These values strongly depend on the plant scale and technology maturity.
Conclusion
Within the current energy turnaround activities in Switzerland a huge momentum for a similar reduction of CO2 emissions and replacement of fossil fuels is given, if locally available CO2-rich sources like the 2.5 million ton of CO2 per year from the Swiss cement kiln plants are converted into transportable and storable methane under the use of renewable H2. This study examined the costs of applying the current state-of-the-art technologies for a large-scale CO2 methanation process. Since the CO2 emissions from Swiss cement industry are classified to a large amount as unavoidable geogenous CO2 and are emitted by only six large plants, these centralized sources of CO2 are favored in this study.
Using the technology chain of PV, AEL, and catalytic methanation for the investigated CO2 valorization path, it is possible to produce 0.9 million ton or 1.26 billion m3 of synthetic CH4 per year by applying the CO2 from the exhaust gases of all cement plants. Not less than 32.9% of the annually required 3.82 billion m3 of natural gas imports could be compensated by the produced CH4, thus reducing the CO2 emission from natural gas by the same amount of 32.9%.
The investment costs of the whole power-to-methane infrastructure amount to a total of 38,579 million CHF. This comprises installation costs of 20,703 million CHF for electricity generation by PVs, 13,471 million CHF for AEL and another 4,405 million CHF are required for the installation of the methanation plants itself.
Besides these installation costs annual running expenses have to be considered. Separation and conversion of the annually emitted 2.5 million ton of CO2 to 0.9 million ton CH4 are estimated at 3,836 million CHF per annum. The highest individual costs are 1,982 million CHF per year for the production of the electricity by PVs (51.7%), followed by 1,397 million CHF/a for AEL (36.4%) and 457 million CHF/a for the methanation (11.9%).
It is believed that the calculated investment volume of 38,579 million CHF and additional annual maintenance and operation costs of 3,836 million CHF can be judged as feasible for an energy economy such as in Switzerland. However, the economic appraisal shows that the costs estimation is about 1,500 CHF per ton of CO2. Compared with that, a tonne of CO2 is currently sold for only 5.43 CHF in international CO2 trade (as per March 2017). In the light of this economic fact in combination with the unclear regulative situation and taxing system such as bonus and malus on renewable fuels and CO2 certificates, a governmental reassessment of the economic conditions is recommended for a successful energy transition strategy.
Author Contributions
The corresponding author (AH) confirms that all listed authors (AH, GS, and JB) were involved in data acquisition, writing, proof reading and processing of this research article.
Conflict of Interest Statement
The authors declare that the research was conducted in the absence of any commercial or financial relationships that could be construed as a potential conflict of interest.
Funding
The authors are grateful for the financial support provided by the Swiss National Science Foundation (SNSF) within the National Research Programme “Energy Turnaround” (NRP 70). Further information on the National Research Programme can be found at www.nrp70.ch. Our thanks to Madeleine Gut for her valuable contribution.
References
Akademien der Wissenschaften Schweiz. (2012). Zukunft Stromversorgung Schweiz. Bern: Akademien der Wissenschaften Schweiz.
Akademien der Wissenschaften Schweiz. (2017). Übereinkommen von Paris vermindert Klimafolgen in der Schweiz spürbar. Available at: https://naturwissenschaften.ch/service/news/86717-uebereinkommen-von-paris-vermindert-klimafolgen-in-der-schweiz-spuerbar
Arnold, M., Konersmann, L., Wanner, A., Suter, M., et al. (2016). Energie Zukunft Schweiz—PV-Preisumfrage 2015. Available at: https://energiezukunftschweiz.ch/wAssets/docs/news/14682212212016_PV_Preisumfrage_Bericht.pdf
Ausfelder, F., Beilmann, C., Bertau, M., Br€auninger, S., Heinzel, A., Hoer, R., et al. (2015). Energiespeicherung als Element einer sicheren Energieversorgung. Chem. Ing. Tech. 87, 17–89. doi: 10.1002/cite.201400183
Baumgartner, F., Toggweiler, P., Sanches, D., Maier, O., and Schär, D. (2015). Betriebskosten von PV-Anlagen—Zwischenergebnisse per 1. Basel: ZHAW.
Brunner, C., and Thomas, A. (2014). Gasnetzanalysen und Wirtschaftlichkeitsbetrachtung. Energie Wasserpraxis 65, 56–59.
Bundesamt für Statistik. (2016). Die Bevölkerung der Schweiz 2015. Available at: https://www.bfs.admin.ch/bfs/de/home/statistiken/bevoelkerung.assetdetail.1401562.html
Bundesamt für Umwelt. (2016). Vernehmlassung vom 31.08.2016—30.11.2016 über die zukünftige Klimapolitik der Schweiz. Available at: https://www.bafu.admin.ch/bafu/de/home/themen/klima/recht/vernehmlassungen/vernehmlassung-vom-31-08-2016-30-11-2016-ueber-die-zukuenftige-k.html
Bundesamt für Umwelt. (2017). Treibhausgasemissionen in der Schweiz. Available at:https://www.bfs.admin.ch/bfs/de/home/statistiken/querschnittsthemen/wohlfahrtsmessung/indikatoren/luftqualitaet.assetdetail.3362335.html
Carmo, M., Fritz, D., Mergel, J., and Stolten, D. (2013). A comprehensive review on PEM water electrolysis. J Hydrogen Energy 38, 4901. doi:10.1016/j.ijhydene.2013.01.151
Delmelle, R., Duarte, R. B., Franken, T., Holzer, L., Burgschulte, A., and Heel, A. (2016). Development of improved nickel catalysts for sorption enhanced CO2 methanation. Int. J. Hydrogen Energy 41, 20185–20191. doi:10.1016/j.ijhydene.2016.09.045
E and E Consultant. (2014). Etude portant sur l’hydrogene et la methanation comme procede de valorisation de l’electricite excedentaire. Cassel, France. Available at: http://www.grtgaz.com/fileadmin/engagements/documents/fr/Powerto-Gas-etude-ADEME-GRTgaz-GrDF-complete.pdf
Eidgenössiches Departement für Umwelt. (2003). Verkehr, Energie und Kommunikation, CO2-Zielvereinbarung mit der Zementindustrie. Available at: https://www.admin.ch/gov/de/start/dokumentation/medienmitteilungen.msg-id-1679.html
Eidgenössisches Departement für Umwelt. (2016). Verkehr, Energie und Kommunikation UVEK, Klimapolitik der Schweiz. Available at: https://www.admin.ch/ch/d/gg/pc/documents/2801/Klimapolitik-der-Schweiz-nach-2020_Erl.-Bericht_de.pdf
E-PRTR. (2017). Europen Pollutant and Transfer Register. Available at: http://prtr.ec.europa.eu/#/home
European Cement Research Academy. (2009). ECRA CSS Project—Report about Phase II. Düsseldorf: TR-ECRA-106/2009.
Fachagentur Nachwachsende Rohstoffe e.V.—FNR. (2016). Basisdaten Bioenergie Deutschland 2016. Rostock: FNR.
Götz, M., Lefebvre, J., Mörs, F., McDaniel Koch, A., Graf, F., Bajohr, S., et al. (2016). Renewable power-to-gas: a technological and economic review. Renew. Energy 85, 1371–1390.
Graf, F., Götz, M., Henel, M., Schaaf, T., and Tichler, R. (2014). Abschlussbericht “Techno-ökonomische Studie von Power-to-Gas-Konzepten”. Bonn. Available at: http://www.dvgw-innovation.de/fileadmin/dvgw/angebote/forschung/innovation/pdf/g3_01_12_tp_b_d.pdf
Hannula, I. (2015). Co-production of synthetic fuels and district heat from biomass residues, carbon dioxide and electricity: Performance and cost analysis. Biomass Bioenergy 74, 26–46. doi:10.1016/j.biombioe.2015.01.006
Hermann, H., Emele, L., and Loreck, C. (2014). Prüfung der klimapolitischen Konsistenz und der Kosten von Methanisierungsstrategien. Berlin: Öko-Institut e.V.
Hochschule für Technik Rapperswil. (2014). Erdgasinfrastruktur der Schweiz. Available at: https://www.iet.hsr.ch/fileadmin/user_upload/iet.hsr.ch/Power-to-Gas/Kurzberichte/05_Erdgasinfrastruktur_Schweiz.pdf
Institut für Energietechnik—HSR. (2017). High Efficiency Power-to-Methane Pilot – HEPP, 3. Available at: https://www.iet.hsr.ch/index.php?id=16924
International Energy Agency. (2002). Potential for Building Integrated Photovoltaics. St. Ursen: NET Nowak Energy & Technology Ltd.
Kopyscinski, J., Schildhauer, T. J., and Biollaz, S. M. A. (2010). Production of synthetic natural gas (SNG) from coal and dry biomass – a technology review from 1950 to 2009. Fuel 89, 1763–1783. doi:10.1016/j.fuel.2010.01.027
Locher, F. W. (2000). Zement: Grundlagen der Herstellung und Verwendung. Düsseldorf: Bau + Technik: Spinger.
Matter, J. M., Stute, M., Snæbjörnsdottir, S. Ó., Oelkers, E. H., Gislason, S. R., Aradottir, E. S., et al. (2016). Rapid carbon mineralization for permanent disposal of anthropogenic carbon dioxide emissions. Science 352, 1312–1314. doi:10.1126/science.aad8132
Mayer, J. N. (2015). Zukünftige Kosten der Photovoltaik bis 2050—Langfristszenarien zu Marktentwicklung, Systempreisen und Stromgestehungskosten. Freiburg: Fraunhofer Institut für Solare Energiesysteme ISE.
Meyer Burger AG, (2017). Available at: http://www.schweiz-solar.ch/media/archive1/Content/pdf/produkte/Solarmodule/FS_Bifacial_380_de.pdf.
NIST-National Institut of Standards and Technology. (2017). NIST Chemistry WebBook, SRD 69. Available at: http://webbook.nist.gov/chemistry/form-ser/
Noack, C., Burggraf, F., Schwan Hosseiny, S., Lettenmeier, P., Kolb, S., Belz, S., et al. (2015). Studie über die Planung einer Demonstrationsanlage zur Wasserstoff-Kraftsstoffgewinnung durch Elektrolyse mit Zwischenspeicherung in Salzkavernen unter Druck. Stuttgart: Deutsches Zentrum für Luft- und Raumfahrt e.V.—DLR.
Pentagon, (2017). Available at: http://www.pentagon-project.eu/about/
Schaaf, T., Grünig, J., Schuster, M. R., Rothenfluh, T., and Orth, A. (2014). Methanation of CO2–storage of renewable energy in a gas distribution system. Energ Sustain Soc 4, 2. doi:10.1186/s13705-014-0029-1
Schiller, G. (2012). Überblick über die Verfahren der Wasserelektrolyse und Forschungsergebnisse sowie Forschungsbedarf bei der alkalischen Elektrolyse. Availableat:http://elib.dlr.de/75764/1/Wasserelektrolyse_Ulmer_Gespr%C3%A4ch_3.5.2012_GS.pdf
Schnurbein, V. (2012). Die Speicherung überschüssigen EE-Stromes durch synthetisches Methan. Energiewirtschaftliche Tagesfragen 62, 38–42.
Schweizerischer Bundesrat. (2016). Botschaft zur Genehmigung des Klimaübereinkommens von Paris. Bern: Schweizerische Eidgenossenschaft.
Specht, M., Brellochs, J., Frick, V., Stürmer, B., Zuberbühler, U., Sterner, M., et al. (2010). Storage of renewable energy in the natural gas grid. Erdöl Erdgas Kohle 126, 342–346.
Staehelin, E., Suter, R., and Siegwart, N. (2007). Investitionsrechnung, Zürich/Chur: Verlag Rüegger. Zürich/Chur: Edition Rüegger.
Statista. (2017a). Statistiken zur Bevölkerung in Deutschland. Available at: https://de.statista.com/themen/27/bevoelkerung/
Statista. (2017b). Anzahl der Sonnenstunden an ausgewählten Messstationen in der Schweiz im Jahr 2016. Available at: https://de.statista.com/statistik/daten/studie/297546/umfrage/sonnenstunden-in-der-schweiz-nach-ausgewaehlten-orten/
Stolten, D., and Krieg, D. (2010). “Alkaline electrolysis—introduction and overview,” in Hydrogen and Fuel Cells: Fundamentals, Technologies and Applications, ed. D. Stolten (Weinheim: Wiley-VCH). p. 243–267.
Umweltbundesamt. (2017). Treibhausgasemissionen in Deutschland. Available at: http://www.umweltbundesamt.de/sites/default/files/medien/384/bilder/dateien/3_tab_emi-direkt-indirekt-thg_2017-03-17.pdf
Vandewalle, J., Bruninx, K., and D’Haeseleer, W. (2015). Effects of large-scale power to gas conversion on the power, gas and carbon sectors and their interactions. Energy Convers Manag. 94, 28–39. doi:10.1016/j.enconman.2015.01.038
Verband der Schweizerischen Gasindustrie – VSG. (2017). Erdgas/Biogas in der Schweiz, 15. Available at: https://www.erdgas.ch/infothek/jahresstatistik/
Verband Schweizer Elektrizitätsunternehmen – VSE. (2015). Photovoltaik und solarthermische Stromerzeugung, Verband Schweizerischer Elektrizitätsunternehmen. Aarau. Available at: https://www.strom.ch/fileadmin/user…/13__PV_und_solarthermische_KW.pdf
Keywords: CO2 methanation, cement-based CO2, power-to-gas, hydrogen, economics, photovoltaics, electrolysis, Switzerland
Citation: Baier J, Schneider G and Heel A (2018) A Cost Estimation for CO2 Reduction and Reuse by Methanation from Cement Industry Sources in Switzerland. Front. Energy Res. 6:5. doi: 10.3389/fenrg.2018.00005
Received: 09 November 2017; Accepted: 09 February 2018;
Published: 28 February 2018
Edited by:
Martin Owen Jones, Science and Technology Facilities Council, United KingdomReviewed by:
Mark Bowden, Pacific Northwest National Laboratory (DOE), United StatesMing Ma, Delft University of Technology, Netherlands
Manuel Götz, DVGW Research Centre - Engler-Bunte-Institute, Germany
Copyright: © 2018 Baier, Schneider and Heel. This is an open-access article distributed under the terms of the Creative Commons Attribution License (CC BY). The use, distribution or reproduction in other forums is permitted, provided the original author(s) and the copyright owner are credited and that the original publication in this journal is cited, in accordance with accepted academic practice. No use, distribution or reproduction is permitted which does not comply with these terms.
*Correspondence: Andre Heel, YW5kcmUuaGVlbEB6aGF3LmNo
 Jens Baier
 Gabriel Schneider
 Andre Heel
