- School of Chemical Engineering, The University of New South Wales (UNSW), Sydney, NSW, Australia
An aqueous metal ion capacitor comprising of a zinc anode, oxidized carbon nanotubes (oCNTs) cathode, and a zinc sulfate electrolyte is reported. Since the shuttling cation is Zn2+, this typical metal ion capacitor is named as zinc-ion capacitor (ZIC). The ZIC integrates the divalent zinc stripping/plating chemistry with the surface-enabled pseudocapacitive cation adsorption/desorption on oCNTs. The surface chemistry and crystallographic structure of oCNTs were extensively characterized by combining X-ray photoelectron spectroscopy, Fourier-transformed infrared spectroscopy, Raman spectroscopy, and X-ray powder diffraction. The function of the surface oxygen groups in surface cation storage was elucidated by a series of electrochemical measurement and the surface-enabled ZIC showed better performance than the ZIC with an un-oxidized CNT cathode. The reaction mechanism at the oCNT cathode involves the additional reversible Faradaic process, while the CNTs merely show electric double layer capacitive behavior involving a non-Faradaic process. The aqueous hybrid ZIC comprising the oCNT cathode exhibited a specific capacitance of 20 mF cm−2 (corresponding to 53 F g−1) in the range of 0–1.8 V at 10 mV s−1 and a stable cycling performance up to 5000 cycles.
Introduction
Supercapacitors, also called electrochemical capacitors (ECs), are such high-performance energy storage devices with excellent power capability, short charge-discharge time, long cyclic life, and outstanding reversibility (Yan et al., 2014). Charge storage in supercapacitors is principally based on either the pure electrostatic charge accumulation at the electrode–electrolyte interface, i.e., electric double layer capacitance, or the fast and reversible Faradaic processes on the electrode surface, i.e., pseudocapacitance. However, ECs store electrical charge only at the electrode surface rather than within the entire electrode so that they deliver lower energy densities compared with batteries (Dubal et al., 2015).
In conventional symmetric ECs, carbonaceous materials, such as activated carbon, carbon nanotubes (CNTs), graphene materials, and carbon aerogels, are normally used as the electrodes because of the large specific surface area, good conductivity, high chemical stability, and low cost (Frackowiak and Béguin, 2002; Vix-Guterl et al., 2005; Pandolfo and Hollenkamp, 2006; Frackowiak, 2007; Zhang et al., 2009). But they exhibit a lower capacitance, as only electric double layer behavior occurs in the system. In asymmetric ECs, one or two electrodes can be pseudocapacitive that can contribute to higher capacitance. Electroactive polymers can provide large pseudocapacitance (Snook et al., 2011; Kurra et al., 2015). But their swelling behavior can degrade the cycling stability. Transition metal oxide electrodes have higher pseudocapacitance than carbon electrodes, whereas the stability and conductivity are inferior to those of carbons (Lokhande et al., 2011).
Driven by the need to maintain the power capability as well as enhance the capacitance and energy density performance, hybrid electrochemical capacitors (HECs) with a different asymmetric configuration have been developed in recent years (Simon and Gogotsi, 2008). HECs are generally composed of a battery-type Faradaic anode as energy source and a capacitor-type cathode as power source, which can enhance the energy and power capabilities. A particular sample is lithium-ion capacitors (LICs), which combine Li-alloying anodes with supercapacitor cathodes (Cao et al., 2014, 2015). But LICs suffer from high cost of lithium because of the scarcity in earth crust. Thereafter, sodium-ion capacitors (SICs) emerge as an attractive alternative of Li-ion capacitors for the sake of the relative abundance of sodium (Chen et al., 2012). However, safety issue is a critical concern for either LICs or SICs because the metal anodes are extremely reactive and the organic solvents are flammable. Consequently, there is an urgent need to search for environmental friendly alternative aqueous metal-ion capacitors.
Zinc as a safe, cost-effective, and eco-friendly metal has been widely studied in the batteries, e.g., zinc–air, zinc–polymer, and zinc–alkaline batteries (Rahmanifar et al., 2002; Ghaemi et al., 2003; Lee et al., 2011). Generally, the alkaline electrolytes are used in the zinc–air and zinc–alkaline batteries, where the zinc anode is oxidized to the zincate ions, Zn(OH)42−, during discharge (Ghaemi et al., 2003; Lee et al., 2011). However, the zincate ions are easily decomposed to ZnO that acts as an insulator in the system, while the zincate ions exceed a saturation point in the alkaline medium. The formation of ZnO seriously degrades the cycling performance of the batteries. Regarding the zinc–polymer batteries, they typically use the zinc as the anode and the polyaniline as the cathode in the ZnCl2 and NH4Cl mixing electrolytes (pH = 4–5), where the cathodic reaction that involves the oxidation/reduction processes is accompanied by the insertion and elimination of the chloride ions (Ghanbari et al., 2007). Meanwhile, the Zn anode dissolves in terms of Zn2+ ions during discharging processes and deposits during charging. However, the polyaniline is electroactive merely in the acidic media and it is found to lose its electrochemical activity in the solution of pH >4 (Rahmanifar et al., 2002). Among these batteries, the shape change of the zinc anode resulting from the non-uniform deposition of zinc active material during charging and the dendrite growth due to high local current densities remain the challenges for the zinc rechargeable batteries (Vatsalarani et al., 2006).
A new type of zinc-ion batteries that are based on the shuttling of Zn2+ ions in the zinc sulfate electrolyte between the zinc anode and nanoparticle cathode with abundant tunnels, e.g., MnO2 and CuHCF nanocubes, was reported recently (Xu et al., 2012; Jia et al., 2015; Trócoli and La Mantia, 2015). This novel battery operates the zinc ion insertion and extraction at near-neutral pH values, whereas the active material on the cathode is capable of accommodating Zn2+ in the crystalline structure. More importantly, a patent of a metal ion pseudocapacitor based on the zinc metal anode and the cathode materials, including transition metals, carbon, electro-active polymers, and combinations, has appeared (Lengsfeld and Shoureshi, 2014). It showed the excellent potential of the energy storage system through the zinc metal electro-dissolution and deposition anodic processes and Zn2+ ion adsorption/desorption, Faradaic or both cathodic processes. Herein, we develop a zinc ion capacitor (ZIC) using a CNT-based pseudocapacitive cathode and a zinc anode. Both liquid electrolyte and gel electrolyte containing ZnSO4 were developed for this ZIC. Because of their high electrical conductivity, good mechanical strength and large surface area, CNTs have attracted significant attention as electrode materials (Choi et al., 2001; Zhai et al., 2011). We found that the oxidized carbon nanotubes (oCNTs) can increase the pseudocapacitance due to the interaction between the oxygen-containing functional groups and the Zn2+, thereby enhancing the capacitance of the ZIC.
Experimental Section
Materials
Carbon nanotubes were commercially purchased. All other chemicals, including 32% hydrochloric acid, 98% sulfuric acid, potassium permanganate, 30% hydrogen peroxide solution, 5 wt.% Nafion solution, zinc sulfate, and polyvinyl alcohol (PVA), were purchased from Sigma-Aldrich.
Synthesis of oCNTs
The CNTs were treated with 20% HCl solution to dissolve metal impurities. The purified CNTs were washed with sufficient deionized (DI) water and dried in an oven at 60°C. Subsequently, the oCNTs were prepared by using an improved Hummer’s oxidation as follows (Kosynkin et al., 2009). First, 1.0 g of purified CNTs were added with 120 mL of 98% concentrated H2SO4 and then added slowly with 1.0 g of KMnO4 at room temperature upon magnetic stirring. The solution was maintained at room temperature for 15 min and then transferred to a 60°C bath for a continuous stirring of 4 h. After cooling to room temperature, 300 mL water solution containing 10 mL 30% H2O2 solution was slowly poured into it upon stirring of 1 h. Second, the reacted solution was centrifuged (8000 rpm for 30 min), and the supernatant was decanted away. The recovered sample was redispersed in the DI water using bath sonication and then collected by centrifugation at 10,000 rpm for 30 min. This process was repeated until the pH turned to be neutral. Finally, the resultant sample was dried in the oven at 60°C, which was noted as oCNTs.
Characterizations
Transmission electron microscopy (TEM) images of CNTs and oCNTs were collected from the Tecnai F20 field emission transmission electron microscope. X-ray photoelectron spectroscopy (XPS) was performed using a Thermo Scientific K-Alpha spectrometer with Al Kα radiation. Raman spectra were obtained on a Renishaw inVia Raman Microscope from 800 to 3600 cm−1 using a green excitation laser (Ar, 514 nm). X-ray diffraction (XRD) was carried out on a PANalytical Xpert Multipurpose diffraction System with a Cu Kα source. Fourier transform infrared (FTIR) spectroscopy was performed on the Varian 640 FTIR Spectrometer with a sensitive liquid nitrogen-cooled MCT detector. Scanning electron microscopy (SEM) was performed on the NanoSEM 230 field emission scanning electron microscope. The BET specific surface area measurements were conducted by Micromeritics Tristar 3030.
Electrochemical Measurements
Fifty milligrams of CNTs and oCNTs were separately dispersed in 10 mL of 0.5 wt.% Nafion solution using a probe sonication. Then, 200 μL of each sample was drop-cast onto a titanium foil as a working electrode. The electrochemical properties of CNTs and oCNTs were evaluated by using a three-electrode cell: a Pt counter electrode, a Hg/Hg2SO4 reference electrode in saturated K2SO4 solution, and a CNT or oCNT working electrode stabilized in 1M ZnSO4 aqueous electrolyte (pH = 4.16) or in pH = 4.16 H2SO4 electrolyte at the scan rates of 10, 50, 100, 200, 500, and 800 mV s−1 within −1.4 to 0.2 V. Subsequently, a ZIC was constructed by using a zinc foil as the anode and the oCNTs or CNTs as the cathode. The galvanostatic charge/discharge studies of the ZICs based on the oCNT and CNT cathodes were carried out at 2, 5, and 10 mA cm–2 within 0–1.8 V in the 1M ZnSO4 liquid electrolyte. The cyclic voltammetry of the ZICs using the oCNT cathodes was measured in 1M ZnSO4 liquid electrolyte and in ZnSO4–PVA gel electrolyte at the scan rates of 5, 10, 20, 50, 100, 150, 200, and 500 mV s−1 within 0–1 and 0–1.8 V. The gel electrolyte was prepared by soaking a filter paper into the 0.05 g mL−1 PVA solution overnight and then soaking the gel-treated filter paper into the 1M ZnSO4 solution overnight. In order to highlight the superiority of the ZIC, a symmetric capacitor with oCNTs as both electrodes was constructed using 1M ZnSO4 aqueous electrolyte and measured at 50 mV s−1 within 0–1.8 V. Moreover, the cycling stability of the liquid- and gel-electrolyte ZICs was tested individually within 0–1.8 V by cycling 5 times at 5 mV s−1 and then 1000 times at 500 mV s−1. This unit process of cycling test was continuously repeated for five times. The additional cycle life test of the gel-electrolyte ZIC based on the galvanostatic charge/discharge was conducted at 2 mA cm−2 within 0–1.8 V for 1500 cycles. The electrochemical impedance spectroscopy (EIS) (10 mHz–10 kHz, 5 mV) was used to study the ZICs at the open circuit voltage (OCV).
Results and Discussion
Surface-Enabled Zn Ion Storage
Since cyclic voltammetry is a suitable technique to characterize the capacitive behavior of electrode materials, the electrochemical performances of oCNTs and CNTs were studied in a three-electrode cell by using cyclic voltammetry. Figure 1 exhibits the cyclic voltammograms (CV) of the oCNTs (green line) and the CNTs (black line) in 1M ZnSO4 aqueous solution between −1.4 and 0.2 V (vs. Hg/Hg2SO4 in concentrated K2SO4 electrolyte) at the scan rates of 10 and 200 mV s−1. The −1.4 V (vs. Hg/Hg2SO4) was the equilibrium potential of Zn0/Zn2+ (Figure S1 in Supplementary Material). The CV curves of CNTs show a typical rectangular shape, indicating pure electric double layer capacitive behavior. However, the CV curves of oCNTs show a quasi-rectangular shape with a broad anodic hump at 0.2 V and a cathodic hump at −0.25 V, implying the presence of pseudocapacitance. The capacitive performance of oCNTs is far superior to that of CNTs, which shows typical electric double layer capacitance. Moreover, the oCNTs exhibited distinct pseudocapacitive response at higher scan rates (Figure S2 in Supplementary Material). Additionally, as the pH of the 1M ZnSO4 solution is 4.16, the pseudocapacitance could partially include the protonation capacitance. The oCNT sample was then tested in pH = 4.16 H2SO4 solution in order to determine the contribution of protonation to the capacitance. At the same concentration of H+, the oCNTs in a pH = 4.16 H2SO4 solution (Figure 1, red line) present an inferior capacitive behavior than that in ZnSO4 solution, suggesting that the presence of Zn2+ ions can provide higher capacitance.
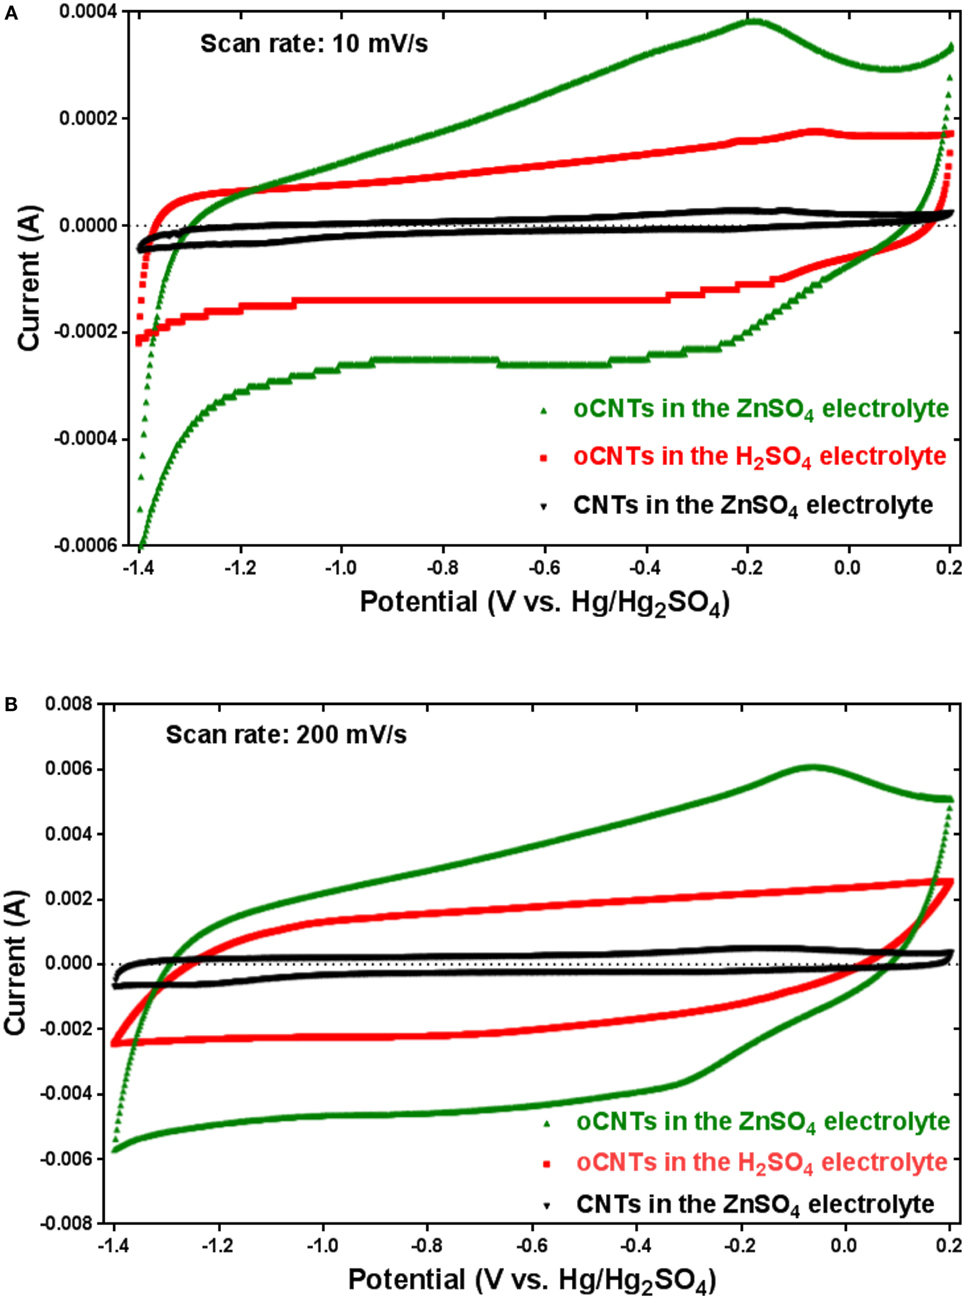
Figure 1. The CV profiles of oCNTs and purified CNTs recorded in 1M ZnSO4 and pH = 4.16 H2SO4 electrolytes at (A) 10 mV s−1 and (B) 200 mV s−1.
It is worth noting that the atomic percentage of the Zn2+ ions on the oCNTs during discharge (Zn2+ adsorption) is higher than that during charge (Zn2+ desorption), as shown in the Table S1 in Supplementary Material. In the process of discharge, certain Faradaic reaction or electrochemical adsorption of the Zn2+ ions on oCNTs could take place, increasing the amount of Zn2+ ions on the oCNTs. The charge process could involve reversible electrochemical desorption of Zn2+ ions that decrease the atomic percentage of Zn2+ ions on the oCNTs.
Charge Storage Mechanism of oCNTs
In order to understand the relationship between Zn2+ ion storage and physicochemical properties of the oCNTs, various instrumental analyses were conducted to reveal the structural differences of oCNTs from CNTs. The inset in Figure 2A displays the XPS survey spectra of CNTs and oCNTs. Merely C1s and O1s peaks, without any signals of elemental impurities, are observed. The ratios of the peak intensity indicate the change in the oxygen content of the samples. Obviously, the O-to-C ratio of the oCNTs is enhanced, which suggests an increase in the oxygen amount. The high resolution C1s core-level spectra of both samples are presented in Figure 2A. The pristine CNT sample exhibits an asymmetric peak centered at 284.5 eV with a long tail extended to the higher energy region, representing the graphitic structure. Deconvolution of the C1s peak of the oCNTs also shows a main peak at 284.5 eV, attributed to the non-oxygenated sp2 carbon (Stankovich et al., 2007; Yang et al., 2009). Moreover, a peak at 285.1 eV is caused by sp3-hybridized carbon. The peaks at 286.7, 288.1, and 289.3 eV correspond to carbon atoms attached to different oxygen-containing moieties, which are assigned to C–O, C=O, and O–C=O bonds, respectively. Additionally, deconvolution of the XPS O1s of both samples is shown in Figure S3A in Supplementary Material. The O1s spectra are deconvoluted into two peaks, and these two peaks at 531.6 and 533.4 eV are assigned to C=O and C–O, respectively, which confirm the presence of some carboxylic and hydroxyl functionalities onto the nanotube surface (Stankovich et al., 2007).
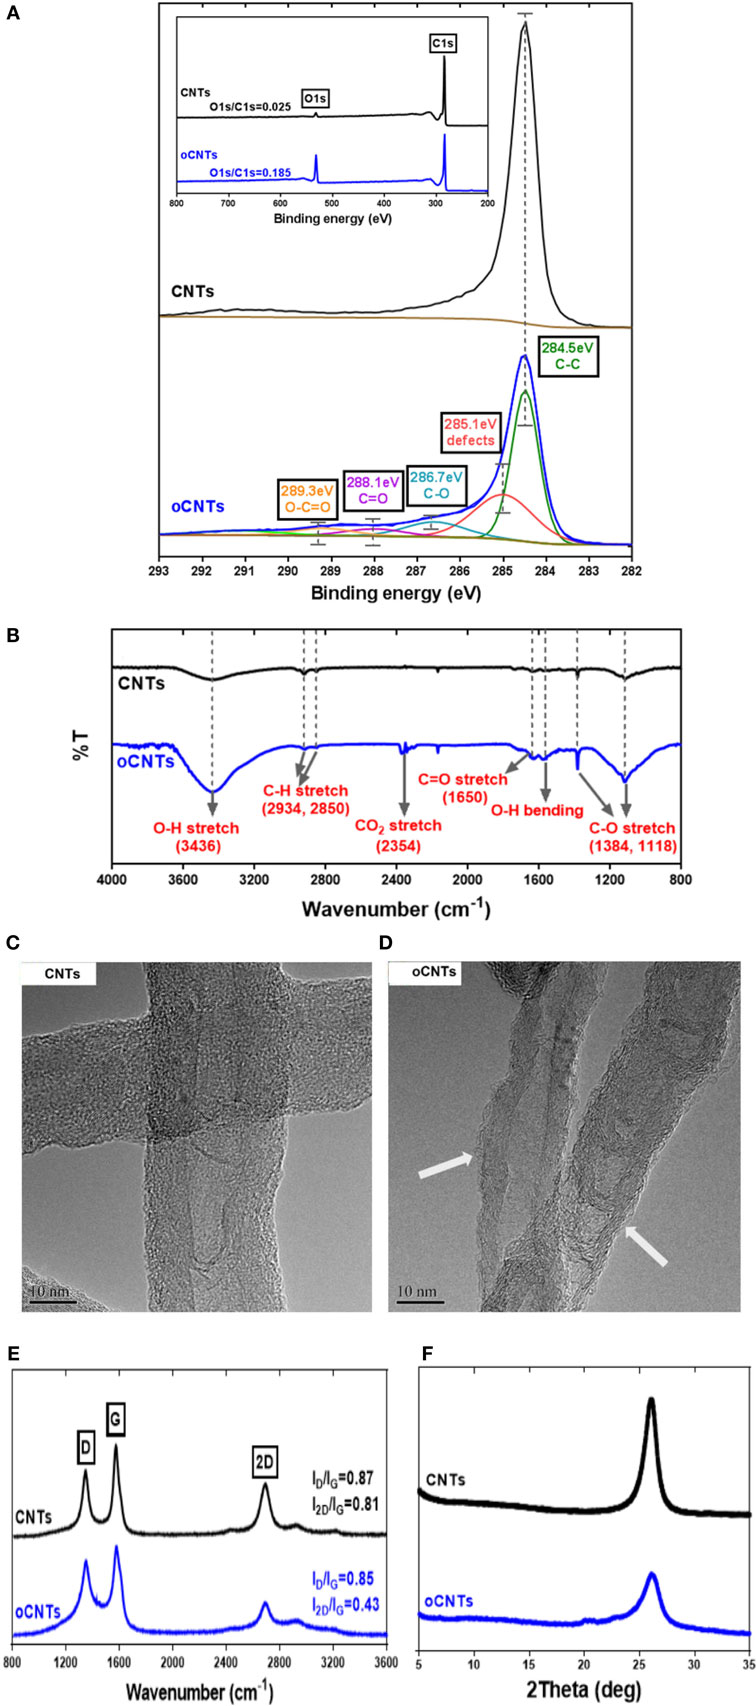
Figure 2. (A) XPS C1s spectra with survey spectra inset; (B) FTIR spectra; (C,D) TEM images (the arrows point at the amorphous surface of the oCNTs), (E) Raman spectra, and (F) XRD patterns of CNTs and oCNTs.
Additionally, Figure 2B shows the FTIR spectra of CNTs and oCNTs, which further confirm the introduction of oxygen functionalities onto the CNTs. The characteristic peaks at 2934 and 2850 cm−1 are normally recognized as the asymmetric stretching and the symmetric stretching of CH2, respectively. The vibration of CH2 is still visible in the oCNT spectrum, suggesting that ordered graphitic domains remain in the structure (Pham et al., 2011). The major contribution to the FTIR spectra is the oxygen-containing functional groups. Near 3430 cm−1 in the high frequency area, there is a broad peak for the oCNTs at 3000–3700 cm−1 as compared with that of the CNTs, which is caused by the stretching vibration of hydroxyl groups (Wang et al., 2012). Correspondingly, the absorption peak based on the bending vibration of –OH at 1584 cm−1 becomes stronger. Besides, the absorption peak occurring near 1650 cm−1 in the medium frequency area is caused by the stretching vibration of C=O of carboxylic acid and carbonyl groups. Finally, the absorption peaks at 1384 and 1118 cm−1 arise from the vibration of C–O of carboxylic acid and the stretching vibration of C–OH, respectively.
The TEM images provide the microstructural information of CNTs and oCNTs, as presented in Figures 2C,D. The morphology of the oCNTs did not change significantly after low-level oxidation (Figures S3B,C in Supplementary Material). But it is noticeable that, as seen in the areas pointed by the arrows in Figure 2D, the oCNTs were not as graphitic as the CNTs, evidenced by the amorphous fragments attached on the surfaces. Since the degree of oxidation effectively determines the extent of the CNT unzipping (Kosynkin et al., 2009), at the low oxidation level, the amorphous carbon was formed on the surface of the oCNTs with intact graphitic inner tube remaining. The TEM images are further supported by Raman and XRD results.
Figure 2E displays the Raman spectra for CNTs and oCNTs. Basically, the main features in the Raman spectra of graphitic carbon materials are the D (1354 cm−1), G (1584 cm−1), and 2D (2707 cm−1) bands (Wu et al., 2015). Generally, the ID/IG value is used to represent the graphitic degree of the carbon materials. As shown in Figure 2E, the ID/IG values of the oCNTs and the CNTs are not obviously changed, indicating that after oxidation the ordering of the graphitic structure almost remained. The relative intensity of 2D band to G band is inversely associated with the doping level of oxygen functional groups on the graphene basal planes (Ferrari, 2007; Wu et al., 2015). Figure 2E shows the I2D/IG value of the oCNTs reduces significantly as compared to that of the CNTs, which suggests a reduced sp2 domain size due to the occupation of introduced oxygen functional groups. Thus, the Raman spectra demonstrate that the majority of the graphitic structure in the oCNTs remained intact but with the oxygen doped to the outermost layers.
Figure 2F compares XRD patterns of both samples. It can be found that the CNTs have a 2θ value of ~26.8°, and the position of the peak of the oCNTs does not shift after oxidation treatment, which demonstrates that they have almost the same interlayered spacing. However, the peak intensity of the oCNTs is weaker than that of the CNTs, probably indicating that at such oxidation level, the outermost layers of the nanotubes have been damaged but still with the intact inner structure remaining.
Based on the structural analyses, the better capacitive performance of the oCNTs can be explained as follows. On the one hand, despite the superior electrical conductivity, CNTs do not contain abundant oxygen functional groups, implying that its capacitive behavior merely relies on the electric double layer capacitance. On the other hand, the poor wettability of CNTs in aqueous electrolyte, resulting from the hydrophobic surfaces, can decelerate the ion transport toward the electrode–electrolyte interfaces, thereby negatively affecting the electrochemical performance. However, the oCNTs are characterized by the abundant oxygen-containing groups at the surface and the intact graphitic inner tubes that maintain the electrical conductivity. The oxygen functional groups occurring in the oCNTs are advantageous, as they can provide a large additional pseudocapacitance as well as improved wettability, giving the oCNTs a higher capacitance than that of the CNTs. According to the previous report that the oxygen functional groups of graphene oxide sheets can chemically interact with divalent metal ions (Park et al., 2008), the pseudocapacitance of oCNTs, in this case, probably comes from the electrochemical reactions, e.g., >2C–O–Zn ↔ 2C=O + Zn2+ + 2e− and >C–OH ↔ C=O + H+ + e−, and partially from the electrostatic adsorption/desorption of ions, as illustrated in Figure 3. As the presence of Zn2+ ions provides higher capacitance, the electrochemical reaction/adsorption based on the Zn2+ ions and oxygen-containing groups of the oCNTs should play a dominant role in the ZIC system.
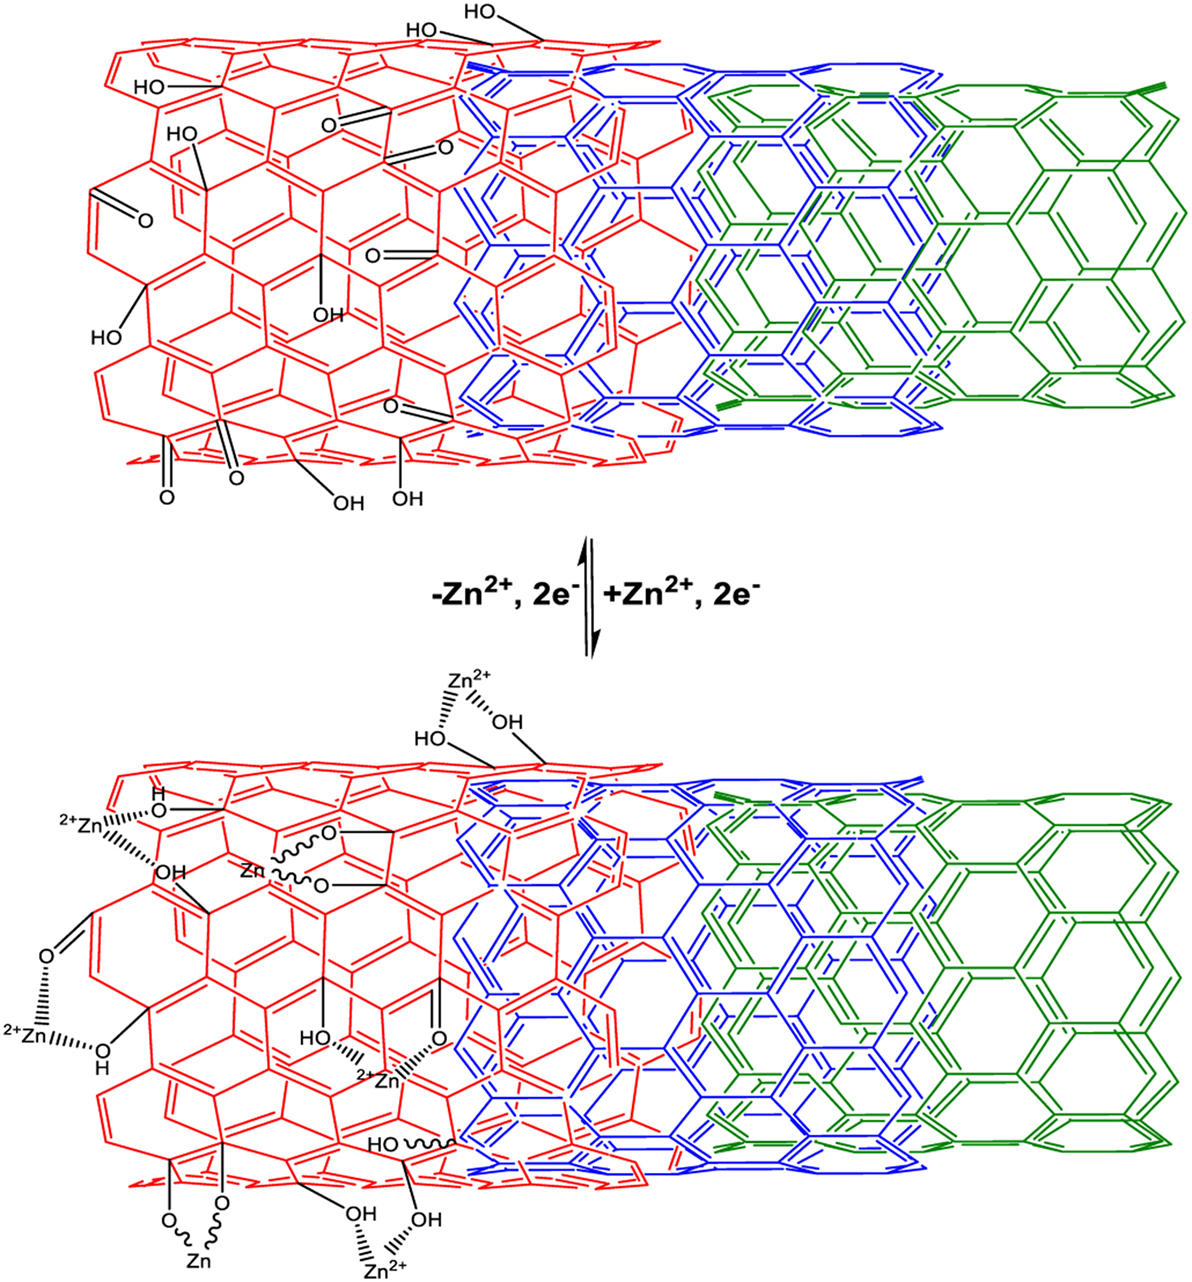
Figure 3. Schematic of the chemistry of the oCNTs upon discharge/adsorption and charge/desorption in the ZnSO4 electrolyte.
Assembly of ZIC
Depending on the capacitive performance and material characterizations of the oCNTs, a safe and eco-friendly energy storage device, which consists of an oCNT cathode, a zinc anode, and a ZnSO4 liquid electrolyte or a ZnSO4–PVA gel electrolyte, is presented. The ZnSO4 solution is a non-toxic, non-corrosive, and cost-effective mild aqueous electrolyte, and therefore, the ZIC is more environmental friendly compared to other rechargeable power sources that use either alkaline (such as Zn/MnO2, Ni–Cd, or Ni–MH batteries), or acidic (lead–acid) electrolytes (Xu et al., 2012). In order to further compare the behavior of oCNTs with the CNTs, the galvanostatic charge/discharge curves of the ZICs based on the oCNT and CNT cathodes at different current densities were measured in the 1M ZnSO4 liquid electrolyte within 0–1.8 V, as shown in Figures 4A–C. The curves of the CNTs show the typical triangular shape attributed to the electric double layer capacitance, while the oCNTs exhibit the quasi-triangle shape, i.e., the V–t curve profile is not as linear as it should be, which is due to the presence of Faradaic currents. The larger area under the V–t curves of the oCNTs is the evidence of the higher capacitance than the CNTs. Also, the galvanostatic charge/discharge curves of the oCNT cathodes (Figure 4D) maintain the same shape in these densities, indicating the oCNTs can experience a wide range of current.
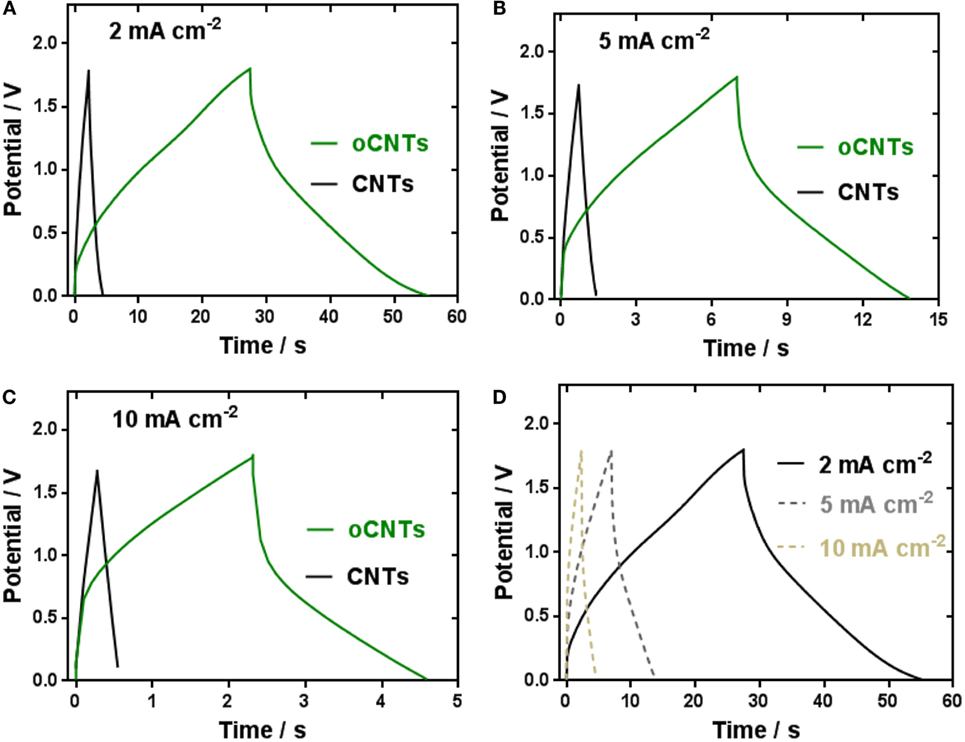
Figure 4. Galvanostatic charge/discharge curves of the ZICs comprising the Zn anode and the CNTs or oCNTs cathode at the current densities of (A) 2 mA cm−2, (B) 5 mA cm−2, and (C) 10 mA cm−2; and (D) comparison of the galvanostatic charge/discharge curves based on the oCNTs cathodes at different current densities.
The higher capacitance of the ZIC comprising the oCNT cathode can be explained in two aspects. On the one hand, the oCNTs by virtue of the oxygen groups decorations exhibit a larger surface area (211 m2 g−1) than the CNTs (120 m2 g−1), which can contribute more to the electric double layer capacitance. On the other hand, the oxygen groups on the oCNTs surface provide additional pseudocapacitance involving a Faradaic process. The pseudocapacitive working principle of ZIC based on the oCNT cathode is proposed here. Zinc is stripped in the form of Zn2+ ions during discharge and deposited during charge (Eq. 1). The Zn2+ ions diffuse to the oCNTs cathode where the divalent cations are electrochemically adsorbed by the oxygen functional groups upon discharge and desorbed upon charge, as depicted in Eq. 2. Since the 1.0M ZnSO4 electrolyte is mildly acidic (pH = 4.16), protonation/deprotonation of oCNTs also participate in the charge/discharge of ZIC, as shown in Eq. 3.
In terms of the full device operation, the Zn2+ ions shuttle between the oCNT cathode and the Zn anode to transport the charges. As the charge storage mechanism relates to the migration of Zn2+ ions between anode and cathode, mimicking that of LICs, this device is termed as a zinc-ion capacitor (ZIC). Nonetheless, the ZIC device is believed to be electrochemically irreversible in the alkaline electrolyte, as the formation of ZnO or Zn(OH)2 cannot be converted to the Zn metal at the room temperature in an electrochemical system.
Cyclic voltammogram (CV) of the ZICs with the ZnSO4 liquid electrolyte and the ZnSO4–PVA gel electrolyte at a scan rate of 50 mV s−1 are exhibited in Figures 5A,B with the voltage ranges of 0–1 and 0–1.8 V. Obviously, the gel-electrolyte ZIC presents a better capacitive performance than the liquid-electrolyte one, which is also demonstrated at other scan rates as shown in Figure S4 in Supplementary Material. The better performance of the gel-electrolyte ZIC can probably be explained in this way. As the ionic conductivity of an electrolyte affects the supercapacitor performance (Yu et al., 2011), the PVA-based gel electrolyte principally provides a liquid-like medium for ion transport and therefore have the capability to enhance the ionic conductivity (Agrawal and Awadhia, 2004). Actually, folding and unfolding the polymeric chain of the PVA cause ion dissociation that enhances the charge carrier concentration; thus, a rise in ionic conductivity of the gel electrolyte can be obtained. This postulation is later verified by rate capability determination and electrochemical impedance. Moreover, the appearance of the redox peaks in Figure 5B at 1.0–1.6 V indicates that the existence of Zn2+ ions in the electrolyte causes a Faradaic process at the electrolyte–cathode interface. Although the mechanism of the ZIC is still uncertain, its pseudocapacitance is probably attributed to the electrochemical reaction/adsorption and desorption of Zn2+ ions on the oCNT cathode.
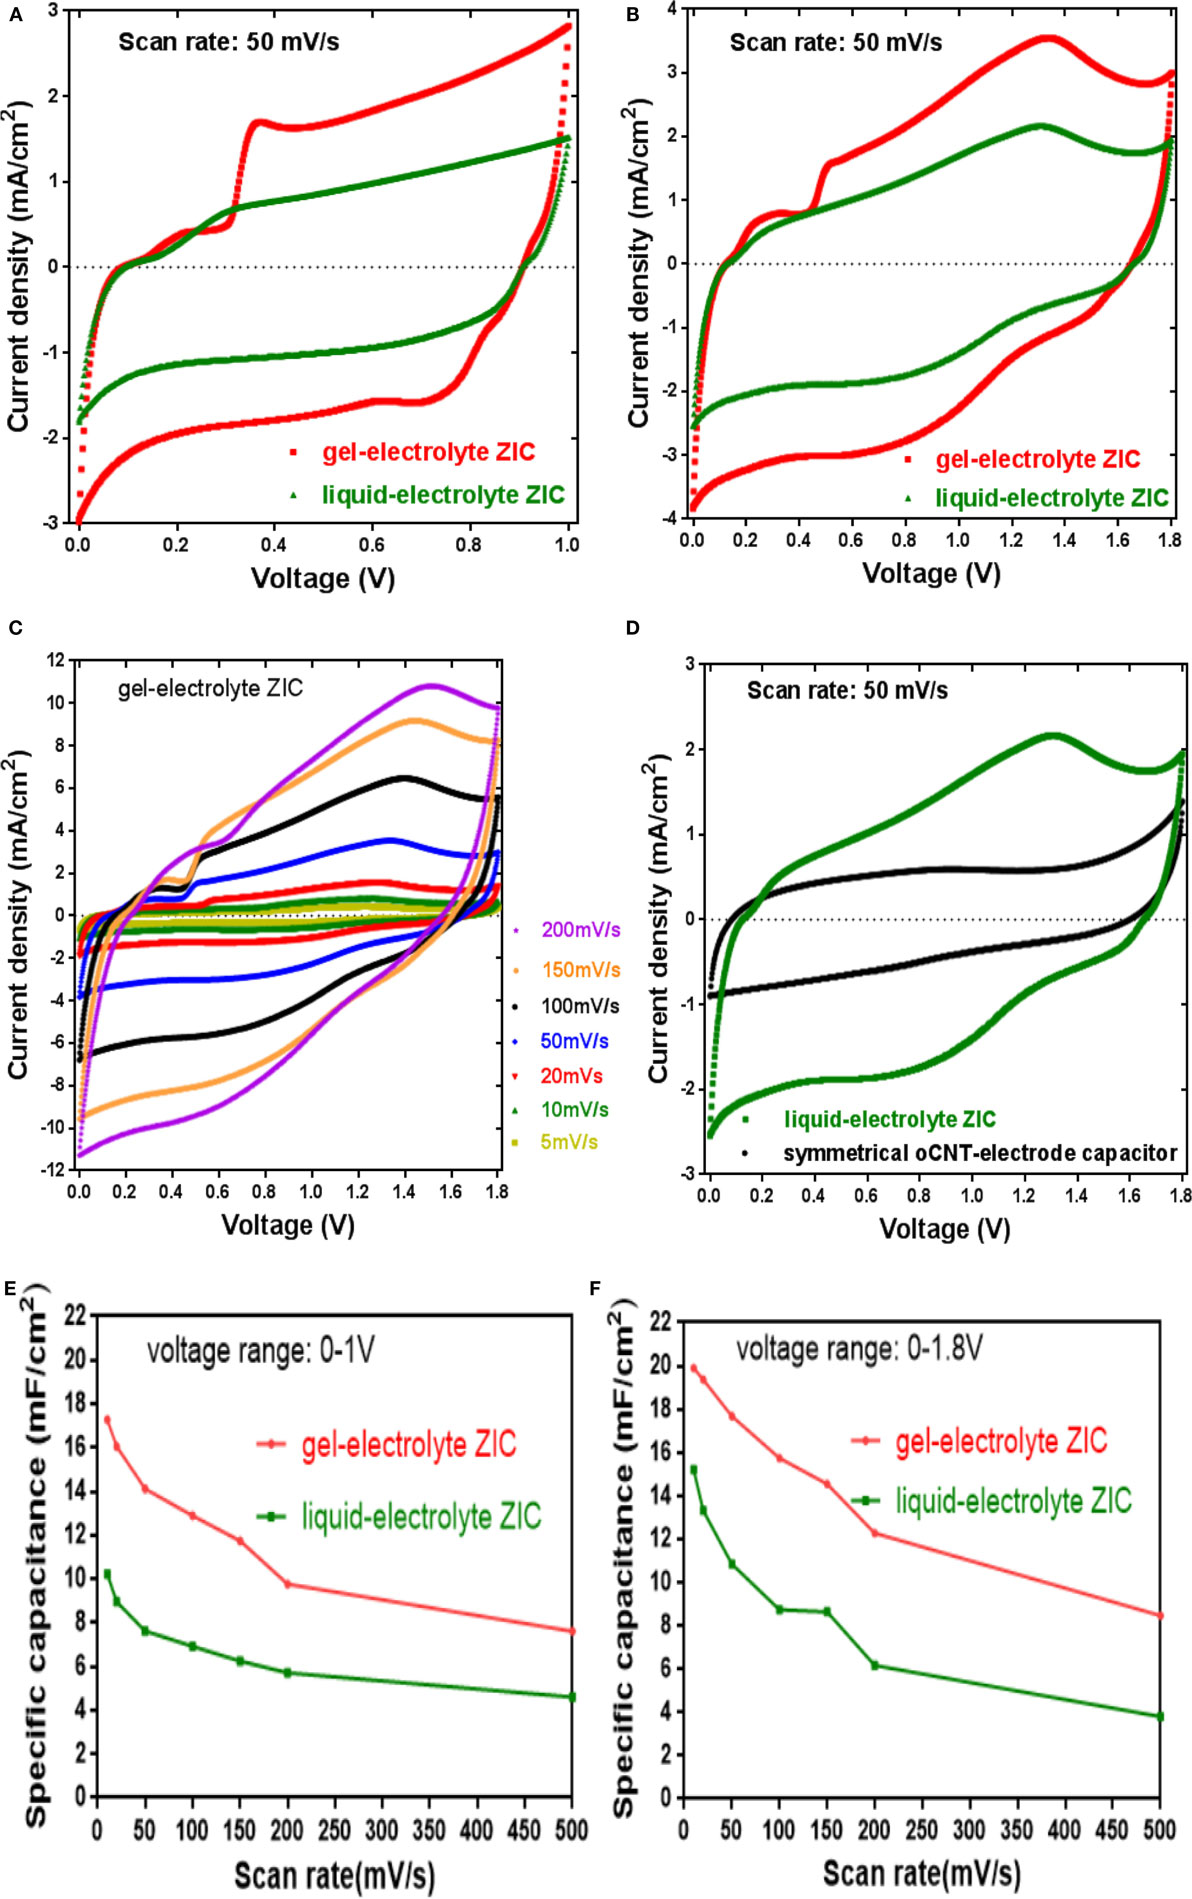
Figure 5. (A,B) The electrochemical capacitive behaviors of gel- and liquid-electrolyte zinc ion capacitors at 50 mV/s within 0–1 and 0–1.8 V; (C) cyclic voltammetry of gel-electrolyte zinc ion capacitor at different scan rates within 0–1.8 V; (D) the capacitive performances of liquid-electrolyte ZIC and symmetric oCNT-based capacitor at 50 mV/s within 0–1.8 V; (E,F) rate capability of gel- and liquid-electrolyte zinc ion capacitors within 0–1 and 0–1.8 V.
The influence of the scan rate on the capacitive behavior of the gel-electrolyte ZIC swept at 5–200 mV s−1 with the voltage range of 0–1.8 V is shown in Figure 5C. It is apparent that each CV curve has the same quasi-rectangular pattern with a broadened peak at around 1.0–1.6 V, suggesting that the oxygen-containing groups of the oCNT cathode are able to facilitate the pseudocapacitance. Also, the current response is dependent on the scan rate. With an increase of the scan rate, the current is proportional to the scan rate without serious distortion in the shape of the CV curves even at the high scan rates, which demonstrates a good charge propagation behavior and ion response of the sample (Zhang et al., 2010). Furthermore, a symmetric oCNT-based capacitor using the 1M ZnSO4 aqueous electrolyte was constructed. The capacitive behaviors of the symmetric capacitor as well as the liquid-electrolyte ZIC at a scan rate of 50 mV s−1 within 0–1.8 V are presented in Figure 5D. It is observed that the capacitive current of the ZIC is nearly two times higher than that of the symmetric capacitor. The symmetric capacitor exhibits a CV curve approximated to the ideal situation of electrical double layer capacitor, that is, there is no visible peak from a redox current over the voltage region (Vix-Guterl et al., 2005). This result indicates that the battery–supercapacitor combination configuration of the ZIC can accumulate charge through Faradaic electrochemical process so as to enhance the capacitance of the capacitor.
Additionally, rate capability is an important feature of supercapacitors. In Figures 5E,F, the specific capacitance variation with the scan rate in the range of 10–500 mV s−1 is illustrated (the calculation of the specific capacitance is described in Supplementary Material). It is obvious that the specific capacitance of the gel-electrolyte ZIC outperforms that with the liquid electrolyte at all scan rates, e.g., the gel-electrolyte ZIC exhibited a higher capacitance value of around 20 mF cm−2 than the liquid-electrolyte one (15 mF cm−2) at a scan rate of 10 mV s−1 (Figure 5F). Also, when the scan rate was increased by 50 times, the gel-electrolyte ZIC presented a capacitance retention ratio of 42.6%, which is higher than that of liquid-electrolyte one (the retention ratio of 25.0%). The area capacitance corresponds to a gravimetric capacitance of 53 F g−1. The ZIC showed comparable electrochemical performance with several different types of metal ion capacitors. For example, a sodium ion capacitor based on transition metal sodium phosphate and activated carbon electrodes exhibited 45 F g−1 at 0.5 A g−1 (Minakshi et al., 2013), and the aqueous capacitors according to different fabrications of CoMoO4 cathodes showed a wide capacitance range of 24–135 F g−1 in the NaOH electrolyte (Ramkumar and Minakshi, 2015; Ramkumar and Minakshi Sundaram, 2016).
Electrochemical impedance spectroscopy is an important technique to characterize the electrochemical frequency behavior of a device, and the obtained data are generally plotted in a Nyquist diagram that represents the imaginary part of the impedance vs. the real part (Taberna et al., 2006). Figure 6 exhibits the Nyquist plot for two ZIC cells assembled with liquid- and gel-electrolyte. It is worth noting that at the highest frequency, the value at the real axis, called the equivalent series resistance (ESR), represents the sum of the resistance of the electrolyte and the intrinsic resistance of the electrode material. As both ZIC cells have the same electrode material, the ESR, in this case, reflects the difference of the electrolyte resistance. By comparison, the gel electrolyte exhibited a lower ESR value of 3.93 Ω than the liquid one (8.51 Ω), which should be one reason for the better capacitive behavior of the gel-electrolyte ZIC. Furthermore, it is observed that for both ZICs, the imaginary parts of impedance at the low frequency region are nearly perpendicular to the real parts, which indicate that both electrolytes have satisfactory electrochemical capacitive behavior (Vix-Guterl et al., 2005). The charge transfer resistance of the gel-electrolyte ZIC is similar to that of the liquid-electrolyte one, which is deduced from the span of the single semi-circle along the real axis from high to medium frequency as shown in the close-up view of Figure 6. However, an apparent difference of both ZIC cells is found at medium frequency in the close-up, where the 45° sloped region of the Nyquist plots, the so-called Warburg resistance, can be seen. The Warburg resistant results from the frequency dependence of ion transport in the electrolyte (Wu et al., 2015). Since the low-frequency capacitive behavior of the liquid-electrolyte ZIC is largely shifted along the x-axis toward more resistive value (Xu et al., 2012), the smaller Warburg region of the gel-electrolyte ZIC indicates a lower ion diffusion resistance and less obstruction of the ion movement (Wu et al., 2015). Thus, a better charge propagation and ion response of the gel-based electrolyte are demonstrated, which can explain the better electrochemical performance of the gel-electrolyte ZIC observed in the previous results.
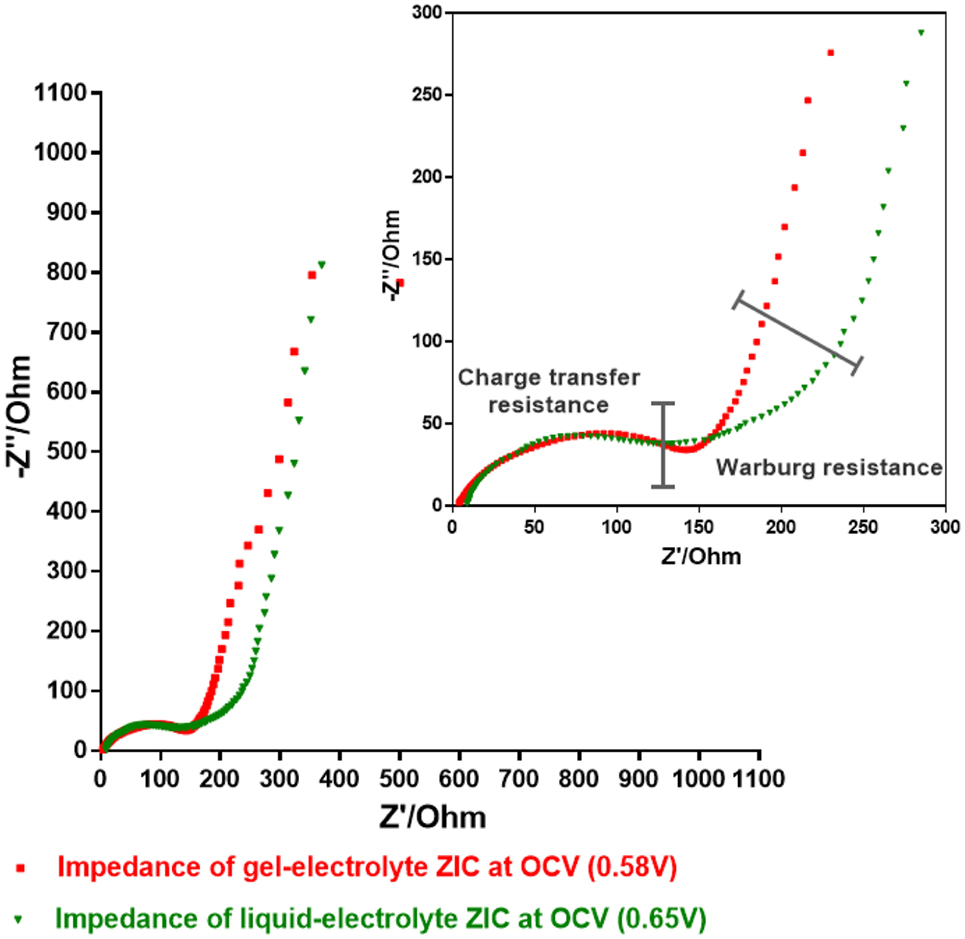
Figure 6. Electrochemical impedance spectroscopy plots of gel- and liquid-electrolyte ZIC at the open circuit voltage (OCV).
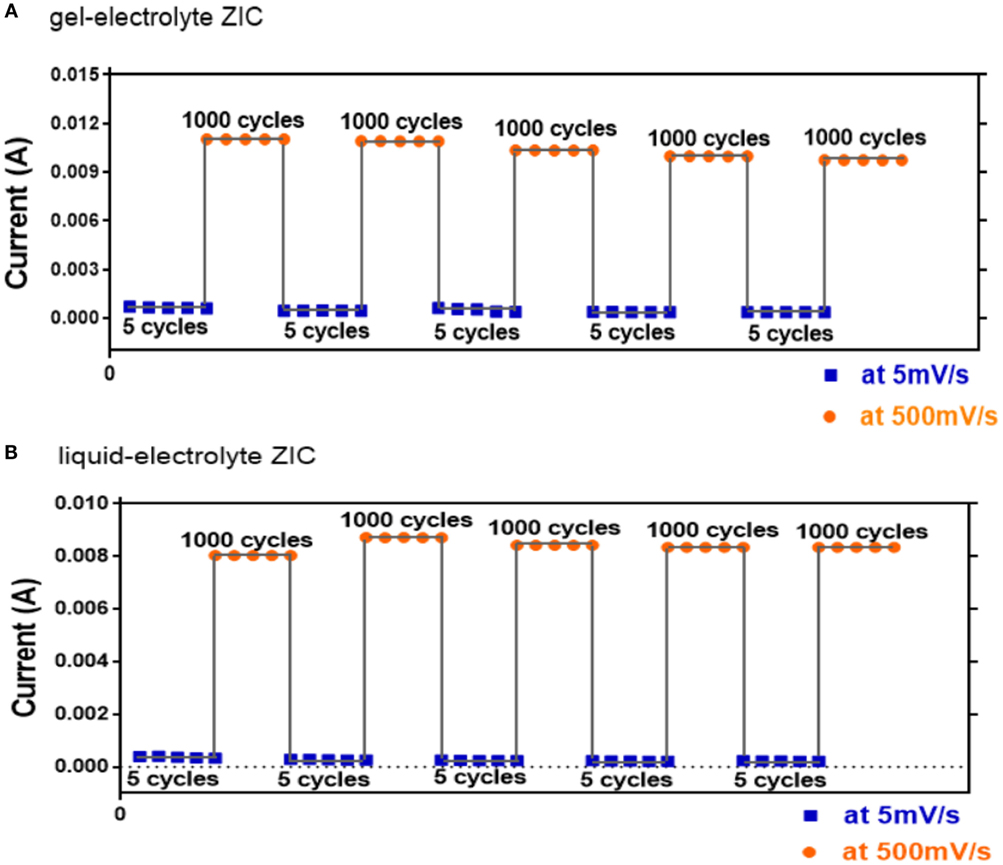
The cycling stability is also a crucial concern for supercapacitor. To investigate the electrochemical stability of the ZIC, the charge–discharge cycling was performed at the alternant scan rates of 5 and 500 mV s−1 (Figure 7). After 5000 cycles at 500 mV s−1, both liquid- and gel-electrolyte ZICs show the benign cycling stabilities, i.e., their current responses decrease slowly with the cycling numbers. This demonstrates that the pseudocapacitance effect introduced by the electrochemical reaction/adsorption and desorption between the Zn2+ ions and the oxygen functional groups of the oCNT cathode is stable with cycling. However, by comparing the current responses of both ZICs, the gel-electrolyte ZIC presents higher current values than the liquid-electrolyte one, which further suggests the better electrochemical capacitance behavior of the gel-electrolyte ZIC. The additional cycle life test of the gel-electrolyte ZIC based on the galvanostatic charge/discharge at 2 mA cm−2 is displayed in Figure S5 in Supplementary Material. The inherent change of the gel-electrolyte ZIC before and after cycling was further characterized using the EIS technique with a frequency range of 0.01 Hz–10 kHz (Figure S6 in Supplementary Material). The much smaller span of the single semi-circle at the high frequency for the ZIC after cycling indicates a smaller charge transfer resistance. But at the low-frequency region, the Nyquist plot curve of the ZIC after cycling inclines to the real axis, implying a higher ion diffusion resistance. The reduction of the ionic conductivity upon cycling might be responsible for the deterioration of the gel-electrolyte ZIC, which further explains the decrease of the current responses with the cycling numbers. Moreover, the morphology and structure of the zinc anode at different conditions were observed by SEM as shown in Figure S7 in Supplementary Material. Before cycling, the original zinc foil was flat, but its surface became rougher and more compact after cycling. The compact and uniform ripple-like zinc morphology without the formation of dendrites contributes to the favorable cycling stability of the ZIC, because the formation of dendritic zinc is accompanied with hydrogen evolution that is negative for cyclic stability (Lengsfeld and Shoureshi, 2014).
Conclusion
A ZIC was assembled by using a zinc anode, an oCNT cathode, and a ZnSO4-based electrolyte. The low-cost zinc metal and the non-toxic, non-corrosive ZnSO4 solution enable the ZIC to be a cost-effective and environmental-friendly device. Due to the electrochemical adsorption/desorption of Zn2+ ions on the oxygen-containing groups of the oCNT cathode, the pseudocapacitive behavior observed in this ZIC delivered a specific capacitance of 20 mF cm−2 at a scan rate of 10 mV s−1. Additionally, this ZIC was stable during a long cycling test (up to 5000 cycles). This work demonstrated a proof-of-concept ZIC and showed that the oxygen functionalities of the oCNTs contributed to the pseudocapacitance. Further study is required to improve the performance of the ZIC.
Author Contributions
D-WW supervised the project. YT conducted the experiment. D-WW and YT analyzed data. D-WW, YT, and RA wrote the manuscript.
Conflict of Interest Statement
The authors declare that the research was conducted in the absence of any commercial or financial relationships that could be construed as a potential conflict of interest.
Acknowledgments
We acknowledge the support from Faculty of Engineering, The University of New South Wales, and the Australian Research Council (DP 160103244). The authors acknowledge the facilities and the scientific and technical assistance from Mark Wainwright Analytical Centre, The University of New South Wales.
Supplementary Material
The Supplementary Material for this article can be found online at http://journal.frontiersin.org/article/10.3389/fenrg.2016.00034
References
Agrawal, S. L., and Awadhia, A. (2004). DSC and conductivity studies on PVA based proton conducting gel electrolytes. Bull. Mater. Sci. 27, 523–527. doi:10.1007/BF02707280
Cao, W. J., Greenleaf, M., Li, Y. X., Adams, D., Hagen, M., Doung, T., et al. (2015). The effect of lithium loadings on anode to the voltage drop during charge and discharge of Li-ion capacitors. J. Power Sources 280, 600–605. doi:10.1016/j.jpowsour.2015.01.102
Cao, W. J., Shih, J., Zheng, J. P., and Doung, T. (2014). Development and characterization of Li-ion capacitor pouch cells. J. Power Sources 257, 388–393. doi:10.1016/j.jpowsour.2014.01.087
Chen, Z., Augustyn, V., Jia, X., Xiao, Q., Dunn, B., and Lu, Y. (2012). High-performance sodium-ion pseudocapacitors based on hierarchically porous nanowire composites. ACS Nano 6, 4319–4327. doi:10.1021/nn300920e
Choi, Y. C., Lee, S. M., and Chung, D. C. (2001). Supercapacitors using single-walled carbon. Adv. Mater. 13, 497–500. doi:10.1002/1521-4095(200104)13:7<497::AID-ADMA497>3.3.CO;2-8
Dubal, D. P., Ayyad, O., Ruiz, V., and Gómez-Romero, P. (2015). Hybrid energy storage: the merging of battery and supercapacitor chemistries. Chem. Soc. Rev. 44, 1777–1790. doi:10.1039/C4CS00266K
Ferrari, A. C. (2007). Raman spectroscopy of graphene and graphite: disorder, electron–phonon coupling, doping and nonadiabatic effects. Solid State Commun. 143, 47–57. doi:10.1016/j.ssc.2007.03.052
Frackowiak, E. (2007). Carbon materials for supercapacitor application. Phys. Chem. Chem. Phys. 9, 1774–1785. doi:10.1039/b618139m
Frackowiak, E., and Béguin, F. (2002). Electrochemical storage of energy in carbon nanotubes and nanostructured carbons. Carbon N. Y. 40, 1775–1787. doi:10.1016/S0008-6223(02)00045-3
Ghaemi, M., Amrollahi, R., Ataherian, F., and Kassaee, M. Z. (2003). New advances on bipolar rechargeable alkaline manganese dioxide-zinc batteries. J. Power Sources 117, 233–241. doi:10.1016/S0378-7753(03)00161-7
Ghanbari, K., Mousavi, M. F., Shamsipur, M., and Karami, H. (2007). Synthesis of polyaniline/graphite composite as a cathode of Zn-polyaniline rechargeable battery. J. Power Sources 170, 513–519. doi:10.1016/j.jpowsour.2007.02.090
Jia, Z., Wang, B., and Wang, Y. (2015). Copper hexacyanoferrate with a well-defined open framework as a positive electrode for aqueous zinc ion batteries. Mater. Chem. Phys. 149, 601–606. doi:10.1016/j.matchemphys.2014.11.014
Kosynkin, D. V., Higginbotham, A. L., Sinitskii, A., Lomeda, J. R., Dimiev, A., Price, B. K., et al. (2009). Longitudinal unzipping of carbon nanotubes to form graphene nanoribbons. Nature 458, 872–876. doi:10.1038/nature07872
Kurra, N., Wang, R., and Alshareef, H. N. (2015). All conducting polymer electrodes for asymmetric solid-state supercapacitors. J. Mater. Chem. A 3, 7368–7374. doi:10.1039/c5ta00829h
Lee, J.-S., Tai Kim, S., Cao, R., Choi, N., Liu, M., Lee, K. T., et al. (2011). Metal-air batteries with high energy density: Li-air versus Zn-air. Adv. Energy Mater. 1, 34–50. doi:10.1002/aenm.201000010
Lengsfeld, C. S., and Shoureshi, R. A. (2014). Electrochemical Cell, Related Material, Process for Production, and Use Thereof. US patent 0211370 A1.
Lokhande, C. D., Dubal, D. P., and Joo, O. S. (2011). Metal oxide thin film based supercapacitors. Curr. Appl. Phys. 11, 255–270. doi:10.1016/j.cap.2010.12.001
Minakshi, M., Meyrick, D., and Appadoo, D. (2013). Maricite (NaMn 1/3 Ni 1/3 Co 1/3 PO 4)/activated carbon: hybrid capacitor. Energy Fuels 27, 3516–3522. doi:10.1021/ef400333s
Pandolfo, A. G., and Hollenkamp, A. F. (2006). Carbon properties and their role in supercapacitors. J. Power Sources 157, 11–27. doi:10.1016/j.jpowsour.2006.02.065
Park, S., Lee, K.-S., Bozoklu, G., Cai, W., Nguyen, S. T., and Ruoff, R. S. (2008). Graphene oxide papers modified by divalent ions-enhancing mechanical properties via chemical cross-linking. ACS Nano 2, 572–578. doi:10.1021/nn700349a
Pham, V. H., Cuong, T. V., Hur, S. H., Oh, E., Kim, E. J., Shin, E. W., et al. (2011). Chemical functionalization of graphene sheets by solvothermal reduction of a graphene oxide suspension in N-methyl-2-pyrrolidone. J. Mater. Chem. 21, 3371. doi:10.1039/c0jm02790a
Rahmanifar, M. S., Mousavi, M. F., and Shamsipur, M. (2002). Effect of self-doped polyaniline on performance of secondary Zn-polyaniline battery. J. Power Sources 110, 229–232. doi:10.1016/S0378-7753(02)00260-4
Ramkumar, R., and Minakshi, M. (2015). Fabrication of ultrathin CoMoO4 nanosheets modified with chitosan and their improved performance in energy storage device. Dalt. Trans. 44, 6158–6168. doi:10.1039/C5DT00622H
Ramkumar, R., and Minakshi Sundaram, M. (2016). A biopolymer gel-decorated cobalt molybdate nanowafer: effective graft polymer cross-linked with an organic acid for better energy storage. New J. Chem. 40, 2863–2877. doi:10.1039/C5NJ02799C
Simon, P., and Gogotsi, Y. (2008). Materials for electrochemical capacitors. Nat. Mater. 7, 845–854. doi:10.1038/nmat2297
Snook, G. A., Kao, P., and Best, A. S. (2011). Conducting-polymer-based supercapacitor devices and electrodes. J. Power Sources 196, 1–12. doi:10.1016/j.jpowsour.2010.06.084
Stankovich, S., Dikin, D. A., Piner, R. D., Kohlhaas, K. A., Kleinhammes, A., Jia, Y., et al. (2007). Synthesis of graphene-based nanosheets via chemical reduction of exfoliated graphite oxide. Carbon N. Y. 45, 1558–1565. doi:10.1016/j.carbon.2007.02.034
Taberna, P. L., Portet, C., and Simon, P. (2006). Electrode surface treatment and electrochemical impedance spectroscopy study on carbon/carbon supercapacitors. Appl. Phys. A 82, 639–646. doi:10.1007/s00339-005-3404-0
Trócoli, R., and La Mantia, F. (2015). An aqueous zinc-ion battery based on copper hexacyanoferrate. ChemSusChem 8, 481–485. doi:10.1002/cssc.201403143
Vatsalarani, J., Geetha, S., Trivedi, D. C., and Warrier, P. C. (2006). Stabilization of zinc electrodes with a conducting polymer. J. Power Sources 158, 1484–1489. doi:10.1016/j.jpowsour.2005.10.094
Vix-Guterl, C., Frackowiak, E., Jurewicz, K., Friebe, M., Parmentier, J., and Béguin, F. (2005). Electrochemical energy storage in ordered porous carbon materials. Carbon N. Y. 43, 1293–1302. doi:10.1016/j.carbon.2004.12.028
Wang, D. W., Wu, K. H., Gentle, I. R., and Lu, G. Q. (2012). Anodic chlorine/nitrogen co-doping of reduced graphene oxide films at room temperature. Carbon N. Y. 50, 3333–3341. doi:10.1016/j.carbon.2011.12.054
Wu, K.-H., Wang, D.-W., and Gentle, I. R. (2015). Revisiting oxygen reduction reaction on oxidized and unzipped carbon nanotubes. Carbon N. Y. 81, 295–304. doi:10.1016/j.carbon.2014.09.060
Xu, C., Li, B., Du, H., and Kang, F. (2012). Energetic zinc ion chemistry: the rechargeable zinc ion battery. Angew. Chem. Int. Ed. Engl. 51, 933–935. doi:10.1002/anie.201106307
Yan, J., Wang, Q., Wei, T., and Fan, Z. (2014). Recent advances in design and fabrication of electrochemical supercapacitors with high energy densities. Adv. Energy Mater. 4, 1–43. doi:10.1002/aenm.201300816
Yang, D., Velamakanni, A., Bozoklu, G., Park, S., Stoller, M., Piner, R. D., et al. (2009). Chemical analysis of graphene oxide films after heat and chemical treatments by X-ray photoelectron and Micro-Raman spectroscopy. Carbon N. Y. 47, 145–152. doi:10.1016/j.carbon.2008.09.045
Yu, H., Wu, J., Fan, L., Xu, K., Zhong, X., Lin, Y., et al. (2011). Improvement of the performance for quasi-solid-state supercapacitor by using PVA-KOH-KI polymer gel electrolyte. Electrochim. Acta 56, 6881–6886. doi:10.1016/j.electacta.2011.06.039
Zhai, Y., Dou, Y., Zhao, D., Fulvio, P. F., Mayes, R. T., and Dai, S. (2011). Carbon materials for chemical capacitive energy storage. Adv. Mater. 23, 4828–4850. doi:10.1002/adma.201100984
Zhang, L. L., Zhao, S., Tian, X. N., and Zhao, X. S. (2010). Layered graphene oxide nanostructures with sandwiched conducting polymers as supercapacitor electrodes. Langmuir 26, 17624–17628. doi:10.1021/la103413s
Keywords: supercapacitor, carbon nanotubes, zinc ion capacitor, functionalization, gel electrolyte
Citation: Tian Y, Amal R and Wang D-W (2016) An Aqueous Metal-Ion Capacitor with Oxidized Carbon Nanotubes and Metallic Zinc Electrodes. Front. Energy Res. 4:34. doi: 10.3389/fenrg.2016.00034
Received: 17 June 2016; Accepted: 20 September 2016;
Published: 03 October 2016
Edited by:
Guoxiu Wang, University of Technology Sydney, AustraliaReviewed by:
Manickam Minakshi, Murdoch University, AustraliaShichun Mu, Wuhan University of Technology, China
Copyright: © 2016 Tian, Amal and Wang. This is an open-access article distributed under the terms of the Creative Commons Attribution License (CC BY). The use, distribution or reproduction in other forums is permitted, provided the original author(s) or licensor are credited and that the original publication in this journal is cited, in accordance with accepted academic practice. No use, distribution or reproduction is permitted which does not comply with these terms.
*Correspondence: Da-Wei Wang, ZGEtd2VpLndhbmdAdW5zdy5lZHUuYXU=
 Yuheng Tian
 Da-Wei Wang