 Fernando Yanine
 Sarat Kumar Sahoo
 Antonio Sanchez-Squella3
 Challa Krishna Rao
94% of researchers rate our articles as excellent or good
Learn more about the work of our research integrity team to safeguard the quality of each article we publish.
Find out more
ORIGINAL RESEARCH article
Front. Energy Effic., 21 November 2023
Sec. Energy Efficiency Technologies
Volume 1 - 2023 | https://doi.org/10.3389/fenef.2023.1258384
This article is part of the Research TopicRecent Advances in Renewable Energy Automation and Energy ForecastingView all 14 articles
Introduction: Integrating renewables in the distribution sector is a rapidly growing reality in many countries, amongst which Chile’s stands out with an increasingly diversifiable electricity matrix. However, incorporating RES into the electricity distribution sector is altogether a steep climb at present, and seen by some as a formidable challenge for utilities. Likewise, the introduction of the Smart Grid agenda in Chile is imposing new challenges to electric utilities, mainly from a regulatory and technical viewpoint. In spite of this, big players like ENEL are moving forward decisively to meet this challenge, together with academia experts.
Methods: We model a sustainable energy system in the form of a smart microgrid operated by ENEL Chile comprising a hypothetical community we term a Sustainable Block™ representing an average residential building in Santiago. We then run simulations under different operating scenarios. The model takes into account the most recent innovation in the legal regulatory framework that governs the energy market in Chile ―Law 20,571―which allows for benefits to those that generate and consume part or all of their energy needs while connected to the grid. Thus, the community considers the option of consuming green energy from the microgrid with an energy storage unit to supply electricity to the 60-apartment complex of various sizes. Under this scenario, a set of energy homeostasis strategies that comprise the homeostatic control and energy management systems help balance the electricity supply versus demand.
Results: The model proposed comprises a set of energy homeostasis management strategies that have been designed in the power control and energy management system to balance supply and demand while optimizing the availability and use of green energy. Thus, the energy homeostasis model optimizes the microgrid supply while injecting excess power to the grid. In this context, the community residents exhibit different consumption profiles, therefore they may willingly participate of the sustainable energy strategy as prosumers, displaying a thriftier consumption, and enjoying a lower electric bill while using more renewable energy. The model’s energy homeostasis control and energy management system, especially designed for electric power systems, seeks to maintain a dynamic balance between supply and demand and is being currently discussed with ENEL Chile as part of the intelligent control options for the introduction of distributed generation systems tied to the grid, in order to complement their electric power distribution services.
Discussion: The model being proposed comprises a community of residents that we term a sustainable block™ representing an average residential building in Santiago, Chile, which aims to take advantage of Law 20,571 in Chile that allows independent electric power generators to benefit by selling electricity to the grid and also allows independent consumers (mostly residential) to generate part or all of their energy needs while connected to the grid. The community may consume electricity from the microgrid with energy storage, operated by the local electric company, supplying electricity to the 60-apartment complex of various sizes. In his regard, just like in the human body where the brain, particularly the hypothalamus, is primarily responsible for the regulation of energy homeostasis, by monitoring changes in the body’s energy state through various mechanisms, the role of energy storage as well as the role of prosumers are the key enabling factors of energy homeostasis and their interaction are highlighted in the overall analysis.
“Investment in clean energy technologies is significantly outpacing spending on fossil fuels as affordability and security concerns triggered by the global energy crisis strengthen the momentum behind more sustainable options”, according to the International Energy Agency (IEA) World Energy Investment 2023 report (International Energy Agency, 2023a). Soaring electricity prices, particularly in Europe, amidst the dire energy shortage situation is afflicting the population in various countries (Lan et al., 2022). Thus, leveraging distributed energy resources (DER) by means of solar, energy storage, flexible loads along with community energy integration and power sharing might well be a potential solution to the current crisis from the electric power distribution side. This is not only important and sensible, but also urgent, especially in today’s world where electric tariffs are increasing as never before, and harsh, extreme weather conditions are being felt everywhere. According Fatih Birol, executive director of the International Energy Agency, upon presenting the World Energy Outlook 2022 at the Senate in Rome, stated: “Development of renewables - the key to achieving energy independence” (International Energy Agency, 2023b). His speech focused specifically on the need to increase the use of renewables amidst the current energy crisis that is whiplashing Europe and how it is causing the huge surge in the cost of electrical and thermal energy. On the other hand, Francesco Starace, ENEL’s CEO, predicted that the real boom in the worldwide adoption of renewables will happen in the next few years, which seems perfectly feasible and likely given the need to transform the energy matrix, in line with a more sustainable outlook (Paris, 2022). This coincides with the Italian government seeking to provide a legal framework―similar to Law 20,571 in Chile―to incentivize the creation of renewable energy communities (Chamorro et al., 2021; Trevisan et al., 2023).
We are undergoing a profound technological change, where the internet is taking over in every major industry―electricity distribution included―through the incorporation of IOT and the widespread use of 5G networks (De Lotto et al., 2022). Such a change is transforming economies, markets, and industry structures everywhere, wherein products and services are changing rapidly and will change even more in the years to come as the world rides on the digital transformation rollercoaster impacting every aspect of our lives. Consumer behavior, jobs, labor markets and living standards will all change with the rapid pace of the digital transformation, but the impact may be even greater than expected on our society as these new sets of standards set in and people become ever more dependent on electricity and high-speed communication networks (Kimani et al., 2019; Chen et al., 2021). This will no doubt further stretch the need for electric utilities to find new, more sustainable, flexible and resilient energy solutions, that can not only sustain but also foster such societal transformation to a greener, more sustainable energy matrix, with far-reaching implications from there onward (Birol, 2020). Such energy solutions must be incorporated not only to the generation sector but also must extend to the distribution sector. A foreseeable change indeed, that we will expect to witness in the very near future, concomitantly with the advances of IOT and its far-reaching role in this massive networking transformation wave that is set to revolutionize our society as a whole.
Looking at the near future, we can certainly foresee an upsurge in DGS, along with the convergence of AI (artificial intelligence) and systems communication through electric power cables in real time everywhere transforming the electric power industry, in the context of smart grid. These technologies are already changing the electric power distribution landscape and, along with internet of things (IOT), are expected to redefine the way industries, businesses and countries’ economy function. AI needs data in real time and very large processing capacity, which modern computers provide. Thus, AI enabled IoT creates intelligent machines that simulate smart behavior and provide support in decision making with little or no human interference. Looking at microgrids being enabled by AI and IOT applications, we may see that an IoT-based microgrid can provide the community of consumers―whether residential or commercial/industrial―the opportunity to enjoy independent, much more reliable and cost-effective electricity which will empower such communities and allow them to thrive, especially in areas that are rich in renewables. Hence, with the installation of an IoT-based microgrid that also has IOT applications encompassing each and every load and also the grid, owners will be able to improve the efficiency of their energy consumption substantially, which will be a key attractiveness factor for its commercialization. AI also will help to forecast energy supply and demand variations better and faster across a microgrid. With AI, a microgrid can successfully manage a large and complex energy structure, for example, a large power plant (involving several microgrids with large scale energy storage units) that provides power to a large community of residential and commercial loads in an urban area. Intelligent control systems will thus be able to monitor and adjust in real time every system variable, including new variables such as different renewable power generation units or rapidly changing energy prices when there is more power available in storage and/or the grid electric tariff is cheaper. IoT-based technology can also improve the efficiency and reliability of wind energy microgrids in those areas where there is excellent wind speed (Li et al., 2023), like in the south of Chile, especially in all of the Magallanes region. Real-time monitoring and control of the microgrid can help to minimize downtime and optimize the use of available resources, reducing operating costs and maintenance requirements (Li et al., 2023).
The role of electric utilities like ENEL Chile is of paramount importance when we realize that electric power distribution industry is a natural monopoly firmly regulated by government agencies. Hence, if we ever expect to see an overhaul of this industry towards energy sustainability, we must work with local electric companies to advance this agenda. In order to use sustainable energy systems (SES) in the form of distributed generation solutions like the microgrid, we must address the methods of harnessing the available energy resources in the most economically efficient manner. We must also ensure that renewable and alternative energy sources be utilized in conjunction with the grid, as two complex systems coupled together and assisting each other, whereby both systems interact and support each other operationally as is the case with the grid-tied microgrid (Chamorro et al., 2021; Chen et al., 2021; De Lotto et al., 2022; Paris, 2022; Trevisan et al., 2023).
Nowadays, electric power lines can also transmit communication using existing electrical wiring, whether in a building or through the electric utility grid’s network cables. Hence, data signals can be sent through the wiring. An example of narrowband application of this technology is automatic meter reading currently being used by many electric utility companies (Qiao et al., 2023). With the possibility of transmitting not only electricity but also data, voice and images through their networks, the electricity distribution industry sector is to become a major player on many fronts in the immediate future if not sooner (Ghelani, 2022). Thus, in order to overcome the challenges of the near future―particularly in regards to climate change perils and the need to further energy sustainability―one of the main concerns of electric utilities must be to ensure a reliable, flexible and resilient distribution of electricity and heat to the diversity of energy consumers in today’s society, a strong focus on research and development on new and existing technologies for electricity distribution transformation will be necessary. Hence, as the complexity of the electric power grids increases, along with the growing demand, so will the requirements for greater stability, reliability, security and efficiency, together with environmental and energy sustainability concerns (Lan et al., 2022; Paris, 2022; International Energy Agency, 2023b; International Energy Agency, 2023a).
Public utilities in general, and especially electric utilities have―for the most part― understood the magnitude of this change and its implications, as well as the reasons why such a change is necessary and imminent. Hence, public and private investment and cooperation in the industry, along with incentives to be more sustainable on the electricity consumption side are encouraged so as to further the industry transformation (Jain et al., 2017; Tiep et al., 2021). This is just what electric utilities like ENEL are doing in Chile and elsewhere, while bringing about a true revolution in energy generation and management (Paris, 2022; International Energy Agency, 2023b). Part of the response to the challenges of said transformation is the concept of smart microgrid and the sustainable block™ (Yanine et al., 2018a) and how these two interact with the grid. Microgrids are independent small-scale distributed generation systems, usually situated close the loads and operating connected to the grid. They can be personalized for different energy consumers and climate conditions and can be integrated in urban or rural environments, being capable of autonomously generating and storing energy for the distribution of electricity and heat to consumers (Driesen and Katiraei, 2008; Kroposki et al., 2008; Series, 2009; Rao et al., 2022). Hundreds of microgrid projects have been developed worldwide thus far in different parts of the world, adding up to a total capacity exceeding 1.7 GW (Tiep et al., 2021). The need to attenuate or ameliorate peak demand hurdles and to react swiftly and effectively to unforeseeable events that can affect frequency and voltage levels such as threats emanating from environmental threats are also a major concern of electric companies (Cordova and Yanine, 2012). The need to secure a steady flow and to smooth out abrupt changes in their energy supply in order to respond more effectively and proactively to changing energy needs, variations in the grid’s power supply and to environmental disruptions are critical (Yanine et al., 2019; Yanine et al., 2022).
Considering the projected growth rates in electricity consumption, and the cost-effectiveness and the far-reaching implications of distributed generation systems like the microgrid (Adefarati and Bansal, 2019; Wolsink, 2020; Bogdanov et al., 2021), it is time to consider a more active participation of these systems in the distribution sector, with a realistic vision of future energy needs rather than treating the solution just as an oddity in the energy matrix (Jiayi et al., 2008; ENEL, 2014; Adefarati and Bansal, 2019; Li et al., 2019). This will require incorporating traditional power system elements of analysis such as: stability analysis of microgrids in steady and dynamic states of operation, frequency control, protection coordination issues, and energy quality (Jiayi et al., 2008; ENEL, 2014; Adefarati and Bansal, 2019; Li et al., 2019). The role of the electricity users and their willingness to become more sustainable and mindful in their electricity consumption needs is also of great relevance. These new energy players, called “prosumers” by some authors (Hambridge et al., 2017) due to the nature of their role (producers and consumers), play a key role in the possibility of making DGS in the distribution sector a reality. These new customers require clear signals from the electric tariff viewpoint, so that their electricity consumption behavior is aligned with the electrical energy system’s proper functioning and supportive of the sustainable green energy consumption of the community where the DGS is to be installed. We have termed this community of energy prosumers a sustainable block™ so as to act as proactive consumers that aim to benefit the whole while, at the same time, benefiting themselves (Hambridge et al., 2017).
Distributed Generation (DG) is defined as “an electric power source connected directly to the distribution network or on the consumer side of the meter” (Jiayi et al., 2008). Likewise, the IEEE Institute defines DG as the generation of electricity from installations that are sufficiently smaller than the centralized generation units (Bhadoria et al., 2013), something which clearly encompasses an ample range of electric power generation solutions that can interconnect with the grid at any point near the load in a power system. The means and conditions of such interconnection are subject to strict local regulatory operation frame and―unless it is in an isolated area, where there is no distribution grid―the local electric utility operating in the area must be involved. DGS can be of two types: the isolated type, supplying the local consumption on a discrete basis, usually in the case of small communities (Paris, 2022) or else, operating connected to the power grid, supplying electrical energy to the community of users and also to rest of the power system if there is excess generation, after the batteries are fully charged. There are many technical and economic advantages related to the implementation of distributed generation in distribution sector that have been widely researched, such as the reduction of active and reactive energy losses, improvement in reliability, reduction of a blackout probability and peak hours’ demand reduction; nevertheless, the regulatory aspects have not been covered in depth (Jiayi et al., 2008; ENEL, 2014). However, there is little research related to the social impact regarding the benefits of new policies and regulations that can foster and advance DG in the electric power distribution sector, along with specific urban challenges or local governance factors are likewise not widely analyzed (Gottwalt et al., 2011; Bhavsar et al., 2015; Jain et al., 2017).
An important area of research for distributed generation has been energy management and differential pricing strategies (Gottwalt et al., 2011; Palensky and Dietrich, 2011; Bhavsar et al., 2015; Cheng et al., 2019), some authors have proposed the establishment of a demand side management (DSM) systems based on an hourly price variation price-structure, as a means to further energy sustainability policies based on energy efficiency and off-peak consumption practices (Wolsink, 2020; Yanine et al., 2022). However, electricity demand peaks are not always of regular occurrence but rather sporadic, and may occur at unforeseen times, usually due to abrupt changes in weather patterns, as well as other environmental or social phenomena, causing a severe strain on the electric power supply services for utilities. One way to minimize such occurrence is by curtailing demand and promoting a more sustainable use of electricity when renewables are present in DGS connected to the grid. Electric utilities may offer alternative tariff structures like, for example, Multi-Time-Of-Use (Multi-TOU) and Multi-Critical-Peak-Pricing (Multi-CPP) (ENEL, 2011; Wolsink, 2012; ENEL, 2017) both of which offer economic incentives to those that willingly accept to use them.
Likewise, in electrical distribution systems, distributed generation (DG) can be beneficial for consumers as well as for electric utilities for a number of reasons, many of which have already been cited in this paper. This is specially so in places where the electric supply from centralized power generation plants is impractical/unfeasible due to technical and/or economic reasons or when―as in Chile’s case for the most part―the electricity distribution networks’ infrastructure is frail, vulnerable and without the appropriate backup systems should natural disasters or environmental threats strike all of a sudden. The epitome of distributed generation systems (DGS) is no doubt the microgrid, employing renewable and non-renewable energy sources. The main generation resources that comprise a microgrid are wind and solar energy, along with rapid dispatch energy sources like small gas turbines, microturbines, and fuel cells, and sometimes small hydroelectric power plant.
In Chile, in particular, the ENEL Group is actively developing renewable energy generation and advancing its Smart Grid transformation agenda. A good example of this is its Ollagüe project in Chile (ENEL, 2017). The Ollagüe plant is a successful project that combines innovation, taking advantage of the natural sources available in the territory, public-private alliances and the participation of the local community, creating an electrification model that can be replicated in other isolated communities. It is an isolated microgrid capable of providing 24 h of continuous energy to the neighboring Ollagüe village of Chile situated in the far northern region of the country (ENEL, 2017). It is the first hybrid plant in the world that combines solar, wind and cogeneration energy with electrical energy storage in molten salt batteries, providing energy to homes at high altitudes and in extreme climatic conditions, with temperatures between −20°C and +20°C. Ollagüe is a small town located on the border between Chile and Bolivia, at more than 3,500 m above sea level, and at a distance of 160 km from Calama. Less than a hundred families from the Quechua community live there, whose main activity is sheep farming. Since December 2014, part of the reality of these families has changed, since an innovative and sustainable idea was implemented in the place, which allowed the community to have sustainable electricity since then, 24 h a day. Enel Green Power (EGP) built a state-of-the-art renewable energy plant, which uses the resources of the Sun, wind and storage, configuring an off-grid system, which has allowed the community constant access to electricity.
Another important development in the electric power distribution industry towards the Smart Grid transformation is ENEL’s Isernia Project (ENEL, 2011). Isernia is a town and commune in the southern Italian region of Molise, and the capital of the province of Isernia. The Isernia Project, where ENEL is developing its first smart grid in Italy (ENEL, 2011), provides a new approach for distributed generation by connecting and managing a renewable energy generation, distribution network and storage systems using lithium-ion batteries, as well as by encouraging distributors and customers to play a new, more active role as ‘prosumers’ who can produce and consume energy at the same time (Jiayi et al., 2008). On the other hand, policymakers are increasingly focusing on strategies to decentralize the electricity distribution sector, and also seeking to advance in a more flexible and nimble electric power distribution operation and the advancement of renewables (Lan et al., 2022; International Energy Agency, 2023a).
An incentive for advancing renewable energy generation and consumption is the current law 20/25 in Chile for reconverting the energy matrix to achieve a larger percentage of renewables in the generation sector (Nasirov et al., 2015). In October of 2013, the Chilean government enacted Law 20/25 and announced entry into force of the Concessions Law. Initiative doubled the commitment to clean energy from 10%, established in the previous regulations for the year 2024, to 20% for the year 2025 meaning that 20% of all the energy sold must come from non-conventional renewable energy sources, thus doubling the goal set forth by Law 20,257. Thus, the energy sustainability road map of Chile is set on solar energy as the most abundant and least expensive means of electricity generation, even more so than hydroelectricity generation as of today. This explains itself in part by the stark drop in solar photovoltaic (PV) generation costs, while the technology has attained greater efficiency levels, and also by the many environmental, social and legal hindrances that new hydroelectricity projects have faced over the last 15 years, most of them never seeing the light and therefore, making it very difficult for investors to dare venturing on new such projects which have high infrastructure and civil engineering costs coupled with an uncertain destiny down the road (Nasirov et al., 2015; Silva and Nasirov, 2017).
The path towards energy sustainability is a difficult one, and it must also be walked gradually since, aside from major investments on the part of electric utilities, it requires complex legal and social adjustments, as well as greater societal awareness of its need no matter what. It is a necessity which presupposes the incremental adoption of new and available technologies, many of which are changing drastically with new advances in electronics and communications technologies. A shift in industry practices and policies is indispensable, coupled with the proper economic incentives to take such a big leap if we are serious about advancing towards a more sustainable and secure electric power supply (Moslehi and Kumar, 2010; Basak et al., 2012).
The article comprises five distinct sections, beginning in section one with the introduction to the subject and a preamble addressing the electric power distribution industry’s changes and technological transformation of the distribution sector, especially with regard to the Smart Grid agenda that is being led by major electric utilities like ENEL worldwide. The methodology comes in section two and right after, we present the energy homeostasis system model and its unique characteristics and operation for smart microgrid systems tied to the grid. Section three explains the control and energy management of the model and its approach to controlling electric supply based on the demand characteristics of the consumers within a sustainable block―a 60-story residential building in Santiago de Chile. Section four presents the simulation results and discusses their significance and implications in terms of implementing sustainable energy consumption strategies in electricity distribution sector. Conclusions come afterward.
We model a sustainable energy system in the form of a smart microgrid operated by ENEL Chile comprising a hypothetical community we term a Sustainable Block™ representing an average residential building in Santiago. We then run simulations under different operating scenarios. The model takes into account the most recent innovation in the legal regulatory framework that governs the energy market in Chile ―Law 20,571―which allows for benefits to those that generate and consume part or all of their energy needs while connected to the grid. Thus, the community considers the option of consuming green energy from the microgrid with an energy storage unit to supply electricity to the 60-apartment complex of various sizes. Under this scenario, a set of energy homeostasis strategies that comprise the homeostatic control and energy management systems help balance the electricity supply versus demand. Results are assessed and analyzed thereafter. The overall objective is to maximize green power supply capacity, wherein the different energy users and their energy consumption profiles play a crucial role as “active loads”, being able to respond and adapt to the needs of the grid-tied microgrid while enjoying economic benefits.
Here we explore the role of energy homeostasis in regards to electricity tariffs and energy use by consumers. Energy homeostasis is that property of energy systems by which they can reach and maintain a dynamic balance between supply and demand at all times just like a governor would in traditional electric power plants, albeit somewhat differently. Here, the energy system is able to respond to perturbations stemming from technical issues, environmental challenges and fluctuations in demand very rapidly and effectively so as to attain optimal equilibrium between the amount of power available for supplying the loads and the demand for energy coming from the loads (Cordova and Yanine, 2012; Caballero et al., 2013; Yanine and Sauma, 2013; Yanine et al., 2014a; Yanine et al., 2017; Yanine et al., 2018a; Yanine et al., 2018b; Yanine et al., 2019; Yanine et al., 2022). This is essential in order to preserve systems stability and continuity of operations in electric power systems’ operation. Here both reactive and predictive homeostasis play a key role in sustaining the energy system’s functional integrity. Both reactive and predictive homeostatic control have the same purpose: to maintain the current state of the energy system within an operationally appropriate range (homeostasis) so as to be able to respond to the energy demand from the loads. Reactive homeostatic control does this by counter-regulatory reactions via a feedback mechanism to deviations of system-critical variables from their operational range. Predictive homeostatic control is distinguished from reactive homeostasis in the sense that the regulatory mechanisms do not operate after the facts (reactive) but before, anticipating (predicting) the occurrence of a given scenario and thus adjusting the energy system accordingly. These system-critical variables are part of the control system’s model (Cordova and Yanine, 2012; Caballero et al., 2013; Yanine and Sauma, 2013; Yanine et al., 2014a; Yanine et al., 2017; Yanine et al., 2018b; Yanine et al., 2019; Yanine et al., 2022). The control system’s model also measures performance in terms of customer satisfaction when he or she obtains the benefits set forth by the tariff structure and the microgrid takes advantage of Chilean law that regulates self-generation (Yanine et al., 2019; Yanine et al., 2022). The system seeks to offer economic incentives for customers who consume more thriftly and sustainably and also generates economic benefits the electric utility (ENEL, 2014). Predictive homeostasis in energy systems, on the other hand, has to do with the energy system’s capability to foresee very near future scenarios, monitor in real time key variables (defined in the control system) of the electric power grid, the loads, along with the weather, and environmental indicators such as heat, wind speed, solar irradiance and also to be able to anticipate events and prepare itself in order to procure the necessary resources, make the necessary adjustments and communicate them to the consumers and to the system’s operator (ENEL, 2014; Hambridge et al., 2017).
Our homeostatic control model proposes a hybrid tariff which mixes an hourly rate based on time-of-use (TOU) with a rate based on the deviation of the system’s frequency—something which may affect voltage levels—and whose value represents the imbalance between generation and consumption. This hybrid rate, which can be calculated every minute, allows for secondary frequency regulation and becomes an economic incentive for those that exhibit a sustainable and responsible electricity consumption. The homeostatic control model has been tested successfully in our microgrid lab and proof of concept has been discussed with ENEL for the purpose of assessing its potential implementation in the electricity distribution sector in Chile and other parts of the world.
Customers must have intelligent metering installed by the electric company in order to use this grid-connected microgrid control model that also encompasses communication system between the microgrid operator (the local electric company) and the community residents. The model has been proposed to ENEL, considering the incorporation of a distributed generation (DG) plant like a smart microgrid discussed here, based on solar PV energy with energy storage capability. Customers can evaluate the pros and cons of the contract and choose willingly whether to be part of the energy sharing from the microgrid or not. Those that choose not to be part may continue to use grid supply only just like they regularly do. Those that do agree to be part of the sustainable block™ will be able to access electric power supply at more convenient rates as a whole but abiding by the standards and constraints imposed by the DG plant generating renewable energy.
The above model results in significant economic benefits for the entire community and for the electric utility as well. It is important to note here that difference between the sustainable block™ scheme, as opposed to the usual single load figure, is the fact that a sustainable block™ encompasses not only the electric utility’s customers but also the grid-tied microgrid, including the energy storage unit (Cordova and Yanine, 2012; Yanine et al., 2018a; Yanine et al., 2019; Rao et al., 2022; Yanine et al., 2022). The algorithms presented here as part of the control model are based on the energy homeostasis model derived from previous work by the corresponding author, which was done on homeostatic control of sustainable energy systems (SES). The research initiative was born in 2010 upon initiating his doctoral program and continued after that with his postdoctoral fellowship successfully realized with the support and collaboration of ENEL Chile.
Unlike the far north and many regions of the south of Chile, where wind is quite abundant and stable thus ensuring a regular wind supply, unlike the central region where solar photovoltaic (PV) is the norm. Currently there are 20 wind power generation projects underway in various regions of northern and southern Chile, and more are expected in the years to come but clearly Chile renewables’ investment is much more geared towards solar because of its unique abundance and superior solar irradiance being one of the best in the world (Londono, 2017). Renewable energy projects are large and very complex engineering projects that demand sizeable investments and are required by law to submit several feasibility studies, including an environmental impact assessment, before any work can begin. In the case of wind power plants this is much more so but nevertheless wind generation power plants are not new in Chile, and have been around for some time now and are expected to grow in numbers towards the year 2025 like some of the large projects of wind farms built in northern and southern Chile (Morgan et al., 2014). However, all of these large projects entail significant infrastructure investment and engineering costs plus a good negotiation with the local communities, most of which are reluctant to see their landscapes invaded by such monstrous towers or by large surfaces covered by solar panels. Small hydroelectric plants are also disliked and regarded as invasive (Yanine et al., 2014b; Leal-Arcas et al., 2023). Such endeavors can only be offset by a good size project that fully complies with the local environmental and regulatory legislation, and that can render the expected benefits that such projects yield for investors.
The residential community, as already explained, is termed a sustainable block™. The term comprises the synergistic and positive interaction and emergent behavior supportive of sustainable energy systems’ operation that complex systems interaction of this nature can be expected to exhibit (Caballero et al., 2013; Yanine and Cordova, 2013; Yanine and Sauma, 2013; Yanine et al., 2014a; Yanine et al., 2014b; Yanine et al., 2014c; Yanine et al., 2015; Yanine et al., 2017; Yanine et al., 2018b). The characteristics of the residential community are shown in Table 1 below.
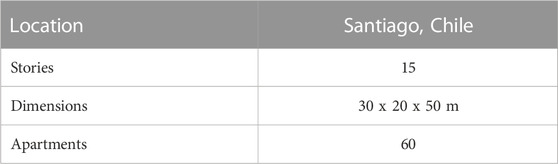
TABLE 1. Building description.
As mentioned before, the scenario under study is comprised of a solar PV system, a group of residential customers, the electric distribution grid and an energy storage unit (battery bank). The microgrid is operated by ENEL Chile and residents can get electricity from the microgrid and from the local grid, albeit with different tariffs, as an incentive to those residents that choose to abide by the sustainable energy system’s arrangement of green energy sharing. The microgrid’s excess energy generation, after the batteries are fully charged, is to be injected to the grid, as it is not being used by the residential community, thus considering the incentive that the current Net Billing law (law 20,571 in Chile) offers (Energypedia, 2015) and this is reflected in the simulation results.
The model’s energy homeostasis control and energy management are shown in Figure 1. It especially designed for electric power systems, seeks to maintain a dynamic balance between supply and demand and is being currently discussed with ENEL Chile as part of the intelligent control options for the introduction of distributed generation systems tied to the grid, in order to complement their electric power distribution services.
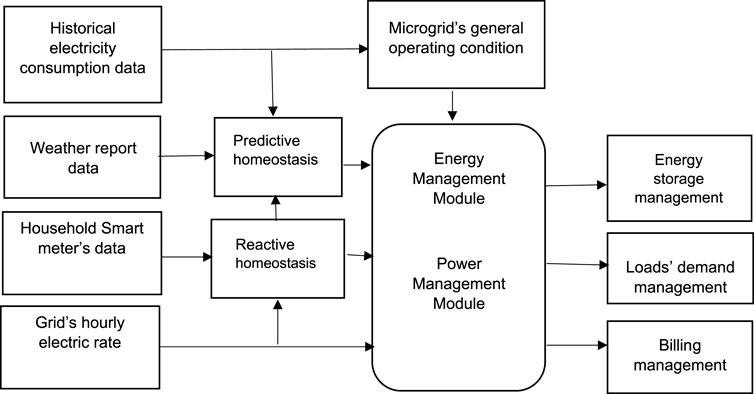
FIGURE 1. Above is the energy homeostasis model for the sustainable block™. Both the energy management system (EMS) and the power management system (PMS) comprise the microgrid’s homeostatic control, inspired by energy homeostasis principles (Yanine et al., 2020).
The control system monitors in real time the available capacity and the power demand from the loads, considering demand side projection, in order to decide whether to use from the microgrid only, including the energy storage unit or to also draw power from the grid, and this goes on throughout the day. In addition, the storage status of the batteries is continually monitored, looking always to minimize operating costs. The energy storage unit managed by the homeostatic control system decides when and how much energy to charge or discharge, drawing energy from the energy storage unit when the electric tariff is more expensive. The system keeps track of each resident’s electricity consumption through the smart meter. Those residents who exhibit a sustainable electricity consumption that falls within the consumption ranges that the energy pool can support considering tariffs structure and the microgrid’s energy supply for the different hourly blocks, get to enjoy a lower electric bill. On the other hand, those who choose to consume more power in said hourly blocks, falling, outside the sustainable range, foregoing the needs of the rest of the community (thriftless consumption) will be notified through an interface and/or alarm and will be disconnected by smart switches (smart plug), leaving them with the grid-only option.
The billing process is calculated by the electric company with data from the smart meter processed by the billing procedure in the microgrid. The system is responsible for prorating payments between users according to their monthly electric consumption. Those customers who choose to align with the energy sustainability strategy of the community, preferring to consume less energy and to move their power-intensive consumption (e.g., dishwasher, washing machine, vacuum cleaner, electric heater) to hours of less demand receive economic compensation (reward) with a lower electric bill.
Below are the equations that express the energy homeostasis (dynamic balance) model that is the basis of the homeostatic control system operating in the microgrid the energy homeostasis regulation mechanisms are discussed in length in these articles (Caballero et al., 2013; Yanine and Sauma, 2013; Yanine et al., 2014a; Yanine et al., 2017; Yanine et al., 2018a; Yanine et al., 2018b):
where
The power supply is a function of the internal state of the energy systems at time
The
The demand response paradigm is an interesting option that makes sense when you are sharing a limited supply of green energy and are seeking economic compensation for keeping a lower, more thrifty and sustainable energy consumption. The benefits to consumers, such as those considered in the example analyzed in this paper, in the form of an economic compensation or reward for their thrifty and efficient electricity consumption particularly during certain times of the day and/or exhibit a willingness to be flexible in the timing of their electricity consumption needs. Hence, one of the emerging trends in this area is the enactment of laws and regulations such as the Net Billing law in Chile (Energypedia, 2015) that incentivizes or encourages the use of distributed generation of electricity by means of renewables (Yanine and Cordova, 2013; Energypedia, 2015).
For this project we used commercial solar panels readily available in the local market, whose characteristics are the following, in standard test conditions (STC) (i.e., irradiance of 1000W/m2, spectral value of 1.5 a.m. and temperature of 25°C). These are presented below in Table 2. (Yanine et al., 2020). The resulting installed power capacity of the DG plant is 41.58 kW (Yanine et al., 2020).
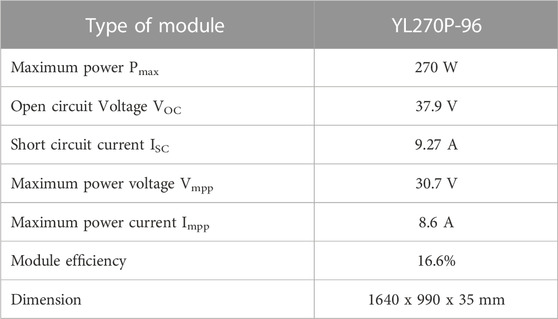
TABLE 2. PV panels’ characteristics (Yanine et al., 2020).
To obtain the generation profiles of the photovoltaic plant, in the time scale required (15-min time intervals), a simplified model is adopted according to (Van Aubel and Poll, 2019). The power output of the plant will be given by the relation (1).
Solar irradiation and temperature data are both pieces of information that can be readily obtained from the Department of Geophysics of the University of Chile [http://www.dgf.uchile.cl]. To validate the model, the annual energy generated was contrasted with the results obtained and properly adjusted afterwards using a proprietary software especially developed by the research team for this testing. Below are shown the electric power generated per hour on average for the different months of the year in Figure 2A, and the energy generated by the photovoltaic plant per month throughout the whole year in Figure 2B.
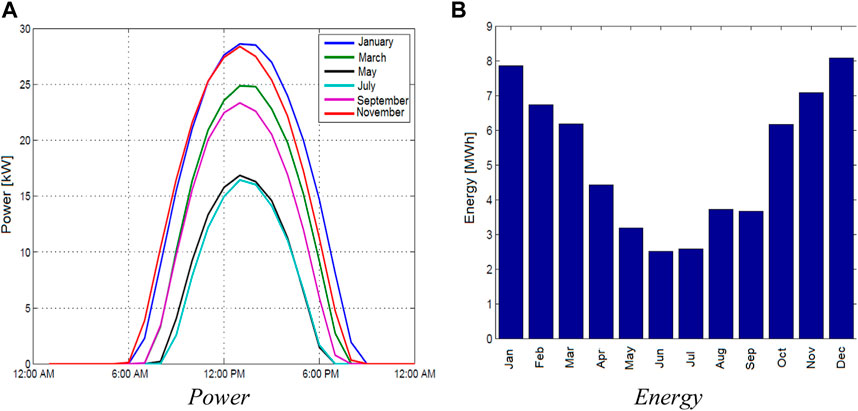
FIGURE 2. Generation of the PV plant. (A) depicts the electric power generated per hour on average for the different months of the year, while (B) shows the energy generated by the photovoltaic plant per month.
Figure 2A depicts the electric power generated per hour on average for the different months of the year, while Figure 2B shows the energy generated by the photovoltaic plant per month.
Smart meters are essential for electric companies to keep track of the billing and also of the overall state of the electric supply networks, helping optimize the grid services. A smart meter is an electronic device that records energy consumption of the electric company’s customers and exchanges consumption data with energy suppliers, which is used for monitoring and billing. In addition to storing energy consumption data, smart meters also allow real time information on the status of the electricity grid to be collected by the system’s operator, including making it possible to identify supply interruptions, inefficient voltages and incorrect connections. The smart meter considered in this study (model CERN 1 offered by ENEL Smart Metering Division), measures electrical variables of customers, stores it every 15 min and then sends the data via the power line (known as PLC for power line communications) to where it will be processed. This information reaches a data concentrator, installed close to the distribution transformer, which in turn transfers the information to the electric company via the internet. The smart meter allows the electric company to monitor and process electricity consumption, monitor failures and bill the customers much more accurately than human reading. The energy supplier needs the relevant meter readings, which in many occasions it cannot read directly from the meter (Zheng et al., 2013; Van Aubel and Poll, 2019).
The demand evolution being considered in the model is obtained from a pilot plan supported by ENEL which consists on the installation of 100 residential smart meters in Huechuraba, a suburb of the city of Santiago, Chile which presents large and growing residential and commercial urban communities since 2018.
Figure 3 below illustrates the demand curves and the monthly consumption of the sustainable block™, corresponding to 60 residential customers. In (a) we have the aggregate demand curve throughout the day and in (b) we have the monthly energy consumption throughout the year.
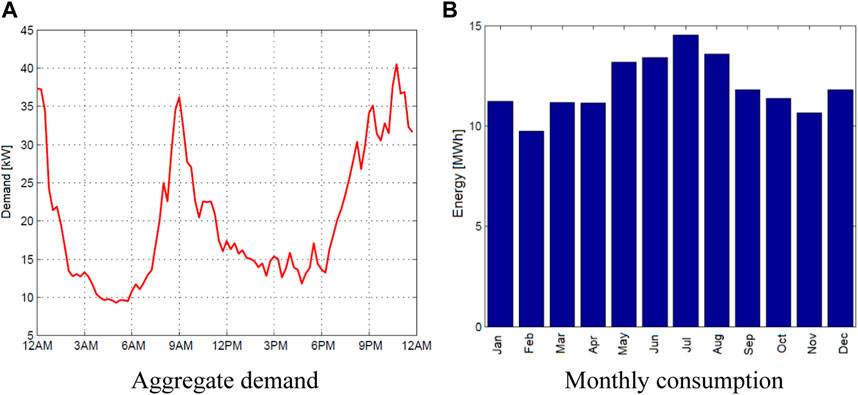
FIGURE 3. Above are curves of aggregate demand and monthly consmption of the community’s residents of the 60 apartments in a residential building in Santiago, Chile which, along with the microgrid and the grid comprise a sustainable block™ (Yanine et al., 2020).
The role of the energy storage system is of great imperative in order to achieve the energy sustainability objectives of the system. Energy storage is essentially a buffer that acts as an energy homeostasis enabler (Caballero et al., 2013; Yanine and Sauma, 2013; Yanine et al., 2014a; Yanine et al., 2017; Yanine et al., 2018a; Yanine et al., 2018b; Yanine et al., 2020). Energy storage can provide electricity in response to sudden changes or drops in electricity, provide electricity frequency and voltage regulation, and defer or avoid the need for costly investments in transmission and distribution to reduce congestion and also allows the residents to consume cheaper energy during peak hourly demand, especially when the electric tariff is higher during winter months than in spring and summer months. Energy storage also allows for peak shaving to occur, as shown in Figure 4, making possible for the community residents to reduce their power consumption (“load shedding”) quickly and for a short period of time to avoid a spike in consumption and higher costs. This is made possible in part by the on-site power generation system, namely the microgrid, but also, and more importantly, by relying on the energy storage system.
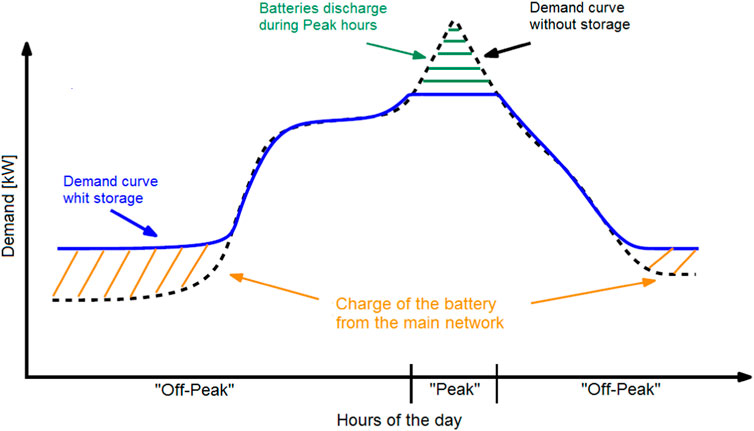
FIGURE 4. The graph depicts the so-called peak shaving, where energy storage helps flatten the demand curve, discharging during peak hourly demand and charging during off-peak hours.
Energy storage also provides flexibility to the system and is a key supporting tool for renewable energy integration in the electric power distribution sector (Tejada-Arango et al., 2019; Zsiborács et al., 2019). It can balance centralized and distributed electricity generation, while also contributing to energy security. Energy storage can also provide a complement to grid supply, supporting the integration of higher shares of variable renewable energy in electric transportation services such as buses and subway, buildings or industry (Tejada-Arango et al., 2019; Zsiborács et al., 2019).
Lithium-ion batteries provide 100% of their rated capacity, regardless of the rate of discharge. Lead-acid batteries, on the other hand, are less efficient but cheaper, and typically provide less usable energy with higher rates of discharge. They are usually limited to 50% of the rated capacity to prevent diminished lifespan (Tejada-Arango et al., 2019; Zsiborács et al., 2019). Below in Table 3 there is a comparison between the two types. Notice the difference of cycle life between the two. While the lead-acid battery can reach a maximum of 1,200 cycles at 50% DOD, the lithium-ion battery can reach 1900 cycles at 80% depth of discharge (DOD).
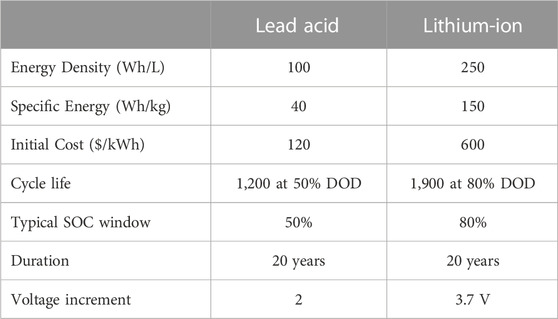
TABLE 3. Comparison table between lead-acid vs. lithium-ion batteries.
An important element to consider in homeostasis-based supervisory control is the rate or tariff regulation being applied by the electric company operating the distribution of electricity, which normally takes into account the fact that the energy demand is differentiated per hour. Therefore, ‘peak hours’ of electricity demand are considered between 6 p.m. and 11 p.m. from the first of April to the 30th of September, as defined in the Chilean regulation law. The BT2 and AT2 tariffs are purchased power, on the other hand, BT3 and AT3 rates are maximum demand registered. In our model we applied the above rates considering electric consumption during off-peak and on peak hours and according to the following criteria.
a) When the purchased power or the maximum energy demand registered is being used during peak hours, regardless whether said power or energy is or is not used in other hours of the year, the consumption will be qualified as “present on peak” and the corresponding unit price will be applied. It is understood that the purchased power or the maximum energy demand registered is being used during peak hours, when the quotient between the average demand of the customer in peak hours and its purchased power (for BT2 and AT2), or its maximum registered demand (for BT3 and AT3), is greater or equal to 0.5 (ENEL Distribucion, 2023).
b) When the purchased power or the maximum registered energy demand is being used partially during peak hours, regardless of whether power or energy is or is not used during other hours of the year, the consumption will be considered as “partially present in peak”, and hence the corresponding price will be applied. It is understood that the purchased power or the maximum registered demand is being used partially during peak hours, when the quotient between the average demand of the customer during those hours and the purchased power (in case of BT2 and AT2), or its maximum registered demand (in case of BT3 and AT3), is less than 0.5. This allows the system to distinguish one particular consumption behavior from another and reflect the pricing and incentives accordingly as discussed in sections 2.5 and 2.6 (ENEL Distribucion, 2023).
However, should it occur that in the period of 60 consecutive minutes during peak hours, the quotient between the average power used by the customer and its purchased power (in case of BT2 and AT2), or its maximum registered demand (in case of BT3 and AT3), exceeds 0.85 and this fact is not an isolated event but occurs frequently, electric consumption will be classified as “present in peak”. Hence, monthly charges for maximum demand purchased during peak hours and maximum demand purchased of the BT4.1 tariff, as well as the monthly charge for the maximum purchased demand from tariff BT4.2 will be charged even if the power consumption is zero. They will be obtained by multiplying the kW reading of purchased power by the corresponding unit price (ENEL Distribucion, 2023).
The monthly charges for the maximum power demand registered by the system during peak hours with tariffs BT4.2 and BT4.3 will be charged as follows.
○ During the months where peak hourly demand is registered (on-peak hours), it will be applied to the maximum power demand effectively registered during peak hours in each month at the price set by the electric tariff.
○ During the months which do not register peak hours, it will be applied the corresponding unit price to the average of the two highest peak demands during peak hours for the peak period months.
Below in Table 4 we have electricity tariffs according to the Chilean electricity law and their characteristics. The monthly charge for maximum power demand supplied from the BT4.3 tariff will be charged to customers, and this charge will be calculated taking the average reading of the two highest maximum power consumption registered during the last 12-month period, including the month when the billing was issued, with the corresponding unit price. Details of different charges and their corresponding prices according to the supply rate electric can be found in (ENEL Distribucion, 2023). For the operation conditions exposed in this work and since it seeks to modify the consumption pattern towards a more efficient use of energy, and thereby receive economic benefits, the chosen tariff to be used in the microgrid is an Hourly dependent. These types of electric tariffs are the ones with the lowest price for energy and provide the necessary flexibility towards an economically efficient operation yielding maximum profit, while the control model ensures stability and service quality as required by the electric company’s legal regulatory framework. Thus, the chosen hourly rate will be option 3 (AT-4.3 or BT-4.3) (ENEL Distribucion, 2023).
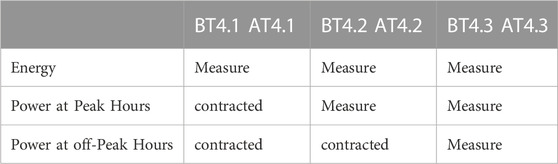
TABLE 4. Electricity tariffs according to Chilean electricity law and their characteristics. Source: https://www.cne.cl/tarificacion/electrica/.
The above table, taken from the National Energy Commission website (Comision Nacional de Energia) of Chile shows the three possible tariff alternatives for electric company customers. The difference between the BT and AT rates is in the voltage supply. The AT4.3 and BT4.3 tariffs are usually used by customers who have the possibility of reducing their demanded power during peak hours, hence are more flexible.
Below on Figure 5 is the logical architecture of the microgrid system developed to operate connected to grid with energy storage, to supply a community of 60 apartments, aiming to reduce the electric supply costs while providing incentives for customers willing to shift habits towards a more efficient, more sustainable energy consumption while enjoying green electricity supply from distributed generation from the electric company.
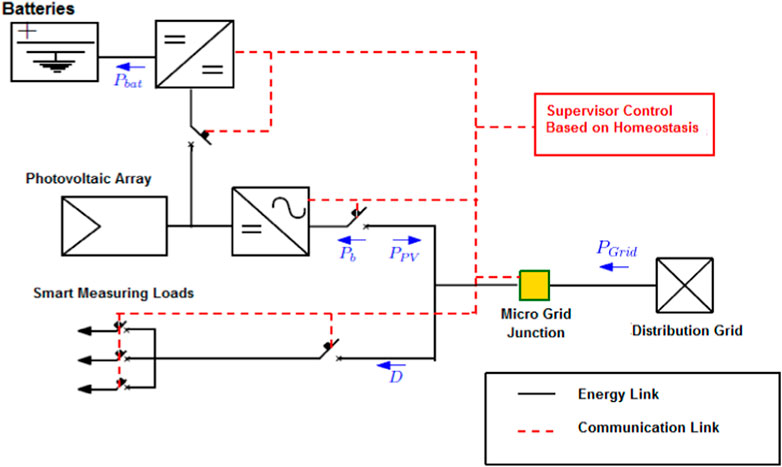
FIGURE 5. The microgrid’s logical architecture diagram.
In the diagram above in Figure 5 depicts the power in the batteries
Likewise, each of the component’s specifications utilized in the microgrid is summarized below in Table 5.
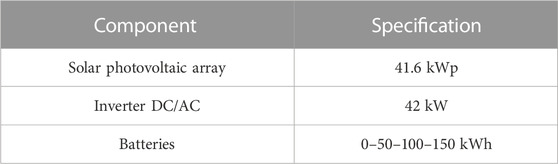
TABLE 5. Components’ specification for the microgrid.
The energy homeostasis model is what inspired the control strategy applied in this case model. Unlike common control methods, this model encompasses both the grid and the energy consumers as key pillars of the sustainable block™ where each resident can act as a prosumer, not just as a regular, passive consumer of electricity. This behavior can lead to mutual economic benefits for the consumers as well as for the electric utility and is what in previous work has been characterized as sustainable loads (Yanine et al., 2019; Yanine et al., 2020), or active loads, as opposed to passive loads that have no interaction with the network (Yanine et al., 2020). The aim behind this strategy is for the system to be able to self-regulate and adjust to a more sustainable energy consumption habit as a whole community, whenever distributed generation systems, operated by the local electric company and supplying limited renewable generation are present.
The diagram in Figure 6 represents the model’s homeostatic control strategy. The control algorithm begins by measuring of the photovoltaic (PV) power generated and the energy demand of each apartment. Then, calculates the total power demanded by the community
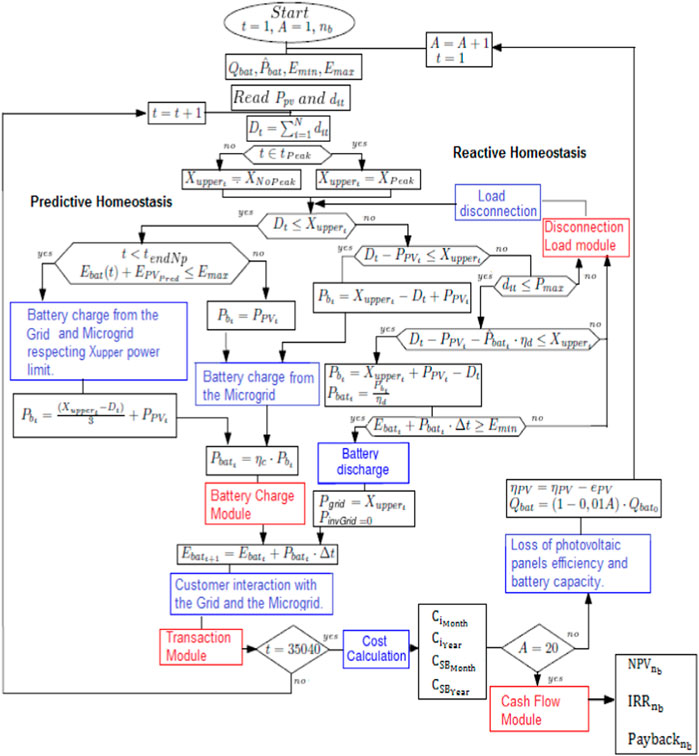
FIGURE 6. Homeostatic control strategy diagram depicting electric power supply to the building’s residents considering an hourly tariff (Yanine et al., 2018a).
As depicted above, if the total electric power demand is less than the demand limit set for the community of residents with the distributed generation supply, all of the photovoltaic (PV) energy generated by the microgrid will be assigned to charge the batteries.
The battery charge algorithm depicted in Figure 7 below takes into account the battery’s technical constraints, such as maximum current or the state-of-charge (SOC).
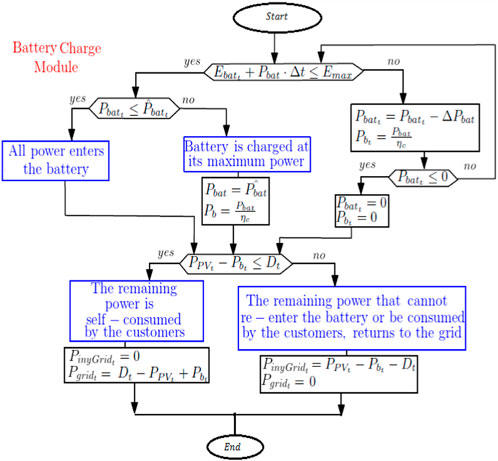
FIGURE 7. The battery charge module algorithm.
The photovoltaic energy that is not being able to be absorbed by the batteries because they are fully charged, is readily consumed by the residents and the surplus (if there is any) is injected into the grid, taking advantage of the existing Net Billing law (Energypedia, 2015). On the other hand, if condition (3) is not met, the control system proceeds to evaluate condition (4), and if this condition is met, battery is charged by the remaining power (Yanine et al., 2018a).
Otherwise, if condition set by (4) is not met, the battery will be discharged in order to satisfy the restriction of maintaining the demand of the community in the limit
The expression in (5) has total (aggregate) demand of the community minus the power generated by the solar photovoltaic array minus the product of the power stored in the batteries multiplied by the discharging efficiency coefficient
During this period, the power demand from the network
In order to bound the power to its established limit point and thus avoid disconnections, the battery must be charged at its maximum capacity before entering peak hours. This procedure is hard to achieve since the energy provided by the PV plant depends directly on weather conditions. An alternative strategy is to introduce an Artificial Neural Networks algorithm that can predict the energy generated by the photovoltaic plant from a given moment until before entering peak hours (Yanine et al., 2019; Yanine et al., 2020). Above in Figure 7, the algorithm diagram shows the logic behind the operation of the battery charge module of the homeostatic control system.
On the other hand, if condition (7) is true, the battery will be fully charged. If otherwise, energy is absorbed from the network to satisfy the limit imposed by the controller (Yanine et al., 2019; Yanine et al., 2020). Renewable energy is produced in limited quantities and its production is affected by intermittence; thus, certain conditions should be imposed to provide cheap energy to consumers while supporting the grid, with a consequent reduction of their electricity bills and carbon footprint (Yanine et al., 2019; Yanine et al., 2020). Figure 8 depicts the transaction module which is in charge for assigning the energy quota for each customer based on the available supply in the system and calculate the energy flow among customers and the grid. In order to accomplish the above mention procedure, criteria A and B could be chosen (Yanine et al., 2019; Yanine et al., 2020).
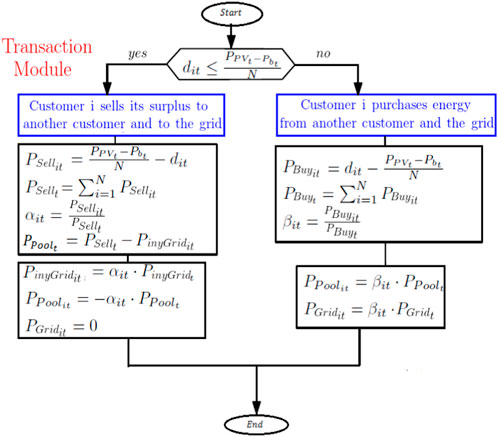
FIGURE 8. Flow diagram depicting renewable energy supply and consumption management under equitable criteria.
Criterion A: Customers share the Nth part of generated renewable energy, where each customer owns one Nth part of the renewable energy produced by the microgrid (Yanine et al., 2019; Yanine et al., 2020).
The transaction module begins by discriminating between s with energy in excess or the deficit in energy in the system, by using condition (8) (Yanine et al., 2019; Yanine et al., 2020). Figure 8 below depicts renewable energy supply and consumption management under equitable criteria.
The customer
All of the excess energy available in the system,
Then the energy supplied to customers with energy deficit and injected into the grid by the customers with excess
If the condition in (8) is not met, this means that there is a resident with energy deficit. Hence, this resident must use energy from the grid
Criterion B: There is substantial renewable energy supply available, based on customer merit.
The flow diagram shown in Figure 9 represents the logic behind the energy sustainability strategy based on energy homeostasis. The strategy calls for community residents to maintain an efficient, sustainable electricity consumption so as to make the renewable energy supply from the microgrid plentiful. This strategy requires residents to be willing to change such power consuming tasks as laundry, dishwashing machines, vacuum cleaner, etc., To those hourly periods when there is more energy available in the system and electric tariff is on off-peak hours.
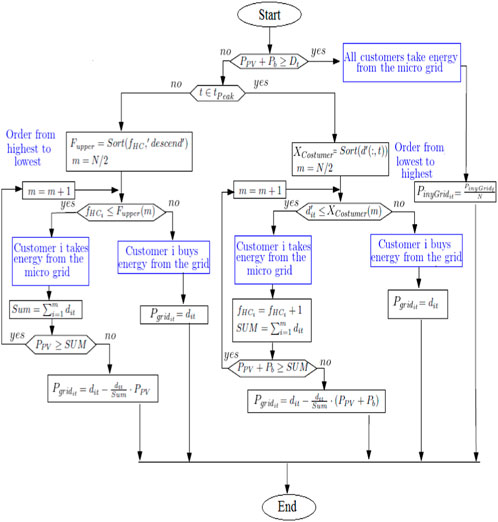
FIGURE 9. Flow diagram depicting renewable energy supply to customers inspired by an energy sustainability strategy based on energy homeostasis.
The condition in (15) checks for available energy in the system considering the power generation from the microgrid and the energy that is available in the energy storage unit (batteries). If condition in (15) is satisfied, all residents may receive the energy supply available in the system from the microgrid and the batteries so as to meet their consumption. The surplus energy generated by the system is injected to the grid and customers will receive an equal economic benefit (prorated) for that contribution (Yanine et al., 2020).
If condition (15) is not met, this means that the energy available in the system is not enough to satisfy the residents’ aggregate demand. In this case, those that consume less or whose demand is low compared to others whose demand is higher, may benefit as explained earlier, by allowing their unused energy quota to be available to those in need of more energy and thus be rewarded for it. This is especially relevant for those residents that exhibit a low energy consumption during peak hours (Yanine et al., 2019; Yanine et al., 2020).
The algorithm’s control module managing peak hours’ demand is in charge of discerning about each resident’s consumption profile, thus identifying those that exhibit a thrifty consumption or simply consume less from those that consume more energy and exhibit a higher need for power. It does this by discriminating according to their energy consumption from lowest to highest. The first
In expression (16) the grid power supply is equal to the demand of each resident
Due to the high cost of electricity during peak hours demand, the control system strategy seeks to encourage residents to consume more during off-peak hours, especially by transferring their power consumption needs to off peak hours. In order achieve this, the cost of the electricity supply is transferred to the residents by means of an internal rate that is applied upon differentiating between those residents whose demand is low from those whose demand is high. Figure 10 bellow illustrate the application of this internal tariff, which will be based on the monomic energy price which consists of a single equivalent price per kWh consumed. The monomic price that considers charging the customer per both, the energy and the power consumption (Yanine et al., 2019; Yanine et al., 2020).
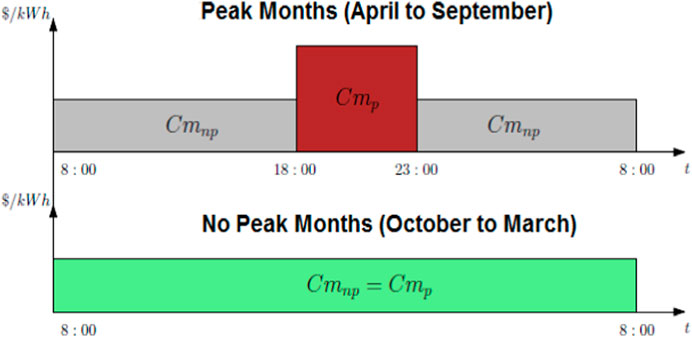
FIGURE 10. Internal rate for the community of 60 residents. The red square block shows the hourly block between 18:00 h (6 p.m.) and 23:00 h (11 p.m.) during which peak hourly demand occurs.
The monomic price, which is depicted in expressions (17), (18) and (19) is to be used to compute electric consumption billing during peak hours and off-peak hours, respectively. The monomic price for peak hours (
After 1 year of evaluation (
We ran the simulation for up to 20 years’ time which corresponds to the photovoltaic panels’ lifetime, wherein a loss of efficiency per year is expected in the photovoltaic panels as established by the original equipment manufacturer (OEM) that is equal to 0.6% which goes along with a linear reduction of battery capacity, which is also considered, so that the final battery capacity is 80%. The depth of discharge of the battery is adjusted so that no intermediate replacements occur (Yanine et al., 2020).
Customers are free to choose between different electric rates in the corresponding voltage level. Among the rates offered by the local electricity company, described in a previous section, only BT-1 tariffs and THR are competitive for levels and consumption characteristics of individual customers. In this scenario the option of incorporating a microgrid with a photovoltaic array upon the roof of the building with an energy storage system is a good option in terms of distributed generation alternative due to its reliability and cost effectiveness. As illustrated in Figure 11, the smart meter of each resident will register the apartment’s electricity consumption but it will not discriminate whether the electricity is supplied by the grid or by the microgrid, unless the proposed energy homeostasis-based control system of the microgrid in the work presented here is implemented through an interface connection operated by the electric company so as to enable the smart meter to differentiate one type of supply from the other (Yanine et al., 2020).
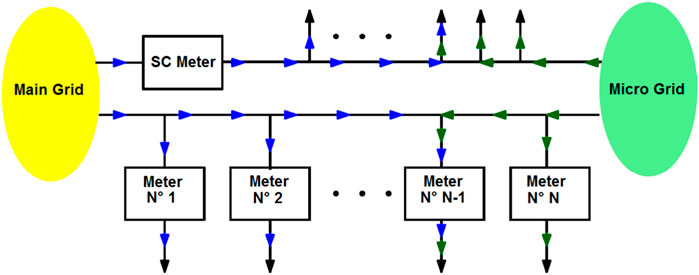
FIGURE 11. Energy flow and smart metering for separate customers.
Upon confirming the simulation results, we are able to effectively validate the homeostatic control model, and upon looking at the graphs we can ascertain that the energy homeostasis strategy utilized to manage the available energy supply for the community of residents yields the expected benefits, as opposed to not having the distributed generation alternative but just the grid-only option (Yanine et al., 2020).
Figure 12 below shows the power flow of the microgrid simulated without the energy storage option so as to corroborate the distinct benefits of having this resource available. In this case, what the microgrid cannot supply is supplied by the grid and therefore, the grid is modeled here as an infinite bus. As we can see from the figure’s interpretation, the key period, where much of the demand takes place is between 9 a.m. and 4 PM. The period between 10 a.m. and 2 p.m. is where the energy storage should operate at full capacity, supplying its stored energy, but in this case, it is absent, so the yellow line is flat. In the same period, we can also see that the photovoltaic (PV) power generation is at its maximum, and the hump reaches its peak between 12 p.m. and 1 PM. Therefore, during this period of time the grid is absorbing whatever excess power being produced by the grid-tied microgrid. However, later in the day, at around 6 p.m., the power demand intensifies significantly, with the maximum demand period being between 7 p.m. and 10 p.m., and begins to gradually decrease from there onward. During that period the microgrid’s production without energy storage is simply not enough to account for the full demand, so the grid comes in to assist and it supplies the rest. Likewise, the aggregate demand (red line) rises between 8 a.m. and 6 p.m. as expected, and this can be seen represented by the yellow straight line that represents the period.
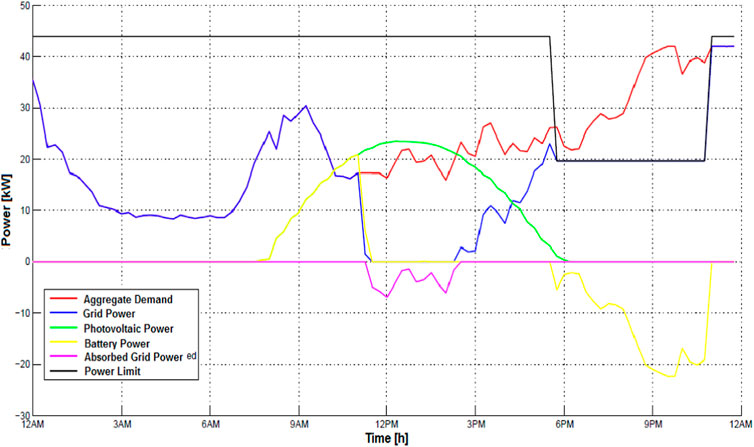
FIGURE 12. the power flow of the microgrid simulated without the energy storage option and depicting the hourly tariff.
Figure 13, on the other hand, depicts the power flow with the energy storage system operating as part of the microgrid. The homeostatic control system is always prioritizing to charge the batteries (the energy storage system) and, upon reaching the maximum power demand limit in peak hours, the batteries may discharge if required, a process known as load shedding or peak shaving. The controller adjusts the demand limit at peak hours considering the capacity and maximum power delivered by the battery bank. The batteries are also expected be charged (if so needed) by the grid supply when the electric tariff is low (Yanine et al., 2020).

FIGURE 13. the power flow with the energy storage present as part of the microgrid and hourly tariff depiction.
The practice of load shedding or peak shaving is a strategy very commonly used for avoiding peak demand charges during those hourly periods when electricity tariff is higher accounting for high or peak demand from the electrical grid supply, as is the case illustrated here, and very especially during winter season due to electric heating and hot water pumps operation. This is done by quickly reducing power consumption during intervals of high demand. Energy storage such as on-site energy storage systems depicted here is especially helpful and cost-effective during higher demand periods so as to reduce overall cost associated with residential and commercial electricity consumption.
Again, we see here that the high demand period between 8 a.m. and 10 a.m., we have the batteries operating and supplying power as needed, while the microgrids’ full production is on. Grid power reaches a peak in demand right around 9 a.m., and then starts decreasing since the microgrid with energy storage is operating at maximum capacity. The batteries are usually being charged during 2 p.m. and 5 p.m. which is a period of low electricity demand for the community. However, at 6 p.m. demand starts rising and the high demand period is between 7 p.m. and 10 PM. The red line represents the aggregate demand, and we can see that between 12 p.m. and 2 p.m. is a period where we see power being absorbed by the grid, which means that there is excess power being produced so it can be injected to the grid. Like in Figure 12, during the period when the microgrid’s production with energy storage is not enough to account for the full electric power demand (between 7 p.m. and 10 p.m.), the grid comes in to assist and supply the rest.
The batteries’ state of health depends heavily on the operating conditions, provided that the installation was done properly. Overload, temperature range, intensity and charging cycling are all aspects to be considered. Batteries are used essentially for peak shaving and a solar power plant, as is the case of our grid-tied microgrid. It is highly beneficial to install both, an adequate solar PV capacity and on-site energy storage to ensure that the community can enjoy the highest utility bill savings possible. Thus, during the day, the homeostatic control system charges the on-site batteries with solar energy from the PV panels and batteries may also be charged by the grid supply when electric tariff is low (off-peak hours). Hence, we are still technically saving money, and when we need to power the community, we can use whichever electricity source is cheapest at that precise moment in time–whether it is from the photovoltaic (PV) panels’ supply during the day or from the stored solar power (in the batteries) in the evening or during “peak” hours, which in this case is between 7 p.m. and 10 p.m. The only time that the microgrid needs to draw electricity directly from the grid is when PV panels are not operating because of the absence of sunlight and when the batteries are completely empty.
One of the main factors to consider in order to extend the lifetime of the batteries is the Depth of Discharge (DOD) result of the operation cycles. The depth of discharge complements the state of charge (SoC) in the sense that as the depth of discharge increases, the State of Charge decreases. There is a direct relation between the depth of discharge and the cycle life of the batteries (Tejada-Arango et al., 2019; Zsiborács et al., 2019). As shown in Figure 14, batteries are only discharged to do peak shaving, as explained before, when the demand for power is high, during peak months (April through the end of August in Chile); out of this period, the battery bank is in floating state and ready for backup whenever the (grid) main network is not available for whatever reason.
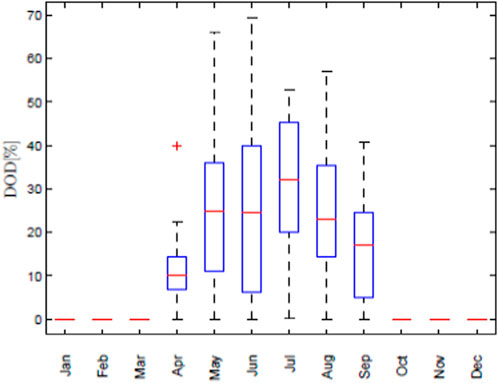
FIGURE 14. First year’s monthly depth of discharge (DOD) of the battery bank, showing the months of higher electricity consumption during winter season (April through the end of August).
Finally, as a side note, two types of batteries were evaluated for simulation purposes, the traditional Acid-Lead batteries and the Lithium-ion battery. In both cases, technical operating limitations were considered. Keeping the batteries between 40% and 80% ensures that they have a longer lifespan. Particularly in the case of lithium-ion batteries they are stressed the most during the top and bottom 20% of their charging range; and the closer to 100% or to 0% we get, the greater the stress on the batteries. That is why keeping charging up to 80% maximum is much healthier, and never letting it drop (discharge) below 20%. The control system will stop charging at around 80%, more or less, and start recharging at around 20%, so as to keep batteries from aging age rapidly, and last longer, compared to routine full charges (Tejada-Arango et al., 2019; Zsiborács et al., 2019). Hence, we can see in Figure 14 that in the months of June and July, is when the greater use of the batteries is required, as in 75% of the cases the DODs are lower than 40%. This strategy is used to extend the lifetime of the storage devices as much as possible.
Urban energy system modeling is an important area of research towards advancing distributed generation and energy sustainability. In this paper we have proposed an energy homeostasis model to ENEL Chile as a proof of concept for a real scale prototype that is to be implemented hopefully in 2024 with ENEL’s collaboration. The model envisions a smart microgrid tied to ENEL’s distribution grid and operating on a residential building as part of distributed generation agenda being considered moving forward. As shown in this example, for off-peak demand in the spring and summer months, a flat tariff is applied where the price for energy is constant throughout the day. Because of the fact that the payment should be amortized by the maximum power demand and by peak power demand, measured during peak months, with the sale of energy to the grid during the months of low power demand (where not only there is lower consumption but also more photovoltaic (PV) energy is generated).
The energy cost during off-peak months is higher than in the base case (tariff BT-1). Given that the battery bank is used to decrease the demand for power, it is easy to amortize with the sale of energy; hence the incorporation of batteries helps the internal rate to be below the base case during off-peak hours. From the conditions used to define the energy cost at peak and off-peak hours, it can be observed that the tariff is self-regulated and allows to transfer the cost to each individual customer and, at the same time, encourages the efficient consumption of energy. Customers who decide to be more flexible and efficient, exhibiting a thriftier use of electricity, are able to transfer part of their consumption from peak hours to low demand hours, which will cause a decrease in the energy cost in low demand hours, due to the additional available energy. On the other hand, and since there will be less energy to amortize the charge for the maximum peak demand, the monomic cost of peak hour energy will increase. Therefore, without an effective change in peak power demand, the control system simply establishes that customers who exhibit an inefficient and inflexible electricity consumption of the supply that is made available by the microgrid, shall double-subsidize efficient customers. Even more important is the fact that this tariff proposal will allow customers to adapt and have incentives to change their habits and be more efficient, which will trigger thereafter a sustained reduction of the maximum demand in peak hours and with it, an effective saving by the community of energy consumers as a whole.
A singular aspect of the homeostasis model proposed in this work is the fact that customers, being considered as one single load by the electricity company, create the need to establish internal rules regarding the way to consume energy, to identify the diversity of energy consumption habits in the community and how to transfer the costs of operation and power supply to customers individually. A simple way to do so, as demonstrated in the simulation, is to transfer costs through an internal rate based on the monomic price for energy differentiated during peak and non-peak hours, the latter being considerably higher. This monomic price considers the cost per kW of electric power that must be realized and self-regulates by absorbing the dynamics represented by the external tariff and by the customers, so that the costs of supplying the customers of the microgrid are always unequivocally transferred while encouraging the residents to consume more electricity during off-peak hours so as to facilitate the operation of the control system and to reduce the demand limit adjusted for peak hours in the future.
The original contributions presented in the study are included in the article/Supplementary Material, further inquiries can be directed to the corresponding author.
FY: Conceptualization, Data curation, Formal Analysis, Investigation, Methodology, Software, Validation, Writing–original draft. SS: Conceptualization, Formal Analysis, Investigation, Methodology, Supervision, Validation, Writing–original draft. AS-S: Conceptualization, Investigation, Project administration, Validation, Writing–original draft, Writing–review and editing. AB: Conceptualization, Formal Analysis, Investigation, Methodology, Supervision, Writing–original draft. CK: Conceptualization, Formal Analysis, Investigation, Methodology, Supervision, Validation, Writing–original draft.
The author(s) declare that no financial support was received for the research, authorship, and/or publication of this article.
We wish to thank ENEL Distribucion S.A. (https://www.enel.cl/) in Chile for their great support, unrelenting commitment to advancing this research agenda, and for the valuable technical assistance provided all along.
The authors declare that the research was conducted in the absence of any commercial or financial relationships that could be construed as a potential conflict of interest.
The author KS declared that they were an editorial board member of Frontiers at the time of submission. This had no impact on the peer review process and the final decision.
All claims expressed in this article are solely those of the authors and do not necessarily represent those of their affiliated organizations, or those of the publisher, the editors and the reviewers. Any product that may be evaluated in this article, or claim that may be made by its manufacturer, is not guaranteed or endorsed by the publisher.
Adefarati, T., and Bansal, R. C. (2019). Reliability, economic and environmental analysis of a microgrid system in the presence of renewable energy resources. Appl. energy 236, 1089–1114. doi:10.1016/j.apenergy.2018.12.050
Basak, P., Chowdhury, S., Halder nee Dey, S., and Chowdhury, S. P. (2012). A literature review on integration of distributed energy resources in the perspective of control, protection and stability of microgrid. Renew. Sustain. Energy Rev. 16 (8), 5545–5556. doi:10.1016/j.rser.2012.05.043
Bhadoria, V. S., Pal, N. S., and Shrivastava, V. (2013). “A review on distributed generation definitions and DG impacts on distribution system,” in Proceedings of the International Conference on Advanced Computing and Communication Technologies (ICACCT™-2013), Panipa, November 2013, 1–5.
Bhavsar, Y. S., Joshi, P. V., and Akolkar, S. M. (2015). “Simulation of Microgrid with energy management system,” in Proceedings of the 2015 International Conference on Energy Systems and Applications, Pune, India, November 2015, 592–596. doi:10.1109/ICESA.2015.7503418
Birol, F. (2020). The coronavirus crisis reminds us that electricity is more indispensable than ever. Paris: International Energy Agency.
Bogdanov, D., Ram, M., Aghahosseini, A., Gulagi, A., Oyewo, A. S., Child, M., et al. (2021). Low-cost renewable electricity as the key driver of the global energy transition towards sustainability. Energy 227, 120467. doi:10.1016/j.energy.2021.120467
Caballero, F., Sauma, E., and Yanine, F. (2013). Business optimal design of a grid-connected hybrid PV (photovoltaic)-wind energy system without energy storage for an Easter Island’s block. Energy 61, 248–261. doi:10.1016/j.energy.2013.08.030
Chamorro, H. R., Yanine, F. F., Peric, V., Diaz-Casas, M., Bressan, M., Guerrero, J. M., et al. (2021). “Smart renewable energy communities-existing and future prospects,” in Proceedings of the 2021 IEEE 22nd Workshop on Control and Modelling of Power Electronics (COMPEL), Cartagena, Colombia, November 2021 (IEEE), 1–6.
Chen, Y., Liu, Z., Zhang, Y., Wu, Y., Chen, X., and Zhao, L. (2021). Deep reinforcement learning-based dynamic resource management for mobile edge computing in industrial internet of things. IEEE Trans. Industrial Inf. 17 (7), 4925–4934. doi:10.1109/tii.2020.3028963
Cheng, Y., Zhang, S., Huan, C., Oladokun, M. O., and Lin, Z. (2019). Optimization on fresh outdoor air ratio of air conditioning system with stratum ventilation for both targeted indoor air quality and maximal energy saving. Build. Environ. 147, 11–22. doi:10.1016/j.buildenv.2018.10.009
Cordova, F. M., and Yanine, F. F. (2012). Homeostatic control of sustainable energy grid applied to natural disasters. Int. J. Comput. Commun. Control 8 (1), 50–60. doi:10.15837/ijccc.2013.1.168
De Lotto, R., Micciché, C., Venco, E. M., Bonaiti, A., and De Napoli, R. (2022). Energy communities: technical, legislative, organizational, and planning features. Energies 15 (5), 1731. doi:10.3390/en15051731
Driesen, J., and Katiraei, F. (2008). Design for distributed energy resources. IEEE power energy Mag. 6 (3), 30–40. doi:10.1109/MPE.2008.918703
ENEL Distribucion (2023). Tarifas. https://www.chilectra.cl/tarifas; (Accessed December 4 2022).
ENEL (2011). Enel distribuzione: italy's first smart grid in isernia. https://www.enel.com/media/press/d/2011/11/enel-distribuzione-italys-first-smart-grid-in--isernia; (Accessed February 4 2023).
ENEL (2017). Enel operates world’s first “plug and play” micro-grid powered by solar pv and hydrogen-based storage in chile. https://www.enel.com/media/press/d/2017/05/enel-operates-worlds-first-plug-and-play-micro-grid-powered-by-solar-pv-and-hydrogen-based-storage-in-chile (Accessed May 31 2023).
ENEL (2014). Microgrids: the future of energy. https://www.enel.com/media/news/d/2014/05/microgrids-the-future-of-energy; (Accessed June 3 2023).
Energypedia (2015). Net-metering/billing in Chile. https://energypedia.info/wiki/Net-Metering_/_Billing_in_Chile; (Accessed July, 2023).
Gottwalt, S., Ketter, W., Block, C., Collins, J., and Weinhardt, C. (2011). Demand side management—a simulation of household behavior under variable prices. Energy policy 39 (12), 8163–8174. doi:10.1016/j.enpol.2011.10.016
Hambridge, S., Lu, N., Huang, A. Q., and Yu, R. (2017). “A frequency based real-time electricity rate for residential prosumers,” in Proceedings of the 2017 IEEE Power & Energy Society General MeetingE, Chicago, IL, USA, July 2017 (IEEE), 1–5.
International Energy Agency (2023a). World energy investment 2023 report. https://www.iea.org/reports/world-energy-investment-2023 (Accessed June 30, 2023).
International Energy Agency (2023b). IEA world energy outlook 2022 executive summary. https://www.iea.org/reports/world-energy-outlook-2022 (Accessed June 30 2023).
Jain, S., Kalambe, S., Agnihotri, G., and Mishra, A. (2017). Distributed generation deployment: state-of-the-art of distribution system planning in sustainable era. Renew. Sustain. Energy Rev. 77, 363–385. doi:10.1016/j.rser.2017.04.024
Jiayi, H., Chuanwen, J., and Rong, X. (2008). A review on distributed energy resources and MicroGrid. Renew. Sustain. Energy Rev. 12 (9), 2472–2483. doi:10.1016/j.rser.2007.06.004
Kimani, K., Oduol, V., and Langat, K. (2019). Cyber security challenges for IoT-based smart grid networks. Int. J. Crit. infrastructure Prot. 25, 36–49. doi:10.1016/j.ijcip.2019.01.001
Kroposki, B., Lasseter, R., Ise, T., Morozumi, S., Papathanassiou, S., and Hatziargyriou, N. (2008). Making microgrids work. IEEE power energy Mag. 6 (3), 40–53. doi:10.1109/mpe.2008.918718
Lan, J., Khan, S. U., Sadiq, M., Chien, F., and Baloch, Z. A. (2022). Evaluating energy poverty and its effects using multi-dimensional based DEA-like mathematical composite indicator approach: findings from Asia. Energy Policy 165, 112933. doi:10.1016/j.enpol.2022.112933
Leal-Arcas, R., Nacht, Y., Madeleine, L., Pelegri, J., Mizrachi, G., and Siebenhirter, J. (2023). Clean energy technologies: assessing advantages and risks. Renew. Energy Law Policy Rev. 11 (2-3), 35–47. doi:10.4337/relp.2022.02-03.01
Li, S., Patnaik, S., and Li, J. (2023). IoT-based technologies for wind energy microgrids management and control. Electronics 12 (7), 1540. doi:10.3390/electronics12071540
Li, W., Yang, L., Ji, Y., and Xu, P. (2019). Estimating demand response potential under coupled thermal inertia of building and air-conditioning system. Energy Build. 182, 19–29. doi:10.1016/j.enbuild.2018.10.022
Londono, E. (2017). Chile’s energy transformation is powered by wind, sun and volcanoes. New York: New York Times. Available at: https://www.nytimes.com/2017/08/12/world/americas/chile-green-energy-geothermal.html; (Accessed June, 2023).
Morgan, P., Martinez, D., and Maxwell, A. (2014). From good to great: the next step in Chilean energy efficiency. Nat. Resour. Def. Counc. (NRDC). Availble at: https://www.nrdc.org/sites/default/files/chile-energy-efficiency-report.pdf; (Accessed March 2 2023).
Moslehi, K., and Kumar, R. (2010). A reliability perspective of the smart grid. IEEE Trans. Smart Grid 1 (1), 57–64. doi:10.1109/tsg.2010.2046346
Nasirov, S., Silva, C., and Agostini, C. (2015). Investors’ perspectives on barriers to the deployment of renewable energy sources in Chile. Energies 8 (5), 3794–3814. doi:10.3390/en8053794
Palensky, P., and Dietrich, D. (2011). Demand side management: demand response, intelligent energy systems, and smart loads. IEEE Trans. industrial Inf. 7 (3), 381–388. doi:10.1109/tii.2011.2158841
Paris, L. (2022). The integration of sustainability and social innovation practices into the core business: the case of ENEL.
Qiao, J., Li, M., Liu, J., Lu, Y., Sun, Y., Liu, Y., et al. (2023). Research on decision-making behavior of power suppliers considering multi-market integration and network security. Front. Energy Res. 11, 1220751. doi:10.3389/fenrg.2023.1220751
Rao, C. K., Sahoo, S. K., and Yanine, F. F. (2022). “Forecasting electric power generation in a photovoltaic power systems for smart energy management,” in Proceedings of the International Conference on Intelligent Controller and Computing for Smart Power (ICICCSP), Hyderabad, India, July 2022, 1–6. doi:10.1109/ICICCSP53532.2022.9862396
Series, I. E. T. R. E. (2009). Microgrids and active distribution networks. England: The institution of Engineering and Technology.
Silva, C., and Nasirov, S. (2017). Chile: paving the way for sustainable energy planning. Energy Sources, Part B Econ. Plan. Policy 12 (1), 56–62. doi:10.1080/15567249.2014.977464
Tejada-Arango, D. A., Siddiqui, A. S., Wogrin, S., and Centeno, E. (2019). A review of energy storage system legislation in the US and the European Union. Curr. Sustainable/Renewable Energy Rep. 6, 22–28. doi:10.1007/s40518-019-00122-7
Tiep, N. C., Wang, M., Mohsin, M., Kamran, H. W., and Yazdi, F. A. (2021). An assessment of power sector reforms and utility performance to strengthen consumer self-confidence towards private investment. Econ. Analysis Policy 69, 676–689. doi:10.1016/j.eap.2021.01.005
Trevisan, R., Ghiani, E., and Pilo, F. (2023). Renewable energy communities in positive energy districts: a governance and realisation framework in compliance with the Italian regulation. Smart Cities 6 (1), 563–585. doi:10.3390/smartcities6010026
Van Aubel, P., and Poll, E. (2019). Smart metering in The Netherlands: what, how, and why. Int. J. Electr. Power & Energy Syst. 109, 719–725. doi:10.1016/j.ijepes.2019.01.001
Wolsink, M. (2020). Distributed energy systems as common goods: socio-political acceptance of renewables in intelligent microgrids. Renew. Sustain. Energy Rev. 127, 109841. doi:10.1016/j.rser.2020.109841
Wolsink, M. (2012). The research agenda on social acceptance of distributed generation in smart grids: renewable as common pool resources. Renew. Sustain. Energy Rev. 16 (1), 822–835. doi:10.1016/j.rser.2011.09.006
Yanine, F., and Cordova, F. M. (2013). “Homeostatic control in grid-connected micro-generation power systems: a means to adapt to changing scenarios while preserving energy sustainability,” in Proceedings of the 2013 International Renewable and Sustainable Energy Conference (IRSEC), Ouarzazate, Morocco, March 2013 (IEEE), 525–530.
Yanine, F., Sanchez-Squella, A., Barrueto, A., Kumar Sahoo, S., and M. Cordova, F. (2018b). Smart energy systems: the need to incorporate homeostatically controlled microgrids to the electric power distribution industry: an electric utilities’ perspective. Int. J. Eng. Technol. 7 (2), 64–73. doi:10.14419/ijet.v7i2.28.12883
Yanine, F. F., Caballero, F. I., Sauma, E. E., and Córdova, F. M. (2014b). Building sustainable energy systems: homeostatic control of grid-connected microgrids, as a means to reconcile power supply and energy demand response management. Renew. Sustain. Energy Rev. 40, 1168–1191. doi:10.1016/j.rser.2014.08.017
Yanine, F. F., Caballero, F. I., Sauma, E. E., and Córdova, F. M. (2014a). Homeostatic control, smart metering and efficient energy supply and consumption criteria: a means to building more sustainable hybrid micro-generation systems. Renew. Sustain. Energy Rev. 38, 235–258. doi:10.1016/j.rser.2014.05.078
Yanine, F. F., Córdova, F. M., and Valenzuela, L. (2015). Sustainable hybrid energy systems: an energy and exergy management approach with homeostatic control of microgrids. Procedia Comput. Sci. 55, 642–649. doi:10.1016/j.procs.2015.07.060
Yanine, F. F., Sanchez-Squella, A., Barrueto, A., Cordova, F., and Sahoo, S. K. (2017). Engineering sustainable energy systems: how reactive and predictive homeostatic control can prepare electric power systems for environmental challenges. Procedia Comput. Sci. 122, 439–446. doi:10.1016/j.procs.2017.11.391
Yanine, F. F., Sauma, E. E., and Cordova, F. M. (2014c). An exergy and homeostatic control approach to sustainable grid-connected microgrids without energy storage. Appl. Mech. Mater. 472, 1027–1031. doi:10.4028/www.scientific.net/amm.472.1027
Yanine, F. F., and Sauma, E. E. (2013). Review of grid-tie micro-generation systems without energy storage: towards a new approach to sustainable hybrid energy systems linked to energy efficiency. Renew. Sustain. Energy Rev. 26, 60–95. doi:10.1016/j.rser.2013.05.002
Yanine, F., Sánchez-Squella, A., Barrueto, A., Parejo, A., Cordova, F., and Rother, H. (2020). Grid-tied distributed generation systems to sustain the smart grid transformation: tariff analysis and generation sharing. Energies 13 (5), 1187. doi:10.3390/en13051187
Yanine, F., Sanchez-Squella, A., Barrueto, A., Sahoo, S. K., Parejo, A., and Cordova, F. M. (2022). Energy homeostasis management strategy for building rooftop nanogrids, considering the thermal model and a HVAC unit installed. Procedia Comput. Sci. 199, 10–17. doi:10.1016/j.procs.2022.01.002
Yanine, F., Sanchez-Squella, A., Barrueto, A., Sahoo, S. K., Parejo, A., Shah, D., et al. (2019). Homeostaticity of energy systems: how to engineer grid flexibility and why should electric utilities care. Periodicals Eng. Nat. Sci. (PEN) 7 (1), 474–482. doi:10.21533/pen.v7i1.424
Yanine, F., Sanchez-Squella, A., Barrueto, A., Tosso, J., Cordova, F. M., and Rother, H. C. (2018a). Reviewing homeostasis of sustainable energy systems: how reactive and predictive homeostasis can enable electric utilities to operate distributed generation as part of their power supply services. Renew. Sustain. Energy Rev. 81, 2879–2892. doi:10.1016/j.rser.2017.06.094
Zakeri, B., Paulavets, K., Barreto-Gomez, L., Echeverri, L. G., Pachauri, S., Boza-Kiss, B., et al. (2022). Pandemic, war, and global energy transitions. Energies 15 (17), 6114. doi:10.3390/en15176114
Zheng, J., Gao, D. W., and Lin, L. (2013). “Smart meters in smart grid: an overview,” in Proceedings of the 2013 IEEE green technologies conference (GreenTech), Denver, CO, USA, April 2013 (IEEE), 57–64.
Zsiborács, H., Baranyai, N. H., Vincze, A., Zentkó, L., Birkner, Z., Máté, K., et al. (2019). Intermittent renewable energy sources: the role of energy storage in the european power system of 2040. Electronics 8 (7), 729. doi:10.3390/electronics8070729
Keywords: energy homeostasis, electric utility, distributed energy resources, smart grid transformation, electric tariff, sustainable block™
Citation: Yanine F, Sahoo SK, Sanchez-Squella A, Barrueto A and Krishna Rao C (2023) Energy homeostasis model for electrical and thermal systems integration in residential buildings: a means to sustain distributed generation systems integration. Front. Energy Effic. 1:1258384. doi: 10.3389/fenef.2023.1258384
Received: 13 July 2023; Accepted: 06 October 2023;
Published: 21 November 2023.
Edited by:
Juris Burlakovs, Mineral and Energy Economy Research Institute, Polish Academy of Sciences, PolandReviewed by:
Mariacristina Roscia, University of Bergamo, ItalyCopyright © 2023 Yanine, Sahoo, Sanchez-Squella, Barrueto and Krishna Rao. This is an open-access article distributed under the terms of the Creative Commons Attribution License (CC BY). The use, distribution or reproduction in other forums is permitted, provided the original author(s) and the copyright owner(s) are credited and that the original publication in this journal is cited, in accordance with accepted academic practice. No use, distribution or reproduction is permitted which does not comply with these terms.
*Correspondence: Fernando Yanine, ZnlhbmluZUB1ZnQuY2w=
Disclaimer: All claims expressed in this article are solely those of the authors and do not necessarily represent those of their affiliated organizations, or those of the publisher, the editors and the reviewers. Any product that may be evaluated in this article or claim that may be made by its manufacturer is not guaranteed or endorsed by the publisher.
Research integrity at Frontiers
Learn more about the work of our research integrity team to safeguard the quality of each article we publish.