 Yuanxi Luo
 Zhiyang Yin
 Xin Li
 Chong Sheng
 Ping Zhang
 Dongjin Wang
 Yunxing Xue
94% of researchers rate our articles as excellent or good
Learn more about the work of our research integrity team to safeguard the quality of each article we publish.
Find out more
ORIGINAL RESEARCH article
Front. Endocrinol., 01 April 2025
Sec. Cardiovascular Endocrinology
Volume 16 - 2025 | https://doi.org/10.3389/fendo.2025.1551779
Background: While the Cardiometabolic Index (CMI) serves as a novel marker for assessing adipose tissue distribution and metabolic function, its prognostic utility for cardiovascular disease (CVD) events remains incompletely understood. This investigation sought to elucidate the predictive capabilities of CMI for cardiovascular outcomes and explore underlying mechanistic pathways to establish a comprehensive risk prediction framework.
Methods: The study encompassed 7,822 individuals from a national health and retirement longitudinal cohort, with participants stratified by CMI quartiles. Following baseline characteristic comparisons and CVD incidence rate calculations, we implemented multiple Cox regression models to assess CMI’s cardiovascular risk prediction capabilities. For nomogram construction, we utilized an ensemble machine learning framework, combining Boruta algorithm-based feature selection with Random Forest (RF) and XGBoost analyses to determine key predictive parameters.
Results: Throughout the median follow-up duration of 84 months, we documented 1,500 incident CVD cases, comprising 1,148 cardiac events and 488 cerebrovascular events. CVD incidence demonstrated a positive gradient across ascending CMI quartiles. Multivariate Cox regression analysis, adjusting for potential confounders, confirmed a significant association between CMI and CVD risk. Notably, mediation analyses revealed that hypertension and glycated hemoglobin (HbA1c) potentially serve as mechanistic intermediaries in the CMI-CVD relationship. Sex-stratified analyses suggested differential predictive patterns between gender subgroups. Given CMI’s robust and consistent predictive capability for stroke outcomes, we developed a machine learning-derived nomogram incorporating five key predictors: age, CMI, hypertension status, high-sensitivity C-reactive protein (hsCRP) and renal function (measured as serum creatinine). The nomogram demonstrated strong discriminative ability, achieving areas under the receiver operating characteristic curve (AUC) of 0.76 (95% CI: 0.56-0.97) and 0.74 (95% CI: 0.66-0.81) for 2-year and 6-year stroke prediction, respectively.
Conclusions: Our findings establish CMI as a significant predictor of cardiovascular events in the aging population, with the relationship partially mediated through hypertension and insulin resistance pathways. The validated nomogram, developed using longitudinal data from a substantial elderly cohort, incorporates CMI to enable preclinical risk stratification, supporting timely preventive strategies.
Cardiovascular diseases (CVD) remain a paramount global health challenge, exerting substantial burden on healthcare systems and societies through their significant mortality and morbidity rates (1, 2). The global landscape has witnessed an alarming upward trajectory, with incident CVD cases surging from 31.31 million to 55.45 million between 1990 and 2019, accompanied by a corresponding increase in mortality from 12.07 million to 18.56 million deaths during the same period (2). This burden is particularly pronounced in regions with lower to middle sociodemographic indices, where limited healthcare resources and insufficient research infrastructure compound the challenges of CVD management (3). In China, a major developing nation experiencing accelerated population aging, there is an urgent imperative to enhance risk identification strategies to effectively mitigate the mounting CVD-related morbidity and mortality rates (4).
While Body Mass Index (BMI) has been traditionally employed as a predictor of CVD, recent evidence has revealed a complex “obesity paradox,” suggesting that elevated BMI may paradoxically offer protection against certain cardiometabolic conditions (5). Traditional anthropometric measurements, such as waist circumference and Waist-to-Height Ratio (WHtR), effectively capture central adiposity but lack insight into insulin metabolic status (6). Additionally, lipid profile-based indices such as the Triglycerides to High-Density Lipoprotein Cholesterol ratio (TG/HDL-C) have been validated through large-scale epidemiological studies as simple yet effective indicators of insulin metabolism (7). Notably, TG/HDL-C has shown comparable or slightly superior predictive capability for cardiometabolic disorders when compared to the visceral adipose index (VAI) (8). A significant advancement in this field emerged with the introduction of CMI by Wakabayashi and colleagues in 2015 (9). By integrating WHtR and TG/HDL-C, the CMI provides a more comprehensive evaluation of both central fat distribution and insulin metabolism, demonstrating promising potential for predicting cardiovascular events (10).
This innovative metric has demonstrated remarkable predictive capacity for various conditions, including diabetes mellitus, asthma, atherosclerosis, and hyperuricemia (11–14). Furthermore, CMI has shown particular promise in predicting coronary heart disease, stroke, and other cardiovascular events among patients with concurrent obstructive sleep apnea (OSA) and hypertension (15). However, the current evidence base faces two significant limitations: first, the restricted demographic scope of existing studies potentially constrains the broader applicability of these findings; second, despite establishing strong associations between CMI and various cardiovascular conditions, researchers have yet to develop robust predictive models that could facilitate its clinical implementation (10, 16). These gaps underscore the pressing need for comprehensive, large-scale population studies to both elucidate the relationship between CMI and CVD incidence and develop comprehensive predictive models that could enhance its clinical utility.
This study leverages the China Health and Retirement Longitudinal Study (CHARLS), a nationally representative longitudinal survey of middle-aged and elderly Chinese individuals, to investigate: 1) key risk factors associated with cardiovascular disease incidence among individuals aged 45 and older; 2) the predictive capability of baseline CMI for cardiovascular events, ultimately developing an evidence-based prognostic model.
The China Health and Retirement Longitudinal Study (CHARLS) comprehensively collects data from Chinese residents aged 45 and above, focusing on aging-related issues to foster interdisciplinary research. Initially surveyed in 2011 with 17,708 individuals, this nationally representative cohort undergoes biennial follow-ups, with the latest data pending release. Prior literature details the study’s design and inclusion criteria (17). CHARLS approved by Peking University’s Ethics Review Committee (IRB 00001052-11015), ensures written informed consent from all participants. Adhering to ethical standards set by the institution, national research councils, and the Declaration of Helsinki, CHARLS conducts research involving human subjects with integrity (18). For detailed information and access to raw data, visit the official website at https://charls.pku.edu.cn (19). Adherence to the STROBE framework ensured rigorous reporting of our observational epidemiological finding (20).
Of the initial 17,708 participants, the final analytical cohort comprised 7,822 individuals after systematic exclusions (Supplementary Figure 1). The exclusion criteria encompassed: absence of CMI data (n=7,811), age ineligibility or missing age information (n=648), preexisting cardiovascular disease (n=1,361), and cancer diagnosis (n=66), with the latter exclusion addressing potential reverse causality between malignancy and lipid metabolism (21). The study population was subsequently categorized into quartiles based on baseline CMI values.
Investigators collected variables according to established criteria. Trained examiners measured blood pressure on the right arm thrice using a mercury sphygmomanometer and recorded the results. Participants, dressed in light clothing and shoes removed, had height, weight, and waist circumference (WC) measured by trained nurses (22). Blood samples, obtained after overnight fasting, were stored at -70°C and analyzed at China CDC for high-sensitivity C-reactive protein (hsCRP), blood urea nitrogen (BUN), serum creatinine (Sc), Hemoglobin A1c (HbA1c), and lipid profiles (17).
Systolic blood pressure (SBP) and diastolic blood pressure (DBP) were recorded as the mean values for each participant. Hypertension is defined by self-reported physician diagnosis, use of antihypertensive medications, or SBP/DBP ≥140/90 mmHg. Abnormal glucose metabolism encompasses prediabetes and diabetes, with the American Diabetes Association (ADA) criteria specifying prediabetes as fasting plasma glucose (FPG) 100-125 mg/dl or HbA1c 5.7-6.4%, and diabetes as FPG≥126 mg/dl, HbA1c≥6.5%, or reported history with medication use (23, 24). Renal disease is identified by physician-diagnosed chronic kidney disease and estimated glomerular filtration rate (eGFR) <60 ml/min/1.73m² (25). Geographic regions are categorized as north or south by the Qinling-Huaihe line (4). Obesity is defined as a Body Mass Index (BMI) ≥28 kg/m², calculated by BMI (kg/m²) = weight (kg)/height² (m²).
This study’s primary exposure is the baseline CMI of study population, derived using the formula CMI = TG/HDL-C × WHtR (26), where TG is triglycerides (mg/dL), HDL-C is high-density lipoprotein cholesterol (mg/dL), and WHtR is the waist-to-height ratio (cm/cm). The main outcome of interest is new-onset cardiovascular events, including heart disease and stroke, ascertained by self-reported, physician-diagnosed conditions (4). Participants were followed from 2011 baseline to the first occurrence of a cardiovascular event or the 2018 survey.
This study’s statistical analyses were conducted using RStudio 4.2.2, with a two-tail P < 0.05 considered statistically significant. Continuous data, assessed for normality, were described as mean ± SD for normally distributed variables, analyzed with ANOVA, or as Median (IQR) for non-normal distributions, tested with Mann-Whitney U or Kruskal-Wallis tests. Categorical variables were reported as counts (percentages), with group comparisons made using Fisher’s exact test for low expected counts (<5) or Chi-squared test for larger counts. The Kaplan-Meier method was utilized for estimating cumulative CVD incidence rates, with the log-rank test for group comparisons, and rates were calculated per 1000 person-years. Missing data, detailed in Table 1 with no variable exceeding a 2.02% absence, were imputed using the “missRanger” R package employing a random forest algorithm (27), seeded at 1234, with presented in Supplementary Material. Supplementary Tables 4–6 display a comparative analysis of characteristics between individuals who experienced CVD events and those who remained free of such events throughout the follow-up period.
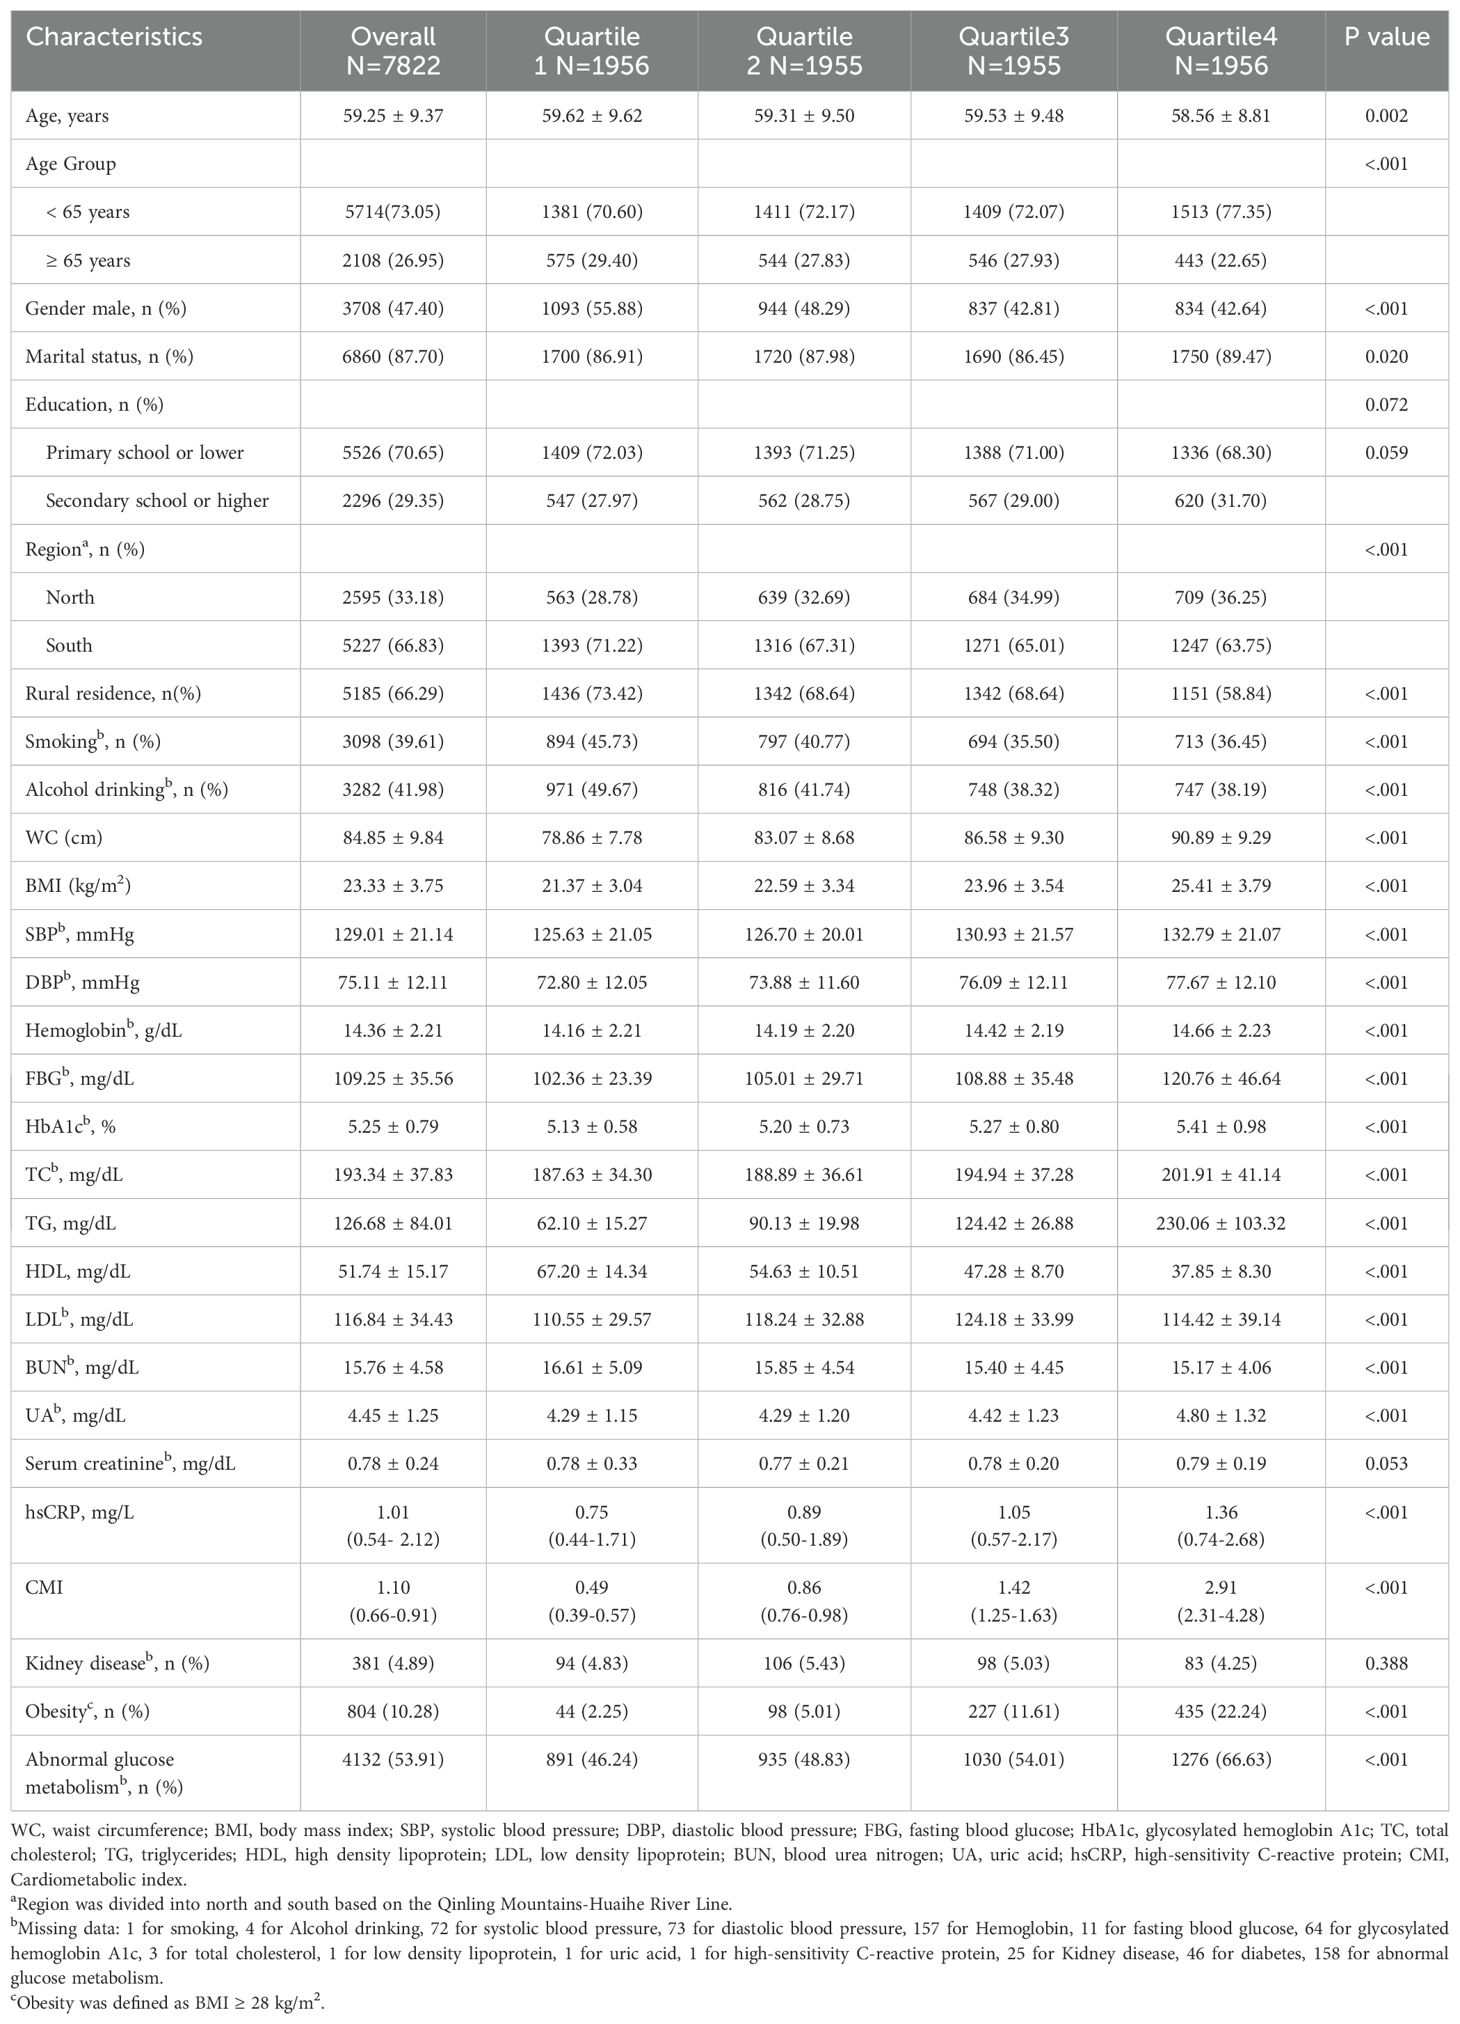
Table 1. Baseline characteristics of participants stratified by quartiles of CMI.
The association between CMI (both continuous and quartiles) and CVD phenotypes was evaluated using Cox proportional hazards models, with hazard ratios (HRs) and 95% confidence intervals (CIs) calculated. We constructed three sequential models: an unadjusted model (Model 1); a model adjusted for sociodemographic and lifestyle factors including age, sex, marital status, education, region, rural residence, smoking, and alcohol consumption (Model 2); and a fully adjusted model incorporating clinical parameters such as hypertension, hemoglobin, glucose metabolism status, TC, LDL, hsCRP, and kidney disease (Model 3). Schoenfeld residual analysis confirmed the proportional hazards assumption. Additionally, collinearity assessment was performed using the variance inflation factor (VIF) for variables included in Model 3.
Restricted cubic spline (RCS) analysis was performed to examine the potential non-linear relationships between CMI and disease risks, with adjustments based on Model 3 covariates. The optimal number of knots (ranging from 3 to 7) was determined using the minimum Akaike Information Criterion (AIC) value through the ‘rms’ package in R. The optimal knot selections for each model are presented in the Supplementary Material, ensuring model flexibility while mitigating overfitting. Subgroup analyses were conducted based on pre-specified variables, including age (categorized at 65 years), gender, region (southern and northern), and glucose metabolism abnormalities (28). Both univariate and multivariate analyses were conducted, with the latter adjusted for Model 3 covariates.
We applied the Boruta algorithm to ascertain the predictive efficacy of the CMI in forecasting the incidence rates of CVD, heart disease, and stroke. The Boruta algorithm discerns significant features within a dataset by comparing the Z-scores of actual features with those of shadow features. Shadow features are duplicates of the real feature data values that have been randomly shuffled (29). The algorithm combines shadow features with the original features to form an extended information dataset and employs a random forest to determine the importance of each feature, including both the original and shadow features. In summary, within the Boruta algorithm, the measure of importance is based on the Z-scores derived from shadow features: if a feature’s Z-score consistently exceeds the maximum Z-score of the shadow features across multiple trials, the feature is classified as “confirmed” (green area), indicating its significance. If the Z-scores of the actual features are very close to those of the shadow features, they are considered “tentative” (yellow area), requiring further review. Conversely, features that cannot distinguish themselves from shadow features are deemed “unimportant” (red area) and are excluded from the final feature selection due to a lack of predictive power (30, 31).
The CMI showed distinctive prognostic value for stroke incidence. We integrated “Confirmed” and “Tentative” variables into machine learning models, Random Forest (RF) and XGBoost, with a 75% training subset. The RF model was constructed with 500 decision trees and evaluated through 10-fold cross-validation. Variable importance scoring was performed based on minimal Out-Of-Bag (OOB) error estimation, ultimately identifying seven significant variables (32). The XGBoost algorithm, known for its efficiency and flexibility in handling large-scale datasets (33), was implemented with a maximum of 50 iterations (nrounds). Detailed model parameters are provided in the Supplementary Materials. The top seven risk factors were selected based on variable significance scores. To enhance the reliability of our findings, we constructed a Venn diagram to identify the intersection of variables selected by both algorithms, yielding five highly potential predictors. This methodological approach has been validated in numerous high-quality studies (34, 35), supporting the rationale and generalizability of our research protocol. A nomogram was subsequently developed based on these five predictors, and its predictive performance was validated using Receiver Operating Characteristic (ROC) curves and decision curve analysis (DCA).
Participants (n=7822; mean age 59.25 ± 9.37 years; 47.40% male) were stratified into quartiles based on CMI values [Q1: 0.49 (0.39-0.57); Q2: 0.86 (0.76-0.98); Q3: 1.42 (1.25-1.63); Q4: 2.91 (2.31-4.28)] (Table 1). Higher CMI quartiles were characterized by a greater proportion of individuals under 65 years, females, married status, and higher educational attainment. Clinical parameters, including BMI, blood pressure, hemoglobin, FBG, HbA1c, TC, TG, UA, and hsCRP, as well as the prevalence of obesity and dysglycemia, showed progressive increases across CMI quartiles (all P < 0.001). Box plot analysis (Supplementary Figure 2) revealed that while both CMI and BMI demonstrated significant inter-quartile differences (P < 0.001), BMI distributions showed considerable overlap between adjacent quartiles, contrasting with the more distinct separation observed in CMI quartiles. Lower CMI quartiles were associated with southern and rural residence, and higher prevalence of smoking and alcohol consumption (all P < 0.001).
During a median follow-up of 84 months, we documented 1500 CVD events, comprising 1148 heart disease and 488 stroke cases (Supplementary Table 1). The overall incidence rates per 1000 person-years were 31.80 for CVD, 24.21 for heart disease, and 9.97 for stroke. Across ascending CMI quartiles, CVD incidence rates demonstrated a progressive increase (24.90, 30.92, 34.65, and 36.75 per 1000 person-years from Q1 to Q4). Kaplan-Meier analysis revealed significant differences in cumulative hazard across CMI quartiles for overall CVD, heart disease, and stroke (all Log-rank P < 0.01; Supplementary Figures 3–5).
Cox regression analysis was employed to evaluate the associations between CMI (both continuous and quartiles) and outcome events across different adjustment models (Table 2). The findings revealed a significant positive association between elevated CMI and the risk of cardiovascular events. Following comprehensive covariate adjustment (Model 3), each standard deviation (SD) increase in CMI was associated with a 5% higher risk of CVD (HR: 1.05, 95% CI: 1.02-1.09) and a 14% elevated risk of stroke (HR: 1.14, 95% CI: 1.09-1.20). However, the association between CMI and heart disease risk did not reach statistical significance after multivariable adjustment (HR: 1.03, 95% CI: 0.99-1.07). Furthermore, the RCS analysis demonstrated dose-response relationships between CMI and the risks of CVD and stroke, with significant non-linear associations observed (all P for non-linearity < 0.05). Meanwhile, no significant relationship was detected between CMI and heart disease risk in the fully adjusted model (Supplementary Figure 6).
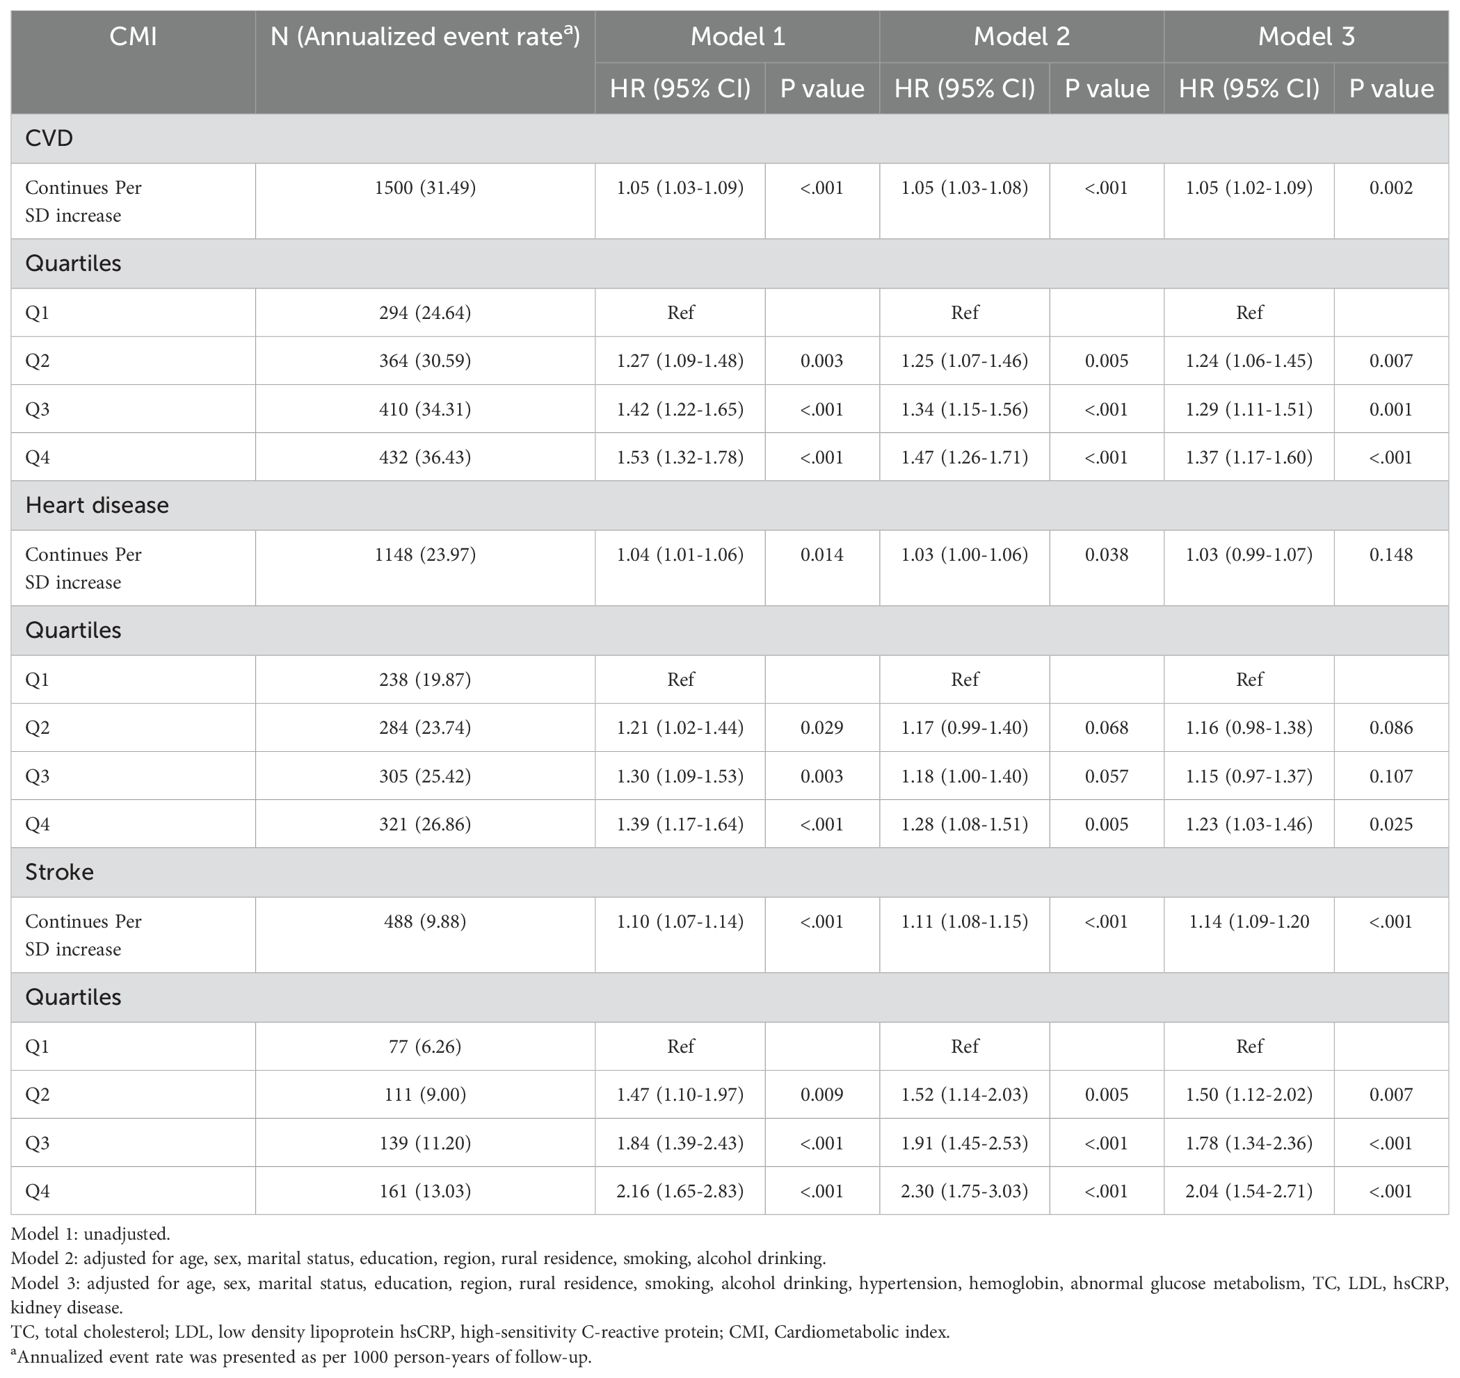
Table 2. Multivariate-adjusted hazard ratios (95% confidence intervals) of Cardiometabolic index for cardiovascular diseases.
Participants who developed CVD during follow-up (Supplementary Tables 4–6) were characterized by older age, female predominance, and lower residence rates in southern regions. These individuals exhibited higher baseline values for blood pressure, waist circumference, and BMI, alongside elevated levels of FBG, HbA1c, TC, TG, LDL, UA, and hsCRP. A higher prevalence of glucose metabolism disorders was also observed in this group. Baseline CMI values were significantly higher among those who developed cardiovascular events compared to those who remained event-free [CVD: 1.24 (0.75, 2.12) vs. 1.07 (0.65, 1.87); heart disease: 1.19 (0.72, 2.07) vs. 1.08 (0.66, 1.89); stroke: 1.36 (0.84, 2.27) vs. 1.08 (0.66, 1.88); all p < 0.001].
The relationship between CMI and CVD risk was examined across pre-specified demographic subgroups (Figure 1, Supplementary Figures 7, 8). While most subgroup analyses yielded results consistent with the primary findings, sex emerged as a significant effect modifier (P-interaction = 0.048). In sex-stratified analyses of continuous CMI, males showed significant associations with both CVD incidence [HR: 1.10, 95% CI: 1.05-1.16, p < 0.001] and heart disease [HR: 1.09, 95% CI: 1.04-1.16, p = 0.001]. These associations were not observed in females [CVD: HR: 1.02, 95% CI: 0.97-1.07, p = 0.424; heart disease: HR: 0.99, 95% CI: 0.94-1.04, p = 0.593]. The association between CMI and stroke remained significant across both sexes (p < 0.001). No significant interactions were observed for other demographic characteristics (all P-interaction > 0.05).
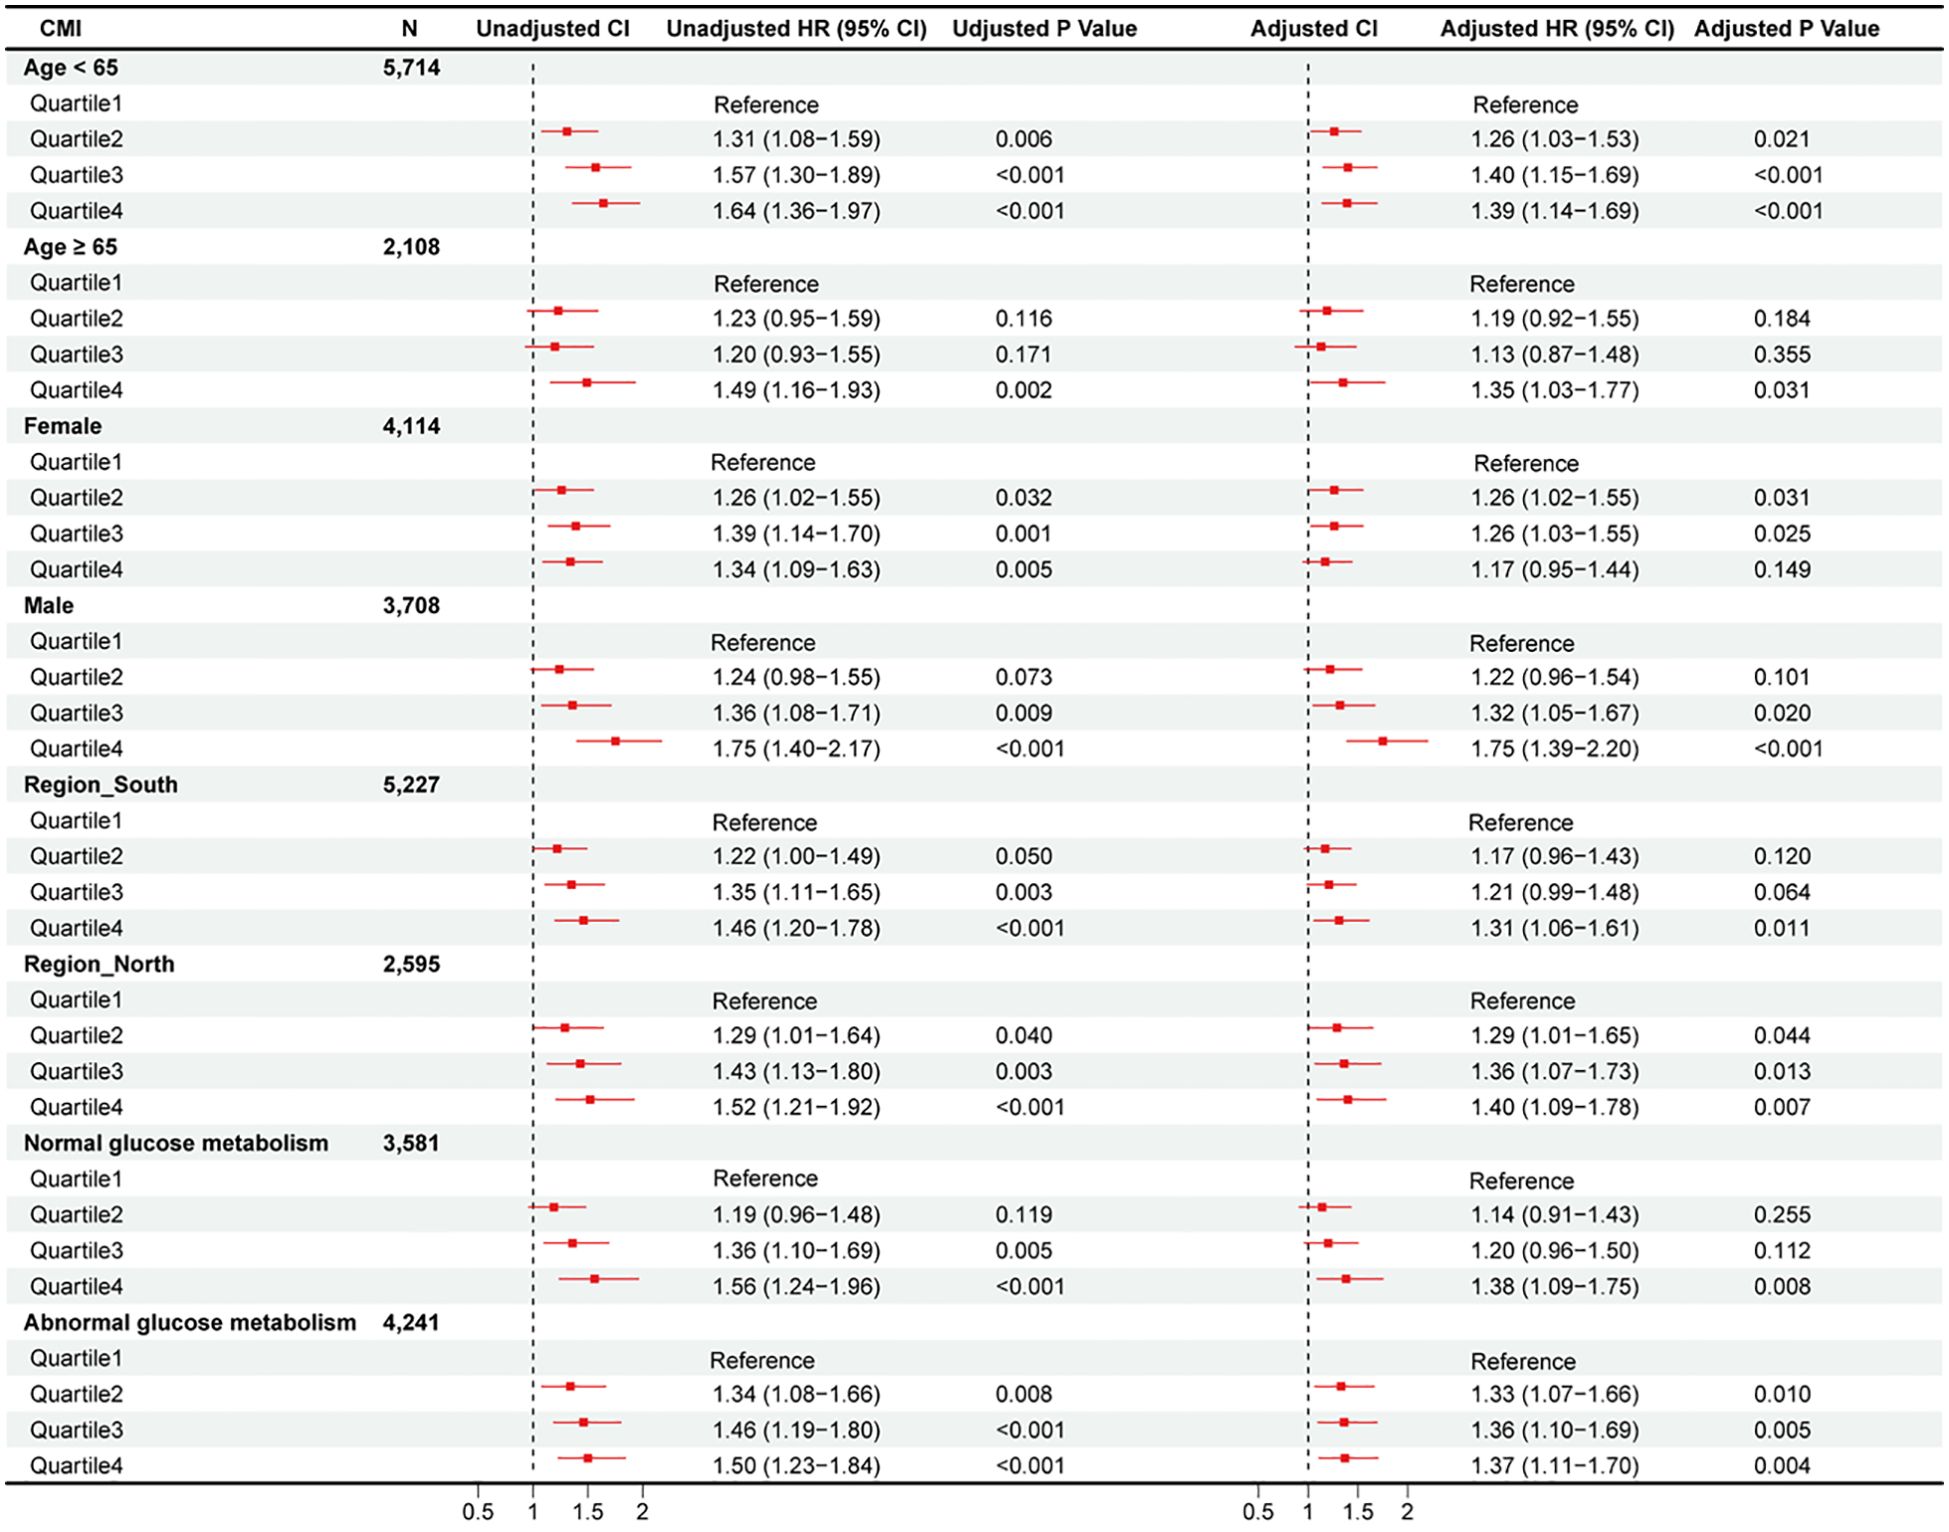
Figure 1. Subgroup analysis of hazard ratios (95% confidence intervals) for total CVD of estimated CMI.
Mediation analysis (Supplementary Figures 9–14) revealed hypertension as a significant mediator in the CMI-cardiovascular outcomes relationship. After full adjustment, hypertension mediated 7.84%, 8.00%, and 7.23% of the total effects of CMI on CVD, heart disease, and stroke, respectively (all P < 0.05). HbA1c demonstrated significant mediating effects for CVD (10.46%) and stroke (3.55%), but its mediation in the CMI-heart disease pathway did not reach statistical significance in the fully adjusted model.
The Boruta algorithm was employed to evaluate the relative importance of multiple variables, including CMI, in predicting cardiovascular outcomes (Figure 2, Supplementary Figures 15, 16). After 500 iterations, CMI demonstrated significant predictive value for CVD and stroke events. For stroke prediction specifically, the algorithm identified several key variables: hypertension, age, TC, smoking, CMI, LDL, hsCRP, FBG, sex, marital status, HbA1c, and UA.
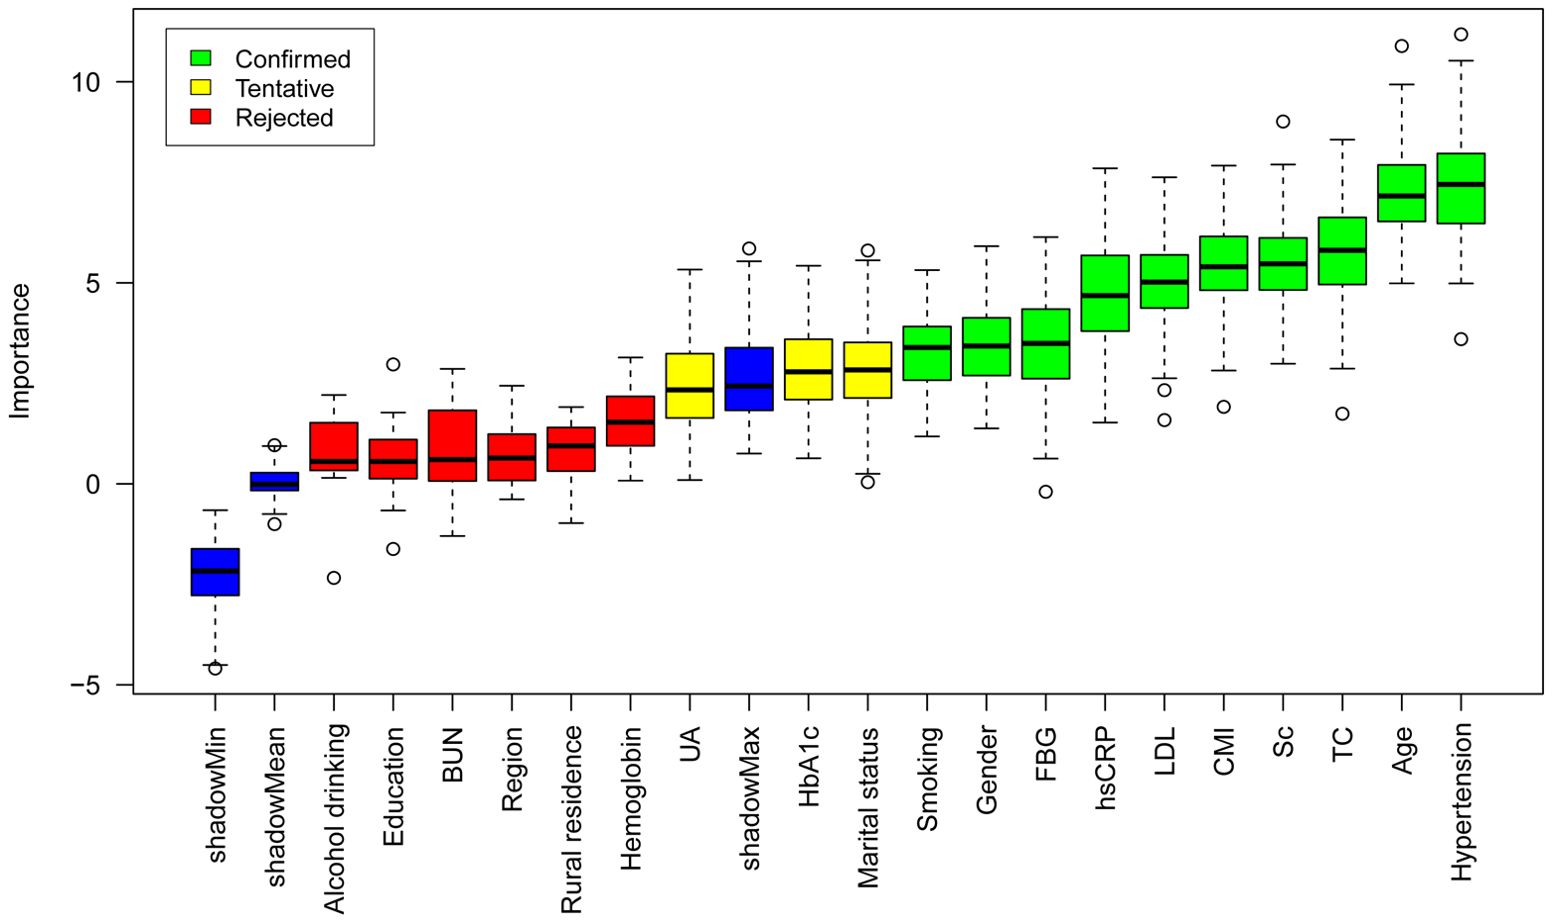
Figure 2. Feature selection for stroke based on the Boruta algorithm.
Further variable selection was conducted using RF and XGBoost algorithms (Figure 3). The RF model identified TC, hypertension, CMI, LDL, Sc, age, and hsCRP as the top predictors (Figure 3A). XGBoost analysis yielded a slightly different ranking, with hypertension, age, CMI, Sc, hsCRP, FBG, and HbA1c as the leading predictors (Figure 3B). The intersection of these results highlighted five central variables: age, CMI, hypertension, Sc, and hsCRP.
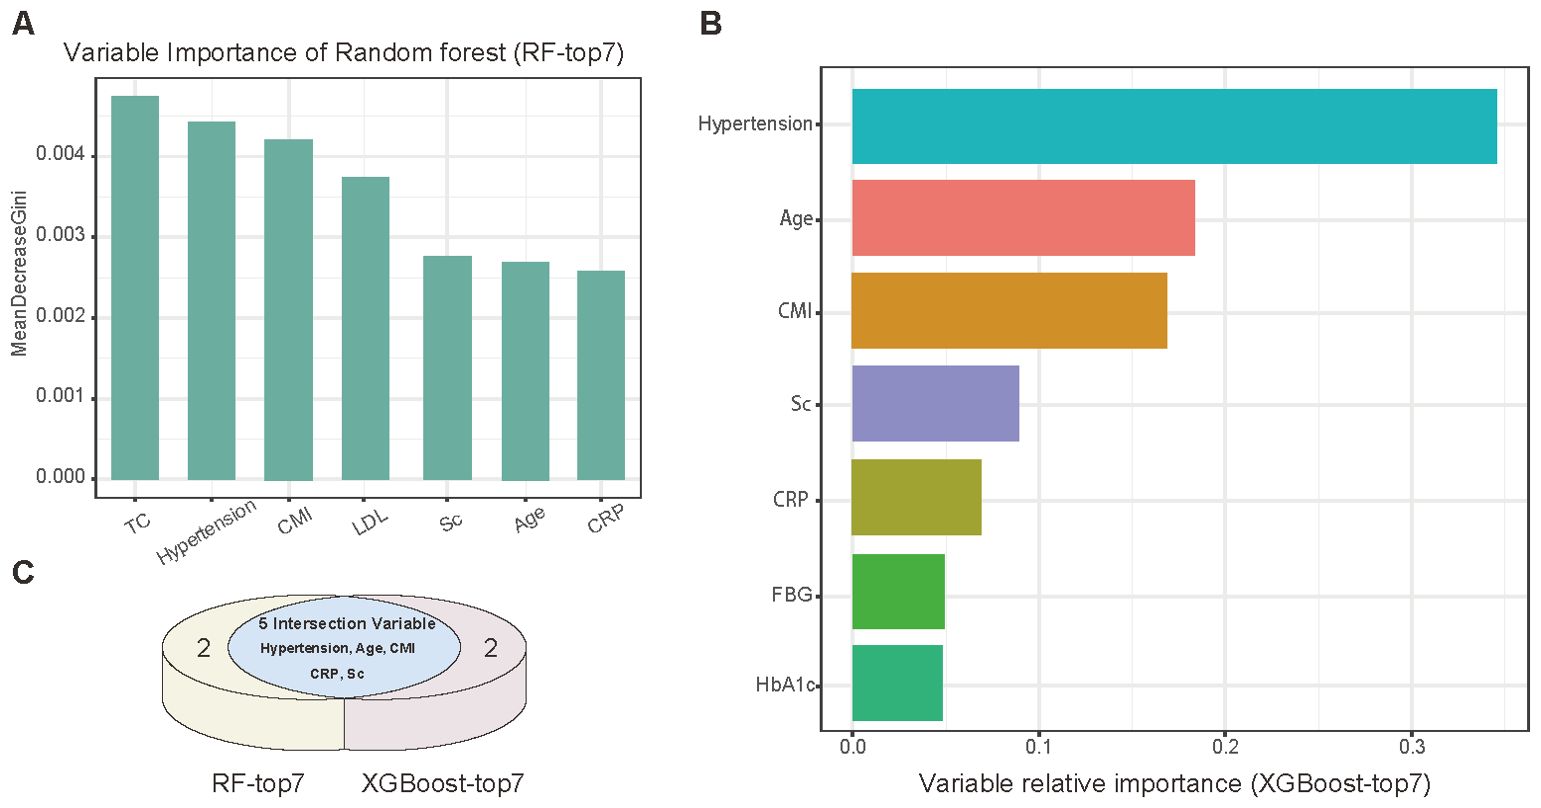
Figure 3. Machine learning analysis of potential variables. (A) Variable importance ranking (top 7) by Random Forest analysis. (B) Variable importance ranking (top 7) assessed by XGBoost algorithm. (C) Venn diagram showing intersection of variables selected by both algorithms.
Based on these core predictors, we developed a nomogram for stroke prediction (Figure 4). The model demonstrated robust predictive performance, with AUCs of 0.77 (95% CI: 0.61-0.93) and 0.76 (95% CI: 0.56-0.97) for 2-year prediction in the training and validation sets, respectively. For 6-year prediction, the AUCs were 0.71 (95% CI: 0.66-0.76) and 0.74 (95% CI: 0.66-0.81), respectively.
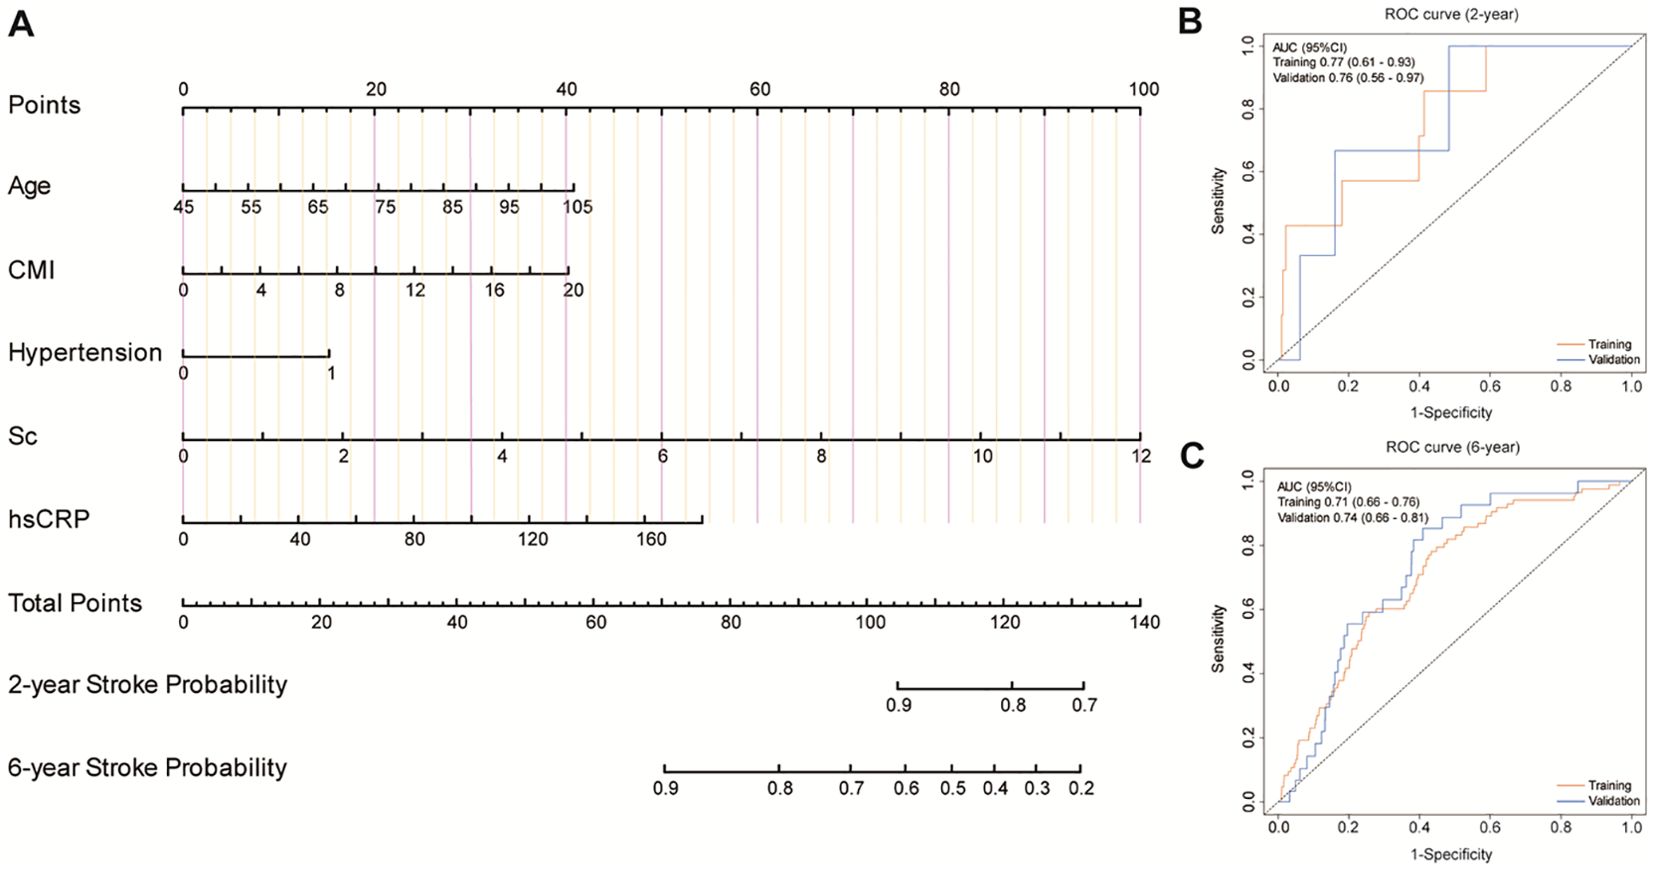
Figure 4. Development and validation of a predictive model. (A) A nomogram for predicting the risk of stroke onset. (B, C) ROC curves for the 2-year and 6-year risk of disease onset in both the training cohort and the validation cohort.
We constructed five comparative models to evaluate the incremental value of different obesity indices (Figure 5): a baseline model (f1) including age, hypertension, Sc, and CRP; and four additional models incorporating BMI (f2), WHtR (f3), TG/HDL (f4), or CMI (f5). DCA and time-dependent ROC analysis revealed that while all obesity indices improved the predictive performance of the baseline model, the CMI-enhanced model (f5) demonstrated superior prognostic capability and predictive stability.
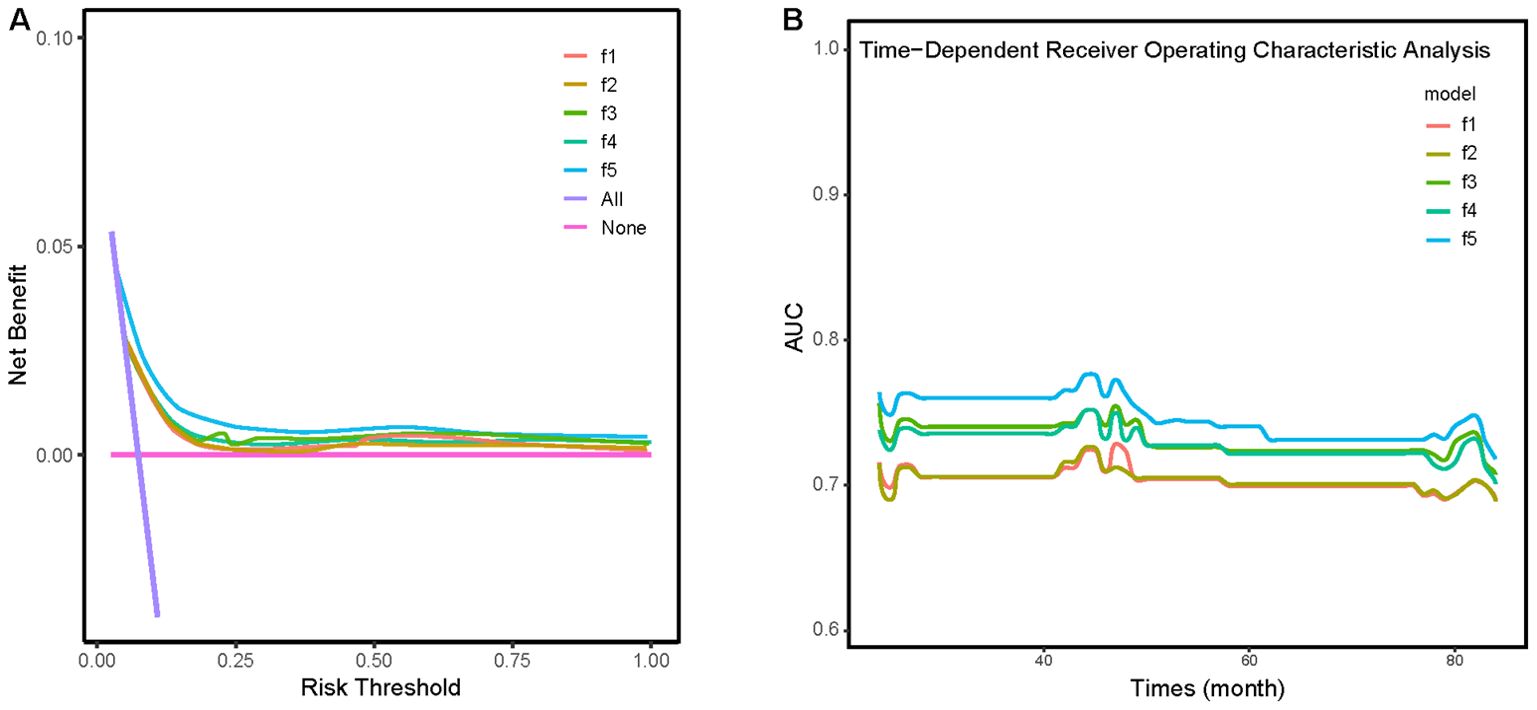
Figure 5. (A) Clinical decision analysis (DCA) curves for five different models. (B) Time-dependent ROC analysis for five different models. Model f1: A model adjusted for age, hypertension, creatinine, and CRP. Model f2: building upon Model f1 with the addition of BMI. Model f3: building upon Model f1 with the addition of WHtR. Model f4: building upon Model f1 with the addition of TG/HDL. Model f5: building upon Model f1 with the addition of CMI.
Based on a nationally representative cohort of middle-aged and elderly Chinese adults, this study examined the relationship between CMI and cardiovascular outcomes, yielding four key findings: 1) CMI demonstrated significant predictive value for total CVD, heart disease, and stroke events; 2) The association between CMI and both CVD and heart disease varied by sex, while its predictive ability for stroke remained consistent across sex groups; 3) Hypertension and HbA1c partially mediated the relationship between CMI and cardiovascular events; 4) A novel nomogram incorporating CMI, age, hypertension, CRP, and creatinine showed superior performance in prediction.
CVD poses a significant burden on the elderly population, with substantial mortality rates, which has been a severe issue in developing countries (1–3). Given China’s rapidly aging demographic profile and its status as a developing nation, there is an urgent need to identify CVD risk factors specific to this population (17). The development of accurate risk stratification metrics is crucial for early identification of high-risk individuals and implementation of preventive strategies.
The limitations of BMI, particularly its inability to account for body fat distribution and metabolic parameters, have become increasingly evident through phenomena such as the “obesity paradox” (5, 34). This has prompted the development of alternative anthropometric indices. The WHtR, which considers waist circumference relative to height, more effectively reflects central adiposity while streamlining assessment procedures by eliminating the need for advanced imaging (15, 36). Meta-analyses encompassing over 300,000 adults across diverse ethnicities have demonstrated WHtR’s superior performance compared to both waist circumference and BMI in identifying cardiometabolic risk factors across sexes (37). Concurrently, the TG/HDL-C has shown strong correlation with euglycemic hyperinsulinemic clamp measurements, establishing itself as a reliable surrogate marker for insulin resistance (37). Multiple longitudinal, prospective observational studies have validated TG/HDL-C’s predictive capability for CVD onset (38, 39). The CMI, building upon these metrics, represents a further refinement that effectively captures both lipid profile and insulin metabolism - key factors in CVD risk assessment. Our research substantiates these findings, demonstrating that models incorporating CMI alongside traditional metrics like BMI, WHtR, and TG/HDL-C exhibit enhanced predictive performance for long-term cardiovascular events.
Initially validated in Japanese populations for predicting hyperglycemia and diabetes mellitus (11, 40), CMI has expanded its utility to encompass various cardiometabolic conditions, including hypertension, metabolic syndrome, and atherosclerotic diseases (10, 40, 41). While previous studies have demonstrated CMI’s association with cardiovascular outcomes in specific populations, such as patients with hypertension and OSA or rural Chinese residents, these investigations were constrained by selection bias and confounding variables (15, 16). Our study extends these findings by examining CMI’s predictive value across a diverse, nationally representative cohort of middle-aged and elderly Chinese adults, thereby offering more generalizable insights into its efficacy as a cardiovascular risk assessment tool and demonstrating its superior predictive capability compared to other obesity-related indices.
This investigation demonstrates the significant predictive value of CMI for CVD incidence over a median follow-up of 84 months, with findings persisting after adjustment for demographic and biochemical covariates in multiple Cox regression analyses. Importantly, the RCS analysis uncovered a non-linear association between CMI and cardiovascular events (P for non-linearity < 0.05), which further validates our approach of investigating CMI through quartile-based categorization (28). This non-linearity suggests that the association between CMI and cardiovascular outcomes cannot be adequately captured through simple linear modeling. Further research incorporating additional variables is needed to establish optimal CMI thresholds for cardiovascular risk prediction.
Previous studies have revealed gender differences in CMI’s predictive value. A large-scale, community-based study in rural northeastern China demonstrated gender-specific differences in CMI’s ability to predict diabetes (6), while a Japanese population survey observed varying age-related CMI trends between males and females (42). Our study of individuals aged ≥45 years confirms that gender significantly influences CMI’s predictive power for CVD risk (P for interaction = 0.048) after adjusting for covariates. As a continuous variable, CMI significantly distinguished the risk of total CVD (P < 0.001) and heart disease (P = 0.001) in males but not in females (P = 0.424 and P = 0.593, respectively).
Several factors may contribute to this gender disparity. The cardiovascular protective effects of estrogen, including improved lipid metabolism, vasodilation, and anti-inflammatory actions (43), may persist in some middle-aged and elderly women, potentially resulting in lower CVD incidence and thus weakening CMI’s predictive ability. Additionally, gender-specific fat distribution patterns affect CMI’s predictive power. Males tend to accumulate visceral fat, which exhibits higher metabolic activity and stronger cardiometabolic associations compared to the subcutaneous fat typically found in females (44). This difference directly influences waist circumference and WHtR, potentially enhancing CMI’s predictive ability in males. Furthermore, the higher cardiovascular burden among Chinese males due to smoking and hypertension (45), may strengthen the association between CMI and CVD events. Further research is needed to explore how hormonal and physiological factors influence the relationship between CMI and CVD events.
Our findings revealed that CMI’s predictive effect on CVD outcomes was partially mediated through hypertension and HbA1c. Among cardiovascular risk factors, hypertension has the most robust causal evidence (46). While previous research has demonstrated CMI’s superior predictive ability for hypertension incidence (10), our study further strengthens this evidence chain by establishing that CMI can predict CVD events through blood pressure mediation. Additionally, HbA1c, as a long-term indicator of glucose metabolism, reflects insulin metabolic status and has been consistently associated with elevated CVD risk across multiple population studies (7, 47). Insulin resistance is closely linked to microvascular pathology, while hyperglycemic states promote platelet activation and coagulation abnormalities, collectively contributing to CVD events (48, 49). Notably, CMI, our focus indicator, inherently reflects both lipid profile and insulin metabolism, explaining its particularly strong connection with glucose and insulin metabolism (11). This relationship may account for the higher mediation proportion of HbA1c in the association between CMI and CVD events observed in our study. While we comprehensively considered population characteristics, the mediation effects are influenced by exposure, outcomes, and covariates, and we cannot account for all potential influencing factors. The intricate relationships between insulin metabolism and blood pressure warrant further investigation to elucidate their individual and combined effects on circulatory and cardiovascular events.
Through the application of the Boruta algorithm, we identified CMI as a crucial predictor of stroke incidence. Our subsequent analysis using RF and XGBoost models led to the development of a nomogram incorporating five key variables: age, CMI, hypertension, Sc, and hsCRP. The significance of these variables is well-supported by existing literature. Advanced age and hypertension have been established as prominent risk factors for stroke (50), while meta-analyses have demonstrated that elevated baseline hsCRP levels independently correlate with increased ischemic stroke risk (51). The incorporation of hsCRP as an inflammatory marker has notably enhanced the precision of stroke risk stratification (52). Notably, a recent landmark 30-year follow-up study of 27,939 participants revealed that baseline hsCRP demonstrated stronger predictive power for cardiovascular outcomes than LDL cholesterol after multivariate adjustment (53), further validating the rationale of our model construction. Furthermore, the Chronic Kidney Disease Prognosis Consortium’s meta-analysis, encompassing 24 cohorts and 637,315 individuals without prior cardiovascular disease, emphasizes the importance of incorporating renal function markers, such as creatinine, in cardiovascular risk stratification. This recommendation holds particular significance for our study population of middle-aged and elderly adults, who face an elevated risk of chronic kidney disease and may benefit from improved cardiovascular event prediction (54). The CMI, with its components intricately linked to cardiovascular events, has been validated in our study as an effective predictor of stroke risk. This finding aligns with well-established pathophysiological pathways involved in atherosclerosis development and plaque progression (7). Our comprehensive comparative analysis demonstrates that the predictive model not only exhibits robust performance but also offers substantial clinical utility in stroke risk assessment among elderly populations.
In this comprehensive investigation, we demonstrate the robust predictive value of CMI for cardiovascular events, with our mediation analyses revealing that this association operates primarily through hypertension and insulin resistance pathways. The novel nomogram we developed integrates CMI with other key risk factors, enabling efficient identification of individuals at elevated stroke risk during the subclinical stage. This early detection capability facilitates the timely implementation of personalized interventions, ranging from lifestyle modifications (dietary optimization, physical activity enhancement) to targeted medical management of blood pressure and glucose metabolism. By providing these evidence-based tools for risk stratification and early intervention, our findings contribute significantly to the optimization of cardiovascular prevention strategies among middle-aged and elderly populations.
Several limitations warrant consideration in this study. First, the exclusion of cases with incomplete data may have introduced selection bias. However, our rigorous data collection process, including standardized interviewer training and CAPI technology implementation, helped minimize potential misclassification bias in CVD diagnosis (1, 17). Second, while subclinical cardiovascular conditions might have led to case underestimation, CMI’s persistent statistical significance demonstrates its robust predictive capability. Third, the broad categorization of heart disease without specific subtype differentiation may explain the relatively modest associations observed. Fourth, although we utilized only baseline CMI measurements, this approach reflects real-world conditions in developing countries where regular follow-up poses significant challenges (3). Finally, while our study focused on the Chinese population aged 45 and above, the consistent predictive performance of CMI supports the validity of our findings. However, given the diverse dietary habits and lifestyles across different regions and countries, the applicability of our conclusions to other developing countries requires further investigation.
The original contributions presented in the study are included in the article/Supplementary Material. Further inquiries can be directed to the corresponding authors.
The studies involving humans were approved by Peking University’s Ethics Review Committee (IRB 00001052-11015). The studies were conducted in accordance with the local legislation and institutional requirements. The participants provided their written informed consent to participate in this study. Written informed consent was obtained from the individual(s) for the publication of any potentially identifiable images or data included in this article.
YL: Writing – original draft. ZY: Writing – original draft. XL: Data curation, Writing – original draft. CS: Data curation, Formal Analysis, Writing – original draft. PZ: Data curation, Writing – original draft. DW: Writing – review & editing. YX: Writing – review & editing.
The author(s) declare that financial support was received for the research and/or publication of this article. This work was supported by National Natural Science Foundation of China (82100508, 82241212, 82270346), General project of Nanjing Health Commission (Grant No. YKK21087), funding for Clinical Trials from the Affiliated Drum Tower Hospital, Medical School of Nanjing University (2022-LCYJ-PY-31), Jiangsu Province Capability Improvement Project through Science, Technology and Education, Jiangsu Provincial Medical Key Discipline (ZDXK202229) and Nursing Psychology Scientific Research Planning Project by the Nursing Psychology Professional Committee, Chinese Association for Mental Health(Grant No. 22-23-104).
The authors express gratitude to the CHARLS team for their valuable contributions and to the participants for providing data. Additionally, we extend our sincere thanks to the “YiWanDou” Research Team for their statistical support.
The authors declare that the research was conducted in the absence of any commercial or financial relationships that could be construed as a potential conflict of interest.
The author(s) declare that no Generative AI was used in the creation of this manuscript.
All claims expressed in this article are solely those of the authors and do not necessarily represent those of their affiliated organizations, or those of the publisher, the editors and the reviewers. Any product that may be evaluated in this article, or claim that may be made by its manufacturer, is not guaranteed or endorsed by the publisher.
The Supplementary Material for this article can be found online at: https://www.frontiersin.org/articles/10.3389/fendo.2025.1551779/full#supplementary-material
CMI, Cardiometabolic Index; CVD, Cardiovascular disease; BMI, Body Mass Index; HbA1c, Hemoglobin A1c; TG, Triglycerides; HDL-C, High-density lipoprotein cholesterol; WHtR, Waist-to-height ratio; WC, Waist circumference; Sc, serum creatinine.
1. Li F, Wang Y, Shi B, Sun S, Wang S, Pang S, et al. Association between the cumulative average triglyceride glucose-body mass index and cardiovascular disease incidence among the middle-aged and older population: a prospective nationwide cohort study in China. Cardiovasc Diabetol. (2024) 23:16. doi: 10.1186/s12933-023-02114-w
2. Li Y, Cao GY, Jing WZ, Liu J, Liu M. Global trends and regional differences in incidence and mortality of cardiovascular disease, 1990-2019: findings from 2019 global burden of disease study. Eur J Prev Cardiol. (2023) 30(3):276-86. doi: 10.1093/eurjpc/zwac285
3. Shamia D, Abramowitz Y, Tsaban G. Global and regional cardiovascular risk and mortality: a right, but a long way to go. Eur J Prev Cardiol. (2023) 30:274–5. doi: 10.1093/eurjpc/zwac313
4. Zhang Z, Zhao L, Lu Y, Xiao Y, Zhou X. Insulin resistance assessed by estimated glucose disposal rate and risk of incident cardiovascular diseases among individuals without diabetes: findings from a nationwide, population based, prospective cohort study. Cardiovasc Diabetol. (2024) 23:194. doi: 10.1186/s12933-024-02256-5
5. Xia X, Chen S, Tian X, Xu Q, Zhang Y, Zhang X, et al. Roles of general and central adiposity in cardiometabolic multimorbidity: revisiting the obesity paradox using a multistate model. Obes (Silver Spring). (2024) 32:810–21. doi: 10.1002/oby.23980
6. Shi W-R, Wang H-Y, Chen S, Guo X-F, Li Z, Sun Y-X. Estimate of prevalent diabetes from cardiometabolic index in general Chinese population: a community-based study. Lipids Health Dis. (2018) 17:236. doi: 10.1186/s12944-018-0886-2
7. Che B, Zhong C, Zhang R, Pu L, Zhao T, Zhang Y, et al. Triglyceride-glucose index and triglyceride to high-density lipoprotein cholesterol ratio as potential cardiovascular disease risk factors: an analysis of UK biobank data. Cardiovasc Diabetol. (2023) 22:34. doi: 10.1186/s12933-023-01762-2
8. Wen J, Yuan H. Independent association between the visceral adiposity index and microalbuminuria in patients with newly diagnosed type 2 diabetes. Diabetes Metab Res Rev. (2020) 36:e3198. doi: 10.1002/dmrr.3198
9. Ye R, Zhang X, Zhang Z, Wang S, Liu L, Jia S, et al. Association of cardiometabolic and triglyceride-glucose index with left ventricular diastolic function in asymptomatic individuals. Nutr Metab Cardiovasc Dis. (2024) 34:1590–600. doi: 10.1016/j.numecd.2024.02.008
10. Wang H, Chen Y, Sun G, Jia P, Qian H, Sun Y. Validity of cardiometabolic index, lipid accumulation product, and body adiposity index in predicting the risk of hypertension in Chinese population. Postgrad Med. (2018) 130:325–33. doi: 10.1080/00325481.2018.1444901
11. Wakabayashi I, Daimon T. The “cardiometabolic index” as a new marker determined by adiposity and blood lipids for discrimination of diabetes mellitus. Clin Chim Acta. (2015) 438:274–8. doi: 10.1016/j.cca.2014.08.042
12. Li C, Meng T, Wang B, Liu C, Jiang N, Li J, et al. Association between cardiometabolic index and asthma in adults: evidence from NHANES 2005-2018. J Asthma. (2024) 62(1):101-9. doi: 10.1080/02770903.2024.2388774
13. Zuo Y-Q, Gao Z-H, Yin Y-L, Yang X, Feng P-Y. Association between the cardiometabolic index and hyperuricemia in an asymptomatic population with normal body mass index. Int J Gen Med. (2021) 14:8603–10. doi: 10.2147/IJGM.S340595
14. Tang C, Pang T, Dang C, Liang H, Wu J, Shen X, et al. Correlation between the cardiometabolic index and arteriosclerosis in patients with type 2 diabetes mellitus. BMC Cardiovasc Disord. (2024) 24:186. doi: 10.1186/s12872-024-03853-8
15. Cai X, Hu J, Wen W, Wang J, Wang M, Liu S, et al. Associations of the cardiometabolic index with the risk of cardiovascular disease in patients with hypertension and obstructive sleep apnea: results of a longitudinal cohort study. Oxid Med Cell Longev. (2022) 2022:4914791. doi: 10.1155/2022/4914791
16. Wang H, Chen Y, Guo X, Chang Y, Sun Y. Usefulness of cardiometabolic index for the estimation of ischemic stroke risk among general population in rural China. Postgrad Med. (2017) 129:834–41. doi: 10.1080/00325481.2017.1375714
17. Zhao Y, Hu Y, Smith JP, Strauss J, Yang G. Cohort profile: the China health and retirement longitudinal study (CHARLS). Int J Epidemiol. (2014) 43:61–8. doi: 10.1093/ije/dys203
18. World Medical Association. World Medical Association Declaration of Helsinki: ethical principles for medical research involving human subjects. JAMA. (2013) 310:2191–4. doi: 10.1001/jama.2013.281053
19. Min Q, Wu Z, Yao J, Wang S, Duan L, Liu S, et al. Association between atherogenic index of plasma control level and incident cardiovascular disease in middle-aged and elderly Chinese individuals with abnormal glucose metabolism. Cardiovasc Diabetol. (2024) 23:54. doi: 10.1186/s12933-024-02144-y
20. von Elm E, Altman DG, Egger M, Pocock SJ, Gøtzsche PC, Vandenbroucke JP, et al. The Strengthening the Reporting of Observational Studies in Epidemiology (STROBE) statement: guidelines for reporting observational studies. Lancet. (2007) 370:1453–7. doi: 10.1016/S0140-6736(07)61602-X
21. Munir R, Usman H, Hasnain S, Smans K, Kalbacher H, Zaidi N. Atypical plasma lipid profile in cancer patients: cause or consequence? Biochimie. (2014) 102:9–18. doi: 10.1016/j.biochi.2014.03.010
22. Wang S-K, Ma W, Wang S, Yi X-R, Jia H-Y, Xue F. Obesity and its relationship with hypertension among adults 50 years and older in Jinan, China. PloS One. (2014) 9:e114424. doi: 10.1371/journal.pone.0114424
23. Marx N, Federici M, Schütt K, Müller-Wieland D, Ajjan RA, Antunes MJ, et al. 2023 ESC Guidelines for the management of cardiovascular disease in patients with diabetes. Eur Heart J. (2023) 44:4043–140. doi: 10.1093/eurheartj/ehad192
24. American Diabetes Association. Classification and diagnosis of diabetes: standards of medical care in diabetes-2021. Diabetes Care. (2021) 44:S15–33. doi: 10.2337/dc21-S002
25. Zheng X, Han L, Shen S. Hypertension, remnant cholesterol and cardiovascular disease: evidence from the China health and retirement longitudinal study. J Hypertens. (2022) 40:2292–8. doi: 10.1097/HJH.0000000000003259
26. Xu B, Wu Q, La R, Lu L, Abdu FA, Yin G, et al. Is systemic inflammation a missing link between cardiometabolic index with mortality? Evidence from a large population-based study. Cardiovasc Diabetol. (2024) 23:212. doi: 10.1186/s12933-024-02251-w
27. Stekhoven DJ, Bühlmann P. MissForest–non-parametric missing value imputation for mixed-type data. Bioinformatics. (2012) 28:112–8. doi: 10.1093/bioinformatics/btr597
28. Liu T, Xuan H, Yin J, Wang L, Wang C, Xu X, et al. Triglyceride glucose index increases significantly risk of hypertension development in chinese individuals aged ≥45 years old: analysis from the China health and retirement longitudinal study. J Multidiscip Healthc. (2023) 16:63–73. doi: 10.2147/JMDH.S391905
29. Kursa MB, Rudnicki WR. Feature selection with the boruta package. J Stat Software. (2010) 36:1–13. doi: 10.18637/jss.v036.i11
30. Yan F, Chen X, Quan X, Wang L, Wei X, Zhu J. Association between the stress hyperglycemia ratio and 28-day all-cause mortality in critically ill patients with sepsis: a retrospective cohort study and predictive model establishment based on machine learning. Cardiovasc Diabetol. (2024) 23:163. doi: 10.1186/s12933-024-02265-4
31. Ye Z, An S, Gao Y, Xie E, Zhao X, Guo Z, et al. Association between the triglyceride glucose index and in-hospital and 1-year mortality in patients with chronic kidney disease and coronary artery disease in the intensive care unit. Cardiovasc Diabetol. (2023) 22:110. doi: 10.1186/s12933-023-01843-2
32. Jiang X, Luo Y, Li Z, Zhang H, Xu Z, Wang D. Identification of diagnostic biomarkers and immune cell infiltration in coronary artery disease by machine learning, nomogram, and molecular docking. Front Immunol. (2024) 15:1368904. doi: 10.3389/fimmu.2024.1368904
33. Zuo D, Yang L, Jin Y, Qi H, Liu Y, Ren L. Machine learning-based models for the prediction of breast cancer recurrence risk. BMC Med Inform Decis Mak. (2023) 23:276. doi: 10.1186/s12911-023-02377-z
34. Zhou Y, Shi W, Zhao D, Xiao S, Wang K, Wang J. Identification of immune-associated genes in diagnosing aortic valve calcification with metabolic syndrome by integrated bioinformatics analysis and machine learning. Front Immunol. (2022) 13:937886. doi: 10.3389/fimmu.2022.937886
35. Dai J, Xia K, Huai D, Li S, Zhou L, Wang S, et al. Identification of diagnostic signature, molecular subtypes, and potential drugs in allergic rhinitis based on an inflammatory response gene set. Front Immunol. (2024) 15:1348391. doi: 10.3389/fimmu.2024.1348391
36. Ren Q, Huang Y, Liu Q, Chu T, Li G, Wu Z. Association between triglyceride glucose-waist height ratio index and cardiovascular disease in middle-aged and older Chinese individuals: a nationwide cohort study. Cardiovasc Diabetol. (2024) 23:247. doi: 10.1186/s12933-024-02336-6
37. Ashwell M, Gunn P, Gibson S. Waist-to-height ratio is a better screening tool than waist circumference and BMI for adult cardiometabolic risk factors: systematic review and meta-analysis. Obes Rev. (2012) 13:275–86. doi: 10.1111/j.1467-789X.2011.00952.x
38. Salazar MR, Carbajal HA, Espeche WG, Aizpurúa M, Leiva Sisnieguez CE, March CE, et al. Identifying cardiovascular disease risk and outcome: use of the plasma triglyceride/high-density lipoprotein cholesterol concentration ratio versus metabolic syndrome criteria. J Intern Med. (2013) 273:595–601. doi: 10.1111/joim.12036
39. Salazar MR, Carbajal HA, Espeche WG, Aizpurúa M, Dulbecco CA, Reaven GM. Comparison of two surrogate estimates of insulin resistance to predict cardiovascular disease in apparently healthy individuals. Nutr Metab Cardiovasc Dis. (2017) 27:366–73. doi: 10.1016/j.numecd.2016.12.002
40. Wakabayashi I, Sotoda Y, Hirooka S, Orita H. Association between cardiometabolic index and atherosclerotic progression in patients with peripheral arterial disease. Clin Chim Acta. (2015) 446:231–6. doi: 10.1016/j.cca.2015.04.020
41. Datta Banik S, Pacheco-Pantoja E, Lugo R, Gómez-de-Regil L, Chim Aké R, Méndez González RM, et al. Evaluation of anthropometric indices and lipid parameters to predict metabolic syndrome among adults in Mexico. Diabetes Metab Syndr Obes. (2021) 14:691–701. doi: 10.2147/DMSO.S281894
42. Wakabayashi I. Relationship between age and cardiometabolic index in Japanese men and women. Obes Res Clin Pract. (2018) 12:372–7. doi: 10.1016/j.orcp.2016.12.008
43. Mendelsohn ME. Protective effects of estrogen on the cardiovascular system. Am J Cardiol. (2002) 89:12E–7E. doi: 10.1016/s0002-9149(02)02405-0
44. Karastergiou K, Smith SR, Greenberg AS, Fried SK. Sex differences in human adipose tissues - the biology of pear shape. Biol Sex Differ. (2012) 3:13. doi: 10.1186/2042-6410-3-13
45. Yin R, Yin L, Li L, Silva-Nash J, Tan J, Pan Z, et al. Hypertension in China: burdens, guidelines and policy responses: a state-of-the-art review. J Hum Hypertens. (2022) 36:126–34. doi: 10.1038/s41371-021-00570-z
46. Fuchs FD, Whelton PK. High blood pressure and cardiovascular disease. Hypertension. (2020) 75:285–92. doi: 10.1161/HYPERTENSIONAHA.119.14240
47. Cheng Y, Zou J, Chu R, Wang D, Tian J, Sheng C-S. Cumulative HbA1c exposure as a CVD risk in patients with type 2 diabetes: A post hoc analysis of ACCORD trial. Diabetes Res Clin Pract. (2023) 206:111009. doi: 10.1016/j.diabres.2023.111009
48. Hill MA, Yang Y, Zhang L, Sun Z, Jia G, Parrish AR, et al. Insulin resistance, cardiovascular stiffening and cardiovascular disease. Metabolism. (2021) 119:154766. doi: 10.1016/j.metabol.2021.154766
49. Denorme F, Portier I, Kosaka Y, Campbell RA. Hyperglycemia exacerbates ischemic stroke outcome independent of platelet glucose uptake. J Thromb Haemost. (2021) 19:536–46. doi: 10.1111/jth.15154
50. Li F-E, Luo Y, Zhang F-L, Zhang P, Liu D, Ta S, et al. Association between cardiometabolic index and stroke: A population- based cross-sectional study. Curr Neurovasc Res. (2021) 18:324–32. doi: 10.2174/1567202618666211013123557
51. Zhou Y, Han W, Gong D, Man C, Fan Y. Hs-CRP in stroke: A meta-analysis. Clinica Chimica Acta. (2016) 453:21–7. doi: 10.1016/j.cca.2015.11.027
52. Wang G, Jing J, Li J, Pan Y, Yan H, Meng X, et al. Association of elevated hs-CRP and multiple infarctions with outcomes of minor stroke or TIA: subgroup analysis of CHANCE randomised clinical trial. Stroke Vasc Neurol. (2021) 6:80–6. doi: 10.1136/svn-2020-000369
53. Ridker PM, Moorthy MV, Cook NR, Rifai N, Lee IM, Buring JE. Inflammation, cholesterol, lipoprotein(a), and 30-year cardiovascular outcomes in women. N Engl J Med. (2024) 391(22):2087–97. doi: 10.1056/NEJMoa2405182
54. Matsushita K, Coresh J, Sang Y, Chalmers J, Fox C, Guallar E, et al. Estimated glomerular filtration rate and albuminuria for prediction of cardiovascular outcomes: a collaborative meta-analysis of individual participant data. Lancet Diabetes Endocrinol. (2015) 3:514–25. doi: 10.1016/S2213-8587(15)00040-6
Keywords: cardiovascular disease, cardiometabolic index, CHARLS, machine learning, stroke
Citation: Luo Y, Yin Z, Li X, Sheng C, Zhang P, Wang D and Xue Y (2025) Cardiometabolic index predicts cardiovascular events in aging population: a machine learning-based risk prediction framework from a large-scale longitudinal study. Front. Endocrinol. 16:1551779. doi: 10.3389/fendo.2025.1551779
Received: 26 December 2024; Accepted: 13 March 2025;
Published: 01 April 2025.
Edited by:
Kanhaiya Singh, University of Pittsburgh, United StatesCopyright © 2025 Luo, Yin, Li, Sheng, Zhang, Wang and Xue. This is an open-access article distributed under the terms of the Creative Commons Attribution License (CC BY). The use, distribution or reproduction in other forums is permitted, provided the original author(s) and the copyright owner(s) are credited and that the original publication in this journal is cited, in accordance with accepted academic practice. No use, distribution or reproduction is permitted which does not comply with these terms.
*Correspondence: Yunxing Xue, YWxiZXJ0X3h1ZUAxNjMuY29t; Dongjin Wang, ZG9uZ2ppbndhbmdfZ2xAMTYzLmNvbQ==
†These authors have contributed equally to this work
Disclaimer: All claims expressed in this article are solely those of the authors and do not necessarily represent those of their affiliated organizations, or those of the publisher, the editors and the reviewers. Any product that may be evaluated in this article or claim that may be made by its manufacturer is not guaranteed or endorsed by the publisher.
Research integrity at Frontiers
Learn more about the work of our research integrity team to safeguard the quality of each article we publish.