 Guo-Ji Lin1,2†‡
 Shao-Han Guo
 Ya-Qin Gong
 Chong Li
 Ke Lu
Ke Lu- 1Department of Orthopedics, Affiliated Kunshan Hospital of Jiangsu University, Suzhou, Jiangsu, China
- 2Kunshan Biomedical Big Data Innovation Application Laboratory, Suzhou, Jiangsu, China
- 3Information Department, Affiliated Kunshan Hospital of Jiangsu University, Suzhou, Jiangsu, China
- 4Kunshan Municipal Health and Family Planning Information Center, Suzhou, Jiangsu, China
Background: Lipid metabolism is closely linked to uric acid metabolism, with previous studies suggesting associations between lipid profiles to serum uric acid (SUA) levels. Apolipoprotein A1 (ApoA1), a key component in lipid metabolism and transport, may also be associated with SUA levels, though research in this area remains limited. This study aimed to investigate the independent association between ApoA1 levels and SUA in patients with osteoporotic fractures (OPF).
Methods: This cross-sectional study included 2,108 OPF patients admitted to Kunshan Hospital, affiliated with Jiangsu University, from January 2017 to August 2023. Serum ApoA1 concentration was considered the exposure variable, and SUA concentration the outcome variable. Adjusted linear regression models and smooth curve fitting were employed to assess the relationship between ApoA1 and SUA. Nonlinear associations were examined using a generalized additive model (GAM), and a segmented regression method identified the inflection point. Univariate and stratified analyses were also performed.
Results: Following adjustment for confounding covariates, a nonlinear relationship, U-shaped association was identified between serum ApoA1 and SUA concentrations, with an inflection point at 1.52 g/L. Estimated effects and 95% confidence intervals to the left and right of the inflection point were -55.20 (-75.57 to -34.82) and 77.33 (22.48 to 132.19), respectively.
Conclusions: A U-shaped relationship between serum ApoA1 and SUA was identified in OPF patients. Based on these findings, we propose the concept of a “SUA trough” within the OPF population, additional research is required to explore the mechanism behind this association.
Background
Osteoporotic fracture (OPF), also known as fragility fracture, commonly occur in the setting of osteoporosis or following minimal trauma, such as a fall from standing height, lifting objects, or even spontaneously without substantial injury (1, 2). OPFs have a profound impact on patients’ quality of life and independence. Globally, approximately one-third of women and one-fifth of men aged 50 and older are expected to experience fractures related to osteoporosis (3). In China alone, it is projected that by 2050, over 6 million new cases of OPF will arise, presenting a considerable healthcare challenge (4). As populations continue to age, the prevalence of OPF is anticipated to rise substantially (5).
Serum uric acid (SUA) is the final product of purine metabolism, derived from xanthine and hypoxanthine through the action of xanthine oxidoreductase (6). SUA has a complex role in the pathogenesis of osteoporosis, as it can promote bone loss by enhancing osteoclast activity and inflammatory responses (7). However, under certain conditions, SUA may also exert protective effects against bone loss (8). Although the upper limit of normal SUA is generally set at 420 µmol/L for males and 360 µmol/L for females (9), a study (10) demonstrated that even within the normal SUA range, the risk of cardiovascular disease increases progressively with higher SUA levels in individuals lacking traditional cardiovascular risk factors. Therefore, maintaining these prevention levels is of significant importance. Additionally, apolipoprotein A1 (ApoA1), the primary protein associated with high-density lipoprotein cholesterol (HDL-C), is essential for transporting cholesterol from peripheral tissues to the liver, thereby playing a vital role in lipid metabolism (11).
Previous studies have predominantly focused on the relationship between lipid profiles and SUA, revealing a positive correlation between SUA and the risk of hypertriglyceridemia (12). Lipid metabolism is intricately associated with apolipoproteins. Recent research has shown an inverse correlation between ApoA1 and SUA levels in healthy Chinese individuals (13), However, research on the relationship between apolipoproteins and SUA levels in patients with OPF remains limited. This study aims to further elucidate the relationship between ApoA1 and SUA levels, providing new insights into the complex interplay between lipid metabolism and uric acid metabolism. These insights may offer a fresh perspective on managing lipid and SUA levels in populations with OPF.
Materials and methods
Study design and subjects
A retrospective cross-sectional study was conducted at the Kunshan Hospital affiliated with Jiangsu University, utilizing patient data extracted from electronic medical records from January 2017 to August 2023. The study included a total of 4782 patients diagnosed with OPF who required further inpatient surgical treatment. Within three days of admission, these patients underwent blood tests to assess liver and kidney function, as well as lipid and biochemical analyses. OP diagnosis was made on the following inclusion criteria (1): evidence of bone instability and fractures in the absence of other metabolic bone diseases, with physiological bone mineral density (BMD) assessed using T-scores, and (2) OP confirmed by a T-score of −2.5 or less, even in the absence of a predominant fracture (14). The OPF was defined as a fracture resulting from known osteoporosis and/or insufficient trauma, including falls from standing height, lifting, or spontaneous fractures without external trauma (15). Participants were excluded based on the following criteria (1): presence of shock or infection (2), lack of ApoA1 data (3), lack of SUA data (4), history of kidney disease and gout (5), use of statins during hospitalization (6), missing covariate data. A total of 2108 participants were finally included for further analysis (Figure 1). This study was approved by the Kunshan Hospital affiliated with Jiangsu University (approval No. 2024-03-053-H00-K01) and complied with the Helsinki Declaration. Personal information was anonymized during data collection and analysis.
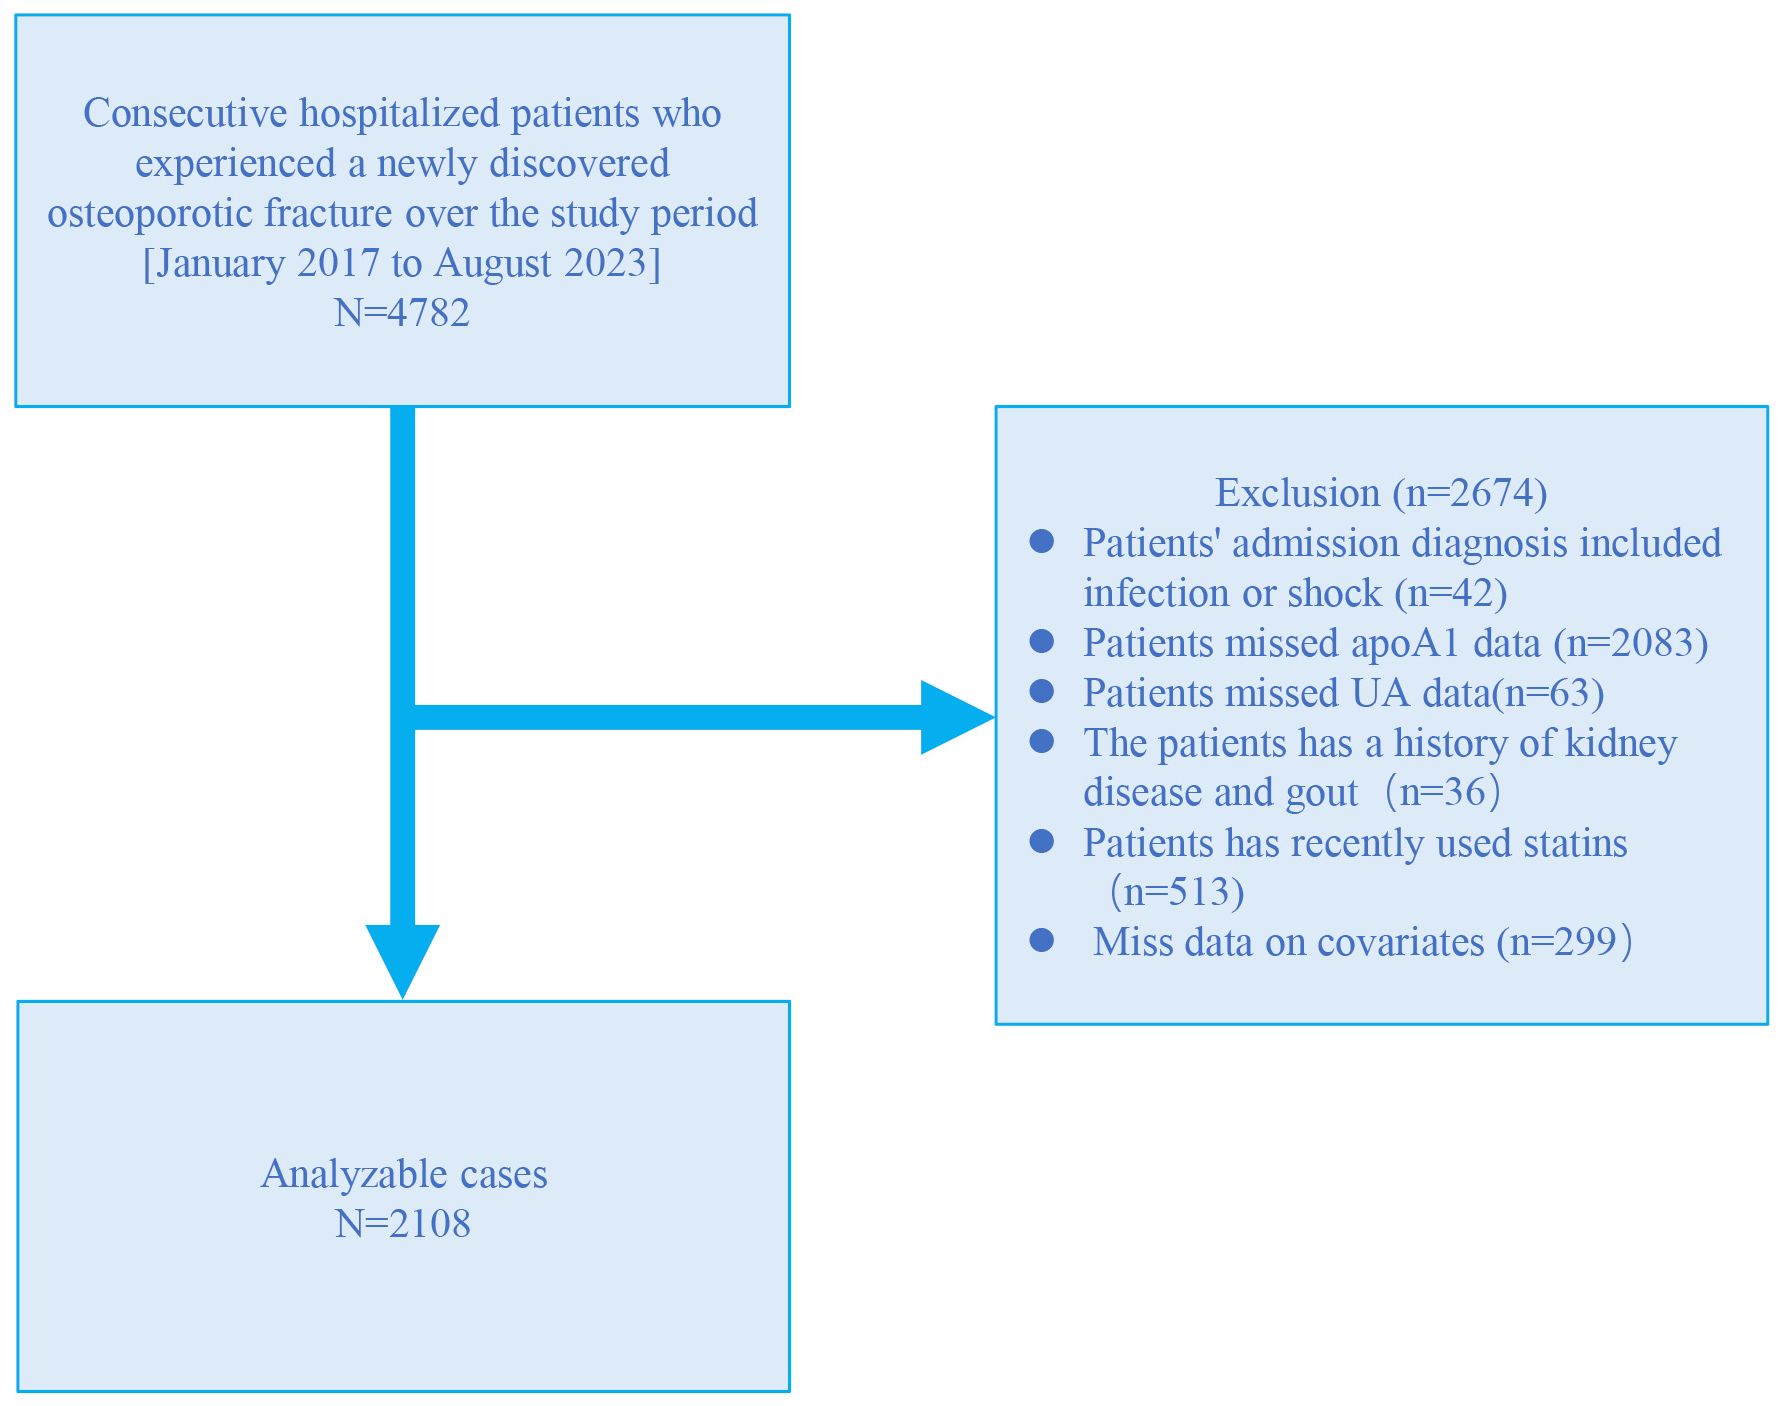
Figure 1. Study flow chart.
Dependent variable and independent variable
In this study, serum ApoA1 levels were assessed as the independent variable through an electro-chemiluminescence immunoassay conducted on the LABOSPECT 008AS platform (Hitachi High-Tech Co., Tokyo, Japan). The SUA concentration is the outcome variable of this study, measured by an enzymatic colorimetric method. Clinical parameters were measured using the same instruments and by experienced operators following standardized procedures. Prior to participant examinations each day, the machines underwent standard quality control procedures.
Covariates
This study included various potential covariates, such as age, gender, body mass index (BMI), primary diagnosis, Charlson Comorbidity Index (CCI) (16), hypertension, diabetes, alanine aminotransferase (ALT), aspartate aminotransferase (AST), creatinine(Cr), and albumin. The CCI is a validated measure that quantifies comorbidity burden by assigning weighted scores to 19 different chronic conditions, with higher scores indicating greater comorbidity and increased mortality risk (17). All blood samples were collected on the first morning after admission, following a standardized fasting period of 8-10 hours.
Statistical analyses
Population demographics, laboratory, and clinical data are presented using standard deviation (SD) or median (25th, 75th percentile) for continuous variables, while categorical data are shown as frequencies (percentages). For univariate analysis of categorical data, Pearson’s chi-squared test or Fisher’s exact test is employed, and for continuous data, independent sample t-tests and Mann-Whitney U tests are used for normally distributed and non-normally distributed data, respectively. Additionally, to explore the relationship between characteristics of OPF patients and uric acid, corresponding univariate analyses were conducted.
The general linear models with appropriate adjustment for covariates were used to investigate the independent relationship between ApoA1 and SUA in OPF. The generated models underwent full calibration (Model 4), partial calibration (Models 2 and 3), and no calibration (Model 1) to explore this relationship. Based on the evaluation of variance inflation factor (VIF) data, covariances were adjusted as follows: Standard 1: The impact of introducing covariates into the basic model or removing covariates from the complete model on the regression coefficient of X is greater than 10%.Standard 2: The P-value of the regression coefficient between Standard 1 or covariate and Y is less than 0.1 (18). Four models were ultimately established: Model 1 without adjustments; Model 2 adjusted for gender, age, BMI, primary diagnosis, and CCI; Model 3 adjusted for gender, age, BMI, primary diagnosis, CCI, hypertension, and diabetes; Model 4 adjusted for gender, age, BMI, primary diagnosis, CCI, hypertension, diabetes, ALT, AST, CR, and albumin.
In addition to linear models, we employed Generalized Additive Models (GAM) to examine the nonlinear relationship between ApoA1 and SUA concentrations. Segmented regression (also known as piece-wise regression) was used to identify threshold effects in the smoothed curves, and the algorithmic approach of maximum likelihood modeling was utilized to recursively compute the inflection points of these unique rate curves (19). After categorizing patients based on specific covariates, additional analyses were conducted to assess the reliability of study results and compare differences among different patient groups. Likelihood ratio tests (LRT) were employed to evaluate interactions and modifications among subgroups (Supplementary Figure S1). Additionally, multiple imputation analysis was performed to determine whether the incorporation of covariates for missing data introduced bias into our results (20). The results of the general linear models based on data obtained from multiple imputations are presented in Supplementary Table S1.
All analyses were conducted using R packages (http://www.R-project.org, The R Foundation) and EmpowerStats software (http://www.empowerstats.com, X&Y Solutions, Inc, MA, USA) with a significance level set at a two-sided P < 0.05.
Results
Patient characteristics
Table 1 summarizes the baseline characteristics of 2108 OPF patients admitted between January 2017 and August 2023, categorized by quartiles of ApoA1. The patients had a mean age of 68.90 ± 11.14 years, with a gender distribution of 29.08% male and 70.92% female., The average ApoA1 level was 1.21 ± 0.24 mg/dL, and the average SUA level of 283.02 ± 89.86 µmol/L. Patients were stratified into quartiles based on their ApoA1 levels (<1.03, 1.04-1.17, 1.18-1.33, 1.34-2.49 mg/dL), revealing significant differences in Cr, albumin, SUA, and ApoA1 levels.
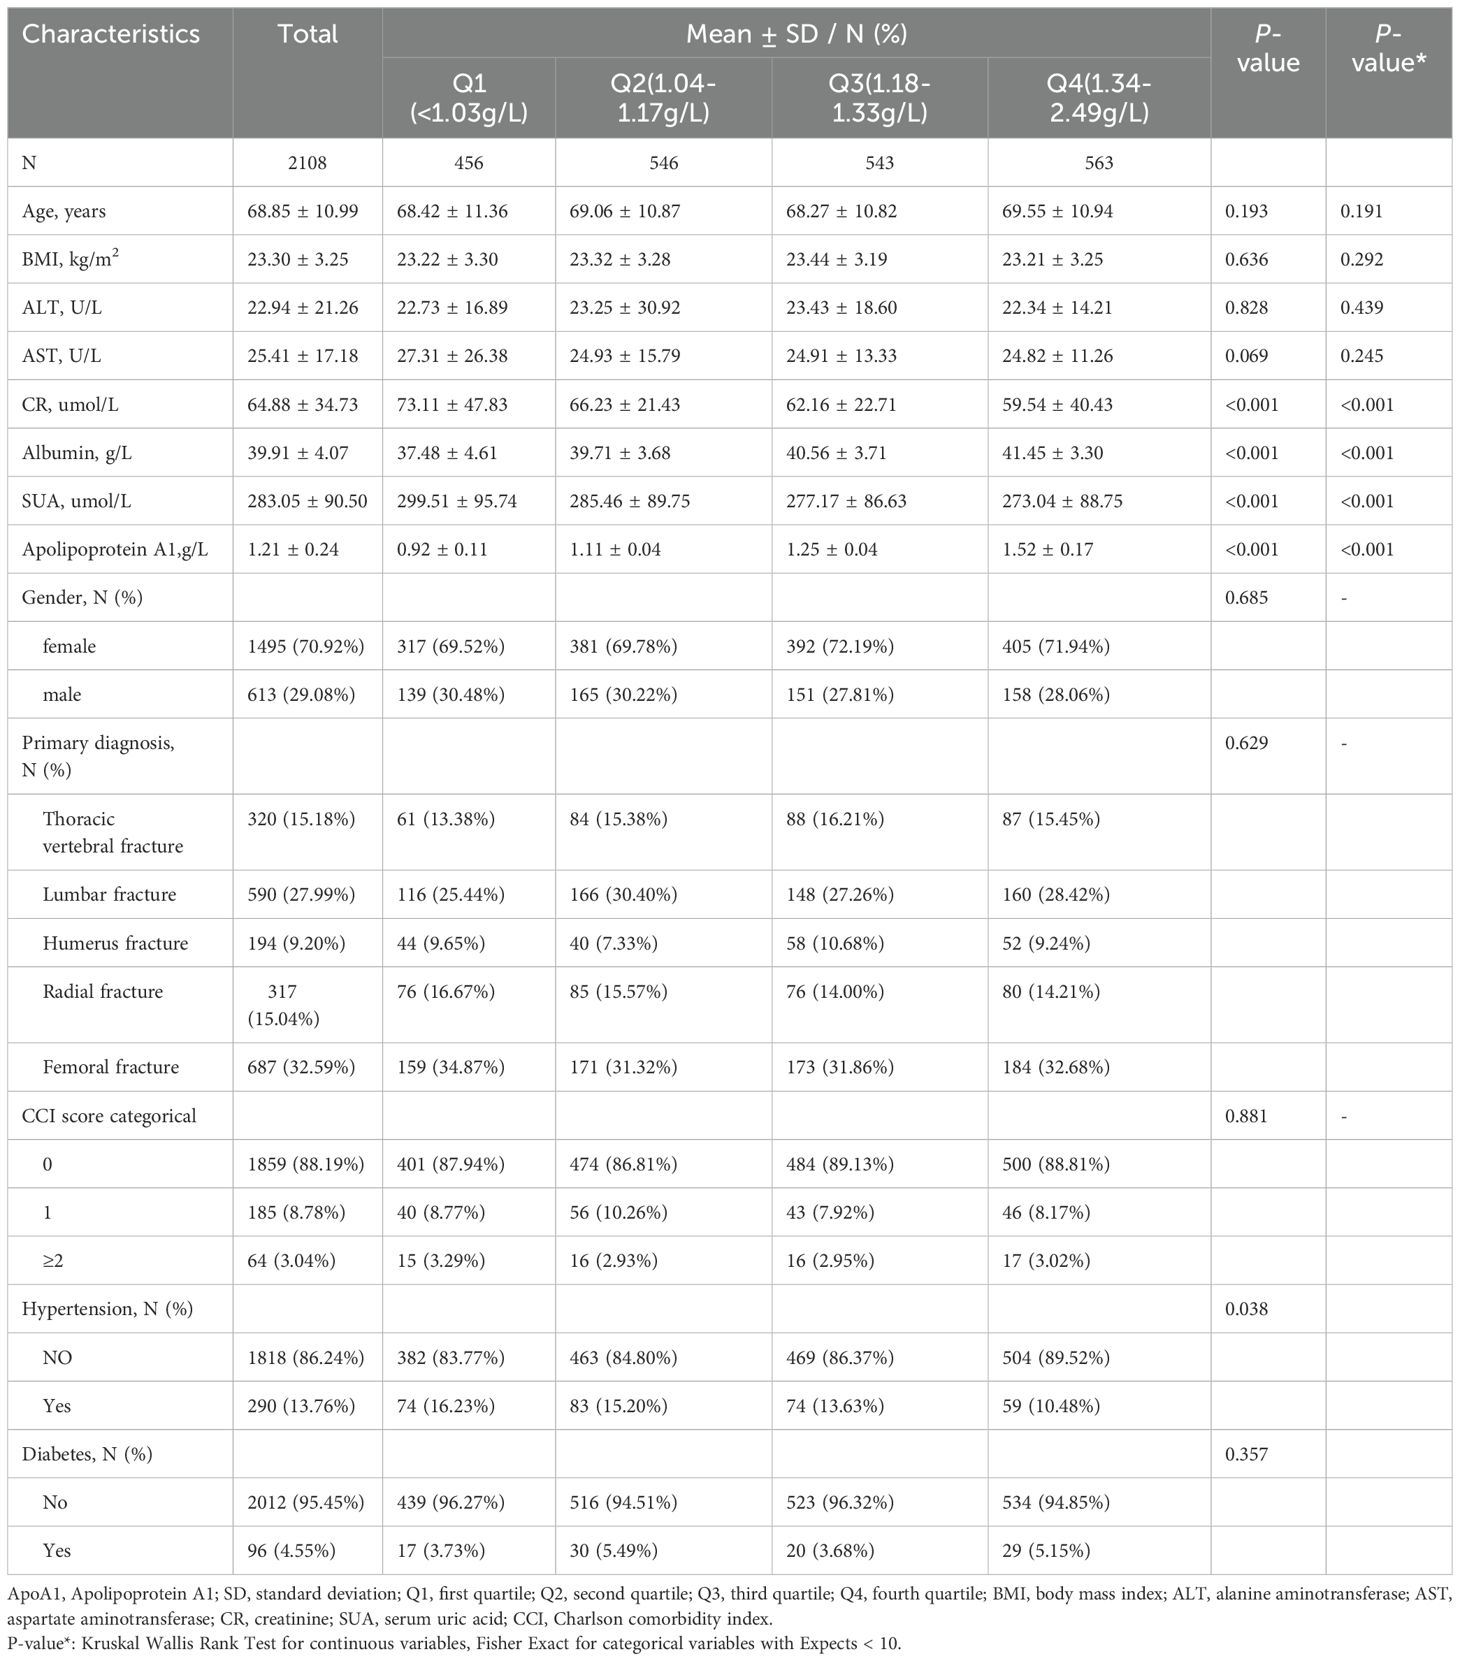
Table 1. Patient characteristics based on ApoA1 quartiles.
Univariate analyses of factors associated with SUA
Table 2 presents the results of the univariate analysis, indicating a negative correlation between ApoA1 levels and SUA. In contrast, ALT, AST, albumin, and creatinine exhibited a positive correlation with uric acid levels.
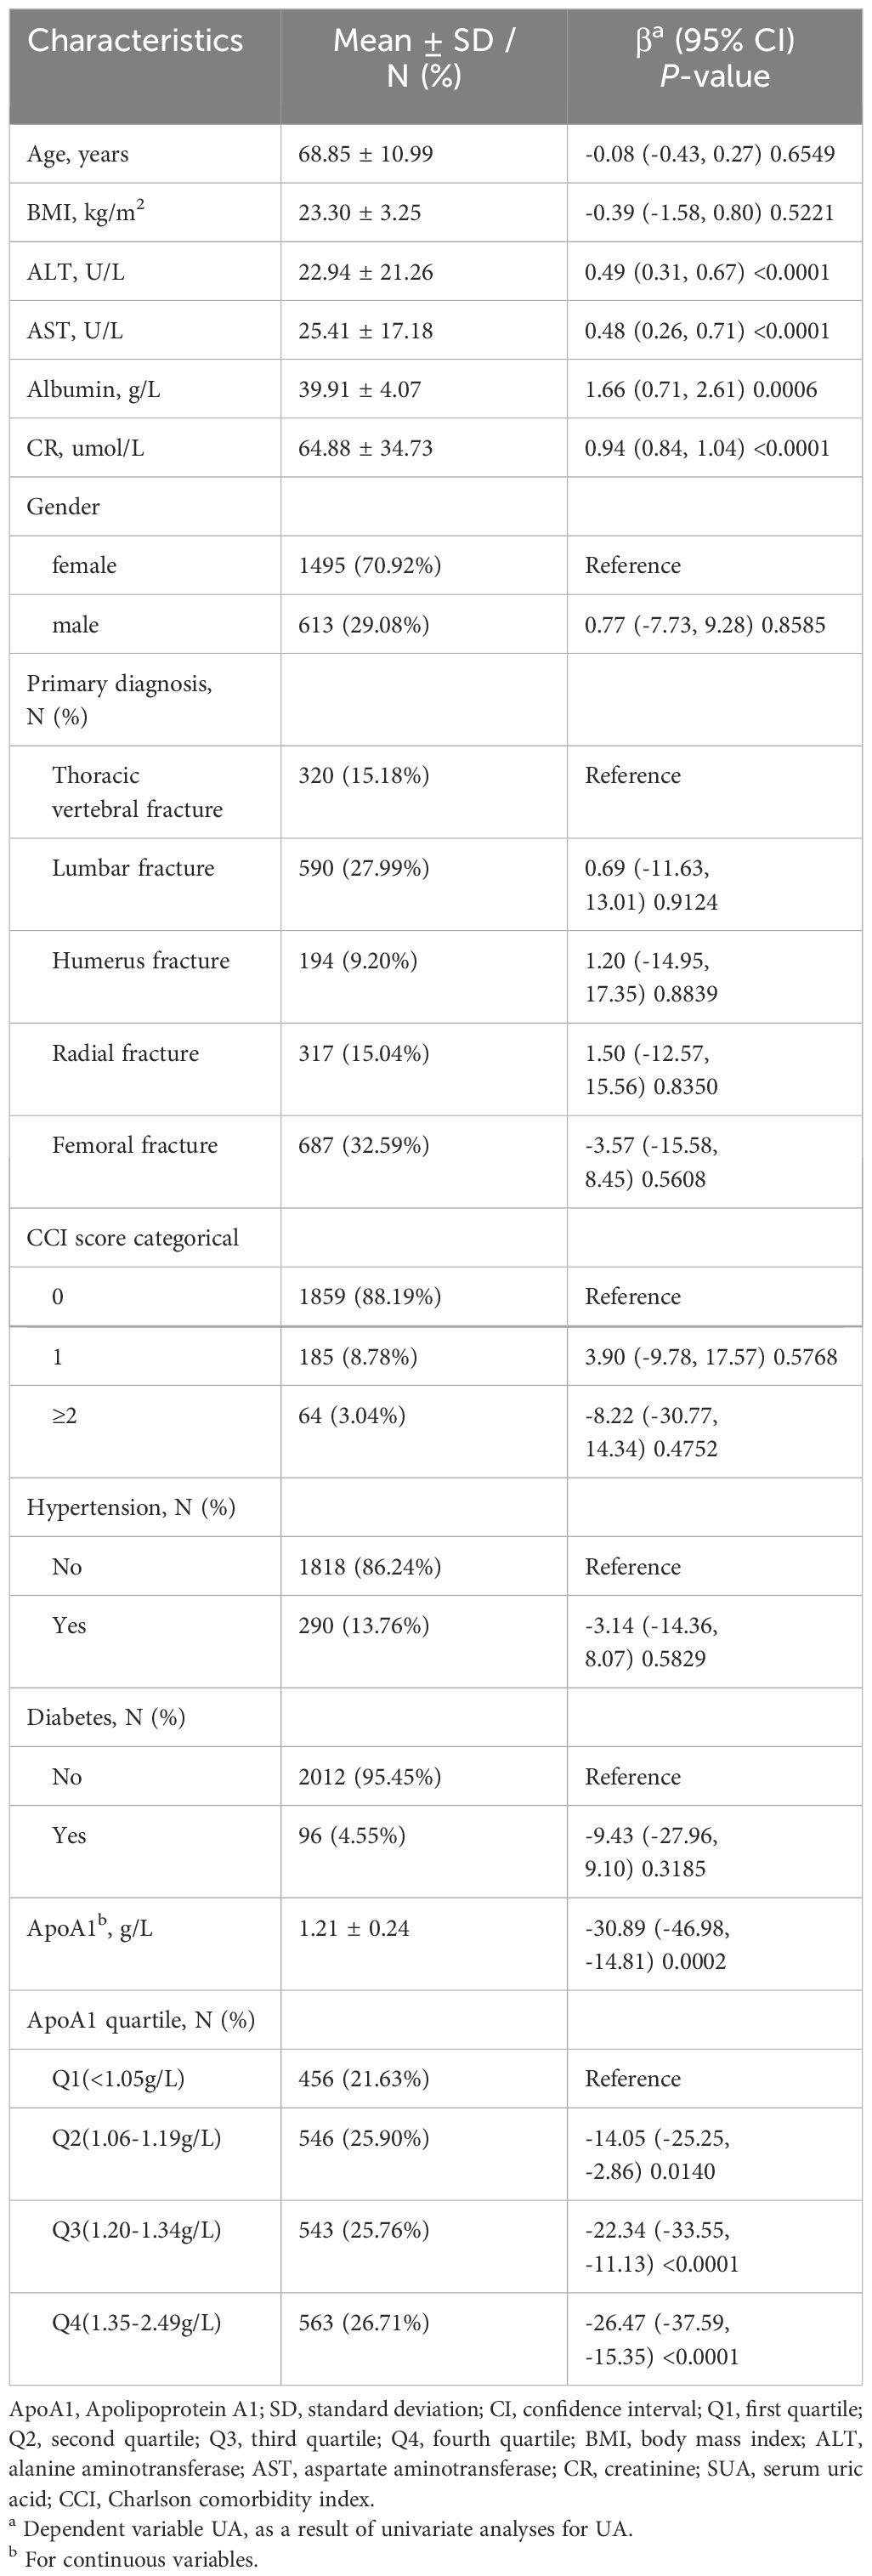
Table 2. Univariate analysis for SUA.
Exploration of the association between apoA1 levels and SUA
A univariate linear regression model was used to assess the association between ApoA1 and SUA. The corresponding results for the four models are presented in Table 3. In the unadjusted Model 1, a noteworthy correlation was observed between these factors (β = -30.89, 95% CI -46.98, -14.81, P = 0.0002). Adjusted Model 2 (adjusting for age, gender, Body Mass Index (BMI), primary diagnosis, CCI) showed a similar association (β = -30.79, 95% CI -46.93, -14.66, P = 0.0002). Model 3 also demonstrated a significant negative correlation, further adjusting for hypertension and diabetes variables (β = -30.75, 95% CI -46.92, -14.57, P = 0.0002). Even after additional adjustments for ALT, AST, CR, and albumin covariates in the fully adjusted Model 4, the association between the two remained significant (β = -29.25, 95% CI: -45.16, -13.33, P = 0.0003).
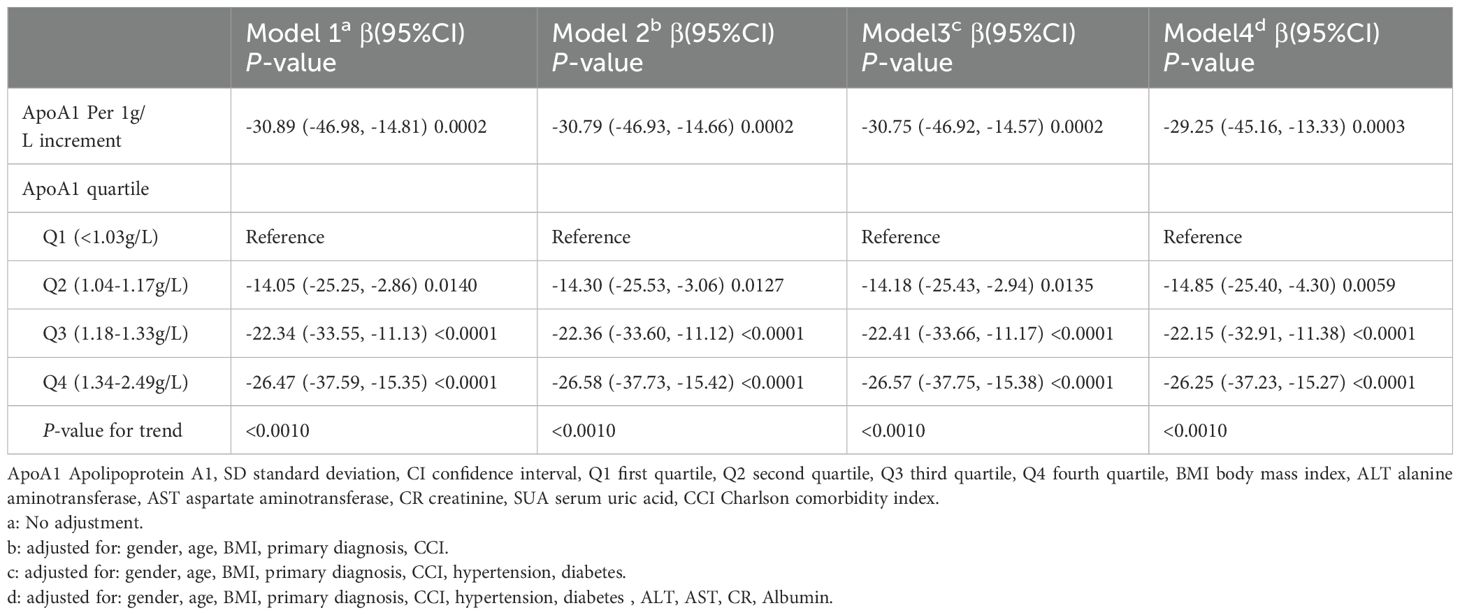
Table 3. Association between ApoA1 concentrations and SUA level across various models (N=2108).
Additionally, we conducted a sensitivity analysis where ApoA1 was treated as a categorical variable (quartiles). In the fully adjusted Model 4, the trend of association between ApoA1 and SUA remained consistent (p for the trend was <0.001). To validate the robustness of our findings, we conducted subgroup analyses on various categorical variables. Notably, there was a significant interaction effects between gender and the primary diagnosis observed concerning the association of ApoA1 with UA (Supplementary Figure S1).
Spline smoothing plot and threshold analyses
In this study, we analyzed the nonlinear relationship between ApoA1 and SUA as both were treated as continuous variables (Figure 2). The results revealed a threshold nonlinear relationship between ApoA1 and SUA in the study population (adjusted for age, gender, primary diagnosis, BMI, CCI, hypertension, diabetes, ALT, AST, CR, albumin). The segmented regression method was used to determine the inflection point, and we calculated the inflection point to be 1.52 g/L. On the left side of the inflection point, the effect size, 95% CI, and P were -55.20, -75.57 to -34.82, and <0.0001, respectively. Conversely, to the right of the inflection point, the effect size, 95% CI, and P were 77.33, 22.48 to 132.19, and 0.0058, respectively (Table 4).
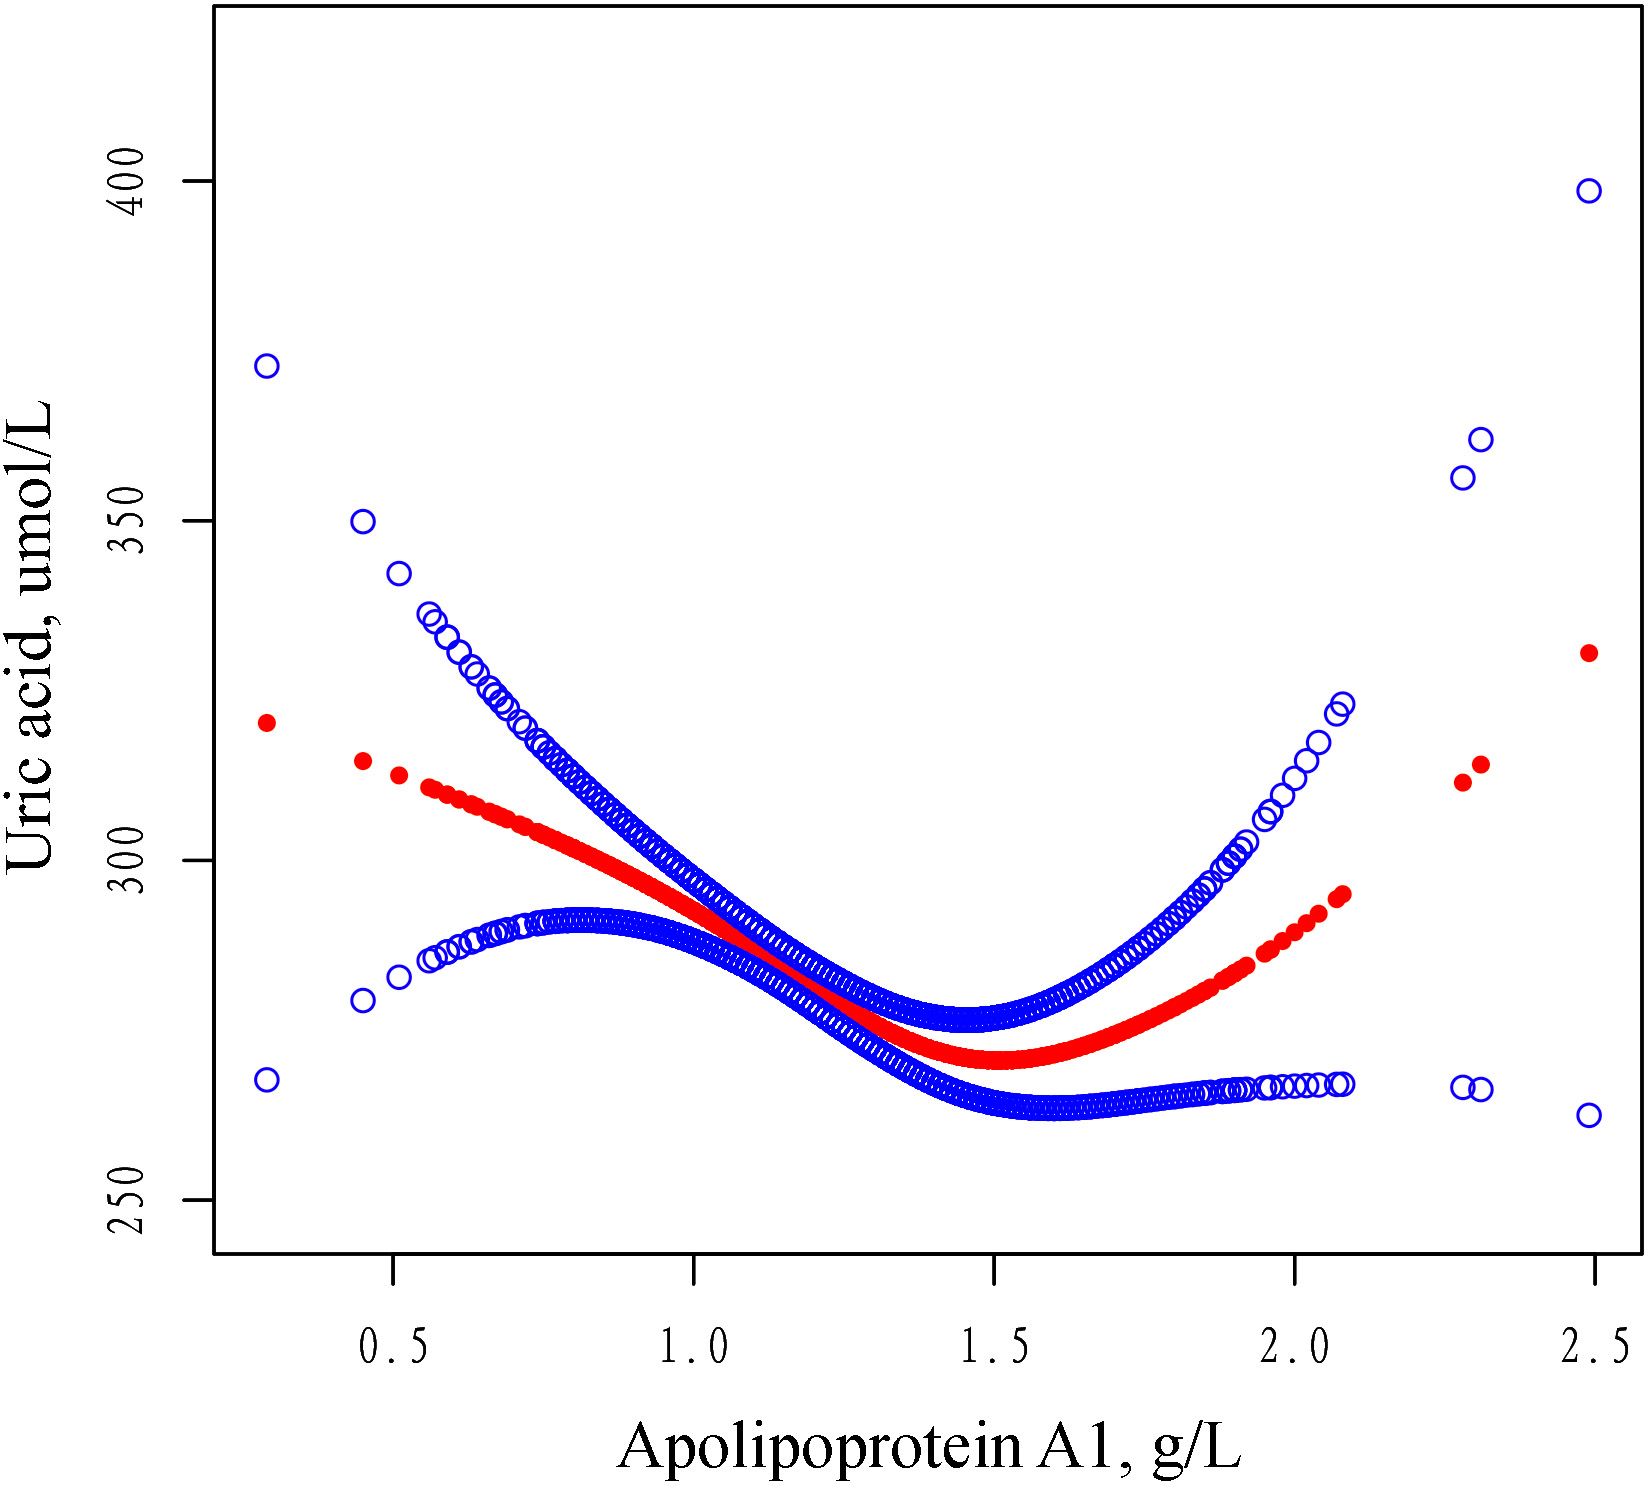
Figure 2. The adjusted smoothed curves illustrate the association between serum ApoA1 levels and the SUA. A generalized additive model identified a threshold non-linear association between serum ApoA1 levels and SUA in patients with OPF. The upper and lower blue curves denote the boundaries of the 95% confidence interval, whereas the central red curve elucidates the association between ApoA1 levels and SUA. The model has been adjusted for variables including gender, age, BMI, primary diagnosis, CCI, hypertension, diabetes, ALT, AST, CR and Albumin. In Model 4, the red curve indicates an inflection point (K) at 1.52 g/L. ApoA1 Apolipoprotein A1, SD standard deviation, CI confidence interval, BMI body mass index, ALT alanine aminotransferase, AST aspartate aminotransferase, CR creatinine, SUA serum uric acid, CCI Charlson comorbidity index.
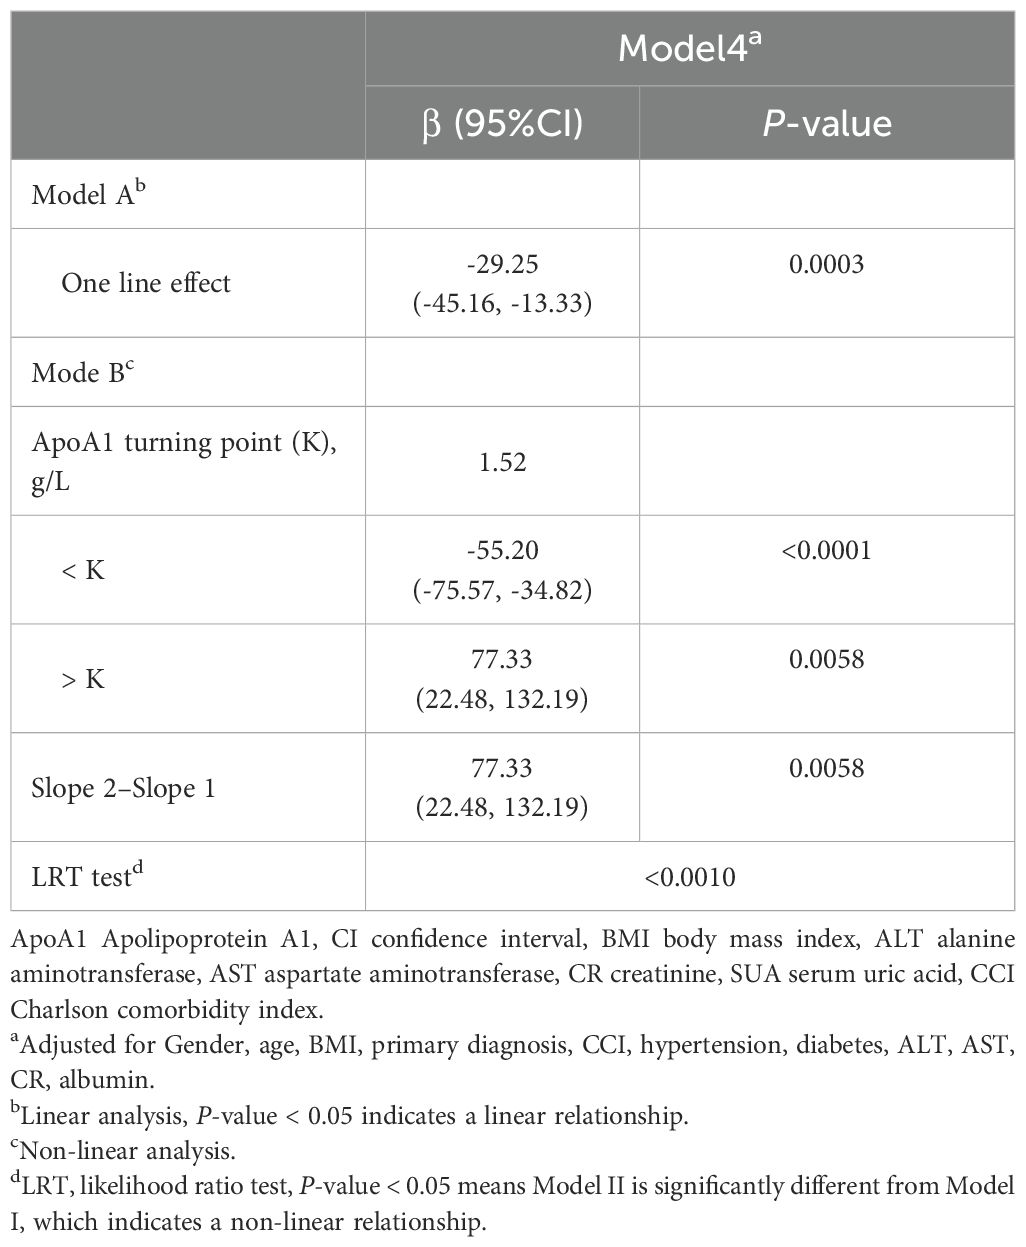
Table 4. Threshold effect analysis of the association between ApoA1 and SUA (N=2108).
Discussion
To our knowledge, this cross-sectional study is the first to elucidate the potential impact of ApoA1 concentration on SUA levels in hospitalized patients with OPF requiring surgery. Analyzing clinical data from 2,108 patients at Kunshan Hospital affiliated with Jiangsu University, we observed a U-shaped correlation between ApoA1 concentration and SUA levels. Specifically, ApoA1 levels below 1.52 g/L were negatively correlated with SUA concentrations, whereas levels above this threshold exhibited a positive correlation. Notably, the association of ApoA1 with SUA diverges from findings in other studies, suggesting a potentially key role for ApoA1 in uric acid metabolism. This finding advances our understanding of the relationship between ApoA1 and SUA levels. In clinical practice, when ApoA1 levels approach a specific threshold, it may correspond with lower uric acid levels in patients. Therefore, monitoring SUA levels may be warranted when ApoA1 concentrations are either excessively high or low.
Previous studies have predominantly examined the relationship between uric acid levels and lipid profiles. A cross-sectional analysis utilizing data from the US National Health and Nutrition Examination Survey (NHANES) revealed significant inverse associations between SUA levels and both triglyceride and high-density lipoprotein cholesterol (HDL-C) levels (21). Another study, after adjusting for confounders, identified a nonlinear positive correlation between the triglyceride-to-HDL-C ratio (TG/HDL-C) and SUA levels (22). Recent research has reported a negative correlation between elevated SUA and ApoA1 among both atrial fibrillation patients and healthy Chinese individuals (13, 23), suggesting that hyperuricemia may contribute to cardiovascular disease progression by lowering ApoA1. These findings differ from those of the present study, likely due to differences in the study populations. The relationship between serum uric acid and bone metabolism appears to vary according to the specific circumstances. Xiao et al. (24) identified a positive correlation between SUA levels and lumbar spine bone mineral density (BMD) in Han Chinese men over 50 years old. Xu et al. (8) also observed an independent positive correlation between SUA levels and BMD, indicating that uric acid may have a protective effect on bone density in certain circumstances. This protective effect may be attributed to the antioxidant properties of uric acid, which can mitigate oxidative stress that promotes osteoclast activation and bone resorption (25). Conversely, at serum uric acid levels that exceed the physiological threshold (6.8 mg/dL), bone resorption resulting from the formation of monosodium urate crystals caused by excess uric acid has been observed, triggering inflammatory cascades and activating the RANKL/RANK pathway, thereby promoting osteoclast formation and inhibiting osteoblast function (26). Sun et al. (27) identified a close association between higher ApoA1 levels and an increased risk of osteoporosis. Furthermore, experimental studies in animal models have demonstrated that ApoA1 deficiency impairs the differentiation of bone progenitor cells, resulting in enhanced adipogenesis and reduced osteoblastogenesis (28). Consequently, the relationship between ApoA1, SUA, and osteoporosis is intricate and multifaceted. Our study elucidated a U-shaped relationship between ApoA1 and uric acid in OPF patients, a discovery that diverges from the majority of reported literature. This research further enriches the literature on the relationship between apolipoprotein and uric acid levels in the OPF population.
In the OPF population, a U-shaped relationship between ApoA1 and SUA levels was observed, allowing us to identify the inflection point of this association. Based on these findings, we introduce the concept of a “SUA trough” in this population, suggesting that at specific ApoA1 concentrations, particularly around 1.52 g/L, patients may exhibit lower SUA levels. In contrast, SUA levels tend to rise when ApoA1 levels deviate significantly from this point, either too low or too high. This U-shaped relationship suggests that a more nuanced approach to lipid management might be necessary in patients with OPF, where the retention of ApoA1 concentrations around 1.52 g/L may be beneficial for maintaining lower SUA levels. Clinically, this implies that in evaluating the lipid profile of osteoporotic fracture patients, particularly when ApoA1 levels vary markedly from 1.5 g/L, practitioners should also monitor SUA levels. Future studies could investigate the mechanisms by which ApoA1 influences uric acid metabolism and assess whether regulating ApoA1 levels might aid in managing SUA in osteoporotic fracture patients, potentially contributing to optimized long-term outcomes. Our findings provide empirical support for the intricate relationship between lipid and SUA metabolism. Additionally, we conducted exploratory subgroup analyses examining the association between ApoA1 and SUA, which revealed significant interactions with gender and primary diagnosis. These interactions, not previously reported, underscore the need for further investigation into the underlying mechanisms in future studies.
ApoA1, a major component of high-density lipoprotein cholesterol (HDL-C) (29), is inversely correlated with plasma triglycerides in certain conditions, likely due to lipid exchange, hepatic signaling, regulation by microRNA-33, and the role of ATP-binding cassette transporter A1 (ABCA1) in the liver (30). In early animal studies, infusion of purified ApoA1 from healthy human plasma into atherosclerotic rabbits on a high-fat diet significantly reduced atherosclerotic plaque area, lowered serum triglycerides, and reduced low-density lipoprotein cholesterol levels (31). A mechanistic study showed that ApoA1 could modulate cellular metabolism through the AMP-activated protein kinase (AMPK)-mammalian target of rapamycin (mTOR) signaling pathway, which plays a crucial role in regulating both lipid metabolism and uric acid production (32). At optimal levels, ApoA1 maintains metabolic homeostasis by promoting AMPK activation, while either too little or too much ApoA1 can disrupt this balance (33). This provides a potential mechanistic explanation for the inflection point observed in the U-shaped relationship. Recent findings indicate that hepatic fatty acid β-oxidation can activate hypoxia-inducible factor-1α (HIF-1α), which transcriptionally upregulates xanthine dehydrogenase (XDH) and cytosolic 5’-nucleotidase-II (NT5C2) in the uric acid synthesis pathway, thereby promoting hepatic SUA production (34). This evidence suggests that hyperlipidemia could trigger hyperuricemia, highlighting the interlinked roles of lipid and purine metabolism pathways in metabolic disorders. Consequently, ApoA1 may indirectly influence uric acid production through the triglyceride metabolism pathway. In the kidneys, SUA is extensively filtered by the glomeruli and actively transported in the proximal tubules for secretion and reabsorption. Some studies have observed the anti-inflammatory effects of ApoA1 (35). For example, it may protect against diabetic nephropathy by reducing renal inflammation and shielding kidney cells from oxidative damage (36). Additionally, the intestine plays a major role in extra-renal uric acid excretion, with approximately 30% of SUA secreted through the intestinal epithelium and subsequently degraded by gut microbiota. Certain symbiotic flagellated bacteria can stimulate hepatic ApoA1 and HDL production by activating Toll-like receptor 5 (TLR5) in liver cells (37). Moreover, some conserved genes in intestinal microbes have been identified as potential regulators of gut and systemic purine levels (38), indicating that the gut microbiota may mediate the association identified in the present study. While these studies provide mechanistic insights into the association between ApoA1 and SUA, the precise details of the ApoA1-SUA interaction require further exploration.
Our study has several strengths. First, we conducted this research within the osteoporotic fracture population, which differs from previous observations of the inverse relationship between ApoA1 and uric acid, thus broadening our understanding of their relationship. Second, we evaluated the relationship between ApoA1 and uric acid using multiple models and identified a non-linear relationship. With a larger sample size compared to previous literature, we evaluated the association between ApoA1 and uric acid in OPF patients. Additionally, we employed multiple imputation and subgroup analyses for additional exploration, providing potential insights for future patient uric acid metabolism regulation. However, this study has limitations. First, as an observational study, the identified non-linear correlation between apolipoproteins and uric acid should not be interpreted as causal. Second, apolipoprotein levels were measured at a single time point, without considering potential trajectories. SUA levels are influenced by numerous factors, and while we excluded some individuals, there may still be unaccounted factors. Lastly, despite controlling for numerous potential confounders, including demographic variables, chronic conditions, and clinical indicators, information on several possible confounders was not available in the database, and we were thus unable to account for lifestyle behaviors (such as smoking status, alcohol consumption, and dietary patterns) and medication history (particularly the use of diuretics and uricosuric agents) that could have potentially influenced both ApoA1 and SUA levels. Therefore, residual confounding from these unmeasured variables should be considered when interpreting the findings.
Conclusions
In this study, we identified for the first time a U-shaped relationship between ApoA1 and SUA levels in patients with OPF. Specifically, ApoA1 levels below 1.52 g/L show a negative correlation with SUA, while levels above 1.52 g/L are positively correlated with SUA. This finding addresses a knowledge gap in this area, leading us to propose the novel concept of a “uric acid trough” at an ApoA1 concentration of approximately 1.52 g/L. This suggests that both markedly low and high levels of ApoA1 may adversely impact uric acid metabolism. Further research in a larger patient cohort is warranted to confirm and expand upon these findings.
Data availability statement
The original contributions presented in the study are included in the article/Supplementary Material. Further inquiries can be directed to the corresponding authors.
Ethics statement
The studies involving humans were approved by The Independent Ethics Committee at the First People’ s Hospital of Kunshan. The studies were conducted in accordance with the local legislation and institutional requirements. Written informed consent for participation was not required from the participants or the participants’ legal guardians/next of kin because This is a retrospective observational study. We received ethical approval from the Affiliated Kunshan Hospital of Jiangsu University (approval No. 2024-03-053-H00-K01), and was compliant with the Declaration of Helsinki. As this was an observational study and data were gathered anonymously, written informed consent was not required for these analyses.
Author contributions
G-JL: Data curation, Formal analysis, Methodology, Software, Supervision, Writing – original draft, Writing – review & editing, Investigation. S-HG: Methodology, Supervision, Writing – original draft, Writing – review & editing. J-QL: Data curation, Investigation, Methodology, Writing – review & editing. Y-QG: Methodology, Software, Supervision, Writing – review & editing. JJ: Data curation, Investigation, Project administration, Supervision, Writing – review & editing. CL: Data curation, Formal analysis, Funding acquisition, Project administration, Supervision, Writing – review & editing. KL: Data curation, Formal analysis, Funding acquisition, Project administration, Supervision, Writing – review & editing.
Funding
The author(s) declare that financial support was received for the research and/or publication of this article. The study was supported by Suzhou City Major Disease Multicenter Clinical Research Project (CN) (DZXYJ202312), Special Funding for Jiangsu Province Science and Technology Plan (Key Research and Development Program for Social Development) (CN) (BE2023737), Medical Education Collaborative Innovation Fund of Jiangsu University (JDY2022013), Key Laboratory Project in Suzhou City (SZS2024018) and Gusu Health Talent Plan Scientific Research Project (CN) (GSWS2022109).
Conflict of interest
The authors declare that the research was conducted in the absence of any commercial or financial relationships that could be construed as a potential conflict of interest.
Generative AI statement
The author(s) declare that no Generative AI was used in the creation of this manuscript.
Publisher’s note
All claims expressed in this article are solely those of the authors and do not necessarily represent those of their affiliated organizations, or those of the publisher, the editors and the reviewers. Any product that may be evaluated in this article, or claim that may be made by its manufacturer, is not guaranteed or endorsed by the publisher.
Supplementary material
The Supplementary Material for this article can be found online at: https://www.frontiersin.org/articles/10.3389/fendo.2025.1540879/full#supplementary-material
Supplementary Figure 1 | Effect size of ApoA1 on SUA in prespecified and exploratory subgroups.
Abbreviations
ApoA1, Apolipoprotein A1; OP, Osteoporosis; OPF, Osteoporotic fractures; UA, Uric acid; Cr, Creatinine; BMI, Body mass index; CI, Confidence interval; CCI, Charlson comorbidity index; AST, Aspartate aminotransferase; ALT, Alanine aminotransferase; SD, Standard deviations; GEE, Generalized estimating equations; VIF, Variance inflation factor; GAM, Generalized additive model; LRT, Likelihood ratio test; HDL, High density lipoprotein.
References
1. Shim J, Kim KT, Kim KG, Choi UY, Kyung JW, Sohn S, et al. Safety and efficacy of Wharton’s jelly-derived mesenchymal stem cells with teriparatide for osteoporotic vertebral fractures: A phase I/IIa study. Stem Cells Transl Med. (2021) 10:554–67. doi: 10.1002/sctm.20-0308
2. Khan AA, Slart R, Ali DS, Bock O, Carey JJ, Camacho P, et al. Osteoporotic fractures: diagnosis, evaluation, and significance from the international working group on DXA best practices. Mayo Clin Proc. (2024) 99:1127–41. doi: 10.1016/j.mayocp.2024.01.011
4. Si L, Winzenberg TM, Jiang Q, Chen M, Palmer AJ. Projection of osteoporosis-related fractures and costs in China: 2010-2050. Osteoporos Int. (2015) 26:1929–37. doi: 10.1007/s00198-015-3093-2
5. Compston JE, McClung MR, Leslie WD. Osteoporosis. Lancet. (2019) 393:364–76. doi: 10.1016/s0140-6736(18)32112-3
6. Wu L, Yang W, Zhang Y, Du X, Jin N, Chen W, et al. Elevated serum uric acid is associated with poor survival in advanced HCC patients and febuxostat improves prognosis in HCC rats. Front Pharmacol. (2021) 12:778890. doi: 10.3389/fphar.2021.778890
7. Paik JM, Kim SC, Feskanich D, Choi HK, Solomon DH, Curhan GC. Gout and risk of fracture in women: A prospective cohort study. Arthritis Rheumatol. (2017) 69:422–8. doi: 10.1002/art.39852
8. Xu MZ, Lu K, Yang XF, Ye YW, Xu SM, Shi Q, et al. Association between serum uric acid levels and bone mineral density in patients with osteoporosis: a cross-sectional study. BMC Musculoskelet Disord. (2023) 24:306. doi: 10.1186/s12891-023-06414-w
9. Wang W, Kou J, Zhang M, Wang T, Li W, Wang Y, et al. A metabonomic study to explore potential markers of asymptomatic hyperuricemia and acute gouty arthritis. J Orthop Surg Res. (2023) 18:96. doi: 10.1186/s13018-023-03585-z
10. Tian X, Wang P, Chen S, Zhang Y, Zhang X, Xu Q, et al. Association of normal serum uric acid level and cardiovascular disease in people without risk factors for cardiac diseases in China. J Am Heart Assoc. (2023) 12:e029633. doi: 10.1161/jaha.123.029633
11. Zhao X, Yu Y, Xu W, Dong L, Wang Y, Gao B, et al. Apolipoprotein A1-unique peptide as a diagnostic biomarker for acute ischemic stroke. Int J Mol Sci. (2016) 17:458. doi: 10.3390/ijms17040458
12. Si SA, Chen MQ, Zhang GJ. Association of serum uric acid with hypertriglyceridemia in children and adolescents: a cross-sectional study. Lipids Health Dis. (2024) 23:195. doi: 10.1186/s12944-024-02182-1
13. Duan Y, Chang X, Ding X, An Y, Wang G, Liu J. Association of hyperuricemia with apolipoprotein AI and atherogenic index of plasma in healthy Chinese people: a cross-sectional study. BMC Cardiovasc Disord. (2022) 22:372. doi: 10.1186/s12872-022-02810-7
14. Camacho PM, Petak SM, Binkley N, Diab DL, Eldeiry LS, Farooki A, et al. American association of clinical endocrinologists/american college of endocrinology clinical practice guidelines for the diagnosis and treatment of postmenopausal osteoporosis-2020 update. Endocr Pract. (2020) 26:1–46. doi: 10.4158/gl-2020-0524suppl
15. Bigdon SF, Saldarriaga Y, Oswald KAC, Müller M, Deml MC, Benneker LM, et al. Epidemiologic analysis of 8000 acute vertebral fractures: evolution of treatment and complications at 10-year follow-up. J Orthop Surg Res. (2022) 17:270. doi: 10.1186/s13018-022-03147-9
16. Charlson ME, Pompei P, Ales KL, MacKenzie CR. A new method of classifying prognostic comorbidity in longitudinal studies: development and validation. J Chronic Dis. (1987) 40:373–83. doi: 10.1016/0021-9681(87)90171-8
17. Wei W, Buysman E, Grabner M, Xie L, Brekke L, Ke X, et al. A real-world study of treatment patterns and outcomes in US managed-care patients with type 2 Diabetes initiating injectable therapies. Diabetes Obes Metab. (2017) 19:375–86. doi: 10.1111/dom.12828
18. Kernan WN, Viscoli CM, Brass LM, Broderick JP, Brott T, Feldmann E, et al. Phenylpropanolamine and the risk of hemorrhagic stroke. N Engl J Med. (2000) 343:1826–32. doi: 10.1056/nejm200012213432501
19. Pan K, Tu R, Cai Z, Huang Y, Zhang C. Association of blood lead with estradiol and sex hormone-binding globulin in 8-19-year-old children and adolescents. Front Endocrinol (Lausanne). (2023) 14:1096659. doi: 10.3389/fendo.2023.1096659
20. Park SY, Freedman ND, Haiman CA, Le Marchand L, Wilkens LR, Setiawan VW. Association of coffee consumption with total and cause-specific mortality among nonwhite populations. Ann Intern Med. (2017) 167:228–35. doi: 10.7326/m16-2472
21. Peng TC, Wang CC, Kao TW, Chan JY, Yang YH, Chang YW, et al. Relationship between hyperuricemia and lipid profiles in US adults. BioMed Res Int. (2015) 2015:127596. doi: 10.1155/2015/127596
22. Li Y, Luo Y, Wang Q, Liu X. Detection and quantification of the relationship between the ratio of triglycerides over high-density lipoprotein cholesterol and the level of serum uric acid: one cross-sectional study. Int J Endocrinol. (2022) 2022:1673335. doi: 10.1155/2022/1673335
23. Zhong X, Jiao H, Zhao D, Teng J. Retrospective study from a single center to evaluate the association between sex and serum uric acid levels in 950 patients with atrial fibrillation. Med Sci Monit. (2022) 28:e935273. doi: 10.12659/msm.935273
24. Xiao J, Chen W, Feng X, Liu W, Zhang Z, He L, et al. Serum uric acid is associated with lumbar spine bone mineral density in healthy Chinese males older than 50 years. Clin Interv Aging. (2017) 12:445–52. doi: 10.2147/cia.S130690
25. Kaushal N, Vohora D, Jalali RK, Jha S. Raised serum uric acid is associated with higher bone mineral density in a cross-sectional study of a healthy Indian population. Ther Clin Risk Manag. (2018) 14:75–82. doi: 10.2147/tcrm.S147696
26. Lin KM, Lu CL, Hung KC, Wu PC, Pan CF, Wu CJ, et al. The paradoxical role of uric acid in osteoporosis. Nutrients 11(9). (2019). doi: 10.3390/nu11092111
27. Sun X, Wu X. Association of apolipoprotein A1 with osteoporosis: a cross-sectional study. BMC Musculoskelet Disord. (2023) 24:157. doi: 10.1186/s12891-023-06264-6
28. Blair HC, Kalyvioti E, Papachristou NI, Tourkova IL, Syggelos SA, Deligianni D, et al. Apolipoprotein A-1 regulates osteoblast and lipoblast precursor cells in mice. Lab Invest. (2016) 96:763–72. doi: 10.1038/labinvest.2016.51
29. Mei Y, Zhao Z, Lyu Y, Li Y. Circulating growth differentiation factor 15 levels and apolipoprotein B to apolipoprotein A1 ratio in coronary artery disease patients with type 2 diabetes mellitus. Lipids Health Dis. (2022) 21:59. doi: 10.1186/s12944-022-01667-1
30. Parks JS, Chung S, Shelness GS. Hepatic ABC transporters and triglyceride metabolism. Curr Opin Lipidol. (2012) 23:196–200. doi: 10.1097/MOL.0b013e328352dd1a
31. Li J, Wang W, Han L, Feng M, Lu H, Yang L, et al. Human apolipoprotein A-I exerts a prophylactic effect on high-fat diet-induced atherosclerosis via inflammation inhibition in a rabbit model. Acta Biochim Biophys Sin (Shanghai). (2017) 49:149–58. doi: 10.1093/abbs/gmw128
32. Garza-Lombó C, Schroder A, Reyes-Reyes EM, Franco R. mTOR/AMPK signaling in the brain: Cell metabolism, proteostasis and survival. Curr Opin Toxicol. (2018) 8:102–10. doi: 10.1016/j.cotox.2018.05.002
33. Faaborg-Andersen CC, Liu C, Subramaniyam V, Desai SR, Sun YV, Wilson PWF, et al. U-shaped relationship between apolipoprotein A1 levels and mortality risk in men and women. Eur J Prev Cardiol. (2023) 30:293–304. doi: 10.1093/eurjpc/zwac263
34. Liang N, Yuan X, Zhang L, Shen X, Zhong S, Li L, et al. Fatty acid oxidation-induced HIF-1α activation facilitates hepatic urate synthesis through upregulating NT5C2 and XDH. Life Metabolism 3(5). (2024). doi: 10.1093/lifemeta/loae018
35. Bhale AS, Venkataraman K. Leveraging knowledge of HDLs major protein ApoA1: Structure, function, mutations, and potential therapeutics. BioMed Pharmacother. (2022) 154:113634. doi: 10.1016/j.biopha.2022.113634
36. Pereira MLL, da Costa MDR, d. A. Viana G, Magalhaes EP, Duque BR, da Silva ME, et al. Article- human and animal health correlation of apolipoprotein a-i with renal function in diabetic patients. Braz Arch Biol Technol. (2024) 67. doi: 10.1590/1678-4324-2024230487
37. Yiu JHC, Chan KS, Cheung J, Li J, Liu Y, Wang Y, et al. Gut microbiota-associated activation of TLR5 induces apolipoprotein A1 production in the liver. Circ Res. (2020) 127:1236–52. doi: 10.1161/circresaha.120.317362
Keywords: apolipoprotein A1, uric acid, osteoporotic fractures, U-shaped relationship, uric acid trough
Citation: Lin G-J, Guo S-H, Liang J-Q, Gong Y-Q, Jin J, Li C and Lu K (2025) U-Shaped association between apolipoprotein A1 and serum uric acid levels in patients with osteoporotic fractures: a cross-sectional study. Front. Endocrinol. 16:1540879. doi: 10.3389/fendo.2025.1540879
Received: 06 December 2024; Accepted: 24 March 2025;
Published: 22 April 2025.
Edited by:
Nan Jiang, Southern Medical University, ChinaReviewed by:
Fataneh Esmaeili, Tehran University of Medical Sciences, IranSanjeev Nirala, The People’s Hospital of Gaozhou, China
Copyright © 2025 Lin, Guo, Liang, Gong, Jin, Li and Lu. This is an open-access article distributed under the terms of the Creative Commons Attribution License (CC BY). The use, distribution or reproduction in other forums is permitted, provided the original author(s) and the copyright owner(s) are credited and that the original publication in this journal is cited, in accordance with accepted academic practice. No use, distribution or reproduction is permitted which does not comply with these terms.
*Correspondence: Chong Li, bGljaG9uZzE3MDVAMTYzLmNvbQ==; Ke Lu, c2d1ODQzNEBzaW5hLmNvbQ==
†These authors have contributed equally to this work and share first authorship
‡ORCID: Guo-Ji Lin, orcid.org/0009-0003-0422-0692
Shao-Han Guo, orcid.org/0009-0003-6894-2926
Jia-Qi Liang, orcid.org/0009-0001-2223-6773
Ya-Qin Gong, orcid.org/0000-0001-8695-4048
Jian Jin, orcid.org/0009-0009-4300-884X
Chong Li, orcid.org/0000-0002-1526-221X
Ke Lu, orcid.org/0000-0002-0029-7874