 Ying Wu
 Rui Xv1
 Guoxi Jin
- 1The Department of Endocrinology, The First Affiliated Hospital of Bengbu Medical University, Bengbu, Anhui, China
- 2The Department of Endocrinology, The Second Affiliated Hospital of Bengbu Medical University, Bengbu, Anhui, China
- 3The National Metabolic Management Center, The First Affiliated Hospital of Bengbu Medical University, Bengbu, Anhui, China
Aim: To analyze the correlation between preoperative time-in-range (TIR) levels and postoperative infection in patients with type 2 diabetes mellitus (T2DM) and to evaluate the value of the TIR as a predictor of postoperative infection in patients with T2DM.
Methods: A total of 656 patients with T2DM during the perioperative period were divided into a TIR standard group (TIR≥70%) and a TIR nonstandard group (TIR<70%) according to the TIR value. Modified Poisson regression was used to analyze postoperative risk factors in patients with T2DM. All patients were subsequently divided into a training set and a validation set at a ratio of 7:3. LASSO regression and the Boruta algorithm were used to screen out the predictive factors related to postoperative infection in T2DM patients in the training set. The discrimination and calibration of the model were evaluated by the area under the receiver operating characteristic curve (ROC) and calibration curve, and the clinical net benefit of the model was evaluated and verified through the decision analysis (DCA) curve. Finally, a forest plot was used for relevant subgroup analysis.
Results: Modified Poisson regression analysis revealed that the TIR was a risk factor for postoperative infection in T2DM patients, and when the TIR was <70%, the risk of postoperative infection increased by 52.2% (P <0.05). LASSO regression and Boruta algorithm screening variables revealed that the TIR, lymphocytes, neutrophils, total serum cholesterol, superoxide dismutase and type of incision were predictive factors for postoperative infection in patients with T2DM (P<0.05). The calibration curve confirmed that the model predictions were consistent with reality, and the decision curve confirmed that the model had better clinical benefits. Finally, the results of the subgroup analysis revealed that in each subgroup, the risk of postoperative infection was greater when the TIR was <70% than when the TIR was ≥70%, and there was no interaction between subgroups.
Conclusion: The TIR is related to postoperative infection and can be used as a new indicator to predict the risk of postoperative infection in patients with type 2 diabetes mellitus.
1 Introduction
Diabetes is a common disease in perioperative patients, and nearly half of patients with type 2 diabetes mellitus (T2DM) require surgery in their lifetime (1). Studies have shown that adverse events such as surgical site infection, secondary surgical intervention, and death are more common in diabetic patients than in nondiabetic patients (2) and that good perioperative blood glucose control can reduce the occurrence of these adverse events (3). Glycated hemoglobin (HbA1c), a standard blood glucose control measure, reflects the blood glucose level in the past 2–3 months, but it cannot reflect real-time blood glucose changes and is easily affected by factors such as hemoglobin and pregnancy (4). The pain caused by frequent fingertip blood glucose measurements reduces patient compliance. In recent years, with the rise of continuous glucose monitoring (CGM) instruments, CGM has been widely used in clinical practice and has successfully solved the above problems. The time-in-range (TIR), a derived index of CGM, has been widely used to evaluate the level of glycemic control (5). TIR generally refers to the time or percentage of glucose within the target range (usually 3.9~10.0 mmol/L) within 24 hours.
As a clinical tool that can predict the risk of outcome, prediction models have been mostly mentioned in recent years for postoperative infections in cancer or nondiabetic patients. However, infection, a common postoperative complication in diabetic patients, has received little attention. During clinical practice, we found that T2DM patients with higher TIR levels had fewer postoperative infections. For further verification, we designed this study to explore the relationship between preoperative TIR levels and postoperative infections in patients with perioperative T2DM. Moreover, whether the TIR can be used as a new indicator to predict the risk of postoperative infection in patients with T2DM is unknown.
2 Research population and research methods
We included 806 patients with type 2 diabetes in the perioperative period from September 1, 2022, to July 31, 2024, at the First Affiliated Hospital of Bengbu Medical University, all of whom met the criteria for the diagnosis and classification of Guideline for the Prevention and Treatment of Type 2 Diabetes Mellitus in China (2020 edition) (6). After admission, the patients uniformly donned a CGM (product model: FreeStyle Libre; manufacturer: Abbott Diabetes Care UK) to monitor blood glucose, and a professional in-hospital blood glucose management team conducted blood glucose control on the basis of blood glucose conditions. During the observation period, there were 23 cases of abnormal damage and detachment of CGM probes, 68 cases of inflammation indicators were not recorded after surgery, 31 cases were transferred to the intensive care unit (ICU) ward after surgery, 22 cases changed the treatment plan without surgery, and 6 cases died. The final number of enrolled patients was 656. According to International Consensus on Use of Continuous Glucose Monitoring (7) and the International Consensus on Time in Range (8), the TIR of adults with type 1 or type 2 diabetes individuals should be greater than 70%. And Richard et al. have previously confirmed the recommendation of using TIR 70% as the baseline target in their study on the risk of adverse events associated with TIR in T2DM patients, and when TIR>70%, severe hypoglycemia and microvascular events are lower (9). Therefore, we chose TIR 70% as the cutoff point, and divided enrolled patients into two groups, TIR≥70% and TIR<70% as exposure factors, and postoperative infection during hospitalization as the research outcome. In addition, all patients were divided into training sets and validation sets at a ratio of 7:3 for analysis of the prediction model (Figure 1). The general information and relevant laboratory test data of all enrolled patients were collected. This study was approved by the Research Ethics Committee of the First Affiliated Hospital of Bengbu Medical University (approval number: 2022088).
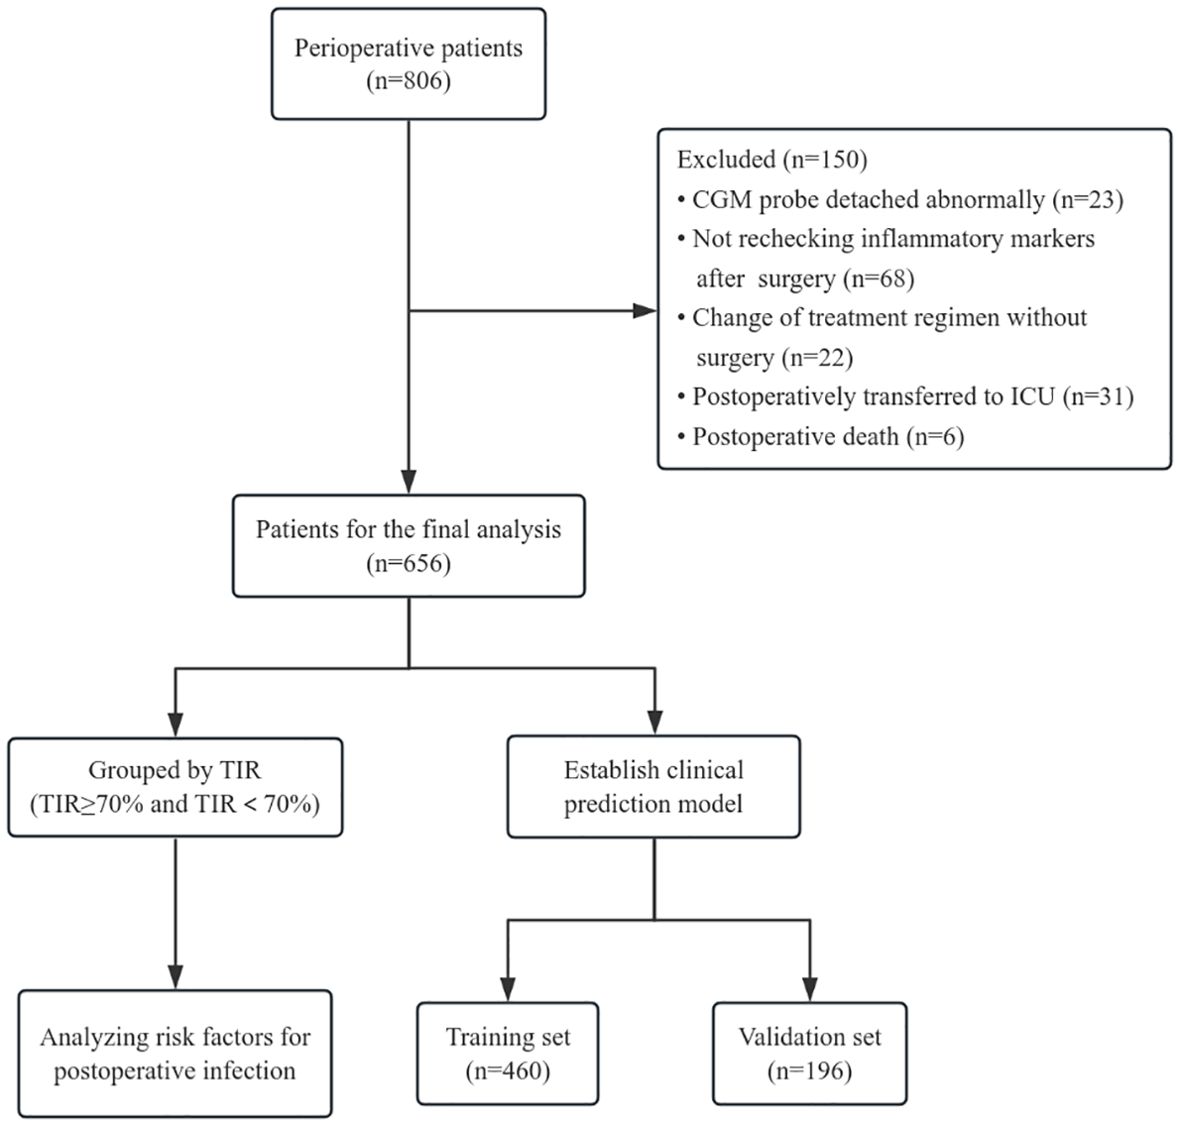
Figure 1. Diagram of the steps.
2.1 Inclusion and discharge standards
The inclusion criteria were as follows: 1. Age ≥ 18 years old; 2. Patients with type 2 diabetes in the perioperative period who were wearing CGM for ≥ 3 days before surgery; 3. No antibiotics were used within one week before admission or before surgery, and preoperative white blood cell, neutrophil and C-reactive protein levels were within the normal range;
Exclusion criteria: 1. Patients who were infected or used antibacterial drugs before surgery; 2. Severely abnormal liver and kidney function, abnormal coagulation function, a severe lack of granulocytes and circulatory dysfunction; 3. An incision was made during the suppurative and acute inflammatory stages.
2.2 Clinical data collection
Basic patient information, including sex, age, duration of diabetes, previous medication, smoking history, drinking history, height, weight, body mass index (BMI), systolic blood pressure (SBP), and diastolic blood pressure (DBP), was collected upon admission. On admission, inflammatory indicators related to white blood cells (WBC), neutrophils (NEU), lymphocytes (LYM), C-reactive protein (CRP), alanine aminotransferase (ALT), aspartate aminotransferase (AST), total bilirubin (TB), albumin (ALB), creatinine (Cr), total serum cholesterol (TC), triglyceride (TG), high-density lipoprotein (HDL), low-density lipoprotein (LDL) and other related biochemical indicators were measured. Surgical data related to surgical methods, surgical grades and types of incisions were obtained. The CGM data were scanned and uploaded through the Gplus blood glucose management system to form a blood glucose map, and the time in range (TIR), time above range (TAR), time below range (TBR), coefficient of variation of blood glucose (CV), blood glucose standard deviation (SD), and mean amplitude of glycemic excursions (MAGE) were recorded. The average TIR of the patient 72 hours before surgery was calculated. According to the Surgical Site Infection Guidelines promulgated by the American College of Surgeons and the Infection Society in 2016 (10) and The China Perioperative Infection Prevention and Management Guidelines promulgated by China in 2023 (11), any of the following postoperative conditions are defined as postoperative infection: 1. Wound infection, including a) purulent drainage, b) positive bacterial culture results at the wound site, c) secondary human-induced opening of the incision, and d) a diagnosis of infection by a clinician; 2. Systemic infection: severe sepsis or sepsis (caused by wounds) or bacterial growth according to blood culture results; 3. White blood cell, neutrophil, and C-reactive protein indicators are all higher than the normal range. The following formula was used to calculate the serum composite index: (1) triglyceride-glucose (TyG) index = ln [fasting triglyceride (mg/dl) × fasting blood glucose (mg/dl)/2]; (2) high-stress blood glucose ratio (SHR) = fasting admission blood glucose (mg/dl)/[28.7×glycated hemoglobin (%)-46.7]; and (3) triglyceride/HDL ratio (THR) = fasting triglyceride (mmol/L)/HDL (mmol/L).
2.3 Statistical analysis
The data were statistically analyzed via SPSS software (version 26.0; SPSS Inc., Chicago, IL, USA). Normally distributed variables are expressed as the means ± standard deviations and were analyzed via t tests. Nonnormally distributed measurement data are expressed as the medians and interquartile range [M(Q1,Q2)] and were analyzed via the Mann–Whitney U test. Count data are expressed as the number of cases or percentages and were analyzed via the chi-square test. Modified Poisson regression was used to analyze the risk factors for postoperative infection in patients with T2DM, and the results are expressed as RR values. R4.3.3 software (http://www.r-project.org) and Python 3.12.0 software (http://www.python.org) were used, and the LASSO regression and Boruta algorithms were used to screen the relevant factors of postoperative infection in the training set. The intersection of the two was taken as the predictive factor, and a column chart was drawn. The area under the receiver operating characteristic (ROC) curve and calibration curve were used to evaluate the discrimination and calibration of the model, and decision curve analysis (DCA) was used to evaluate the clinical net benefit of the model and verify it. Logistic regression was used to analyze the risk ratio of postoperative infection in T2DM patients with TIR≥70% and TIR<70% in different subgroups, and a forest plot was drawn. P<0.05 indicated that the difference was statistically significant.
3 Results
3.1 Basic characteristics of the two groups: TIR≥70% and TIR<70%
As shown in Table 1, there were 281 patients in the TIR≥70% group and 375 patients in the TIR<70% group. The proportion of female patients, diabetes duration and postoperative infection rate in the TIR<70% group were significantly greater than those in the TIR≥70% group (P<0.05). The BMI, CHE, TBA, ALB, and THR of patients in the TIR≥70% group were significantly greater than those in the TIR<70% group (P<0.05). The levels of GGT, DB, and HDL in patients in the TIR≥70% group were significantly lower than those in patients in the TIR<70% group (P<0.05). The TAR, CV, SD, and MAGE of patients in the TIR≥70% group were significantly lower than those in the TIR<70% group (P<0.001). There was no significant difference in the other indicators between the two groups (P>0.05).
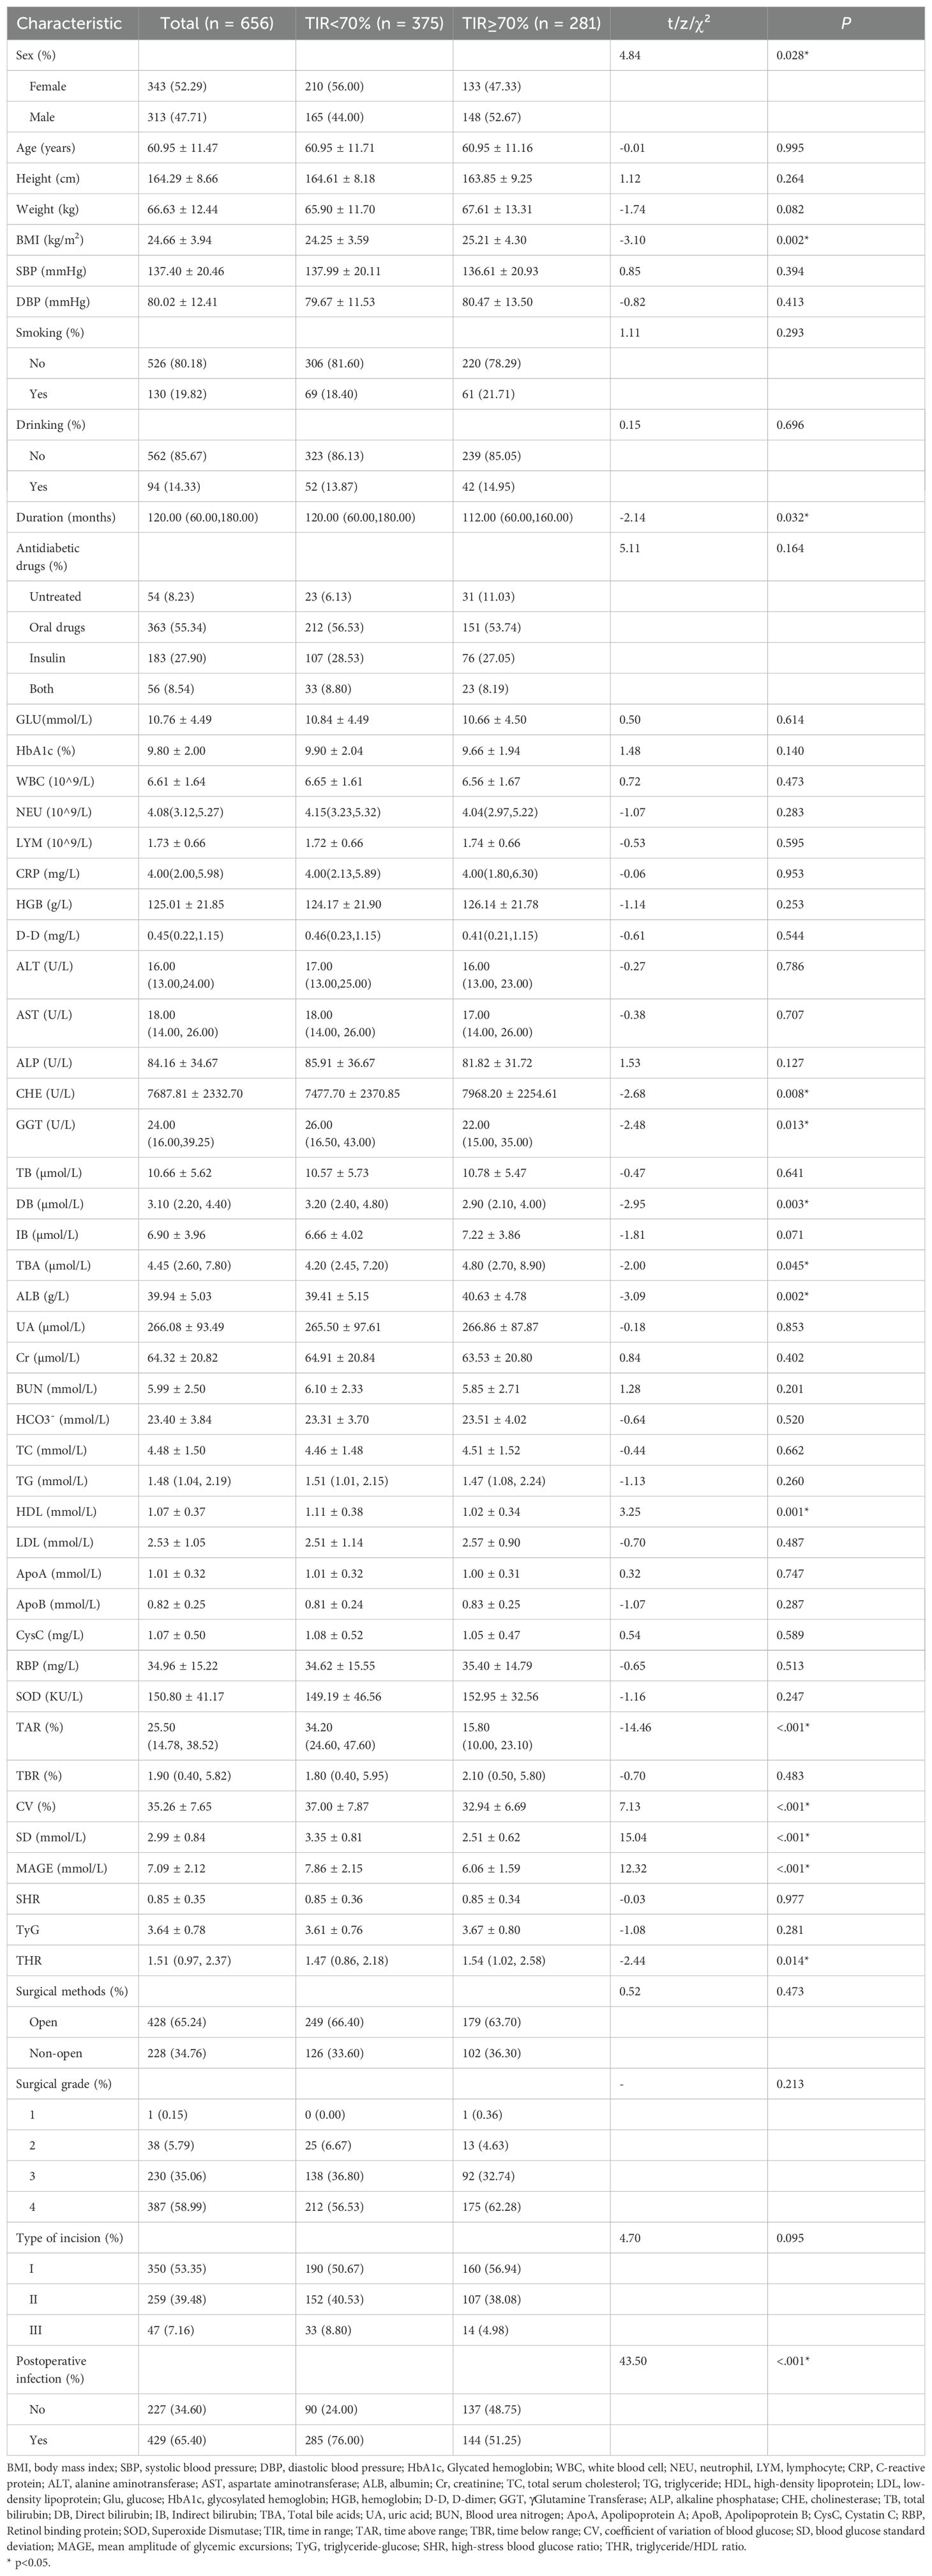
Table 1. Baseline comparison of clinical data between two groups of people.
3.2 Modified poison regression analysis of related risk factors
To identify the risk factors related to postoperative infection in patients with T2DM, we used whether postoperative infection occurred as the dependent variable and other factors as independent variables through modified Poisson regression analysis. As shown in Table 2, sex, surgical grade, type of incision, TIR, SBP, ALT, ALP, GGT, IB, CysC, RBP, SD, and MAGE are risk factors for postoperative infection in T2DM patients. The risk of postoperative infection increased by 52.2% when the TIR was <70% compared when the TIR was ≥70% (p<0.001).
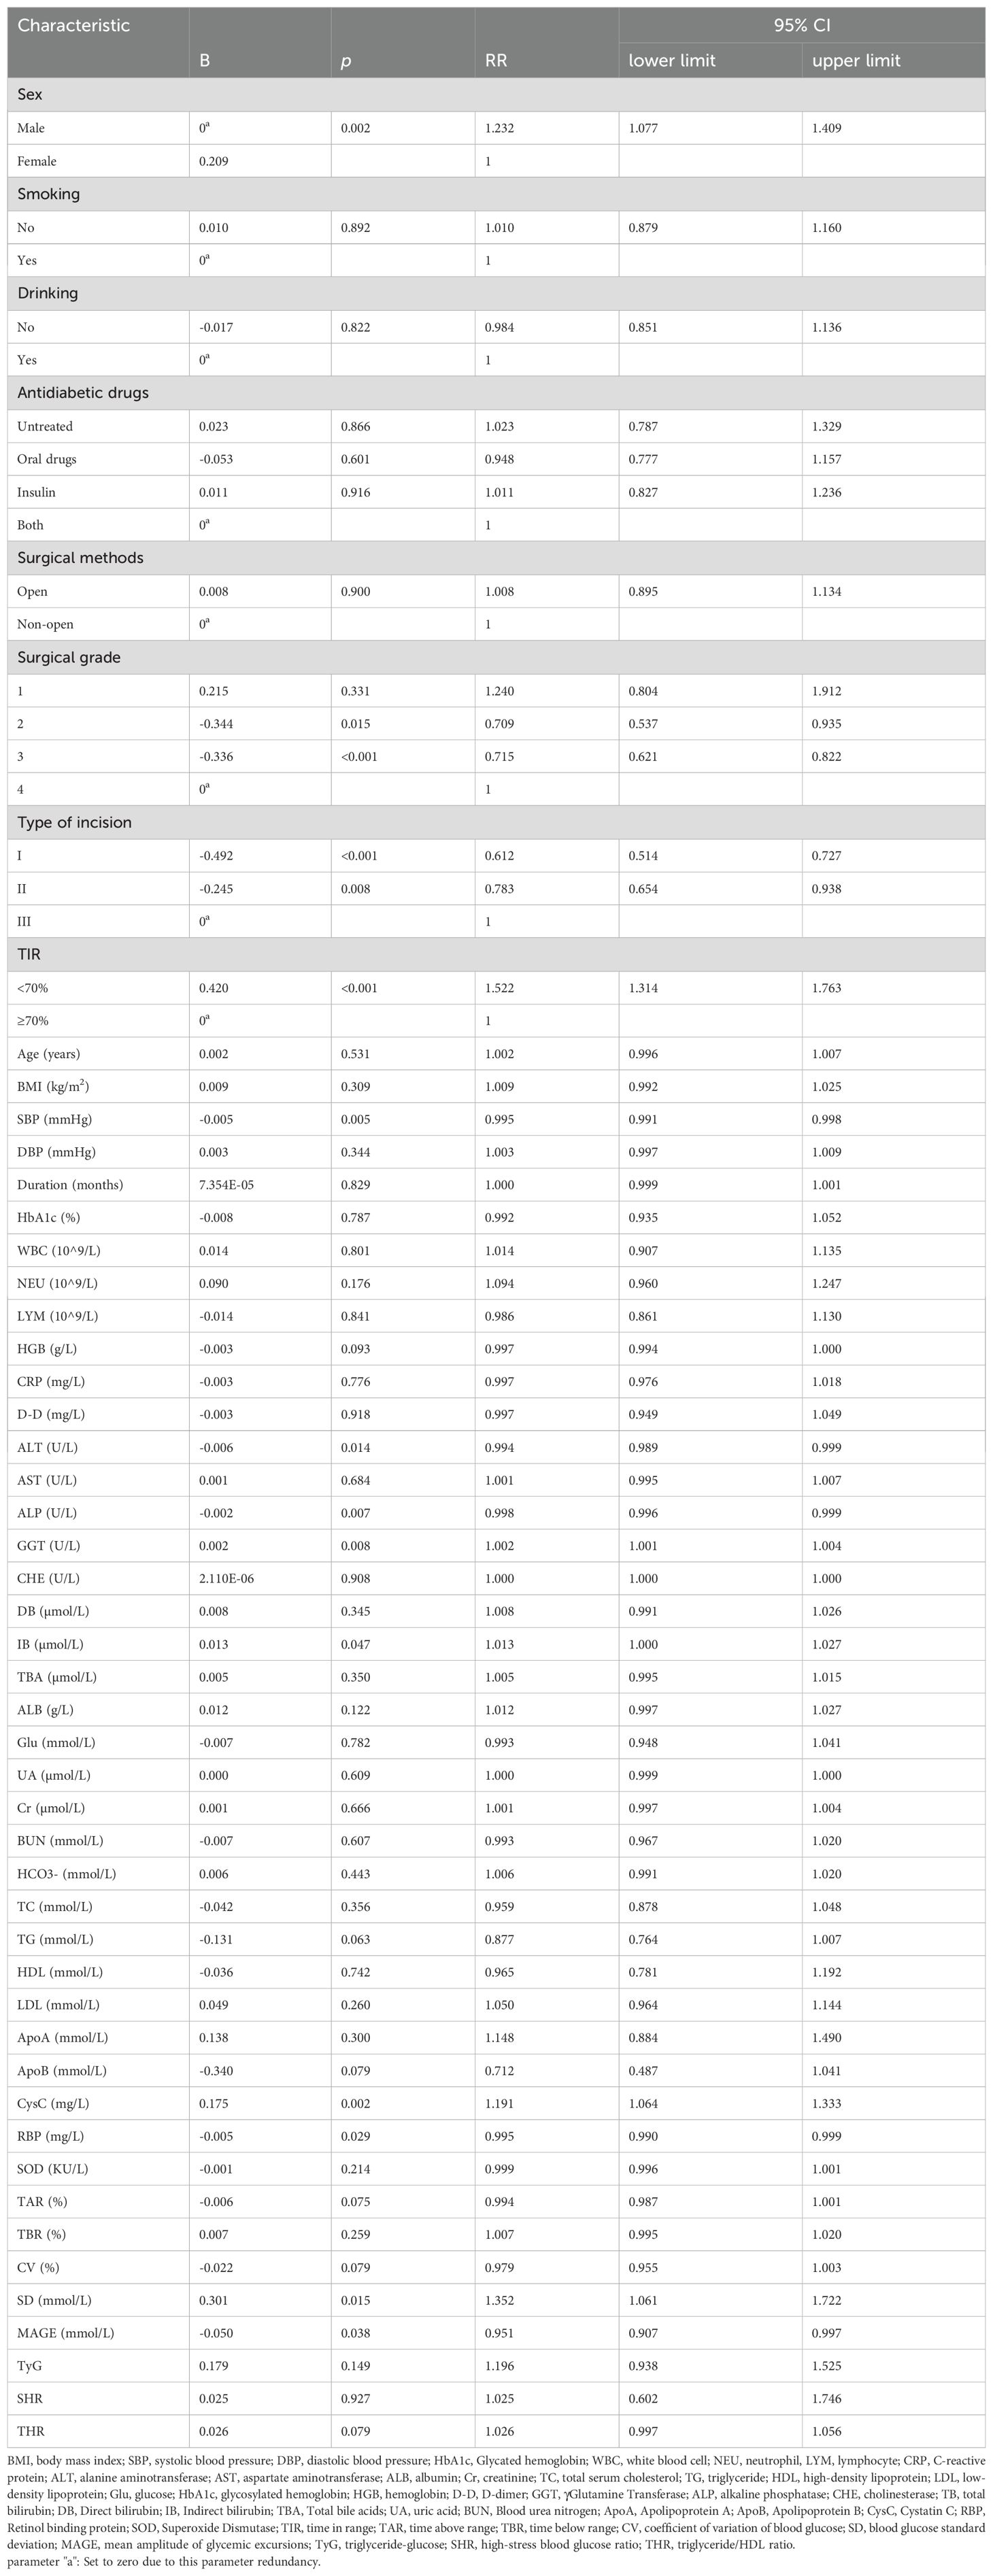
Table 2. Analysis of risk factors by modified Poisson regression.
3.3 Basic characteristics of the training set and validation set
To further clarify whether the TIR is a predictive factor for postoperative infection in patients with T2DM, we constructed a clinical prediction model. First, all enrolled patients were divided into a training set and a validation set at a ratio of 7:3. The results revealed that there was no significant difference in the basic characteristics of the two groups (Table 3).
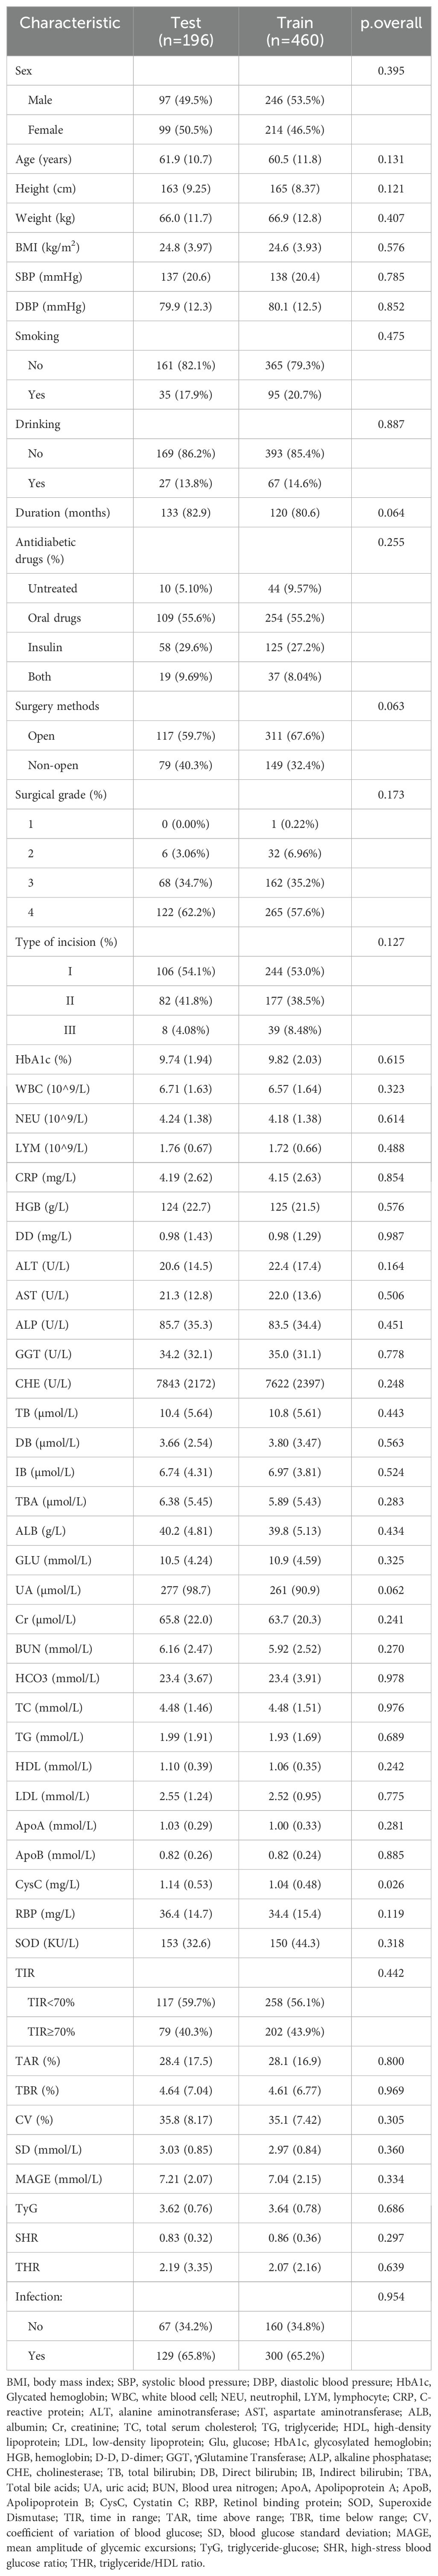
Table 3. Comparison of baseline features between training group and validation group.
3.4 Using LASSO regression and the Boruta algorithm to screen predictive model variables in the training set
LASSO regression, as a compressed estimation method, achieves variable selection and complexity adjustment by developing an optimization objective function that includes penalty terms (12). In this study, LASSO regression was used to identify feature factors and when λ=0.04524, 8 indicators, including sex, TIR, NEU, LYM, TC, SOD, surgical grade, and type of incision, were selected as feature variables (Figure 2A) and cross validated (Figure 2B). The Boruta algorithm is a feature selection and packaging algorithm based on random forests that evaluates the importance of features by generating “shadow variables” corresponding to each original variable in the dataset (13). The variables strictly related to postoperative infection selected by the Boruta algorithm are LYM, TC, CHE, NEU, SOD, TIR, WBC, TyG, MAGE, SD and type of incision (Figure 2C). By comparing and analyzing the screening results of the LASSO regression and Boruta algorithms, we decided to use a common subset of feature variables selected by the two methods, namely, TIR, LYM, NEU, TC, SOD, and the type of incision (Figure 2D), and ultimately used these six selected feature variables for model construction.
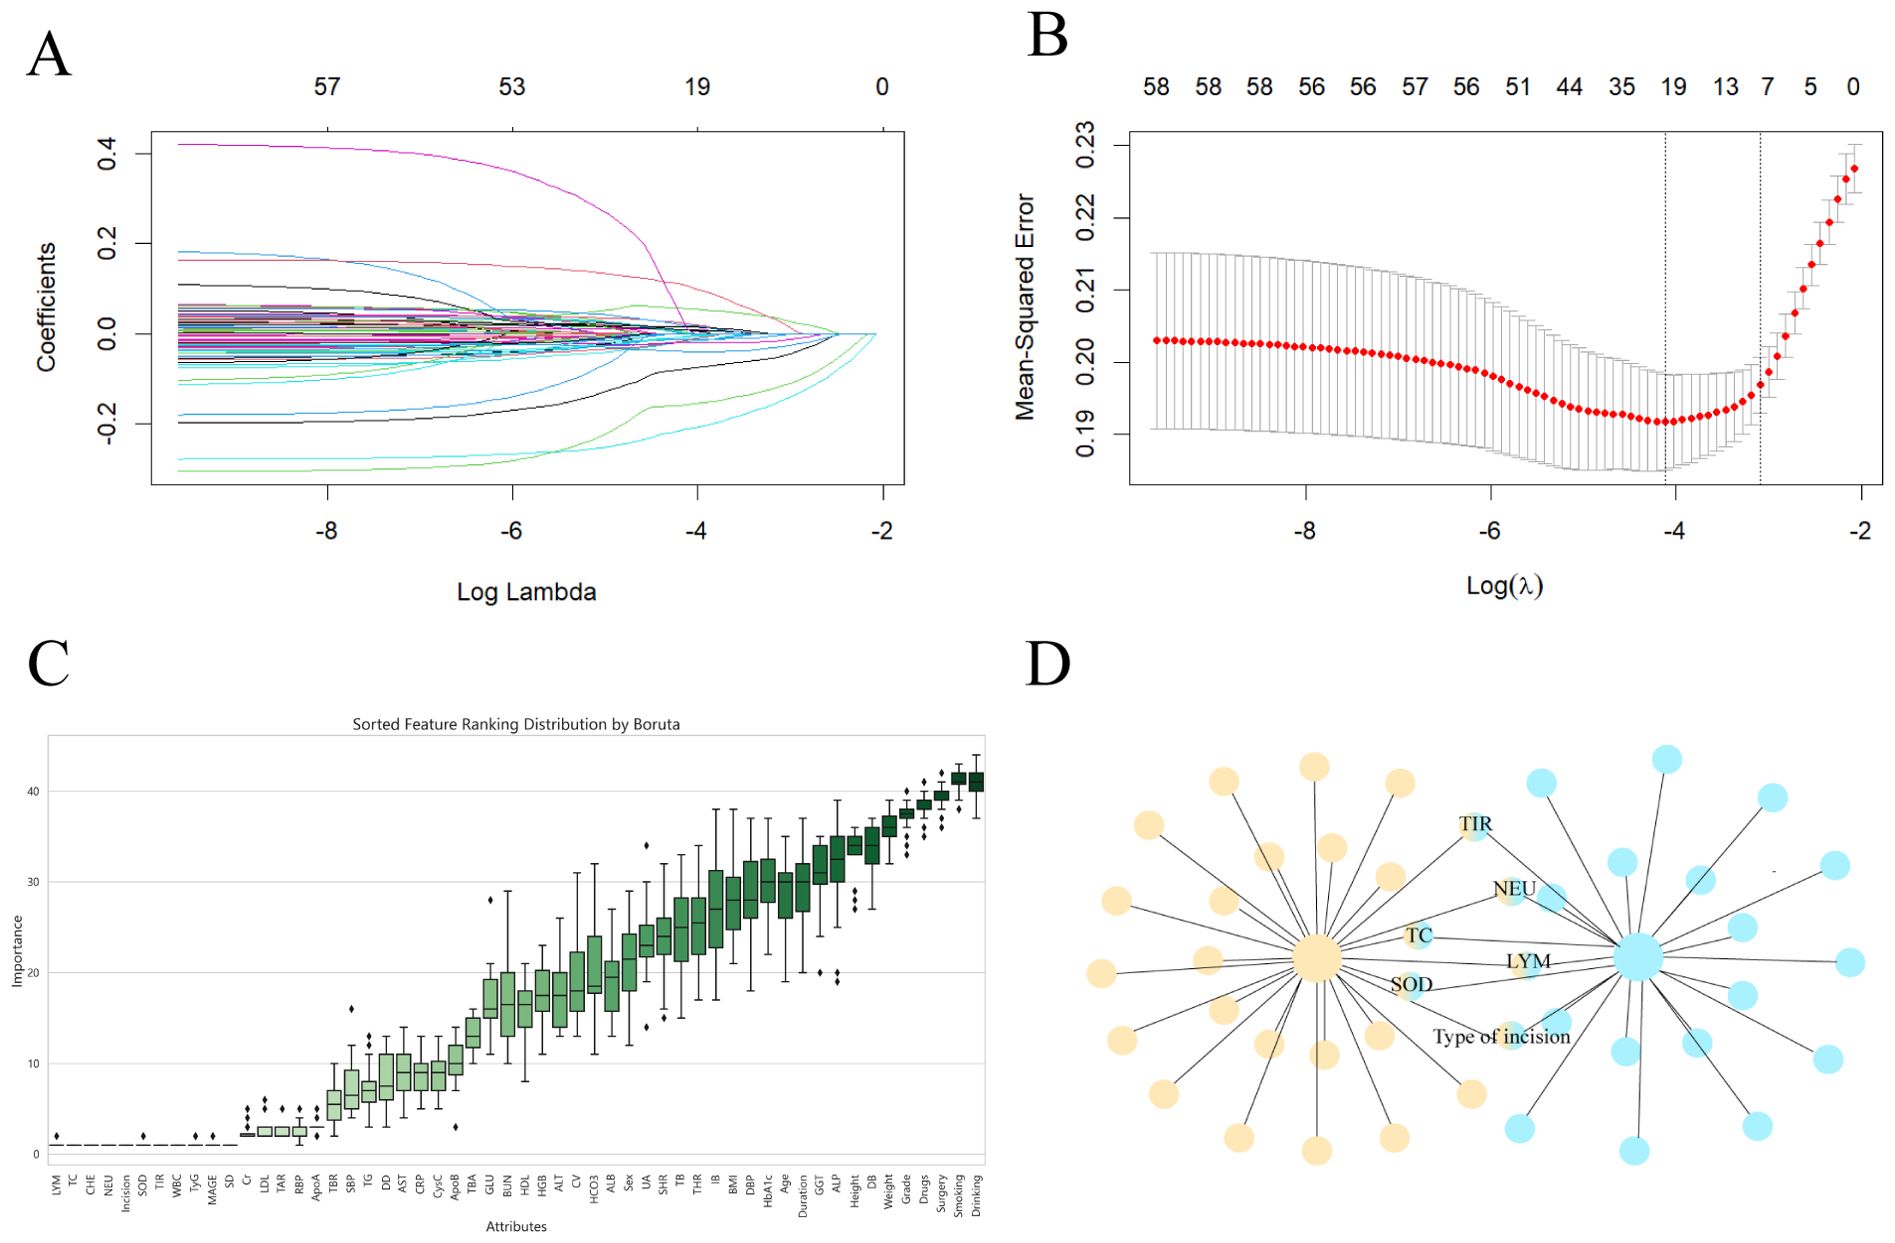
Figure 2. Screen predictive model variables in the training set. (A) LASSO regression pathway. Variable selection using LASSO logistic regression yields coefficient profiles for 56 variables. As the penalty coefficient λ increases, the coefficients of more and more variables are compressed until they are compressed to 0. (B) Cross-validation of LASSO regression. The best penalty coefficient lambda was selected using a twentyfold cross-validation and minimization criterion. The graph has log(lambda) in the horizontal coordinate, binomial deviance in the vertical coordinate, and vertical dashed lines plotted against one standard error criterion. Eight variables with nonzero coefficients were selected by optimal lambda. (C) Boruta. Identify the actual set of features by accurately estimating the importance of each feature. (D) The common subset of LASSO regression and Boruta.
3.5 Establishing a nomogram model
We used the six characteristic variables (TIR, LYM, NEU, TC, SOD and type of incision) screened as predictors, established a nomogram, added the scores corresponding to each indicator level, and intuitively assessed the postoperative infection risk of patients with type 2 diabetes through the total score (Figure 3).
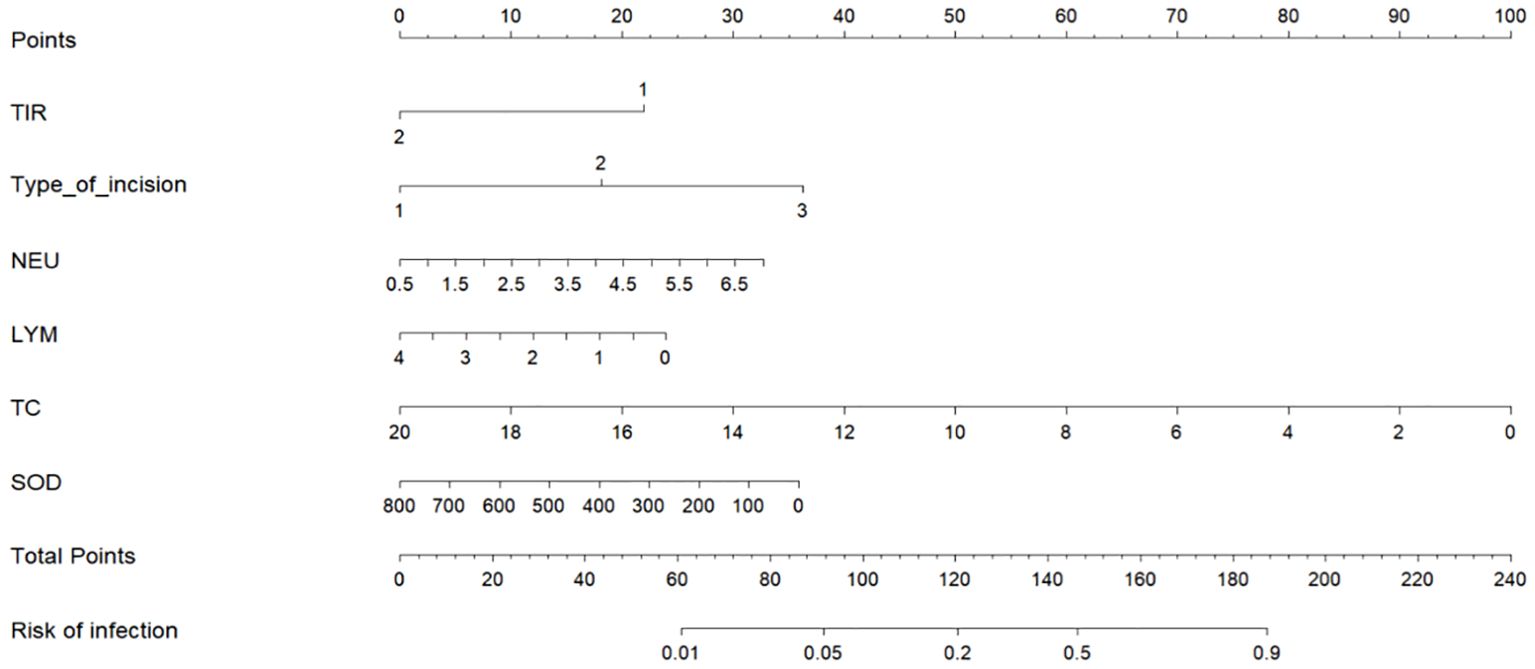
Figure 3. Nomogram of postoperative infection prediction model. The corresponding values of each variable are scored, and the total score is then obtained by summing the scores of all variables, and a vertical line plotted downward from the total score can be labeled to indicate the estimated probability of postoperative infection occurring in a patient with T2DM. TIR: 1: TIR<70% 2: TIR≥70%. Type of incision: 1: Type I incision 2: Type II incision 3: Type III incision.
3.6 Validation of the nomogram for predicting postoperative infection risk in T2DM patients
ROC curve evaluation of predictive model performance revealed that the AUC of this predictive model was 0.765 (95% CI=0.721~0.809), and the predictive values of the individual predictive factors in this model were as follows: TIR and the type of incision predict the risk of postoperative infection in T2DM patients as 0.638 and 0.636, respectively, which are greater than those of TC (AUC=0.611), NEU (AUC=0.608), SOD (AUC=0.603), and LYM (AUC=0.597) (Figure 4A). Compared with a single predictive factor, the predictive value of using this model to predict postoperative infection risk in T2DM patients was greater. The area under the ROC curve of the validation set was 0.754 (95% CI=0.682–0.826), indicating good consistency between the training set and validation set (Figure 4B).
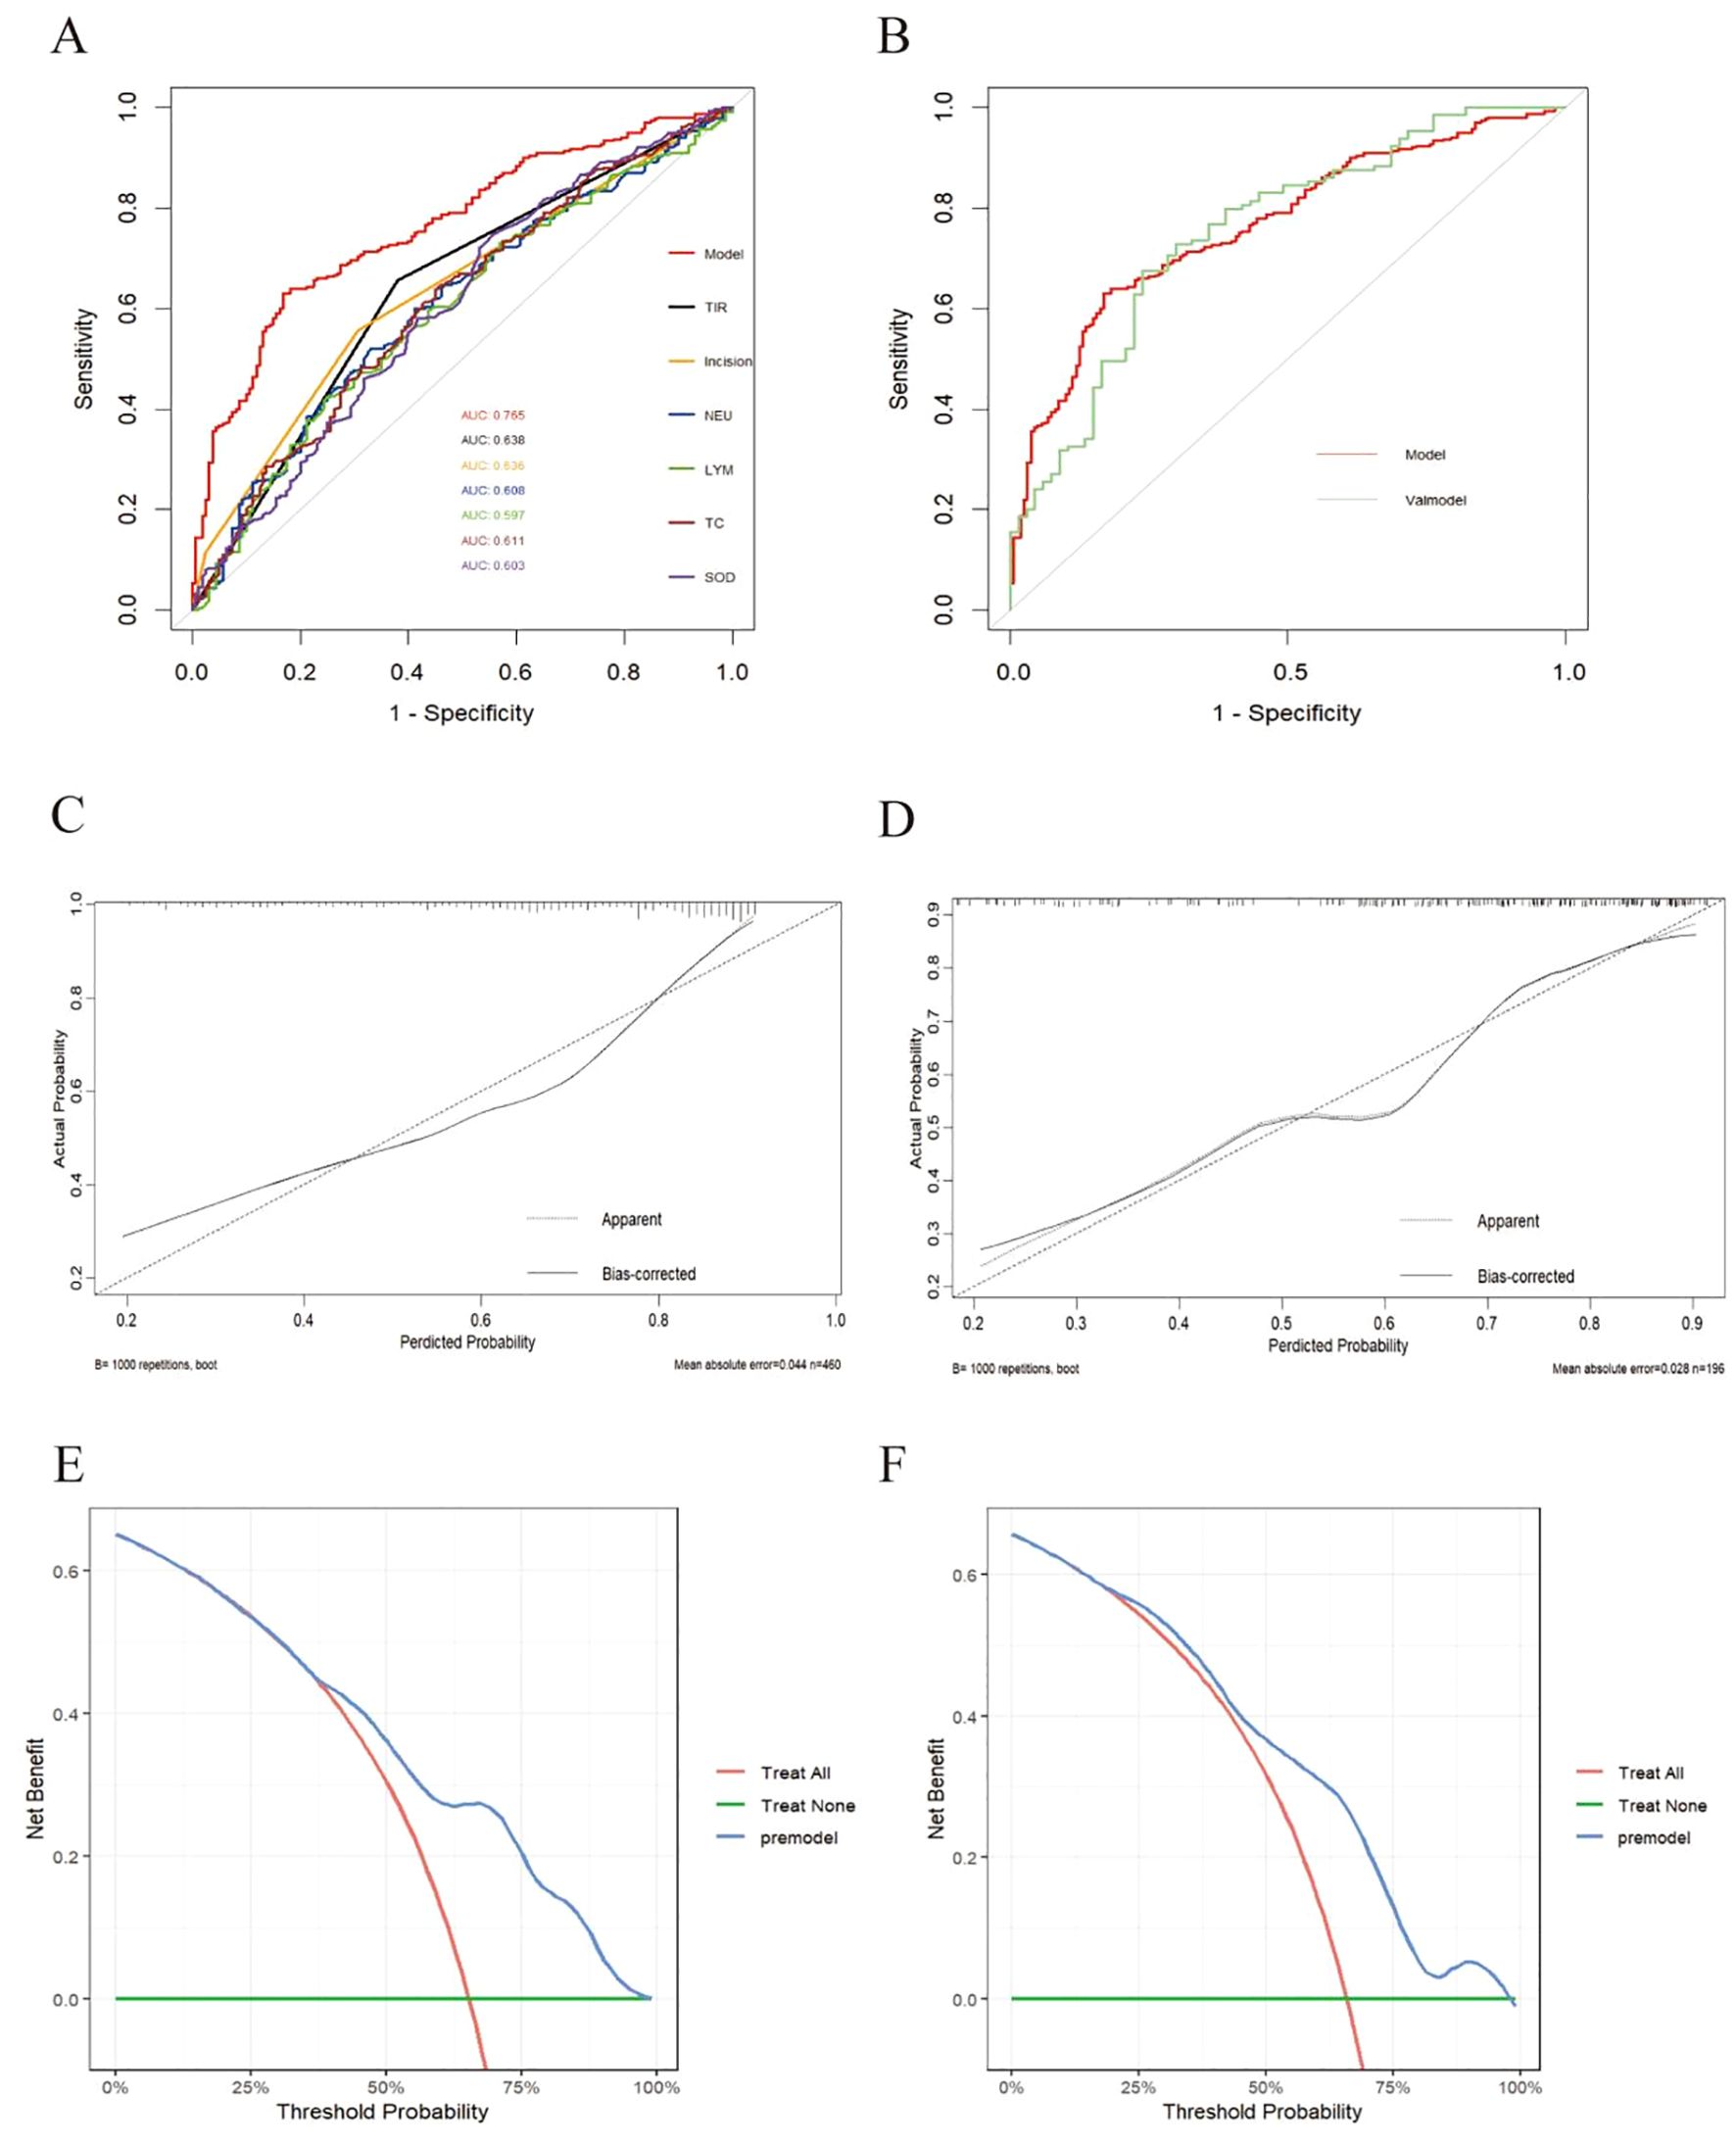
Figure 4. Validation of the nomogram. (A) Training set model and ROC curves of various indicators. (B) Comparison of ROC curves between training set (model) and validation set. (C) Calibration curve of the postoperative infection prediction model in the training set. The x-axis represents the predicted probability of the model. The y- axis represents the actual probability of occurrence. The diagonal dotted line represents a perfect prediction by an ideal model. The solid line represents the model curve calibrated by 1000 bootstrap resampling methods, a closer fit to the diagonal dotted line represents a better prediction. (D) Calibration curve of the postoperative infection prediction model in the testing set. (E) DCA curve of the postoperative infection prediction model in the training set. The x-axis in the figure represents the threshold probability, the y-axis represents the net benefit rate. The horizontal green solid line indicates that all patients did not receive clinical intervention, the red diagonal line indicates that all patients received clinical intervention, and the blue curve represents the net benefit rate of the prediction model. (F) DCA curve of the postoperative infection prediction model in the testing set.
Calibration performance evaluation: As shown in Figures 4C, D, the prediction results of the model in the training set and validation set were relatively close to the actual situation.
DCA: As shown in the decision curve of the training set (Figure 4E), when the threshold probability was between 0.38 and 0.95, the net benefit provided by the model was significantly greater than that of the baseline decision. In the test set (Figure 4F), the model also showed good net gain, especially in the threshold probability range of 0.200.95, indicating that the model maintained a high level of net gain.
3.7 Subgroup forest plot results
To further verify that the TIR is robust among subgroups as a predictor of postoperative infection in T2DM patients, we conducted subgroup analysis, and the results are shown in Figure 5: sex, smoking status, alcohol consumption, BMI, surgical method, surgical grade, type of incision, TyG, SHR, and THR for subgroup analysis. The forest plot shows that when the TIR<70%, the proportion of postoperative infections was greater among different subgroups than when the TIR≥70%, and there was no significant interaction between the TIR and each subgroup(p for interaction>0.05).
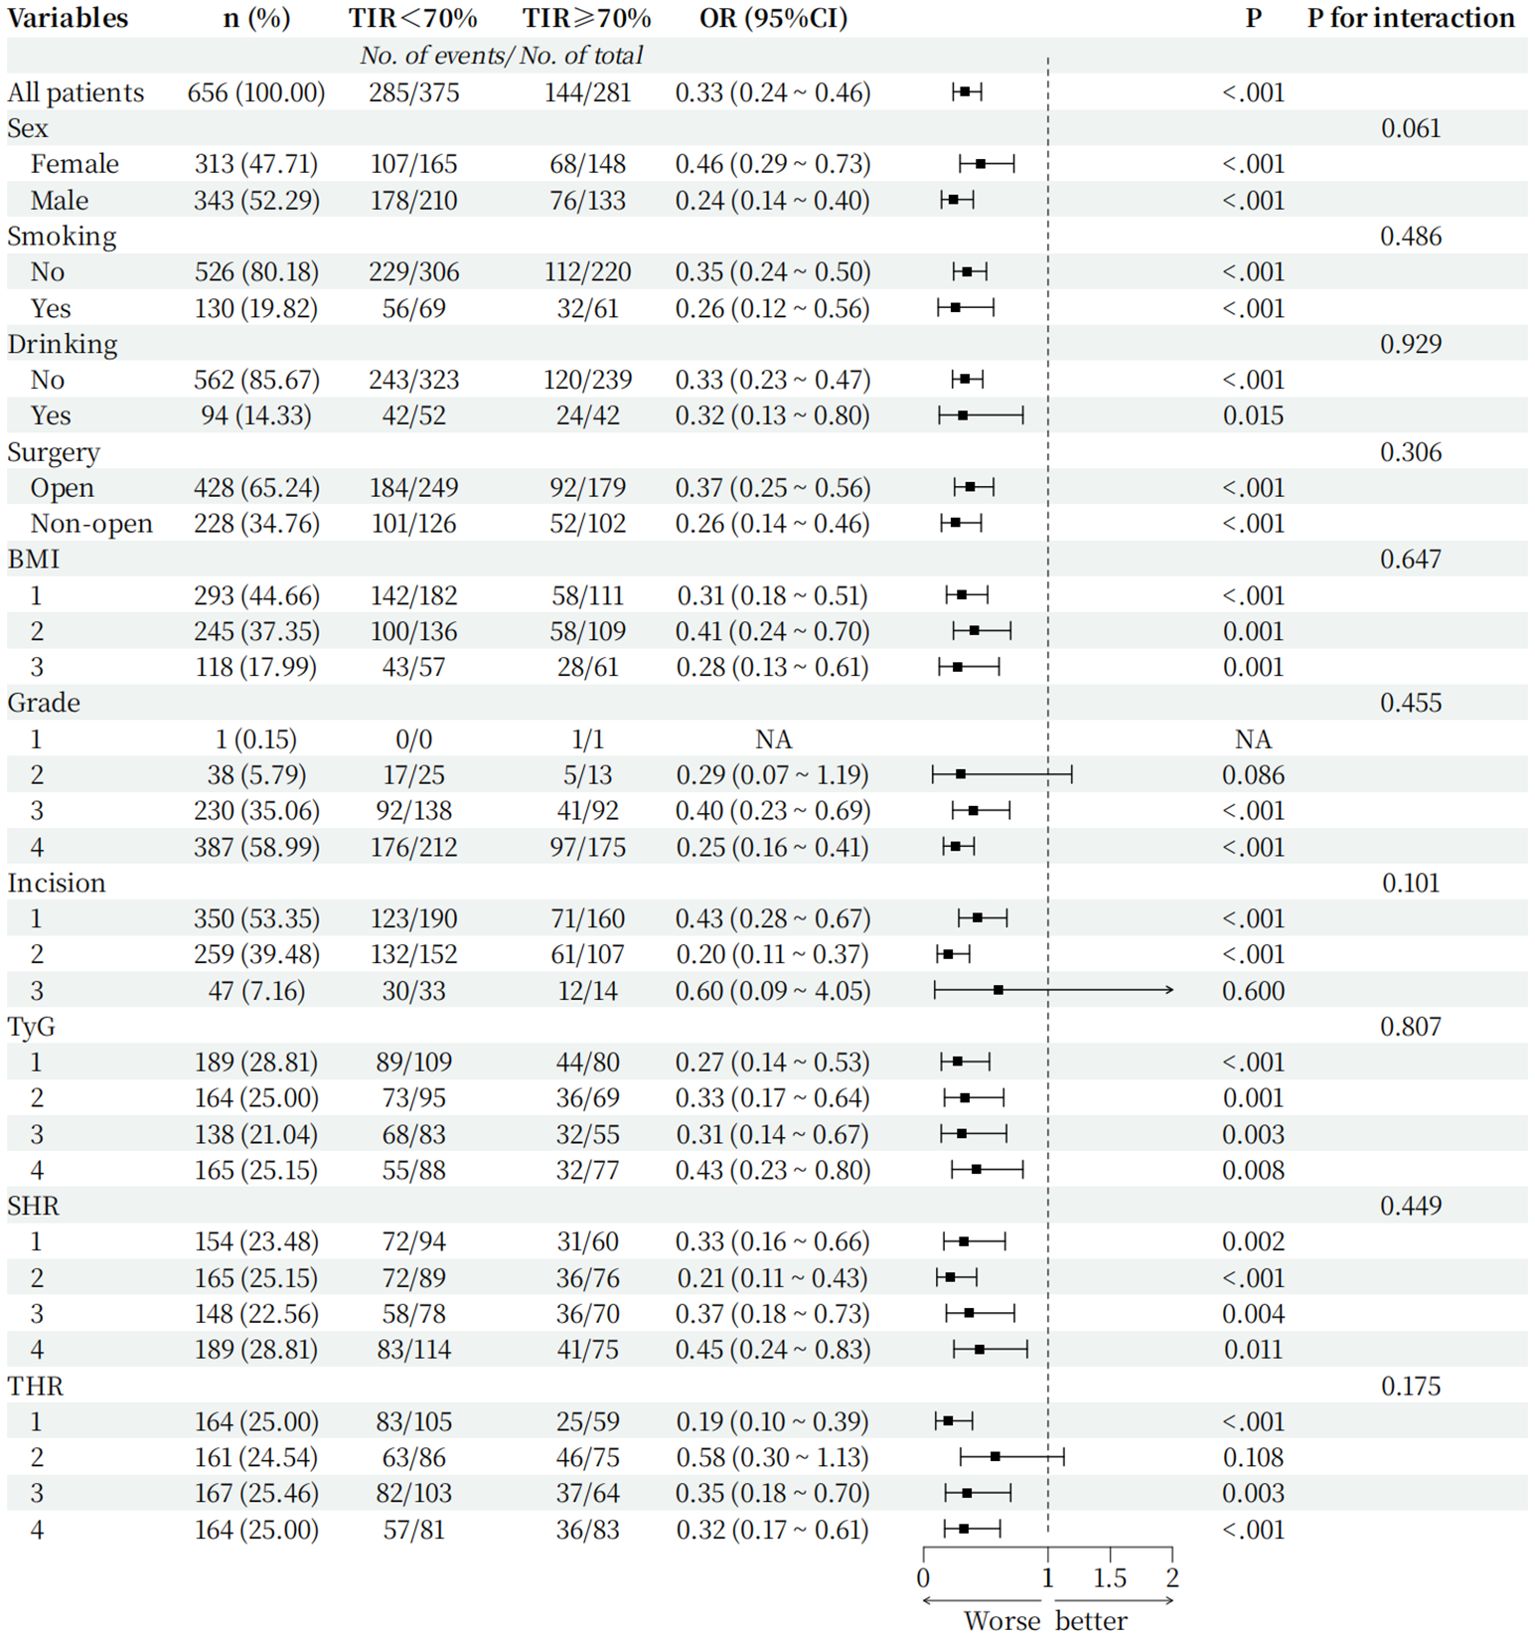
Figure 5. Hazard ratio for the primary outcome in prespecified subgroups. Incision grouping: 1: Type I incision 2: Type II incision 3: Type III incision; BMI grouping (Grouped by range criteria): 1: BMI<24 kg/m2 2: 24kg/m2≤BMI<28 kg/m2 3: BMI≥28 kg/m2; TyG grouping(Grouped by quartile): 1: TyG ≤ 3.20 2: 3.20<TyG ≤ 3.67 3: 3.67<TyG ≤ 4.07 4: TyG>4.07; SHR grouping(Grouped by quartile): 1: SHR ≤ 0.60 2: 0.60<SHR ≤ 0.80 3: 0.80<SHR ≤ 1.00 4: SHR>1.00; THR grouping (Grouped by quartile): 1: THR ≤ 0.97 2: 0.97<THR ≤ 1.50 3: 1.50<THR ≤ 2.37 4: THR>2.37.
4 Discussion
As of 2021, the International Diabetes Federation (IDF) estimates that the global population with diabetes has reached 537 million, accounting for 10.5% of the global population; by 2030, the prevalence of diabetes is expected to increase to 643 million (11.3%) (14). As the diabetic population continues to increase, the number of diabetic patients requiring surgical intervention will also increase. Studies have confirmed (15, 16) that poor blood glucose control is an independent risk factor for postoperative infections in various surgical operations. Postoperative infections often lead to a series of problems, such as poor wound healing, prolonged hospitalization, increased medical expenses, and even increased patient risk of death. The World Health Organization proposed that intensive perioperative hypoglycemia should be implemented in diabetic patients to reduce the risk of postoperative infection. However, patients undergoing strict blood glucose control may experience severe hypoglycemia, and the optimal blood glucose control range is still controversial (17). Therefore, finding a perioperative glucose-lowering target to reduce postoperative infections is crucial. CGM is a continuous blood glucose monitoring technology that changes the blood glucose monitoring method from blood to interstitial fluid and integrates and divides all monitored blood glucose values into TIR, TAR and TBR. TIR has become a popular choice for clinicians and patients because it can more intuitively express blood glucose control levels.
The modified Poisson model is a statistical method that can calculate the relative risk on the basis of robust error variance, which is more accurate than the commonly used logistic regression results. According to the International Consensus on Time in Range (8), we recommended a TIR of 70% as the cutoff point to study perioperative T2DM patients. Through modified Poisson regression analysis, we found that the TIR is a risk factor for postoperative infection in T2DM patients, and when the TIR is <70%, the risk of postoperative infection in T2DM patients increases by 52.2%. Thus, for perioperative T2DM patients, poor preoperative TIR control leads to an increased risk of postoperative infection, and blood sugar should be strictly controlled before surgery.
HbA1c, which is used as a standard to evaluate blood sugar control levels, is often affected by multiple factors and fails to reflect blood sugar fluctuations, which are related to diabetic complications (18, 19). In 2017, Jourdan et al. reported that HbA1c was related to postoperative deep infection in T2DM patients who underwent total hip arthroplasty (TKA), but HbA1c could not be used as an independent risk factor for deep infection after TKA (20). In contrast to HbA1c, the TIR can better reflect recent blood sugar fluctuations in real time, and the TIR is better than HbA1c in terms of the operability of blood sugar monitoring and the prediction of diabetic complications (21). As one of the manifestations of blood glucose fluctuation amplitude, the higher the TIR value, the smaller the blood glucose fluctuation amplitude, indicating that the blood glucose is in a relatively stable state (22). When blood glucose fluctuations are too large, the antioxidant capacity of the cells themselves decreases, which may aggravate cellular oxidative stress, leading to damage to endothelial cell function and the induction of inflammatory reactions (23). Experimental studies have shown that prolonged hyperglycemia or excessive fluctuations in blood sugar can reduce the immune function of cells at the site of infection (24). Liu et al., in their study on postoperative infection after lumbar fusion in patients with T2DM, reported that the amplitude of preoperative blood glucose fluctuations was closely related to postoperative infection and could be used as an independent risk predictor of postoperative infection after this surgery (25). TIR is negatively correlated with the amplitude of blood glucose fluctuations. We can use CGM to monitor blood sugar and increase the percentage of TIR to reduce the amplitude of blood glucose fluctuations (26), thereby reducing the risk of postoperative infection. This is consistent with the fact that strict control of blood sugar can reduce the risk of postoperative infection. This finding is consistent with the view of postinfection risk (27).
Although the TIR is an influencing factor for postoperative infection in T2DM patients, can the TIR be used to predict the risk of postoperative infection in T2DM patients? To this end, we established a clinical prediction model that can identify potential correlations between preoperative indicators and postoperative infection outcomes, allowing clinicians to make more accurate predictions of the risk of postoperative infection in T2DM patients so that relevant measures can be taken in a timely manner to reduce this risk. In this study, we used two algorithms to screen variables, among which Lasso regression stands out in data analysis and collinearity processing through automatic variable selection and sparse modeling, while Boruta algorithm performs more outstandingly in nonlinear relationships, with strong stability and can directly provide feature importance ranking and classification results. To eliminate the collinearity of the model, we used the dual method of LASSO regression and the Boruta algorithm to determine the accuracy of the feature variables and the stability of the prediction model (28). Finally, both LASSO regression and the Boruta algorithm revealed that the TIR was included in the clinical prediction model as a characteristic variable of postoperative infection in T2DM patients. To increase the readability of the model and help clinicians obtain relevant risk probabilities through simple calculations, we presented all characteristic variables in the form of nomograms.
In the clinical prediction model, in addition to TIR, we included NEU, LYM, TC, SOD and surgery type. HbA1c was not included in part because anemia and hypoalbuminemia affect the accuracy of HbA1c in some patients with tumors or pregnant caesarean sections, and the inability of HbA1c to respond to blood sugar fluctuations in a timely manner is also a major drawback. WBC, NEU, LYM, and CRP are commonly used inflammatory markers in clinical practice, and are more easily obtained from routine examinations compared to inflammatory factors such as tumor necrosis factor or interleukin. But studies have shown that CRP has a weak correlation with metabolic diseases and is easily affected by HDL (29). WBCs have poor sensitivity and specificity, and NEU is at the forefront of the body’s defense against pathogenic invasion and can first reach the site of inflammation when infection occurs (30). LYM plays a core role in the body’s immune response and can respond to viral infections in a timely manner. Therefore, jointly incorporating NEU and the LYM into the prediction model is better than incorporating a single WBC indicator. TC is the major steroidal compound in mammals and may trigger inflammatory cascades when regulating intracellular and intracellular homeostasis (31). Morimoto et al. also confirmed in a study on total serum cholesterol and postoperative internal infections of the gastrointestinal tract (32) that there was a reverse-J-type correlation between total serum cholesterol and postoperative internal infections, which may be due to the ability of circulating cholesterol rich lipoproteins and triglyceride rich lipoproteins to bind and detoxify bacterial lipopolysaccharides. Thus, TC was used as a reliable predictor of postoperative infection. SOD is an antioxidant metalloenzyme that exists in organisms. It plays a vital role in oxidative stress in the body and is inseparable from infection. It is associated with early death in acute pancreatitis and stroke infection (33, 34). In a mouse experiment by Christina et al. (35), SOD also showed a protective effect during lung infection. This is consistent with the fact that, in this study, the risk of postoperative infection gradually increased as SOD levels decreased. The results are consistent. The Centers for Disease Control and Prevention classify surgical incisions into 4 categories: Type I/clean incision, Type II/clean-contaminated incision, Type III/contaminated incision, and Type IV/infected incision (36). Studies have shown that the type of surgical incision is related to postoperative infection (10). Our study also revealed that, as the level of incision type increases, the risk of postoperative infection increases, which suggests that we can take corresponding preventive measures according to the different types of postoperative incisions used in T2DM patients.
In this study, we also conducted a series of subgroup analyses, and the results suggested that the TIR is robust among subgroups and is an independent prognostic factor for postoperative infection in patients with T2DM. Notably, this study retained some Class III incisions that met the inclusion criteria. Subgroup analysis revealed that, when the surgical incision type was a Class III incision, even if the TIR was ≥70%, more people would develop postoperative infections. This finding suggests that when the postoperative incision is contaminated, although preoperative blood sugar control is acceptable, the risk of postoperative infection is still high. We should take relevant preventive measures in a timely manner after surgery to reduce the risk of postoperative infection.
In recent years, composite indicators such as TyG, SHR, and THR have been shown to be related to the risk of cardiovascular and cerebrovascular diseases, sepsis, and postoperative gastrointestinal infections (37–39). Therefore, this study also included these new indicators. The composite indicators were analyzed, but the results suggested that these indicators were not related to postoperative infection in patients with T2DM. This may be because these indicators are strongly related to single-disciplinary surgeries, and there were many types of surgeries in our study that were not limited to gastrointestinal surgery, tract surgery or cardiac surgery and therefore were not suitable for this study.
5 Conclusion
In conclusion, our study shows that the TIR is not only a risk factor for postoperative infection in patients with perioperative T2DM but also has good predictive value for postoperative infection. When the preoperative TIR is lower than 70%, TIR is less likely to cause postoperative infection in T2DM patients. The risk will be greatly increased. In most previous studies, prediction models have been used only to predict diabetic complications or surgical outcomes, and few studies have investigated postoperative infection in patients with T2DM. This model is more helpful for clinicians to evaluate conditions on the basis of individual patient conditions, reduce the occurrence of postoperative infections and shorten the length of hospitalization. However, this study also has shortcomings. This was a single-center study that lacked external verification, only observed the occurrence of infections during hospitalization, and cannot be used to evaluate the situation after discharge. Therefore, the next step is to evaluate the long-term predictive value of the model after surgery, and the accuracy of the model will be further tested through external validation.
Data availability statement
The original contributions presented in the study are included in the article/Supplementary Material. Further inquiries can be directed to the corresponding author.
Ethics statement
The studies involving humans were approved by the Clinical Technology Application Ethics Committee of the First Affiliated Hospital of Bengbu Medical University. The studies were conducted in accordance with the local legislation and institutional requirements. Written informed consent for participation was not required from the participants or the participants’ legal guardians/next of kin in accordance with the national legislation and institutional requirements.
Author contributions
YW: Data curation, Investigation, Resources, Software, Writing – original draft. RX: Data curation, Formal analysis, Software, Writing – original draft. QC: Data curation, Investigation, Validation, Writing – original draft. RZ: Data curation, Formal analysis, Resources, Writing – original draft. ML: Investigation, Methodology, Validation, Writing – original draft. CS: Supervision, Writing – review & editing. GJ: Conceptualization, Supervision, Writing – review & editing. XH: Conceptualization, Funding acquisition, Project administration, Supervision, Writing – review & editing.
Funding
The author(s) declare that financial support was received for the research and/or publication of this article. This study was supported by the Natural Science Foundation of Anhui Province(No. 2208085MH216) and the Scientific Research Program of Anhui Provincial Health Commission (No. AHWJ2023BAc10028).
Acknowledgments
The authors thank the Blood Glucose Precision Management Center, the First Affiliated Hospital of Bengbu Medical University for providing a platform for the authors’ work and the participants and caregivers for their participation.
Conflict of interest
The authors declare that the research was conducted in the absence of any commercial or financial relationships that could be construed as a potential conflict of interest.
Generative AI statement
The author(s) declare that no Generative AI was used in the creation of this manuscript.
Publisher’s note
All claims expressed in this article are solely those of the authors and do not necessarily represent those of their affiliated organizations, or those of the publisher, the editors and the reviewers. Any product that may be evaluated in this article, or claim that may be made by its manufacturer, is not guaranteed or endorsed by the publisher.
Supplementary material
The Supplementary Material for this article can be found online at: https://www.frontiersin.org/articles/10.3389/fendo.2025.1539039/full#supplementary-material
References
1. Drayton DJ, Birch RJ, D’Souza-Ferrer C, Ayres M, Howell SJ, Ajjan RA. Diabetes mellitus and perioperative outcomes: a scoping review of the literature. Br J Anaesth. (2022) 128:817–28. doi: 10.1016/j.bja.2022.02.013
2. Lung BE, Bisogno M, Kanjiya S, Komatsu DE, Wang ED. Early postoperative complications and discharge time in diabetic patients undergoing total shoulder arthroplasty. J Orthop Surg Res. (2019) 14:9. doi: 10.1186/s13018-018-1051-3
3. Chen X, Wu M, Hu Q, Cheng X. Incidence and risk factors for poor perioperative blood glucose management in patients with diabetic foot: a retrospective study. Ann Palliat Med. (2021) 10:12300–9. doi: 10.21037/apm-21-3095
4. Lima R, Fernandes DR, Garcia R, Carvalho L, Silveira R, Teixeira C. Correlation between time on target and glycated hemoglobin in people with diabetes mellitus: systematic review. Rev Lat Am Enfermagem. (2023) 31:e4088. doi: 10.1590/1518-8345.6655.4088
5. Advani A. Positioning time in range in diabetes management. Diabetologia. (2020) 63:242–52. doi: 10.1007/s00125-019-05027-0
6. Chinese Diabetes Society. Guideline for the prevention and treatment of type 2 diabetes mellitus in China (2020 edition). Chin J Diabetes Mellitus. (2021) 13:315–409. doi: 10.19538/j.nk2021080106doi: 10.19538/j.nk2021080106
7. Danne T, Nimri R, Battelino T, Bergenstal RM, Close KL, DeVries JH, et al. International consensus on use of continuous glucose monitoring. Diabetes Care. (2017) 40:1631–40. doi: 10.2337/dc17-1600
8. Battelino T, Danne T, Bergenstal RM, Amiel SA, Beck R, Biester T, et al. Clinical targets for continuous glucose monitoring data interpretation: recommendations from the international consensus on time in range. Diabetes Care. (2019) 42:1593–603. doi: 10.2337/dci19-0028
9. Bergenstal RM, Hachmann-Nielsen E, Kvist K, Peters AL, Tarp JM, Buse JB. Increased derived time in range is associated with reduced risk of major adverse cardiovascular events, severe hypoglycemia, and microvascular events in type 2 diabetes: A post hoc analysis of DEVOTE. Diabetes Technol Ther. (2023) 25:378–83. doi: 10.1089/dia.2022.0447
10. Ban KA, Minei JP, Laronga C, Harbrecht BG, Jensen EH, Fry DE, et al. American college of surgeons and surgical infection society: surgical site infection guidelines, 2016 update. J Am Coll Surg. (2017) 224:59–74. doi: 10.1016/j.jamcollsurg.2016.10.029
11. Wang Q, Cao M, Tao H, Fei Z, Huang X, Liang P, et al. Evidence-based guideline for the prevention and management of perioperative infection. J Evid Based Med. (2023) 16:50–67. doi: 10.1111/jebm.12514
12. Mullah M, Hanley JA, Benedetti A. LASSO type penalized spline regression for binary data. BMC Med Res Methodol. (2021) 21:83. doi: 10.1186/s12874-021-01234-9
13. Wang X, Ren J, Ren H, Song W, Qiao Y, Zhao Y, et al. Diabetes mellitus early warning and factor analysis using ensemble Bayesian networks with SMOTE-ENN and Boruta. Sci Rep. (2023) 13:12718. doi: 10.1038/s41598-023-40036-5
14. Hossain MJ, Al-Mamun M, Islam MR. Diabetes mellitus, the fastest growing global public health concern: Early detection should be focused. Health Sci Rep. (2024) 7:e2004. doi: 10.1002/hsr2.2004
15. Song J, Chu F, Zhou W, Huang Y. Efficacy of thoracoscopy combined with laparoscopy and esophagectomy and analysis of the risk factors for postoperative infection. Am J Transl Res. (2022) 14:355–63.
16. Xu Z, Qu H, Gong Z, Kanani G, Zhang F, Ren Y, et al. Risk factors for surgical site infection in patients undergoing colorectal surgery: A meta-analysis of observational studies. PloS One. (2021) 16:e0259107. doi: 10.1371/journal.pone.0259107
17. Allegranzi B, Zayed B, Bischoff P, Kubilay NZ, de Jonge S, de Vries F, et al. New WHO recommendations on intraoperative and postoperative measures for surgical site infection prevention: an evidence-based global perspective. Lancet Infect Dis. (2016) 16:e288–303. doi: 10.1016/S1473-3099(16)30402-9
18. Nyiraty S, Pesei F, Orosz A, Coluzzi S, Vági OE, Lengyel C, et al. Cardiovascular autonomic neuropathy and glucose variability in patients with type 1 diabetes: is there an association. Front Endocrinol (Lausanne). (2018) 9:174. doi: 10.3389/fendo.2018.00174
19. Monnier L, Colette C, Owens D. Glucose variability and diabetes complications: Risk factor or biomarker? Can we disentangle the “Gordian Knot. Diabetes Metab. (2021) 47:101225. doi: 10.1016/j.diabet.2021.101225
20. Cancienne JM, Werner BC, Browne JA. Is there an association between hemoglobin A1C and deep postoperative infection after TKA. Clin Orthop Relat Res. (2017) 475:1642–9. doi: 10.1007/s11999-017-5246-4
21. Saboo B, Kesavadev J, Shankar A, Krishna MB, Sheth S, Patel V, et al. Time-in-range as a target in type 2 diabetes: An urgent need. Heliyon. (2021) 7:e05967. doi: 10.1016/j.heliyon.2021.e05967
22. Rodbard D, Bailey T, Jovanovic L, Zisser H, Kaplan R, Garg SK. Improved quality of glycemic control and reduced glycemic variability with use of continuous glucose monitoring. Diabetes Technol Ther. (2009) 11:717–23. doi: 10.1089/dia.2009.0077
23. Ceriello A, Esposito K, Piconi L, Ihnat MA, Thorpe JE, Testa R, et al. Oscillating glucose is more deleterious to endothelial function and oxidative stress than mean glucose in normal and type 2 diabetic patients. Diabetes. (2008) 57:1349–54. doi: 10.2337/db08-0063
24. Mauriello CT, Hair PS, Rohn RD, Rister NS, Krishna NK, Cunnion KM. Hyperglycemia inhibits complement-mediated immunological control of S. aureus in a rat model of peritonitis. J Diabetes Res. (2014) 2014:762051. doi: 10.1155/2014/762051
25. Liu H, Zhang W, Hu Q, Liu L, Xie Z, Xu Y, et al. A nomogram for accurately predicting the surgical site infection following transforaminal lumbar interbody fusion in type 2 diabetes patients, based on glycemic variability. Int Wound J. (2023) 20:981–94. doi: 10.1111/iwj.13948
26. Manov AE, Chauhan S, Dhillon G, Dhaliwal A, Antonio S, Donepudi A, et al. The effectiveness of continuous glucose monitoring devices in managing uncontrolled diabetes mellitus: A retrospective study. Cureus. (2023) 15:e42545. doi: 10.7759/cureus.42545
27. Wang YY, Hu SF, Ying HM, Chen L, Li HL, Tian F, et al. Postoperative tight glycemic control significantly reduces postoperative infection rates in patients undergoing surgery: a meta-analysis. BMC Endocr Disord. (2018) 18:42. doi: 10.1186/s12902-018-0268-9
28. Yang F, Gao L, Wang Q, Gao W. Development and validation of nomograms to predict early death in non-small cell lung cancer patients with brain metastasis: a retrospective study in the SEER database. Transl Cancer Res. (2023) 12:473–89. doi: 10.21037/tcr-22-2323
29. Meng G, Zhu Q, Shao J, Zhang Q, Liu L, Wu H, et al. Comparing the diagnostic ability of inflammatory markers in metabolic syndrome. Clin Chim Acta. (2017) 475:1–6. doi: 10.1016/j.cca.2017.09.023
30. Rosales C. Neutrophils at the crossroads of innate and adaptive immunity. J Leukoc Biol. (2020) 108:377–96. doi: 10.1002/JLB.4MIR0220-574RR
31. Bauer R, Brüne B, Schmid T. Cholesterol metabolism in the regulation of inflammatory responses. Front Pharmacol. (2023) 14:1121819. doi: 10.3389/fphar.2023.1121819
32. Morimoto M, Nakamura Y, Yasuda Y, Lefor AT, Nagaie T, Sata N, et al. Serum total cholesterol levels would predict nosocomial infections after gastrointestinal surgery. Indian J Surg. (2015) 77:283–9. doi: 10.1007/s12262-015-1296-6
33. Zheng X, Li L, Zhu Y, Huang X, Zhang Y, Yu B, et al. Superoxide dismutase predicts persistent circulation failure and mortality in the early stage of acute pancreatitis. Dig Dis Sci. (2020) 65:3551–7. doi: 10.1007/s10620-020-06069-w
34. Lin SP, Tu C, Huang W, Wu Y, Lin PY, Ye S, et al. Acute-phase serum superoxide dismutase level as a predictive biomarker for stroke-associated infection. Int J Neurosci. (2020) 130:186–92. doi: 10.1080/00207454.2019.1667790
35. Sul C, Lewis C, Dee N, Burns N, Oshima K, Schmidt E, et al. Release of extracellular superoxide dismutase into alveolar fluid protects against acute lung injury and inflammation in Staphylococcus aureus pneumonia. Am J Physiol Lung Cell Mol Physiol. (2023) 324:L445–55. doi: 10.1152/ajplung.00217.2022
36. Solomkin JS, Mazuski J, Blanchard JC, Itani KMF, Ricks P, Dellinger EP, et al. Introduction to the centers for disease control and prevention and the healthcare infection control practices advisory committee guideline for the prevention of surgical site infections. Surg Infect (Larchmt). (2017) 18:385–93. doi: 10.1089/sur.2017.075
37. Huo Y, Sun M, Wang M, Wang T, Yu X, Wu D, et al. Triglyceride-glucose index-A novel metabolism disorder biomarker as a promising indicator for predicting postoperative 30-day infections in elderly patients undergoing gastrointestinal-related abdominal and pelvic surgery. Surgery. (2024) 176:1433–41. doi: 10.1016/j.surg.2024.07.034
38. Li L, Zhao M, Zhang ZX, Zhou L, Zhang ZH, Xiong Y, et al. Prognostic significance of the stress hyperglycemia ratio in critically ill patients. Cardiovasc Diabetol. (2023) 22:275. doi: 10.1186/s12933-023-02005-0
Keywords: type 2 diabetes, time in range, postoperative infection, risk factors, clinical prediction model
Citation: Wu Y, Xv R, Chen Q, Zhang R, Li M, Shao C, Jin G and Hu X (2025) Assessing the predictive value of time-in-range level for the risk of postoperative infection in patients with type 2 diabetes: a cohort study. Front. Endocrinol. 16:1539039. doi: 10.3389/fendo.2025.1539039
Received: 03 December 2024; Accepted: 27 March 2025;
Published: 15 April 2025.
Edited by:
Mithun Rudrapal, Vignan’s Foundation for Science, Technology and Research, IndiaReviewed by:
Samiksha Garse, DY Patil Deemed to be University, IndiaKratika Singh, Centre of Bio-Medical Research (CBMR), India
Copyright © 2025 Wu, Xv, Chen, Zhang, Li, Shao, Jin and Hu. This is an open-access article distributed under the terms of the Creative Commons Attribution License (CC BY). The use, distribution or reproduction in other forums is permitted, provided the original author(s) and the copyright owner(s) are credited and that the original publication in this journal is cited, in accordance with accepted academic practice. No use, distribution or reproduction is permitted which does not comply with these terms.
*Correspondence: Xiaolei Hu, Y2Flc2FyODBAMTYzLmNvbQ==