 Yu Wu
Yu Wu Chengsen Liu
 Jiandong Cao
95% of researchers rate our articles as excellent or good
Learn more about the work of our research integrity team to safeguard the quality of each article we publish.
Find out more
ORIGINAL RESEARCH article
Front. Endocrinol. , 31 January 2025
Sec. Clinical Diabetes
Volume 16 - 2025 | https://doi.org/10.3389/fendo.2025.1505808
Background: The association between triglyceride-glucose (TYG) and its composite obesity indexes and cardio-renal disease in the American population remains insufficiently researched.
Methods: This study examined a cohort of 11,491 American adults aged 20 years and older from the 2003-2018 National Health and Nutrition Examination Survey (NHANES). To explore the associations between TYG, TyG-Waist-to-Height Ratio (TyG-WHtR), TyG-Body Mass Index (TyG-BMI), TyG-Waist Circumference (TyG-WC), and chronic kidney disease (CKD), cardiovascular disease (CVD), and cardiorenal syndrome (CRS), we utilized weighted multivariate logistic regression, restricted cubic spline (RCS), Receiver operating characteristic (ROC), and subgroup analyses.
Results: Adjusted for confounding factors, there are positive associations between the likelihood of CKD, CVD, and CRS, as well as TYG and its composite obesity indexes. The TYG index was correlated most strongly with CKD (OR 1.42, 95% CI 1.11, 1.82; P = 0.007), while TyG-WHtR had the strongest correlations with CVD (OR 1.63, 95% CI 1.19, 2.22; P = 0.003) and CRS (OR 1.44, 95% CI 1.00, 2.08; P = 0.055). A nonlinear connection was found by RCS analysis between TYG and its composite obesity indexes with CKD (P for overall < 0.001, P for nonlinear < 0.05), while the association with CVD and CRS was predominantly linear (P for overall < 0.001, P for nonlinear > 0.05). Based on ROC curves, TyG-WHtR and TyG-WC emerged as more reliable diagnostic tools than TYG for cardiac and renal diseases. According to subgroup analyses, TyG and its composite obesity measurements were more strongly associated with CKD in younger individuals (≤ 50), males, and those with diabetes mellitus (P for interaction 0.05).
Conclusions: The TyG-WHtR and TyG-WC are associated with an increased risk of cardiac and renal disease, indicating enhanced diagnostic accuracy. These metrics provide an effective tool for identifying early cardiorenal disease and improving risk stratification.
Chronic Kidney Disease (CKD) and Cardiovascular Disease (CVD) are substantial factors contributing to the loss of healthy life expectancy and the high burden on healthcare systems. These are global public health challenges (1). There is a tight association between CKD and CVD, with CKD patients being at high risk for CVD, and CKD being a major cause of death among these patients (2). Cardiorenal syndrome (CRS) is a clinical condition characterized by complex interactions between the heart and kidneys. According to reports, Compared to the general population, CRS sufferers have a 10-30 times higher death rate (3, 4). Therefore, it is increasingly necessary for research to investigate the potential influencing variables and screening indicators of cardiorenal disease. This research may help in the timely detection and diagnosis of cardiorenal illness, ultimately lowering the risk of its occurrences.
Insulin resistance (IR) is a state in which the body is insensitive to the action of insulin, resulting in a decrease in insulin’s efficacy in promoting glucose uptake and utilization. As a result, the body adjusts by developing metabolic abnormalities such as hyperinsulinemia (5). IR is involved in the development of numerous metabolic illnesses (6), including cardiovascular disease (7), obesity (8), and metabolic syndrome (9). The Triglyceride-Glucose (TyG) index evaluates the body’s insulin sensitivity by computing the logarithmic product of TG and fasting glucose. It is regarded as a new and trustworthy predictor of IR (10, 11). Previous studies have shown a significant association between TyG index and chronic kidney disease and adverse cardiovascular events. For example, a cohort study from China found a nonlinear correlation between TyG index and CKD, suggesting that excessively high or low TyG index may lead to an increased risk of developing CDK (12). Similarly, a higher baseline TyG index was identified as a predictor of severity in coronary patients (13). Similar findings have been observed in other ethnically diverse countries. This validates the clinical utility of the index (14, 15). Obesity is widespread globally and is closely associated with a number of health hazards, leading to the onset and progression of chronic diseases such as heart and kidney disease (16, 17). Several studies indicate that the TyG Joint Obesity indexes perform better than the TyG index (18, 19). Therefore, it is crucial to further explore the association between TyG and its associated various obesity indicators and cardio-renal disease.
The kidney and heart are crucial target organs for metabolic illnesses. However, previous studies have focused on cardiovascular disease in Asian and European populations. Studies on the correlation between TyG and cardiorenal syndrome in US populations are scarce (15, 20). In addition, there are few studies on the differences between various TyG-related indicators of obesity in predicting the risk of cardiorenal disease. This study utilized the National Health and Nutrition Examination Survey (NHANES) database to examine the relationship between the TyG index, its composite obesity indexes, and CKD, CVD, and CRS. To investigate the differences in these indicators in predicting the risk of cardiorenal disease risk, with a view to providing a scientific basis for the early prevention and identification of cardiorenal disease.
This study utilized NHANES data from eight consecutive survey rounds from 2003-2018, comprising a total of 80,312 initial samples. For populations with missing data, since the data were missing at random and the sample size was relatively large, we followed the methodology of the previous study and excluded them from subsequent analyses: (1) missing TyG index (N=55,967); (2) missing related obesity indicators (N=996); and (3) missing endpoints or covariates (N=11,858).The final 11,491 eligible adult participants were enrolled in the study. Figure 1 depicts the comprehensive selection procedure. Detailed information about the NHANES study procedures was obtained from the National Center for Health Statistics Research Ethics Review Board. Participants provided written consent before participation in the study was initiated.
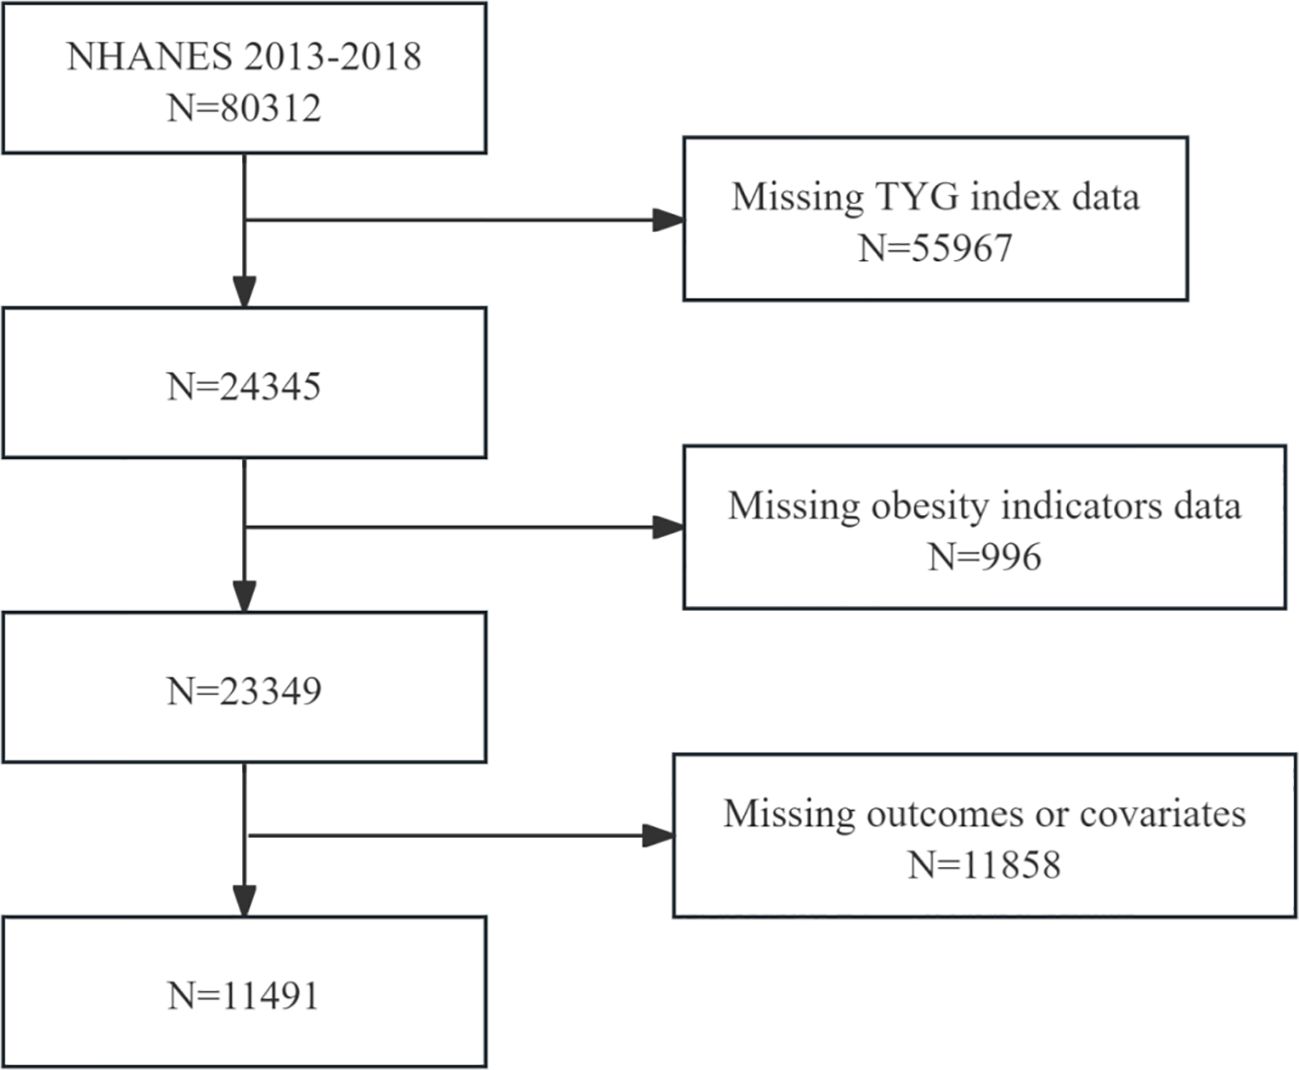
Figure 1. Flowchart depicting participant selection.
Four metrics were constructed in the study: (1) TyG = ln [triglycerides (mg/dL) × glucose (mg/dL)/2]; (2) TyG-WC = TyG × waist circumference; (3) TyG-WHtR = TyG × waist circumference/height; (4) TyG-BMI = TyG × BMI (21).
Referring to prior studies on NHANES participants, CKD is indicated if the urine albumin-creatinine ratio (UACR) is ≥30 mg/g and/or the glomerular filtration rate (GFR) is <60 mL/min/1.73 m². Calculation of GFR based on serum creatinine was performed using the CKD-EPI equation. To determine the random UACR, the urine albumin concentration is divided by the urine creatinine concentration (22). CVD is defined according to the NHANES MCQ questionnaire, in which participants answered “yes” to any of the questions in variable names 160b-f (23). Individuals with both CVD and CKD are classified CRS (24).
The variable age was considered continuous, while gender was categorized into two groups: male and female. Race and ethnicity were grouped using RIDRETH1, and individuals were classified based on marital status into groups of married, those living with a partner, and single individuals. The poverty income ratio (PIR) was divided into groups of <1, 1-3, and ≥3, with smoking status grouped according to whether individuals had smoked more than 100 cigarettes in their lifetime, and drinking status grouped according to whether they consumed fewer than 12 drinks per year. Using a standardized questionnaire data, self-reported physician diagnoses of cancer, hypertension, and diabetes mellitus were ascertained. Physical examinations were conducted to measure weight, height, blood pressure, waist circumference, and BMI. Laboratory blood tests were used to measure total cholesterol, TG, and fasting blood glucose (FBG), all of which were regarded as continuous variables.
Statistics were calculated in accordance with the CDC’s guidelines. Sample weights, clustering, and stratification were all included in the analyses for this study, as NHANES uses a complex probabilistic sampling methodology. The weighted means (95% CI) of continuous variables are presented, while categorical variables are presented in weighted percentage format (95% CI). The association between different TyG-related variables and CKD, CVD, and CRS was evaluated using multivariate logistic regression. Three adjustment models were developed to ensure a comprehensive analysis: Model 1 has no covariates adjusted for; Model 2 adjusts for demographic variables of age, sex, and race; and Model 3 further adjusts for marital status, PIR, alcohol consumption, smoking, cancer, hypertension, diabetes, and total cholesterol. To investigate the nonlinear dose-response relationship between TyG, related obesity, and CKD, CVD, and CRS, restricted cubic spline (RCS) curve analyses were performed at the 5th, 35th, 65th, and 95th percentiles of the distribution of TyG and related obesity, adjusting for the same variables as in Model 3, with 4 nodes set to reduce the potential impact of outliers. Additionally, in Model 3, diagnostic value analysis was performed using subject ROC curves. Finally, subgroup analyses based on fully adjusted models were conducted to examine associations between TyG and its composite obesity indexes with CKD, CVD, and CRS across different subgroups of age, sex, race, alcohol consumption, smoking, hypertension, and diabetes. Each of the statistical evaluations was performed using R (version 4.1.3) and EmpowerStats (version 6.0). Statistical significance was set at P < 0.05.
The baseline characteristics of individuals selected from NHANES between 2003 and 2018 are compiled in Table 1 and the supplementary materials, Supplementary Tables S1–S3. A total of 11,491 participants were enrolled, and individuals were categorized according to the quartiles of TyG and its composite obesity indexes. Higher TyG and its composite obesity indexes were linked to older age, a higher percentage of males, increased BMI, WC, TG, fasting glucose levels, alcohol and tobacco consumption, as well as the presence of diabetes mellitus, hypertension, cancer, CKD, CVD, and CRS among participants.
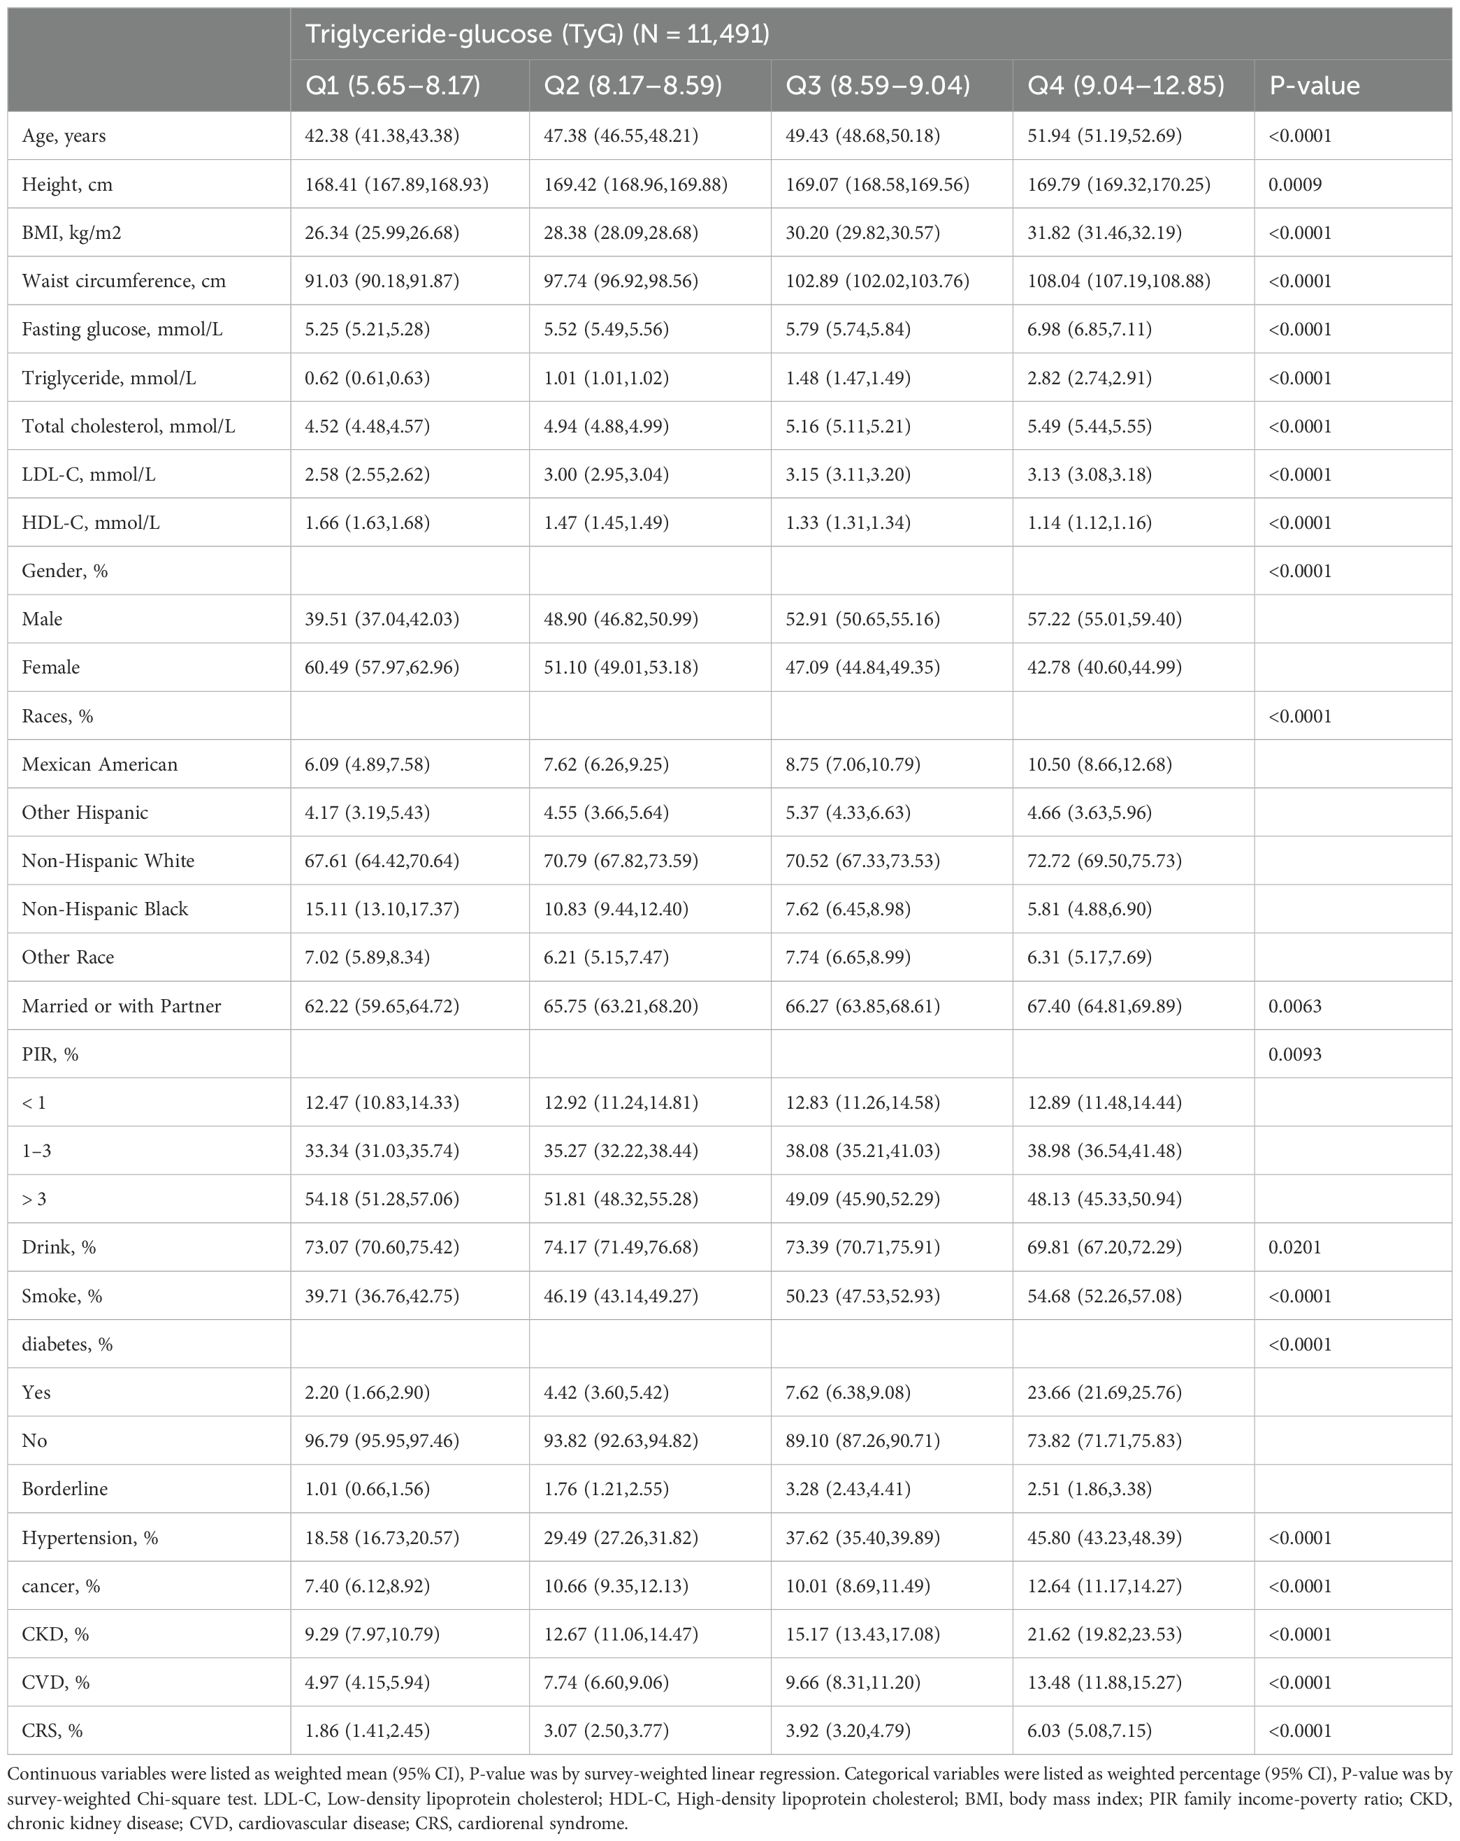
Table 1. Baseline characteristics of the individuals selected from NHANES between 2003 and 2018.
Table 2 illustrates the connection between TyG and its composite obesity indexes with CKD, CVD, and CRS. Supplemental files: Supplementary Tables S4–S6 provide comprehensive data on each association. TyG and its composite obesity indicators were positively linked with the likelihood of developing CKD, CVD, and CRS in the fully adjusted model (Model 3). TyG exhibited the strongest positive association with CKD (OR 1.42, 95% CI 1.11, 1.82; P = 0.007) (Table 2), followed by TyG-WHtR (HR 1.39, 95% CI 1.08, 1.78; P = 0.011) (Supplementary Table S4), based on further analysis utilizing TyG and its composite obesity indicators as stratification variables (quartiles). TyG-WHtR showed the best correlation with CVD (OR 1.63, 95% CI 1.19, 2.22; P = 0.003) (Supplementary Table S4), followed by TyG-WC (OR 1.57, 95% CI 1.14, 2.18; P = 0.008) (Supplementary Table S6). CRS was best correlated with TyG-WHtR (OR 1.44, 95% CI 1.00, 2.08; P = 0.055) (Supplementary Table S4).
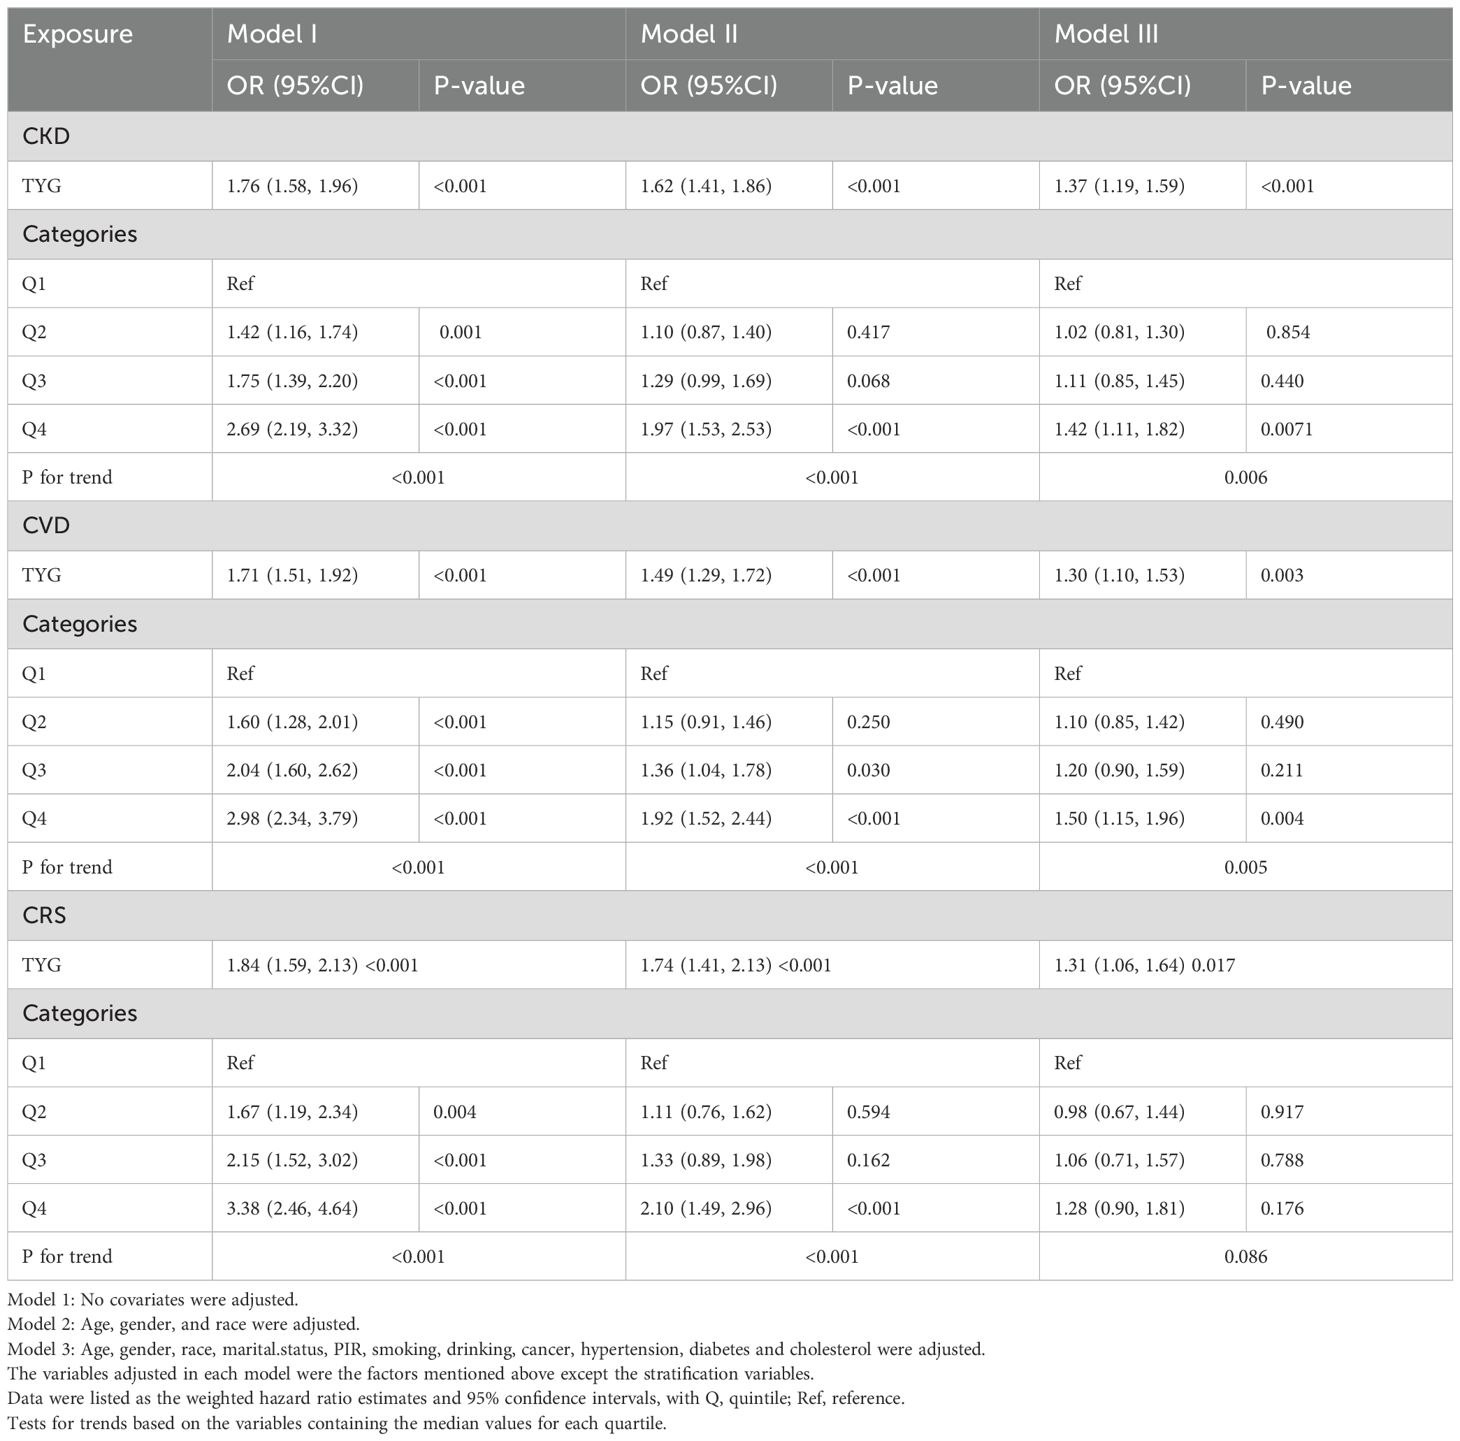
Table 2. The association between TyG index and the risk of CKD, CVD and CRS.
Figure 2 illustrates how we employed RCS curves to dynamically construct and visualize potential connections between TyG and its composite indexes and the risk of CKD, CVD, and CRS. After controlling for all factors in the primary analytic model (Model 3), TyG and CVD exhibited a steady linear positive connection. TyG-WC, TyG-WHtR, and TyG-BMI all demonstrated a substantial and linearly positive correlation with CVD and CRS (P for overall < 0.001, P for nonlinear > 0.05). All four TyG indicators and their composite obesity indexes showed nonlinear relationships (P for overall < 0.001, P for nonlinear < 0.05) with CKD and between TyG and CRS, suggesting that TyG and its derived indices may require different analytic approaches when predicting various aspects of cardiorenal disease.
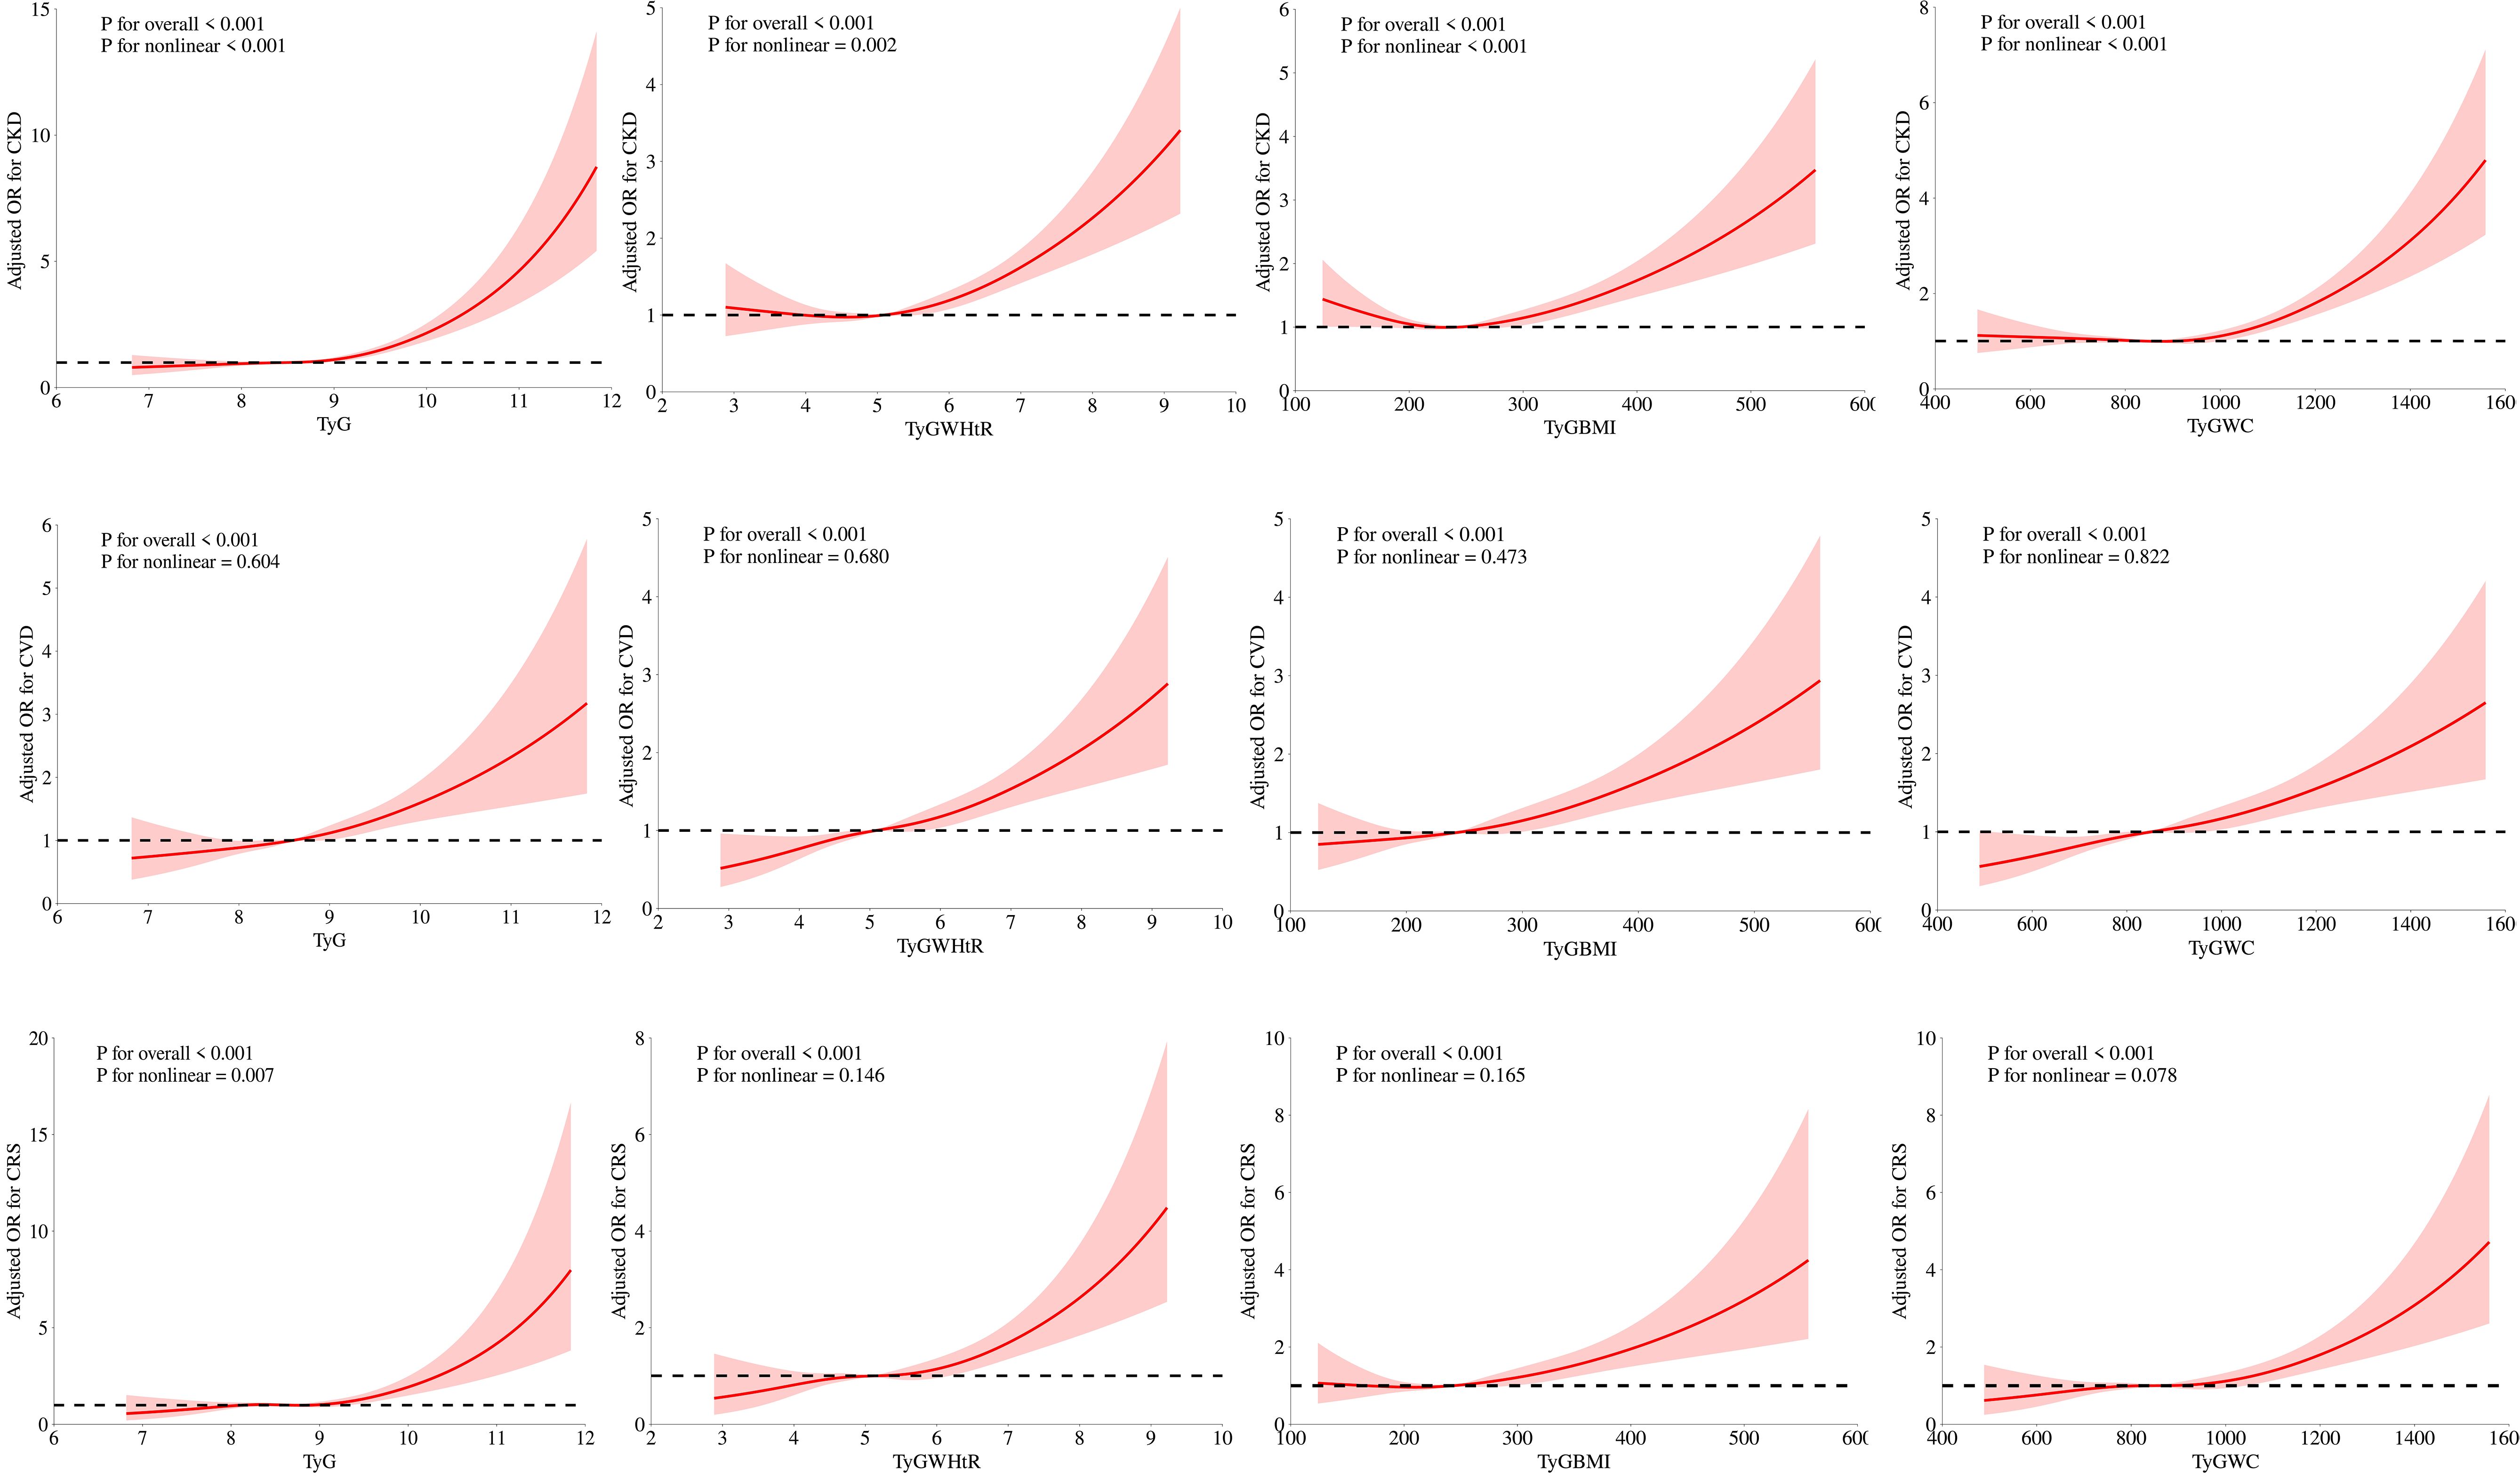
Figure 2. Associations between TyG, TyG-WHtR, TyG-BMI, and TyG-WC with CKD, CVD, and CRS were evaluated by RCS after adjustment for the covariables.
In diagnosing CKD, TyG-WHtR demonstrated the highest potency with an AUC of 0.631 (95% CI 0.618-0.643), followed by TyG-WC with an AUC of 0.609 (95% CI 0.596-0.622). For diagnosing CVD, TyG-WHtR exhibited the highest diagnostic effectiveness with an AUC of 0.645 (95% CI 0.630-0.660), followed closely by TyG-WC, which had an AUC of 0.640 (95% CI 0.625-0.655). Both TyG-WHtR and TyG-WC were also superior in detecting CRS (AUC = 0.657 for TyG-WHtR, 95% CI 0.636-0.677; AUC = 0.645 for TyG-WC, 95% CI 0.624-0.666). These findings imply that TyG-WHtR and TyG-WC may serve as effective risk assessment tools for cardiac and renal disorders (Figure 3).
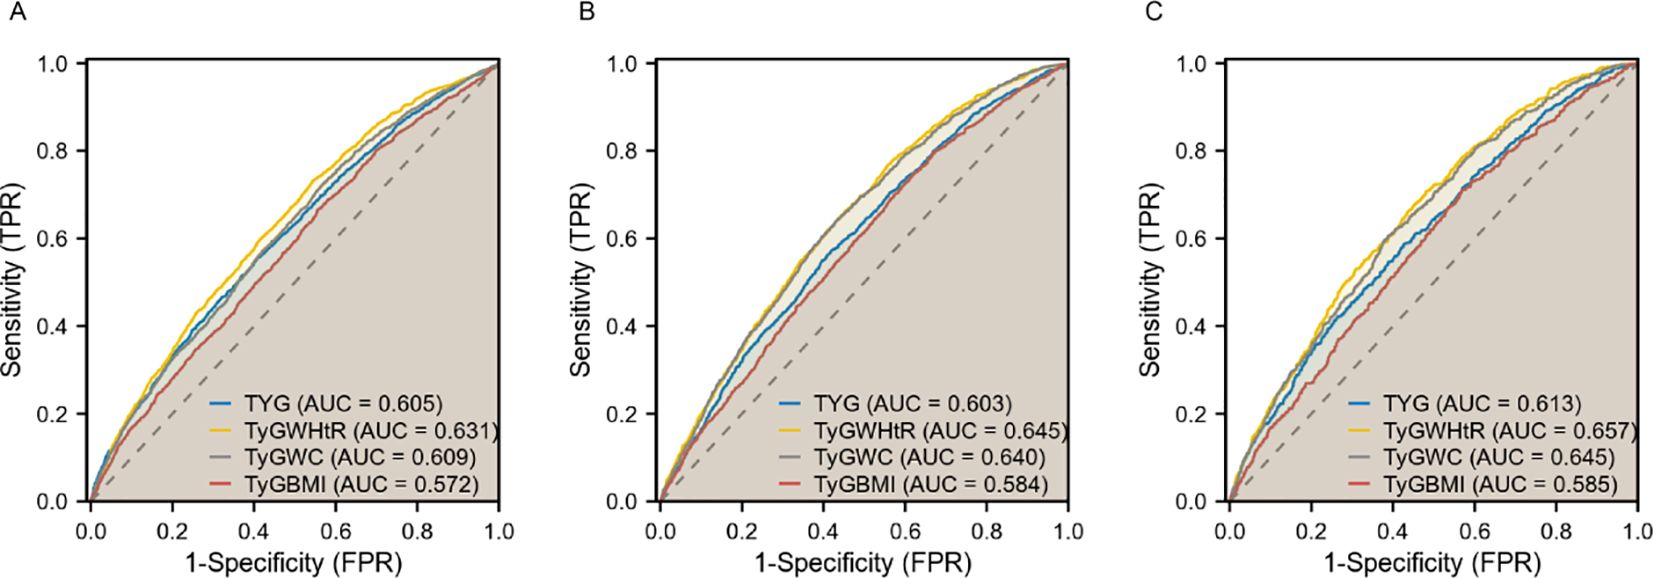
Figure 3. ROC curves of TyG, TyG-WHtR, TyG-WC, and TyG-BMI in relation to CKD, CVD, and CRS. (A) CKD; (B) CVD; (C) CRS.
Overall, a significant interaction was found between age, sex, and diabetes mellitus in the relationship between TyG and its composite obesity indexes and the risk of CKD, with stronger associations observed in individuals aged ≤ 50, males, and diabetic patients (P for interaction < 0.05). Furthermore, there were noteworthy interplays among distinct subsets of the indicators. For instance, the detrimental impacts of TyG-WHtR, TyG-BMI, TyG-WC on CVD and CRS seemed to be more prominent in younger people, and the detrimental effects of TyG-WC on CVD and CRS seemed to be more prominent in people who consumed alcohol (Figure 4, Supplementary Figures S1–S3).
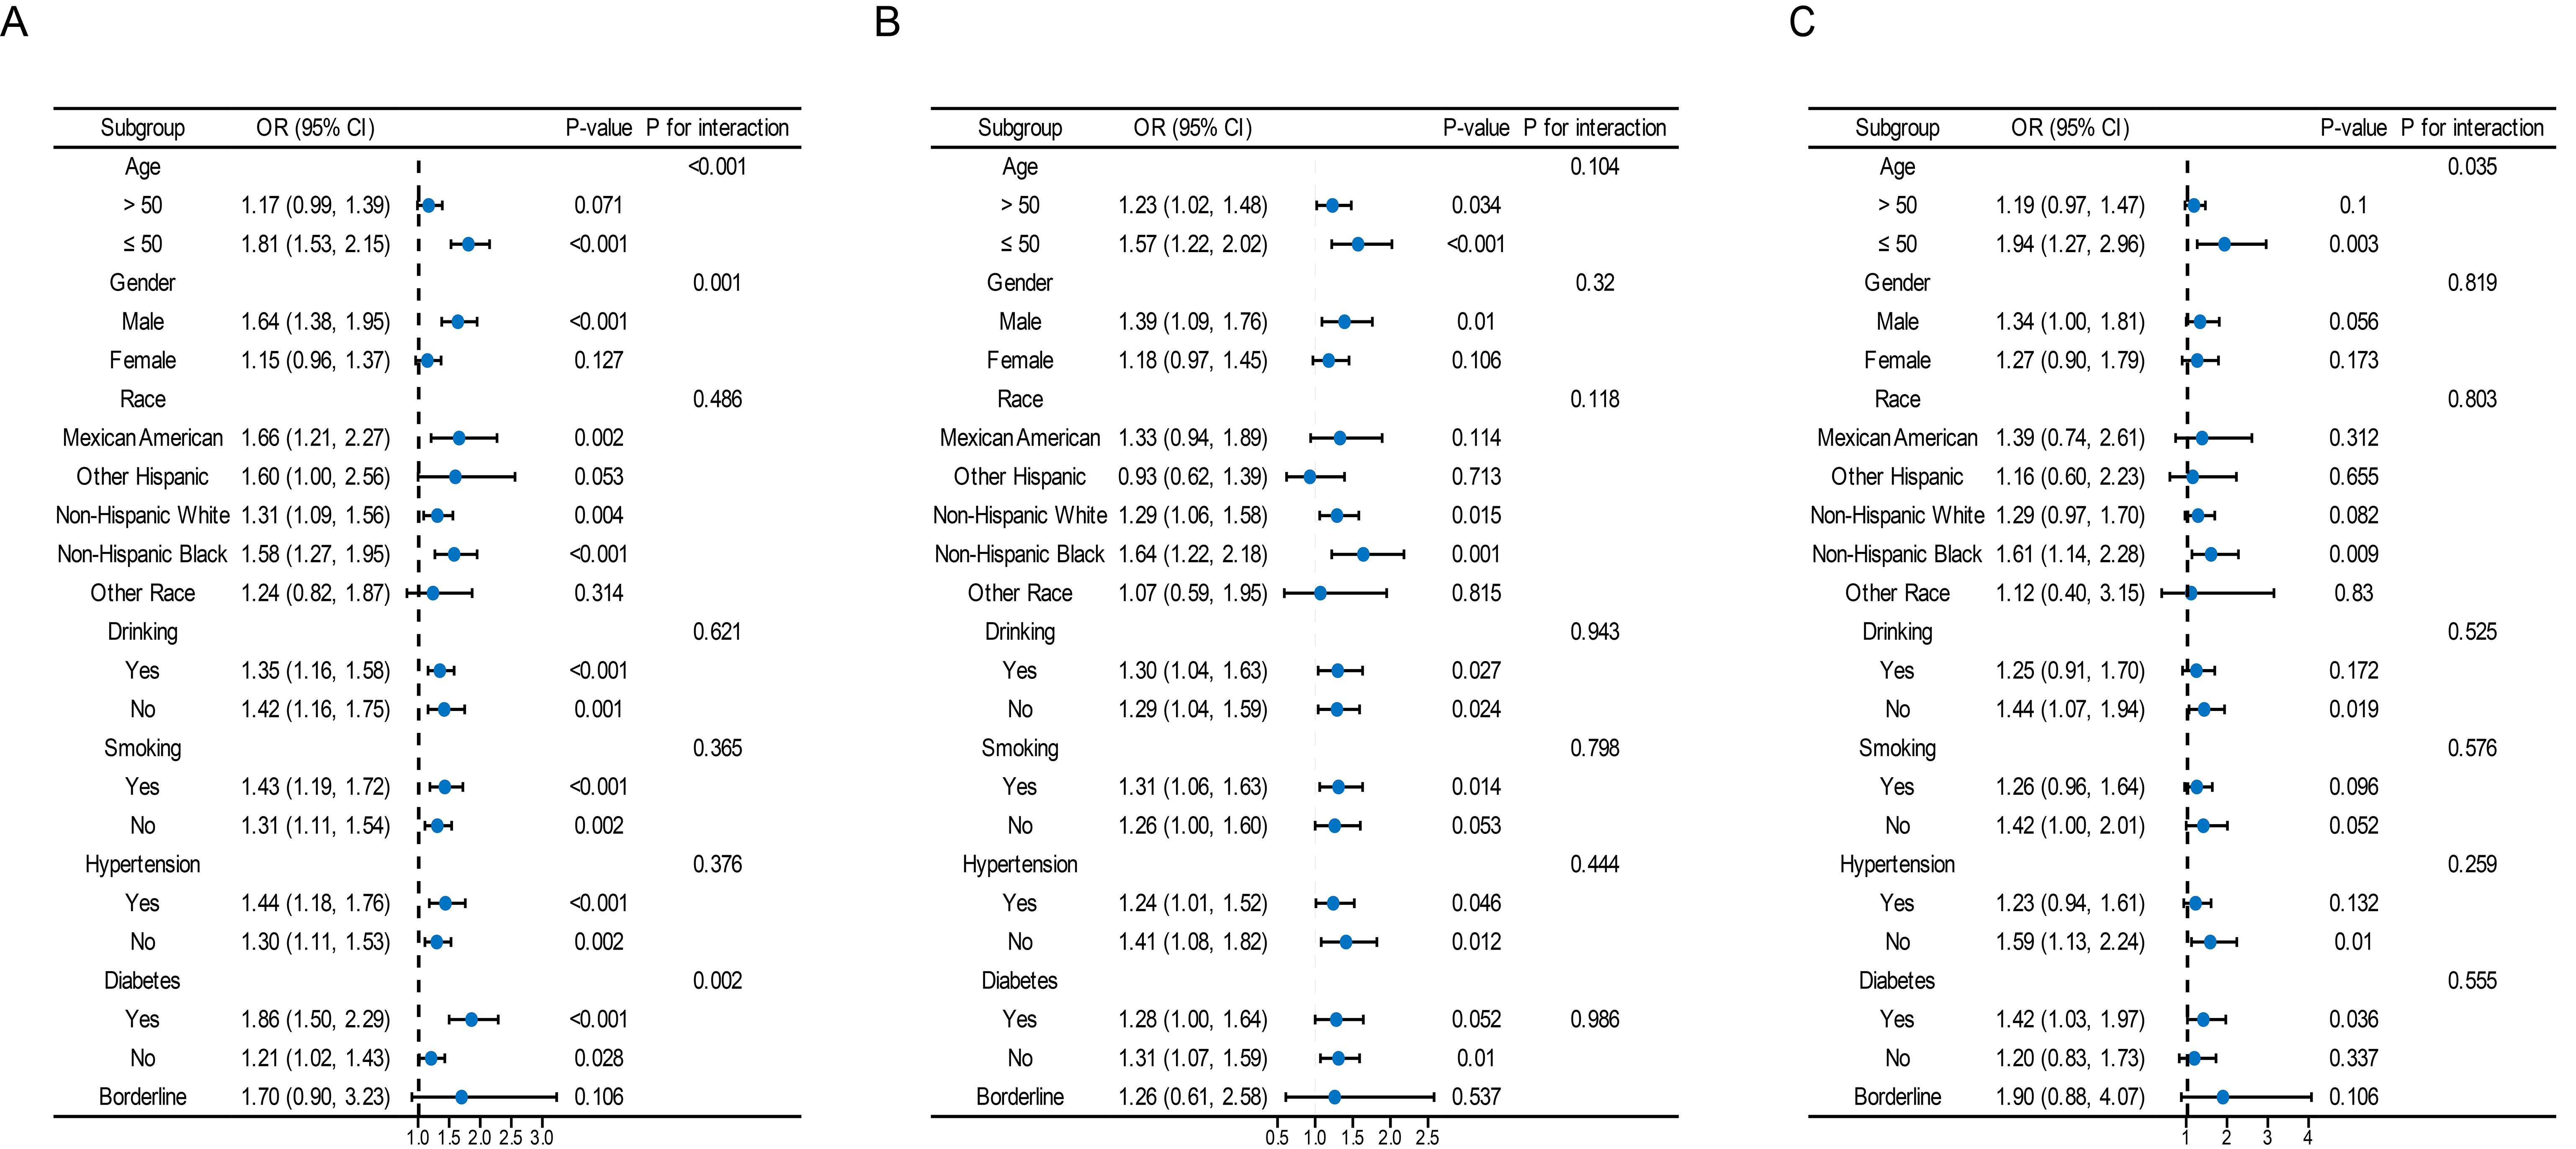
Figure 4. Subgroup analysis for the association between the TyG index and the risk of CKD, CVD, and CRS. The variables adjusted in each model were the factors mentioned above except the stratification variables. Data were listed as the weighted odd ratio estimates and 95% confidence intervals.
Our preliminary results indicate a positive association between TyG and its composite obesity indexes and the risk of developing CKD, CVD, and CRS. (1) Among the various parameters, TyG-WHtR demonstrated the strongest connection with CVD and CRS, while the highest association with CKD was found in TyG. (2) Nonlinear relationships were observed between TyG, TyG-WHtR, TyG-WC, and TyG-BMI and the probability of CKD, as well as between TyG and CRS. (3) In contrast to TyG, TyG-WHtR and TyG-WC were more effective in diagnosing CKD, CVD, and CRS. (4) The positive association between TyG and its composite obesity indexes and CKD was discovered to be more commonly in younger individuals (≤ 50), males, and those with diabetes mellitus.
TyG and its composite obesity indexes have been established as simple and reliable markers of IR and metabolic health for clinical use. They are derived from widely available measures of FBG, TG, and obesity, with research demonstrating that TyG-related obesity indicators are more effective than TyG alone in detecting IR (25, 26). Previous studies have shown a strong association between the TyG index and coronary artery stenosis, CKD, and atherosclerotic cardiovascular disease (ASCVD) in the general population, as well as among individuals with metabolic disorders such as diabetes and hyperuricemia (27, 28). For instance, a national prospective cohort study in China indicated that individuals with higher TyG levels faced an increased risk of stroke (29). Cross-sectional studies based on NHANES data have revealed that higher TyG scores are significantly associated with elevated UACR levels, albuminuria, and CKD values (30). However, the majority of these studies have concentrated on the impacts of the most recent TyGs, leaving research on TyG-related obesity indices rather scattered. As a result, it is necessary to evaluate these characteristics at the same time and compare the various indices.
Few studies, to our knowledge, have comprehensively evaluated the relationships between TyG in combination with obesity indices and CKD, CVD, and CRS. Our research indicates a positive correlation between TyG’s combined obesity metrics and the risks of CKD, CVD, and CRS, That’s consistent with previous reports. High TyG and its combined obesity markers were linked to higher risk of CVD and mortality, according to research by Dang et al. (31). In an older cohort, Kim et al. discovered that an elevated TyG index was a predictor of CKD risk (32). Additionally, a previous cross-sectional clinical investigation found that a higher TyG index was independently correlated with the severity of coronary artery disease in individuals with CKD (33). However, the positive effect sizes in Model 3 became nonsignificant as the TyG, TyG-WC, and TyG-BMI indexes increased. This finding may relate to the multidimensionality of the CRS data, the grouping strategy, and the selected modeling options.
Additionally, the ROC curves demonstrated that TyG-WHtR and TyG-WC outperformed TyG-BMI in terms of diagnostic efficacy for CKD, CVD, and CRS. A study investigating CKD in a Chinese population revealed that TyG-WHtR has higher predictive performance than TyG alone (34). In a 15-year cohort analysis, TyG-WC and TyG-WHtR were shown to be superior to TyG for predicting new ASCVD events (35). In another study, elevated baseline TyG-WC levels were reported to be associated with an increased risk of first MI, and TyG-WC has been proposed as a simple and effective marker for clinical application (36). This superiority may be attributed to the fact that WC and are key indicators of central abdominal obesity, which is associated with higher visceral fat accumulation, chronic inflammation, oxidative stress, and neuroendocrine disruption, leading to the coexistence of chronic diseases (37). Our findings establish TyG-WC and TyG-WHtR as valuable risk indicators for cardiorenal illness and suggest that they may be effective for the co-management of cardiovascular and renal disorders.
According to subgroup analyses, TyG and its composite obesity measurements were more strongly associated with cardiorenal illness in younger individuals. These age-related effects are consistent with prior investigations (38, 39). One possible explanation is because older individuals are more likely to be taking multiple medications and have a greater cardiac and renal burden beyond IR or obesity, which somewhat weakens the prediction of cardiac and renal disease risk outcomes by TyG and its obesity metrics.
The precise biological mechanisms underlying the relationship between TyG and its composite obesity indexes and cardiac and renal illness are not fully understood; however, several possible explanations exist. Elevated TyG and its composite obesity index levels are linked to IR and increased adiposity (40, 41). Abnormalities in hemodynamics and neurohumoral control are important factors in the interaction between cardiac and renal failure (42, 43). Glycolipotoxicity induced by IR can lead to oxidative stress condition, resulting in endothelial dysfunction and increased cardio-renal vascular resistance (44, 45). Persistent IR activates the sympathetic nervous system and the renin-angiotensin-aldosterone system excessively, which damages the kidneys and causes abnormalities in blood pressure, electrolyte imbalances, and cardiac workload (46, 47). Furthermore, IR and metabolic disorders such as hyperlipidemia and obesity accumulate harmful metabolites contribute to a vicious cycle of CKD, CVD, and CRS (48, 49).
This is the first study to focus on comprehensively evaluating the association between TyG- and its obesity index and heart and kidney disease. Our results support that TyG-WC, TyG-WHtR are valuable tools for predicting the risk of cardiorenal disease, which may help to reduce the cost of screening, early detection of individuals at high risk of cardiorenal disease and improve risk stratification in clinical practice. Effective interventions targeting TyG-WC, TyG-WHtR indices could be developed in the future to prevent the risk of cardiorenal disease. Focusing on TyG-WC, TyG-WHtR levels may provide more precise and personalized strategies for the prevention of cardiorenal disease.
Our study demonstrates several research strengths. Our findings highlight the potential of TyG and its composite obesity indexes in the therapeutic management of cardiac and renal disorders. First, we utilized the NHANES database, which employs a complex multi-stage probability sampling procedure, and evaluated the data with suitable NHANES sample weights, boosting the validity and adaptability. A second strength is the inclusion of a wide range of covariates, which improves accuracy. Finally, The large sample size ensures the reliability of our assessment results. However, there are limitations to this study. First, the diagnosis of cardiovascular events and certain covariates rely on self-reporting, which may introduce the possibility of measurement error and inaccurate data collection; Second, although we have adjusted for as many potential confounders as possible, the possibility that unmeasured variables or residuals of unknown confounders cause confounding effects cannot be completely ruled out; Third, the analysis examined only baseline TyG and its derivatives, and it is unclear how they affect CKD, CVD, and CRS over time; Furthermore, although CRS is divided into 5 subtypes, our study sample represents only chronic CRS, and we were unable to determine the order of decline in cardiovascular and renal functions; Finally, our study was conducted based on a U.S. population, and the applicability of the findings may vary regionally, necessitating further exploration for validation in a broader population.
In conclusion, TyG-WC and TyG-WtHR were positively associated with heart and kidney disease in the US population, and showed higher predictive and diagnostic efficacy compared to TyG. Future applications in public health services have the potential to make them effective markers for identifying cardio-renal disease risk, early prevention and co-management of cardio-renal disease.
Publicly available datasets were analyzed in this study. This data can be found here: https://www.cdc.gov/nchs/nhanes/index.htm.
The studies involving humans were approved by National Center for Health Statistics Research Ethics Review Board. The studies were conducted in accordance with the local legislation and institutional requirements. Written informed consent for participation was not required from the participants or the participants’ legal guardians/next of kin in accordance with the national legislation and institutional requirements. Written informed consent was obtained from the individual(s) for the publication of any potentially identifiable images or data included in this article.
YW: Writing – original draft. CL: Data curation, Writing – review & editing. JC: Resources, Writing – review & editing.
The author(s) declare that no financial support was received for the research, authorship, and/or publication of this article.
We are grateful to the National Health and Nutrition Examination Survey for the data provided and to all participants for their selfless dedication.
The authors declare that the research was conducted in the absence of any commercial or financial relationships that could be construed as a potential conflict of interest.
The author(s) declare that no Generative AI was used in the creation of this manuscript.
All claims expressed in this article are solely those of the authors and do not necessarily represent those of their affiliated organizations, or those of the publisher, the editors and the reviewers. Any product that may be evaluated in this article, or claim that may be made by its manufacturer, is not guaranteed or endorsed by the publisher.
The Supplementary Material for this article can be found online at: https://www.frontiersin.org/articles/10.3389/fendo.2025.1505808/full#supplementary-material
1. GBD 2021 Causes of Death Collaborators. Global burden of 288 causes of death and life expectancy decomposition in 204 countries and territories and 811 subnational locations, 1990-2021: a systematic analysis for the Global Burden of Disease Study 2021. Lancet (London England). (2024) 403:2100–32. doi: 10.1016/S0140-6736(24)00367-2
2. Matsushita K, Ballew SH, Wang AY, Kalyesubula R, Schaeffner E, Agarwal R. Epidemiology and risk of cardiovascular disease in populations with chronic kidney disease. Nat Rev Nephrol. (2022) 18:696–707. doi: 10.1038/s41581-022-00616-6
3. Ishigami J, Cowan LT, Demmer RT, Grams ME, Lutsey PL, Carrero JJ, et al. Incident hospitalization with major cardiovascular diseases and subsequent risk of ESKD: implications for cardiorenal syndrome. J Am Soc Nephrol. (2020) 31:405–14. doi: 10.1681/ASN.2019060574
4. McCallum W, Sarnak MJ. Cardiorenal syndrome in the hospital. Clin J Am Soc Nephrol. (2023) 18:933–45. doi: 10.2215/CJN.0000000000000064
5. Petersen MC, Shulman GI. Mechanisms of insulin action and insulin resistance. Physiol Rev. (2018) 98:2133–223. doi: 10.1152/physrev.00063.2017
6. Lee SH, Park SY, Choi CS. Insulin resistance: from mechanisms to therapeutic strategies. Diabetes Metab J. (2022) 46:15–37. doi: 10.4093/dmj.2021.0280
7. Hill MA, Yang Y, Zhang L, Sun Z, Jia G, Parrish AR, et al. Insulin resistance, cardiovascular stiffening and cardiovascular disease. Metabolism. (2021) 119:154766. doi: 10.1016/j.metabol.2021.154766
8. Engin A. The definition and prevalence of obesity and metabolic syndrome. Adv Exp Med Biol. (2017) 960:1–17. doi: 10.1007/978-3-319-48382-5_1
9. Brown AE, Walker M. Genetics of insulin resistance and the metabolic syndrome. Curr Cardiol Rep. (2016) 18:75. doi: 10.1007/s11886-016-0755-4
10. Tahapary DL, Pratisthita LB, Fitri NA, Marcella C, Wafa S, Kurniawan F, et al. Challenges in the diagnosis of insulin resistance: Focusing on the role of HOMA-IR and Tryglyceride/glucose index. Diabetes Metab Syndr. (2022) 16:102581. doi: 10.1016/j.dsx.2022.102581
11. Ramdas Nayak VK, Satheesh P, Shenoy MT, Kalra S. Triglyceride Glucose (TyG) Index: A surrogate biomarker of insulin resistance. J Pak Med Assoc. (2022) 72:986–8. doi: 10.47391/JPMA.22-63
12. Zhu Q, Chen Y, Cai X, Cai L, Hong J, Luo Q, et al. The non-linear relationship between triglyceride-glucose index and risk of chronic kidney disease in hypertensive patients with abnormal glucose metabolism: A cohort study. Front Med (Lausanne). (2022) 9:1018083. doi: 10.3389/fmed.2022.1018083
13. Wang X, Xu W, Song Q, Zhao Z, Meng X, Xia C, et al. Association between the triglyceride-glucose index and severity of coronary artery disease. Cardiovasc Diabetol. (2022) 21:168. doi: 10.1186/s12933-022-01606-5
14. Okamura T, Hashimoto Y, Hamaguchi M, Obora A, Kojima T, Fukui M. Triglyceride-glucose index is a predictor of incident chronic kidney disease: a population-based longitudinal study. Clin Exp Nephrol. (2019) 23:948–55. doi: 10.1007/s10157-019-01729-2
15. Che B, Zhong C, Zhang R, Pu L, Zhao T, Zhang Y, et al. Triglyceride-glucose index and triglyceride to high-density lipoprotein cholesterol ratio as potential cardiovascular disease risk factors: an analysis of UK biobank data. Cardiovasc Diabetol. (2023) 22:34. doi: 10.1186/s12933-023-01762-2
16. Piché ME, Tchernof A, Després JP. Obesity phenotypes, diabetes, and cardiovascular diseases. Circ Res. (2020) 126:1477–500. doi: 10.1161/CIRCRESAHA.120.316101
17. Hall JE, do Carmo JM, da Silva AA, Wang Z, Hall ME. Obesity, kidney dysfunction and hypertension: mechanistic links. Nat Rev Nephrol. (2019) 15:367–85. doi: 10.1038/s41581-019-0145-4
18. Cui C, Qi Y, Song J, Shang X, Han T, Han N, et al. Comparison of triglyceride glucose index and modified triglyceride glucose indices in prediction of cardiovascular diseases in middle aged and older Chinese adults. Cardiovasc Diabetol. (2024) 23:185. doi: 10.1186/s12933-024-02278-z
19. Malek M, Khamseh ME, Chehrehgosha H, Nobarani S, Alaei-Shahmiri F. Triglyceride glucose-waist to height ratio: a novel and effective marker for identifying hepatic steatosis in individuals with type 2 diabetes mellitus. Endocrine. (2021) 74:538–45. doi: 10.1007/s12020-021-02815-w
20. Li F, Wang Y, Shi B, Sun S, Wang S, Pang S, et al. Association between the cumulative average triglyceride glucose-body mass index and cardiovascular disease incidence among the middle-aged and older population: a prospective nationwide cohort study in China. Cardiovasc Diabetol. (2024) 23:16. doi: 10.1186/s12933-023-02114-w
21. Yin H, Guo L, Zhu W, Li W, Zhou Y, Wei W, et al. Association of the triglyceride-glucose index and its related parameters with frailty. Lipids Health Dis. (2024) 23:150. doi: 10.1186/s12944-024-02147-4
22. Ren Y, Cai Z, Guo C, Zhang Y, Xu H, Liu L, et al. Associations between life’s essential 8 and chronic kidney disease. J Am Heart Assoc. (2023) 12:e030564. doi: 10.1161/JAHA.123.030564
23. Zhang Q, Xiao S, Jiao X, Shen Y. The triglyceride-glucose index is a predictor for cardiovascular and all-cause mortality in CVD patients with diabetes or pre-diabetes: evidence from NHANES 2001-2018. Cardiovasc Diabetol. (2023) 22:279. doi: 10.1186/s12933-023-02030-z
24. Lin J, Li Z, Xu J, Pan M, Yin T, Wang J, et al. Independent and joint associations of monocyte to high-density lipoprotein-cholesterol ratio and body mass index with cardiorenal syndrome: insights from NHANES 2003-2020. Lipids Health Dis. (2024) 23:153. doi: 10.1186/s12944-024-02149-2
25. Tuo X, Yuan J, Wang XH, Xin Z. Identifying the insulin resistance index in nondiabetic Chinese subjects. Med (Baltimore). (2020) 99:e19023. doi: 10.1097/MD.0000000000019023
26. Lim J, Kim J, Koo SH, Kwon GC. Comparison of triglyceride glucose index, and related parameters to predict insulin resistance in Korean adults: An analysis of the 2007-2010 Korean National Health and Nutrition Examination Survey. PloS One. (2019) 14:e0212963. doi: 10.1371/journal.pone.0212963
27. Liang S, Wang C, Zhang J, Liu Z, Bai Y, Chen Z, et al. Triglyceride-glucose index and coronary artery disease: a systematic review and meta-analysis of risk, severity, and prognosis. Cardiovasc Diabetol. (2023) 22:170. doi: 10.1186/s12933-023-01906-4
28. Ren X, Jiang M, Han L, Zheng X. Association between triglyceride-glucose index and chronic kidney disease: A cohort study and meta-analysis. Nutr Metab Cardiovasc Dis. (2023) 33:1121–8. doi: 10.1016/j.numecd.2023.03.026
29. Huo RR, Liao Q, Zhai L, You XM, Zuo YL. Interacting and joint effects of triglyceride-glucose index (TyG) and body mass index on stroke risk and the mediating role of TyG in middle-aged and older Chinese adults: a nationwide prospective cohort study. Cardiovasc Diabetol. (2024) 23:30. doi: 10.1186/s12933-024-02122-4
30. Liu N, Liu C, Qu Z, Tan J. Association between the triglyceride-glucose index and chronic kidney disease in adults. Int Urol Nephrol. (2023) 55:1279–89. doi: 10.1007/s11255-022-03433-9
31. Dang K, Wang X, Hu J, Zhang Y, Cheng L, Qi X, et al. The association between triglyceride-glucose index and its combination with obesity indicators and cardiovascular disease: NHANES 2003-2018. Cardiovasc Diabetol. (2024) 23:8. doi: 10.1186/s12933-023-02115-9
32. Kim B, Kim GM, Han K, Maki N, Taniguchi K, Oh S. The triglyceride-glucose index is independently associated with chronic kidney disease in the geriatric population, regardless of obesity and sex. Ann Geriatr Med Res. (2023) 27:258–65. doi: 10.4235/agmr.23.0096
33. Liu D, Guan X, Chen R, Song C, Qiu S, Xu S, et al. The clinical evaluation of the triglyceride-glucose index as a risk factor for coronary artery disease and severity of coronary artery stenosis in patients with chronic kidney disease. Ren Fail. (2024) 46:2320261. doi: 10.1080/0886022X.2024.2320261
34. Chen T, Liu Y, Wu S, Long S, Feng L, Lu W, et al. Comparison of tyG and newly tyG related indicators for chronic kidney diseases estimation in a chinese population. Diabetes Metab Syndr Obes. (2024) 17:3063–75. doi: 10.2147/DMSO.S469260
35. Xia X, Chen S, Tian X, Xu Q, Zhang Y, Zhang X, et al. Association of triglyceride-glucose index and its related parameters with atherosclerotic cardiovascular disease: evidence from a 15-year follow-up of Kailuan cohort. Cardiovasc Diabetol. (2024) 23:208. doi: 10.1186/s12933-024-02290-3
36. Hu J, Cai X, Li N, Zhu Q, Wen W, Hong J, et al. Association between triglyceride glucose index-waist circumference and risk of first myocardial infarction in chinese hypertensive patients with obstructive sleep apnoea: an observational cohort study. Nat Sci Sleep. (2022) 14:969–80. doi: 10.2147/NSS.S362101
37. Zheng D, Cai J, Xu S, Jiang S, Li C, Wang B. The association of triglyceride-glucose index and combined obesity indicators with chest pain and risk of cardiovascular disease in American population with pre-diabetes or diabetes. Front Endocrinol (Lausanne). (2024) 15:1471535. doi: 10.3389/fendo.2024.1471535
38. Qin Y, Xuan L, Deng Y, Wang F, Liu B, Wang S. Triglyceride-glucose index and mortality risk in individuals with or without chronic kidney disease: Insights from a national survey of United States adults, 1999-2018. Nutr Metab Cardiovasc Dis. (2024) 34:1994–2001. doi: 10.1016/j.numecd.2024.04.003
39. Barzegar N, Tohidi M, Hasheminia M, Azizi F, Hadaegh F. The impact of triglyceride-glucose index on incident cardiovascular events during 16 years of follow-up: Tehran Lipid and Glucose Study. Cardiovasc Diabetol. (2020) 19:155. doi: 10.1186/s12933-020-01121-5
40. Ormazabal V, Nair S, Elfeky O, Aguayo C, Salomon C, Zuñiga FA. Association between insulin resistance and the development of cardiovascular disease. Cardiovasc Diabetol. (2018) 17:122. doi: 10.1186/s12933-018-0762-4
41. Sebastian SA, Padda I, Johal G. Cardiovascular-Kidney-Metabolic (CKM) syndrome: A state-of-the-art review. Curr Probl Cardiol. (2024) 49:102344. doi: 10.1016/j.cpcardiol.2023.102344
42. Verbrugge FH, Guazzi M, Testani JM, Borlaug BA. Altered hemodynamics and end-organ damage in heart failure: impact on the lung and kidney. Circulation. (2020) 142:998–1012. doi: 10.1161/CIRCULATIONAHA.119.045409
43. Ramchandra R, Xing DT, Matear M, Lambert G, Allen AM, May CN. Neurohumoral interactions contributing to renal vasoconstriction and decreased renal blood flow in heart failure. Am J Physiol Regul Integr Comp Physiol. (2019) 317:R386–96. doi: 10.1152/ajpregu.00026.2019
44. Lambeth JD. Nox enzymes, ROS, and chronic disease: an example of antagonistic pleiotropy. Free Radic Biol Med. (2007) 43:332–47. doi: 10.1016/j.freeradbiomed.2007.03.027
45. Lin WR, Liu KH, Ling TC, Wang MC, Lin WH. Role of antidiabetic agents in type 2 diabetes patients with chronic kidney disease. World J Diabetes. (2023) 14:352–63. doi: 10.4239/wjd.v14.i4.352
46. Whaley-Connell A, Sowers JR. Oxidative stress in the cardiorenal metabolic syndrome. Curr Hypertens Rep. (2012) 14:360–5. doi: 10.1007/s11906-012-0279-2
47. Cabandugama PK, Gardner MJ, Sowers JR. The renin angiotensin aldosterone system in obesity and hypertension: roles in the cardiorenal metabolic syndrome. Med Clin North Am. (2017) 101:129–37. doi: 10.1016/j.mcna.2016.08.009
48. Bang KB, Cho YK. Comorbidities and metabolic derangement of NAFLD. J Lifestyle Med. (2015) 5:7–13. doi: 10.15280/jlm.2015.5.1.7
Keywords: TyG related indicators, chronic kidney disease, cardiovascular disease, cardiorenal syndrome, NHANES
Citation: Wu Y, Liu C and Cao J (2025) Association between triglyceride-glucose index and its composite obesity indexes and cardio-renal disease: analysis of the NHANES 2013-2018 cycle. Front. Endocrinol. 16:1505808. doi: 10.3389/fendo.2025.1505808
Received: 03 October 2024; Accepted: 13 January 2025;
Published: 31 January 2025.
Edited by:
Teresa Vanessa Fiorentino, Magna Græcia University, ItalyReviewed by:
Xintian Cai, People’s Hospital of Xinjiang Uygur Autonomous Region, ChinaCopyright © 2025 Wu, Liu and Cao. This is an open-access article distributed under the terms of the Creative Commons Attribution License (CC BY). The use, distribution or reproduction in other forums is permitted, provided the original author(s) and the copyright owner(s) are credited and that the original publication in this journal is cited, in accordance with accepted academic practice. No use, distribution or reproduction is permitted which does not comply with these terms.
*Correspondence: Chengsen Liu, MTMxMjE2MzAxN0BxcS5jb20=; Jiandong Cao, MTkxNTk1NDI0OTBAMTYzLmNvbQ==
†These authors have contributed equally to this work
Disclaimer: All claims expressed in this article are solely those of the authors and do not necessarily represent those of their affiliated organizations, or those of the publisher, the editors and the reviewers. Any product that may be evaluated in this article or claim that may be made by its manufacturer is not guaranteed or endorsed by the publisher.
Research integrity at Frontiers
Learn more about the work of our research integrity team to safeguard the quality of each article we publish.