 Wenwei Zuo
 Xuelian Yang
94% of researchers rate our articles as excellent or good
Learn more about the work of our research integrity team to safeguard the quality of each article we publish.
Find out more
ORIGINAL RESEARCH article
Front. Endocrinol. , 21 February 2025
Sec. Clinical Diabetes
Volume 16 - 2025 | https://doi.org/10.3389/fendo.2025.1493984
Background: Diabetic retinopathy (DR) not only leads to visual impairment but also increases the risk of death in type 2 diabetes patients. This study aimed to construct a nomogram to assess the risk of all-cause mortality in patients with DR.
Methods: This cross-sectional study included 1004 patients from the National Health and Nutrition Examination Survey database (NHANES) between 1999-2018. Participants were randomized in a 7:3 ratio into a training set and a test set. We selected predictors by LASSO regression and multifactorial Cox proportional risk regression analysis and constructed nomograms, guided by established clinical guidelines and expert consensus as the gold standard. We used the concordance index (C-index), receiver operating characteristic curve (ROC), calibration curve, and decision curve analysis (DCA) to evaluate the nomogram’s discriminative power, calibration quality, and clinical use.
Results: The training and test sets consisted of 703 and 301 participants with a median age of 64 and 63 years, respectively. The study identified seven predictors, including age, marital status, congestive heart failure (CHF), coronary heart disease (CHD), stroke, creatinine level, and taking insulin. The C-index of the nomogram model constructed from the training set was 0.738 (95% CI: 0.704-0.771), while the C-index of the test set was 0.716 (95% CI: 0.663-0.768). In the training set, the model’s AUC values for predicting all-cause mortality risk at 3 years, 5 years, and 10 years were 0.739, 0.765, and 0.808, respectively. In the test set, these AUC values were 0.737, 0.717, and 0.732, respectively. The ROC curve, calibration curve, and DCA curve all demonstrated excellent predictive performance, confirming the model’s effectiveness and reliability in clinical applications.
Conclusions: Our nomogram demonstrates high clinical predictive accuracy, enabling clinicians to effectively predict the overall mortality risk in patients with DR, thereby significantly improving their prognosis.
Diabetic retinopathy (DR) is a prevalent and severe microvascular complication among individuals with diabetes, representing a significant public health challenge globally (1). A meta-analysis indicates that approximately 22.27% of people with diabetes worldwide have DR, with projections suggesting this number will reach 160.5 million by 2045 (2). In the United States, studies based on nationally representative data estimate that approximately 9.6 million patients (95% uncertainty interval [UI]: 7.90-11.55) were affected by DR in 2021 (3). The primary characteristics of DR include retinal vascular damage, which often results in vascular leakage, neovascularization, and retinal dysfunction (4). As the disease advances, patients experience progressive visual impairment, severely impacting their quality of life (5). Given that the retina is a microvascular structure highly susceptible to changes in blood flow and composition, chronic systemic diseases can significantly damage retinal integrity (6–8). This not only threatens patients’ vision but also increases the likelihood of broader health issues, underscoring the importance of early detection and intervention.
Moreover, DR is not only a cause of visual impairment but also significantly correlates with the overall health of patients, particularly increasing their mortality risk. Research showed that mortality in diabetic patients was strongly linked to the presence and severity of DR (9). Epidemiological studies revealed that diabetic patients with retinopathy had a notably higher mortality rate compared to those without. The elevated mortality risk was attributable to the development of cardiovascular disease, renal impairment, and other diabetes-related complications (10–12). Patients with DR have an increased likelihood of cardiovascular events, and following such events, their mortality risk escalates substantially (13). Therefore, early recognition of DR is critical not only for preserving vision but also as an important indicator of a patient’s general health. Despite the well-established association between DR and mortality risk, there is a lack of predictive models or tools specifically designed to assess mortality risk in this patient group. Traditional mortality risk prediction tools typically focus on assessing the risk for cardiovascular disease or other single conditions, failing to adequately consider the unique clinical characteristics and combined risks faced by patients with DR. This gap in predictive tools limits clinicians’ ability to develop individualized treatment plans.
To address this problem, a straightforward, useful, and precise nomogram for estimating the risk of all-cause mortality in patients with DR was developed and validated using data from the National Health and Nutrition Examination Survey (NHANES) from 1999 to 2018. This nomogram is designed to help clinicians identify high-risk patients early and implement proactive interventions. Additionally, it aims to increase awareness among patients and their families, promoting proactive health management.
The National Health and Nutrition Examination Survey (NHANES) is a cross-sectional survey conducted every two years in the United States that was created in 1999 to evaluate the nutritional status and general health of non-institutionalized citizens. To guarantee national representation, a stratified, intricate, multistage, and probabilistic sampling methodology is employed in the survey. The sampling method for this survey specifically involves stratified sampling. Surveys are conducted biennially, beginning with the selection of several states across the United States. Within these selected states, specific counties are chosen, followed by the selection of municipalities within those counties. Finally, households within the selected municipalities are identified as the units of analysis for the survey (14, 15). All participants gave their informed agreement, and the National Center for Health Statistics (NCHS) Institutional Review Board approved the study procedure. Data for this cross-sectional study were drawn from NHANES between 1999 and 2018.
In this study, we collected data on patients diagnosed with diabetic retinopathy over 10 periods from 1999 to 2018, totaling 1500 individuals. To enhance data integrity and analytical accuracy, we applied the following exclusion criteria: first, we excluded 3 pregnant women. Second, we excluded 493 individuals due to missing data on key covariates, which prevented comprehensive analysis. After these screening steps, the final sample size included in the analysis was 1004 individuals.
DR status was determined through participant responses to the following questions: “Have you ever been told by your doctor that diabetes is affecting your eyes?” and “Have you ever been diagnosed with retinopathy?”. This approach was based on previously published literature, which supported its reliability in assessing the status of patients with diabetic retinopathy (16–19).
The NHANES Public Use Linked Mortality File, which combines NHANES data with death certificate information from the National Death Index, was the source of the mortality data. The file was updated as of December 31, 2019 (20). Every participant’s follow-up period was determined by taking the date of their NHANES enrollment and adding the date of their death or the follow-up period’s expiration.
Variable selection was conducted based on previous literature and clinical characteristics (21–23), we collected the following potential characteristics: demographic information including age, sex (male and female), race (Mexican American, other Hispanic, non-Hispanic white, non-Hispanic black, and other races), education level (less than high school, high school or equivalent, and college and above), marital status (married/living with a partner, widowed/divorced/separated, and never married), and poverty income ratio (PIR). For physical examination, we recorded body mass index (BMI). For lifestyle, smoking history (having smoked at least 100 cigarettes in a lifetime), drinking (having consumed at least 12 drinks of any type of alcoholic beverage in any given year), and physical activity (engaging in vigorous activity for at least 10 minutes, which leads to significant sweating or a marked increase in breathing rate and heart rate) were assessed. For disease history, we looked at hypertension, congestive heart failure (CHF), coronary heart disease (CHD), stroke, and cancer, all of which were obtained by patient self-report or physician diagnosis. Relevant disease information can be found at https://wwwn.cdc.gov/nchs/nhanes/search/default.aspx. In addition, we obtained information on whether patients used insulin and other diabetes medications through questionnaires, as well as total cholesterol, high-density lipoprotein cholesterol, glycosylated hemoglobin, creatinine, white blood cells, lymphocytes, monocytes, red blood cells, and platelets from laboratory tests.
The dataset was divided 7:3 into training and test sets. The most important predictors in the training set were found using the least absolute shrinkage and selection operator (LASSO) regression model. These predictors were then used in a Cox proportional hazards regression analysis to identify independent predictors, with significance defined as a p-value of less than 0.05. The hazard ratio (HR) and their 95% confidence intervals were calculated. A nomogram was subsequently constructed using the identified predictors.
The accuracy and performance of the risk prediction models were evaluated using several metrics. Receiver Operating Characteristic (ROC) curves were employed to assess model performance over time, with the area under the ROC curve (AUC) used as an indicator of accuracy; values closer to 1 represent better predictive performance (24). The concordance index (C-Index) was used to evaluate the discrimination performance of the model in more detail. A C-index of 0.7 or greater was deemed to represent good discrimination (25). The exact calculation of the C-Index is described in the Supplementary Material provided. Calibration curves were utilized to evaluate the model’s calibration, with an ideal 45-degree line indicating that observed probabilities matched expected probabilities. Lastly, Decision Curve Analysis (DCA) is a method used to evaluate the practical value of predictive models in clinical decision-making. This analysis achieves its purpose by comparing the net benefits of different decision strategies within a specific range of decision thresholds. Here, “net benefit” refers to the net effect after considering the benefits and losses associated with false positives and false negatives. The core principle of DCA is to quantify the utility of predictive models at specific clinical decision thresholds and compare it with other decision strategies, such as treating all patients or treating none. This method provides clinicians with an effective tool to select the optimal treatment approach in actual decision-making processes (26).
The interquartile range (IQR) and median were used to summarize non-normally distributed continuous variables, and percentages and frequencies were used to describe categorical variables. The Mann-Whitney U test was used to assess group differences for non-normally distributed continuous data, while the chi-square test was used to analyze differences in categorical variables.
R software version 4.3.2 was used for all statistical analyses, and a p-value of less than 0.05 was deemed statistically significant.
This study included 1004 participants in total (Figure 1), with a median age of 63 years. Of these, 456 (45.42%) were women and 548 (54.58%) were men. A median follow-up length of 79 months was observed, during which 354 deaths among DR patients took place. We divided the dataset in a 7:3 ratio between a training set (701 participants) and a test set (303 participants) to achieve a balanced division. Participants in the training set had a median age of 64 years, with 389 (55.49%) men and 312 (44.51%) women. The test set had a median age of 63 years, with 159 (52.48%) males and 144 (47.52%) females. There were statistically significant variations between the two groups in terms of lymphocyte count, platelet count, PIR, cancer, and marital status (P<0.05). Nevertheless, no statistically significant variations were observed in other broad clinical characteristics or laboratory test results (Table 1).
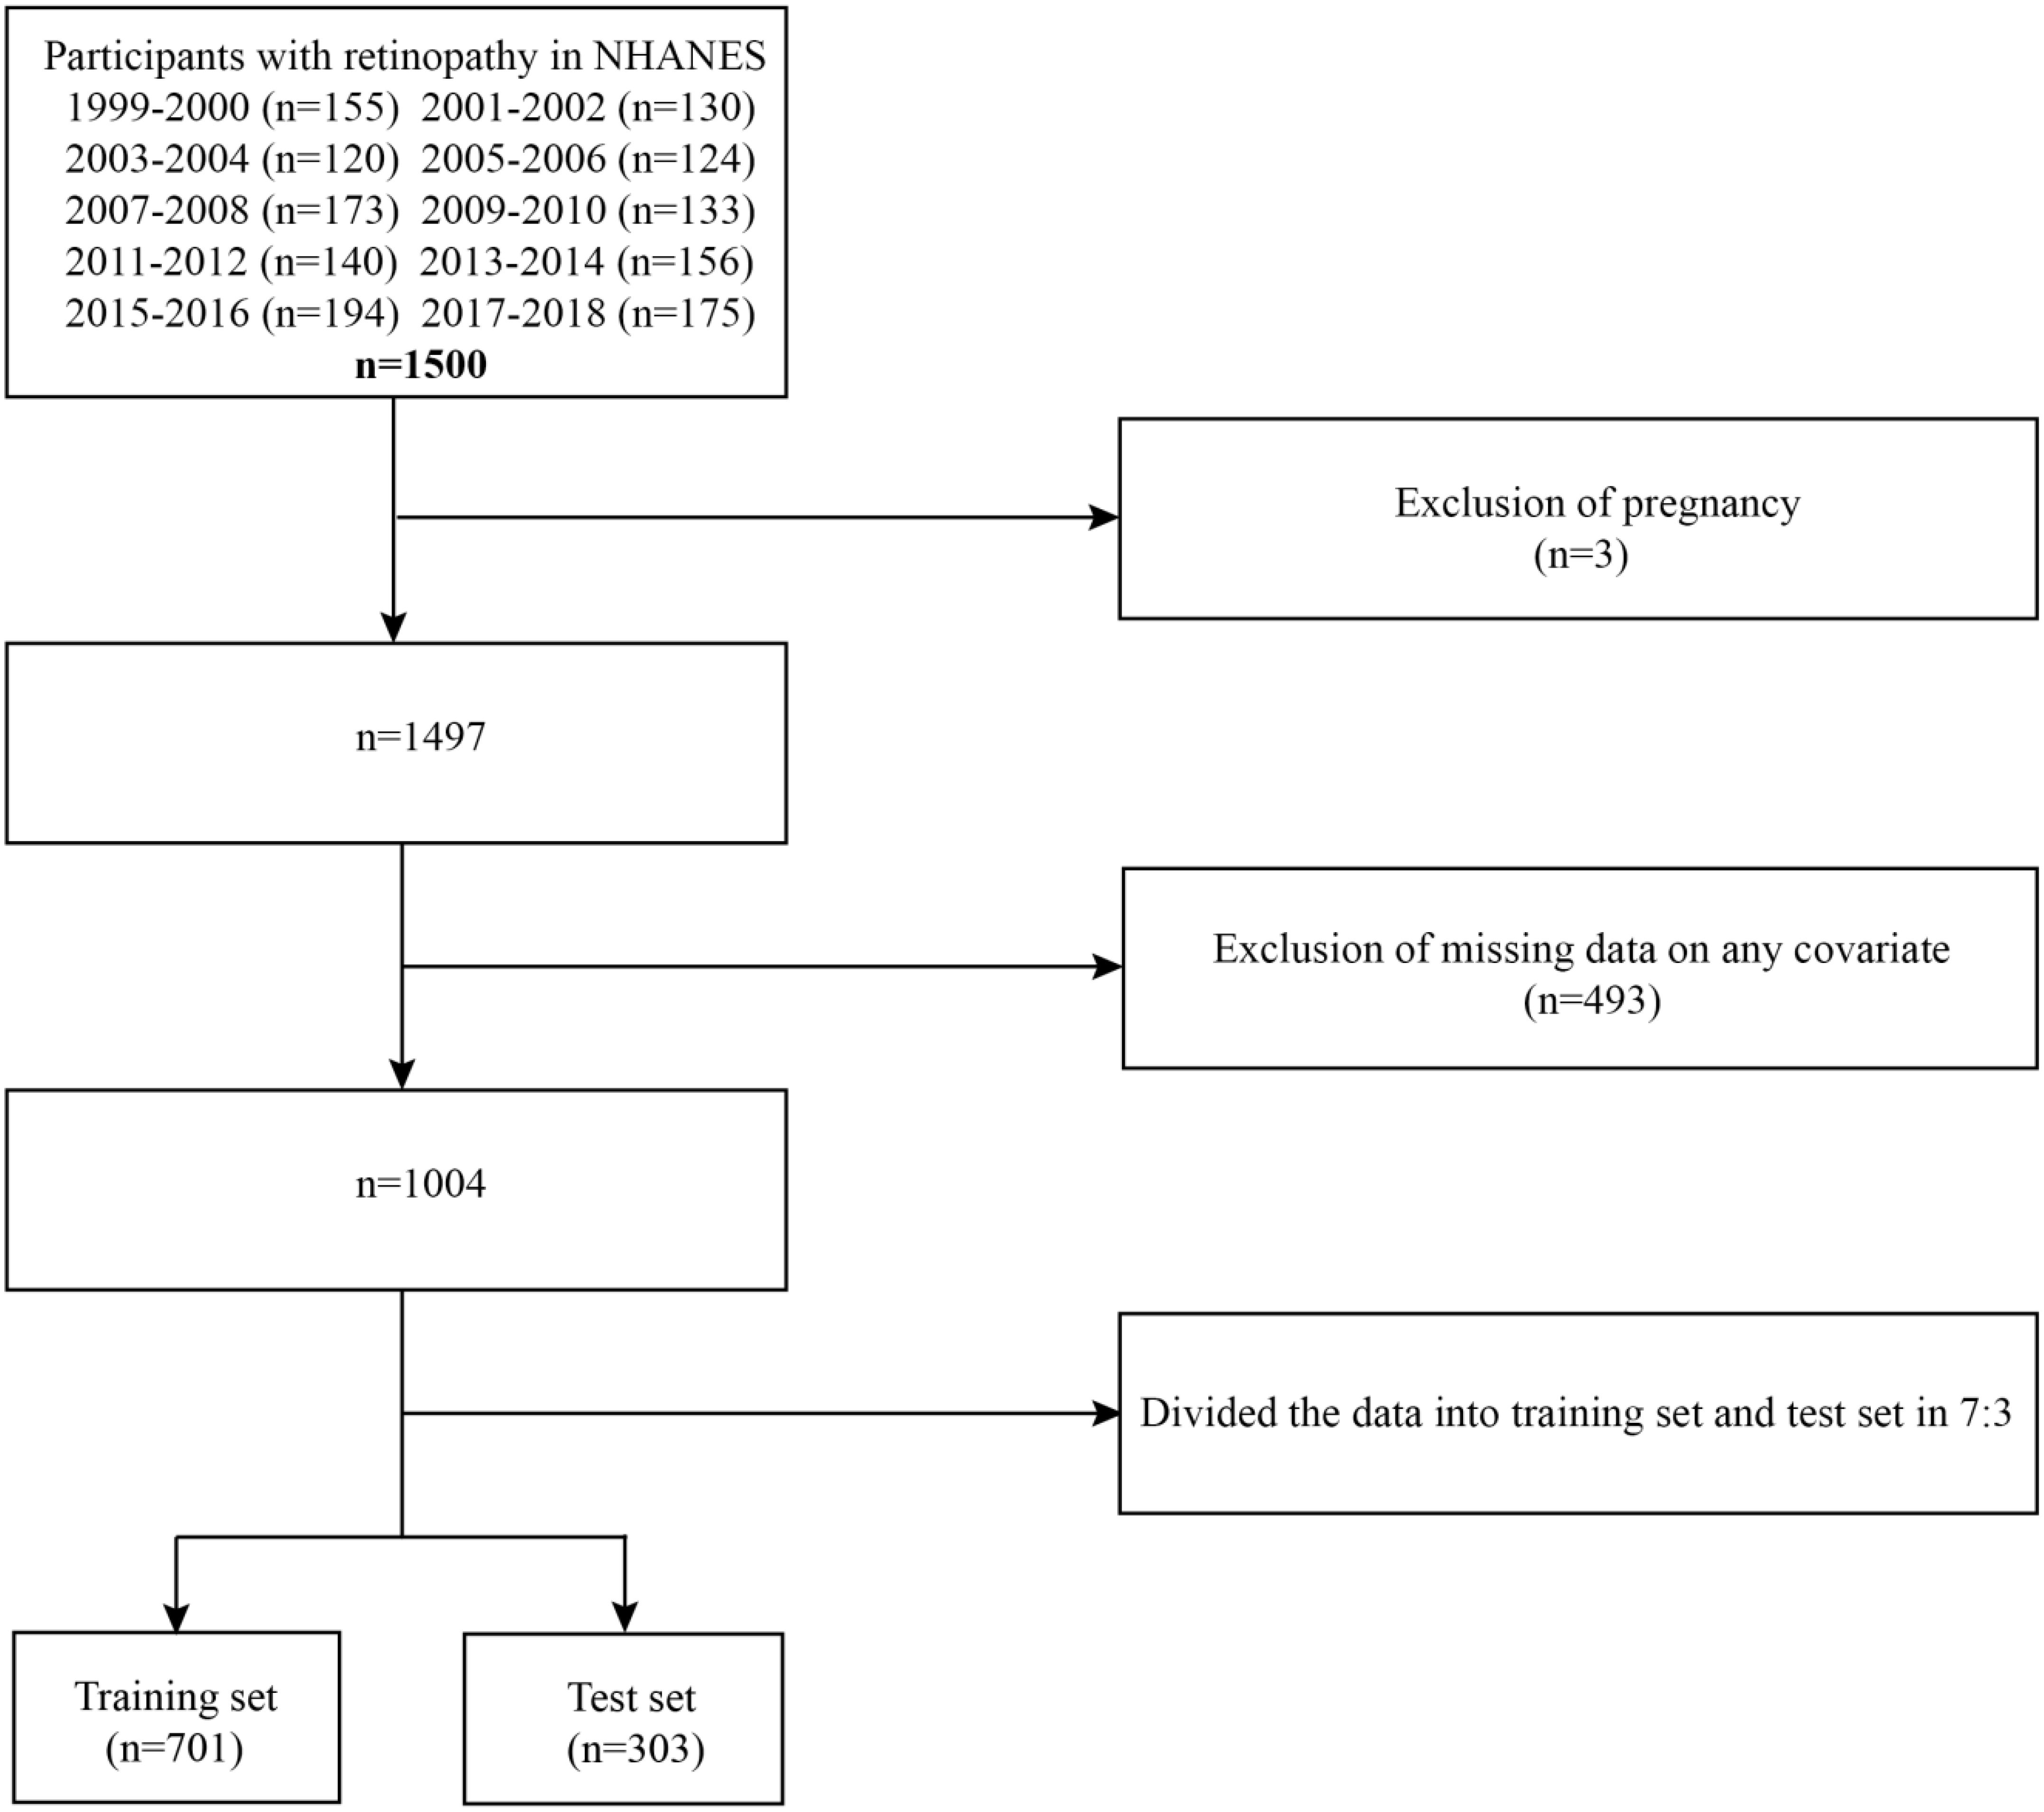
Figure 1. Flowchart of training and test sets.
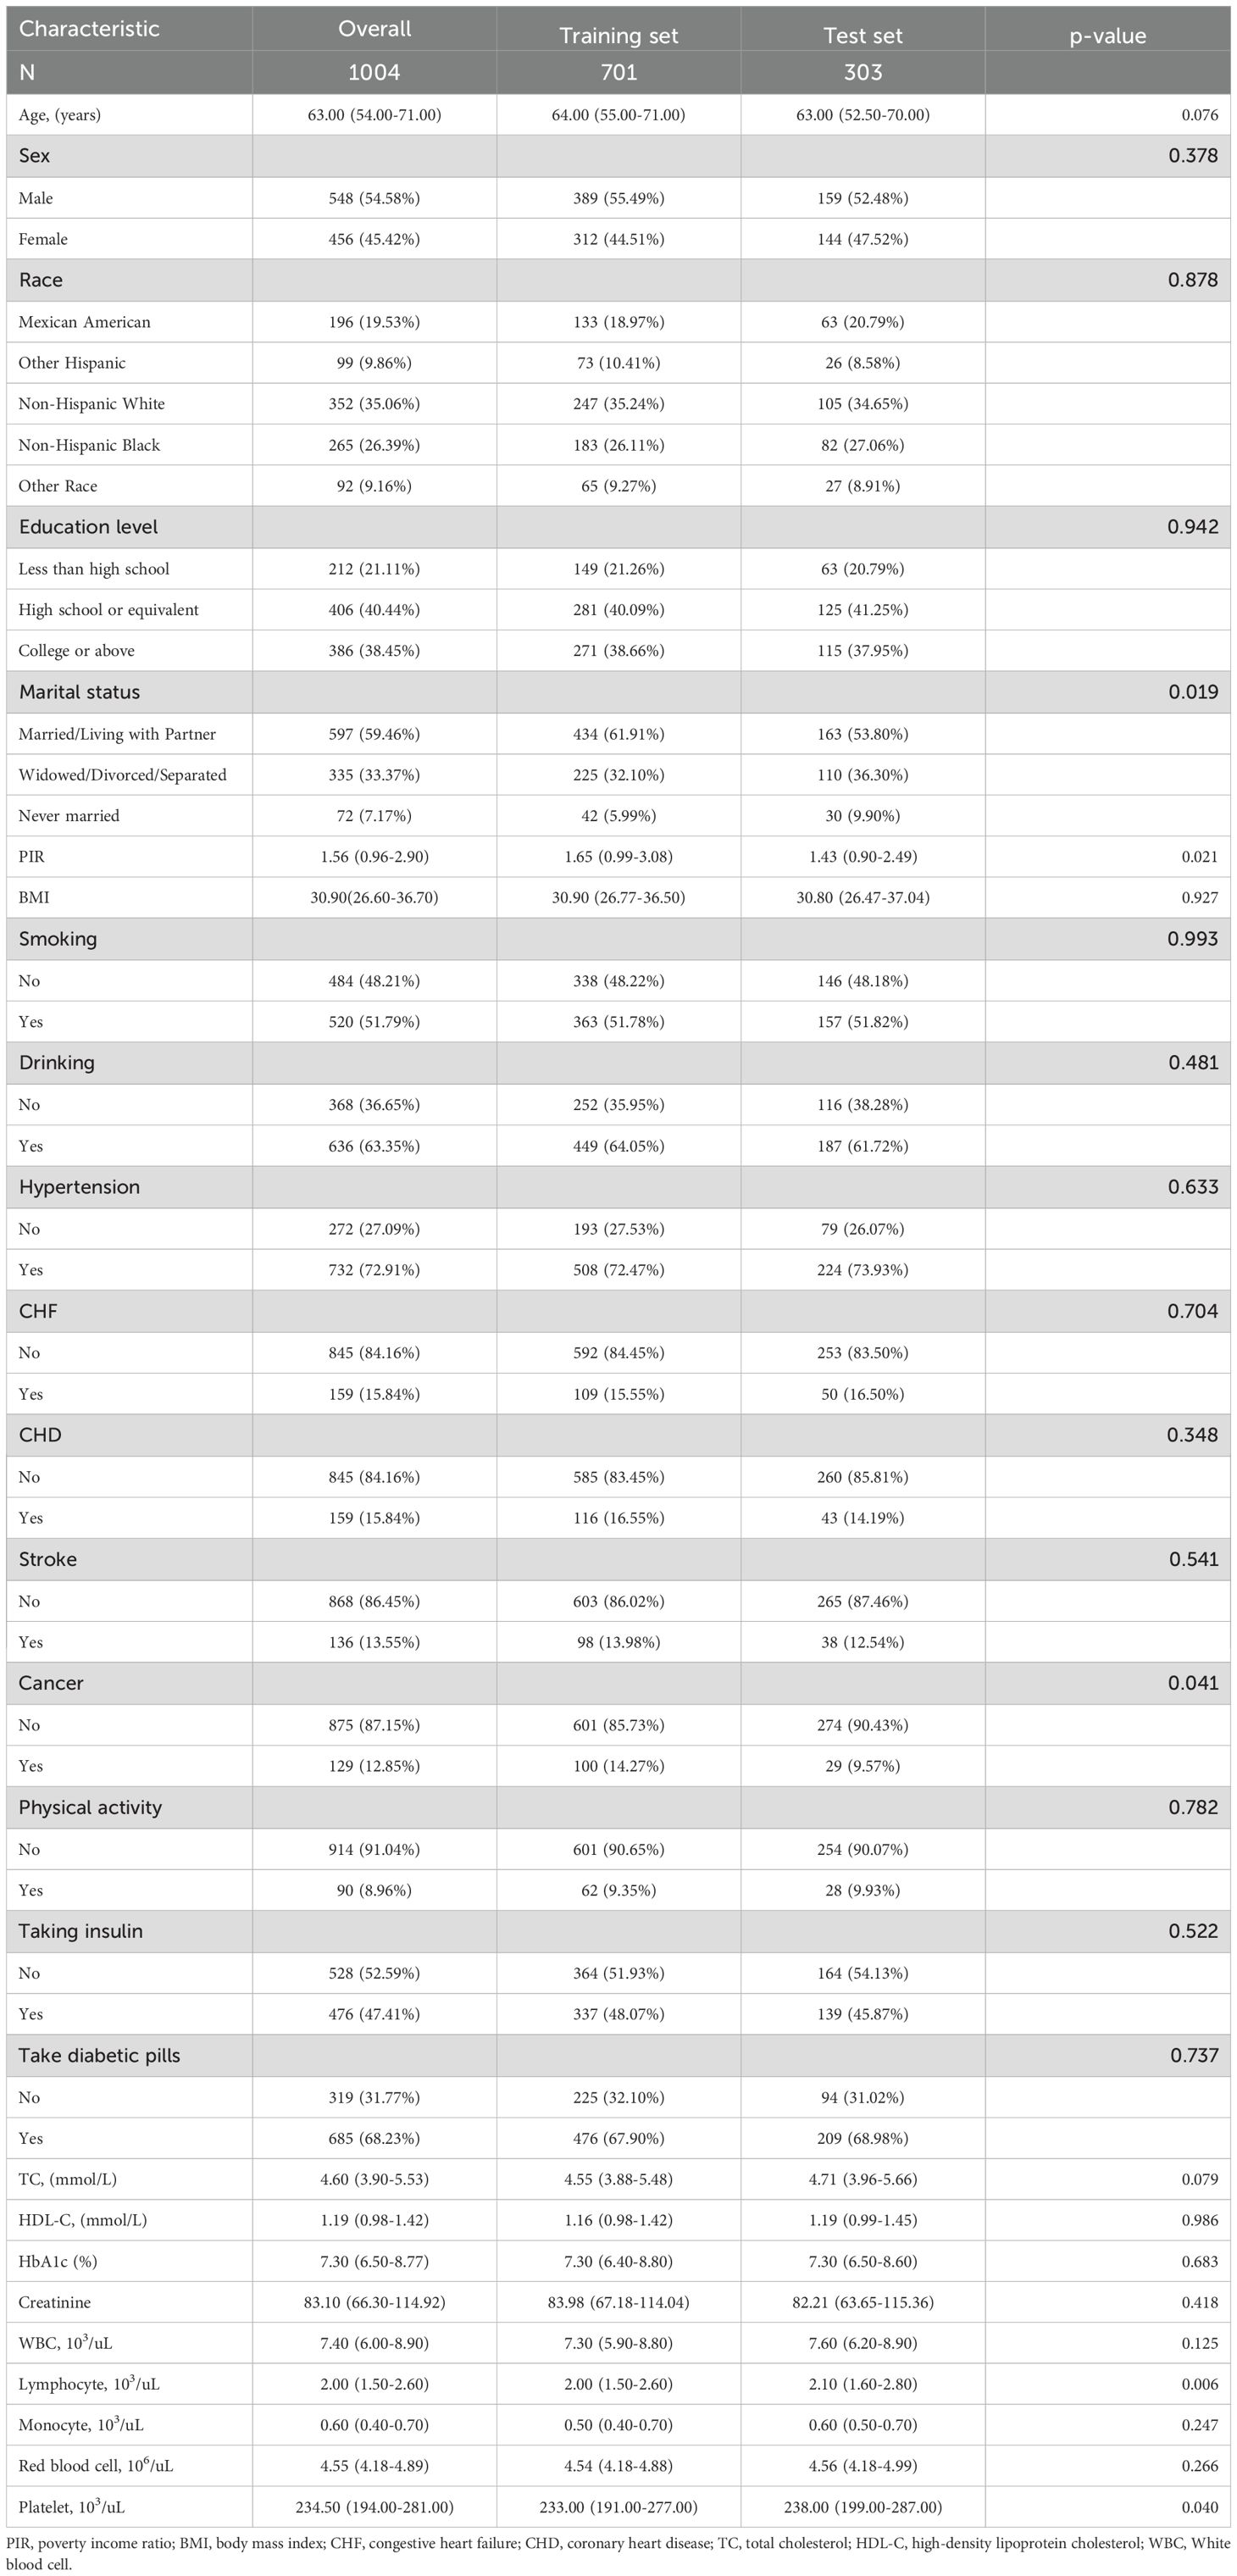
Table 1. Baseline characteristics of patients in the training and test sets.
In the training set, we used the LASSO regression model to identify nine factors with non-zero coefficients, including age, marital status, PIR, CHF, CHD, stroke, taking insulin, red blood cell count, and creatinine levels (Figure 2). Using multivariable Cox proportional hazards regression analysis, seven of these variables were further found to be independent predictors of mortality risk in patients with DR. The independent predictors were: age (HR: 1.05, 95% CI: 1.04-1.07), marital status (divorced/widowed/separated HR: 1.13, 95% CI: 0.85-1.50 compared to married; never married HR: 2.06, 95% CI: 1.19-3.58), CHF (HR: 1.58, 95% CI: 1.12-2.24), CHD (HR: 1.45, 95% CI: 1.04-2.01), stroke (HR: 1.41, 95% CI: 1.01-1.98), taking insulin (HR: 1.31, 95% CI: 1.01-1.71), and creatinine levels (HR: 1.00, 95% CI: 1.00-1.00) (Supplementary Table S1). These seven independent predictors were then used to construct the nomogram (Figure 3).
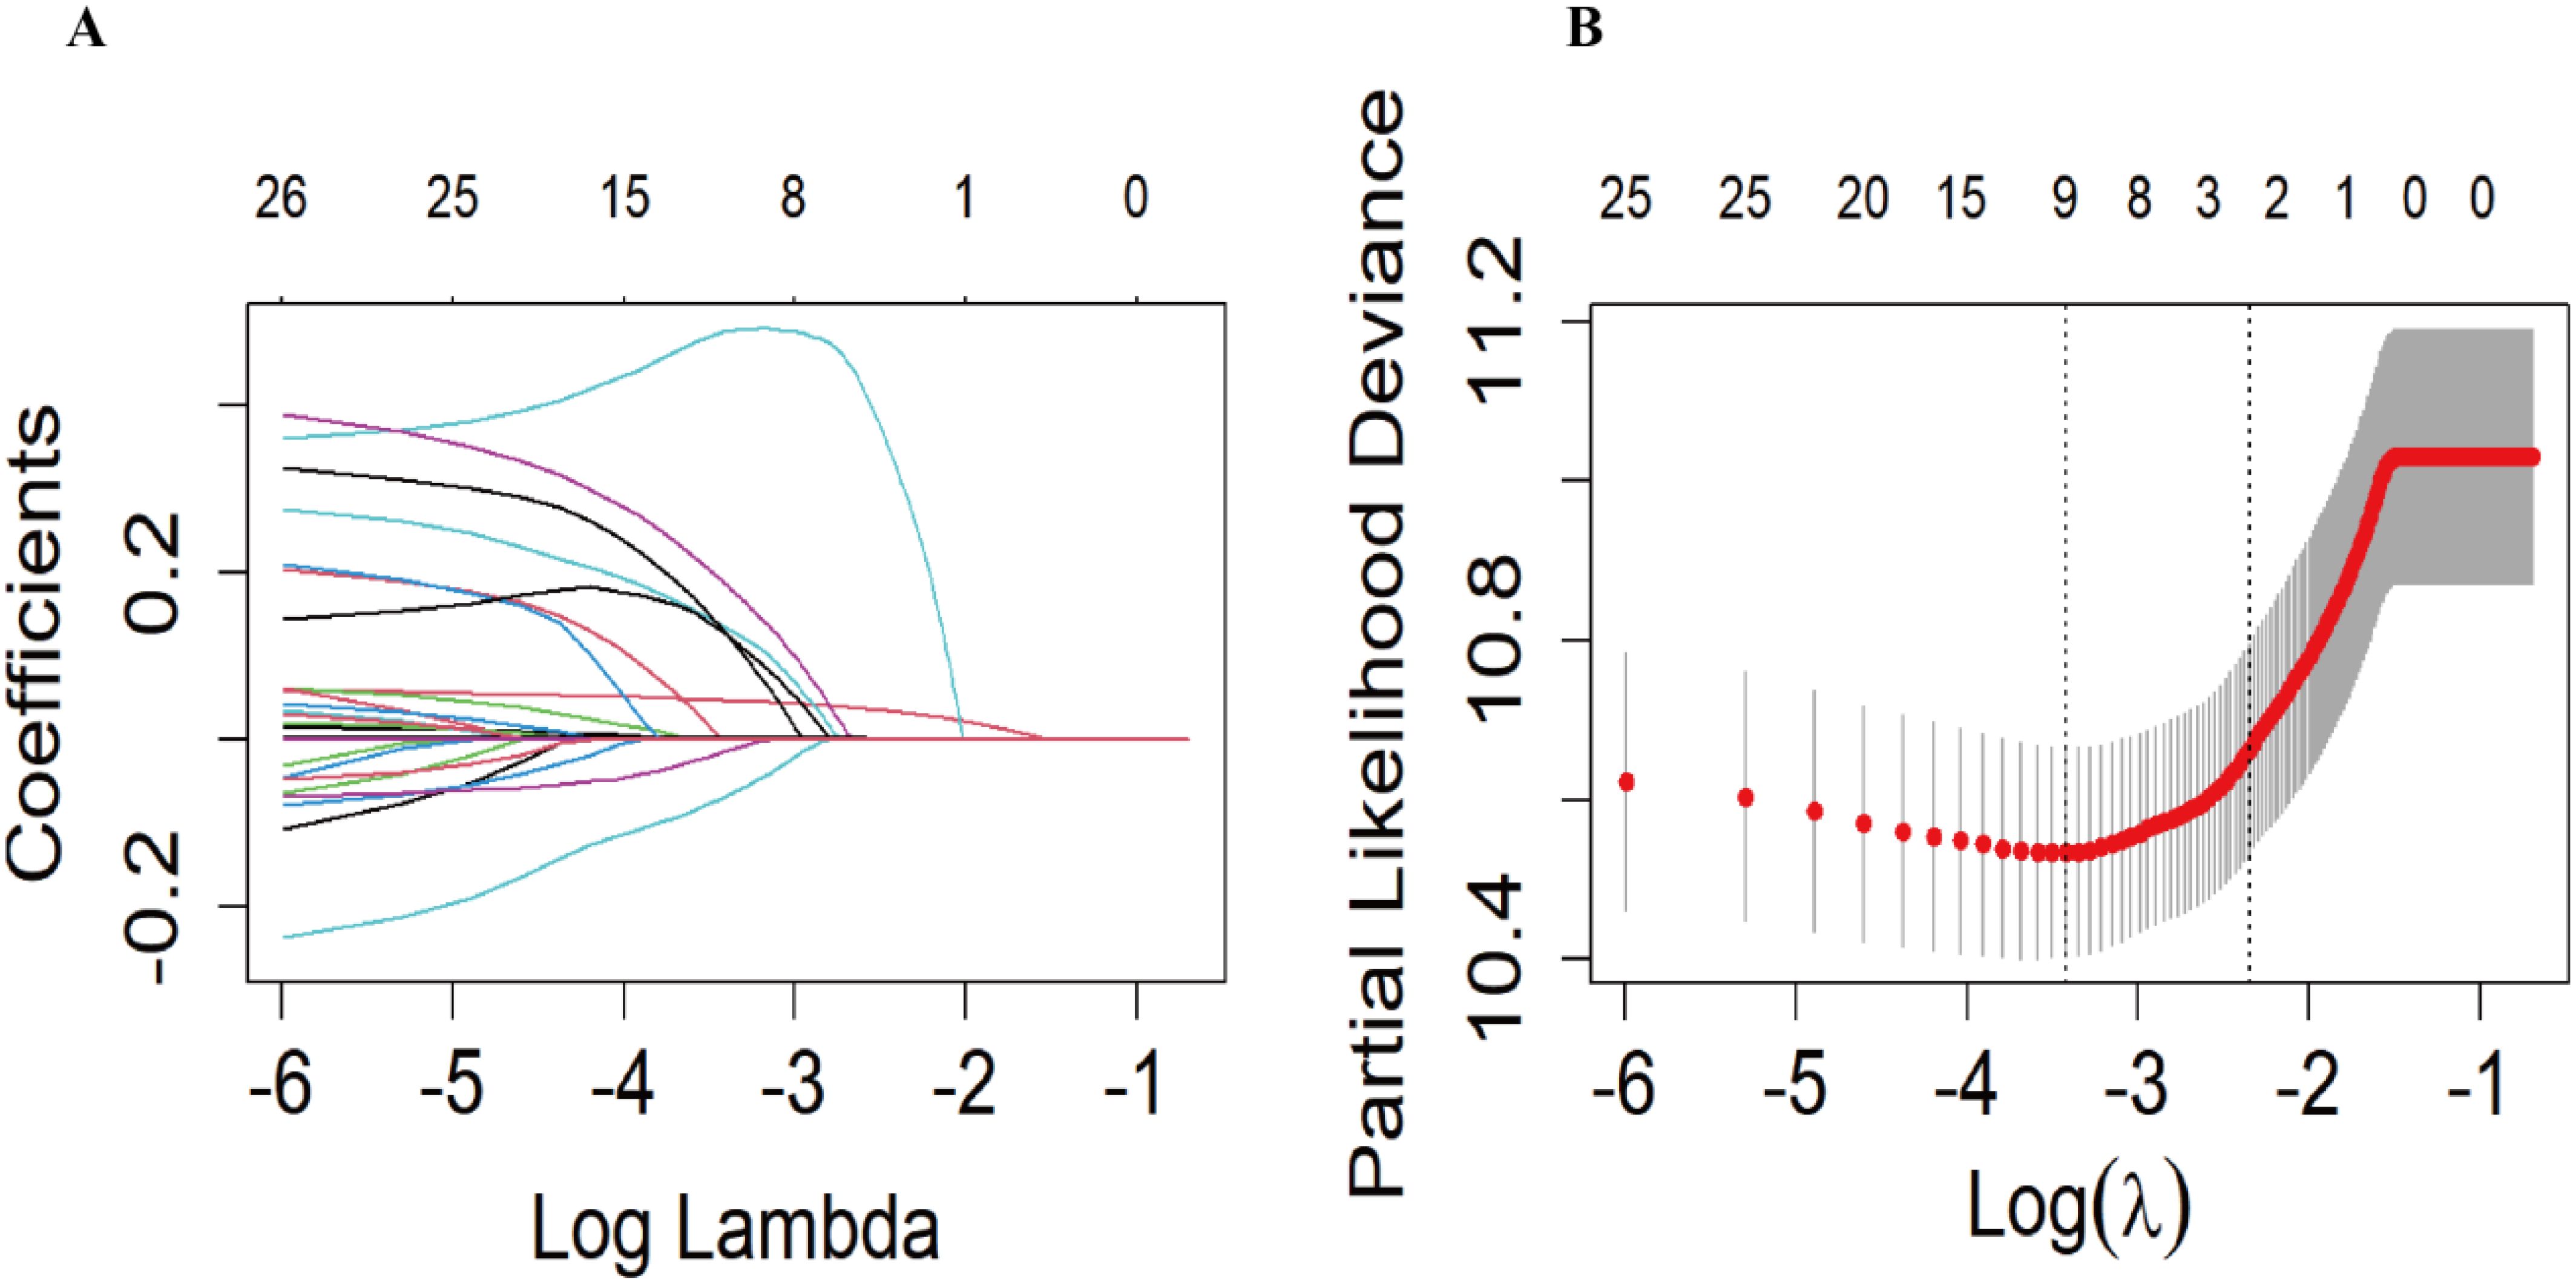
Figure 2. The Least absolute shrinkage and selection operator (LASSO) regression model was used to screen the predictors. (A) Generation of coefficient curves based on log(lambda) sequences with nonzero coefficients generated by optimal lambda. (B) The optimal parameters (lambda) in the LASSO model were selected by 10-fold cross-validation based on the minimum criterion. Vertical dashed lines are drawn on the optimal values based on the minimum mean square error (left side).
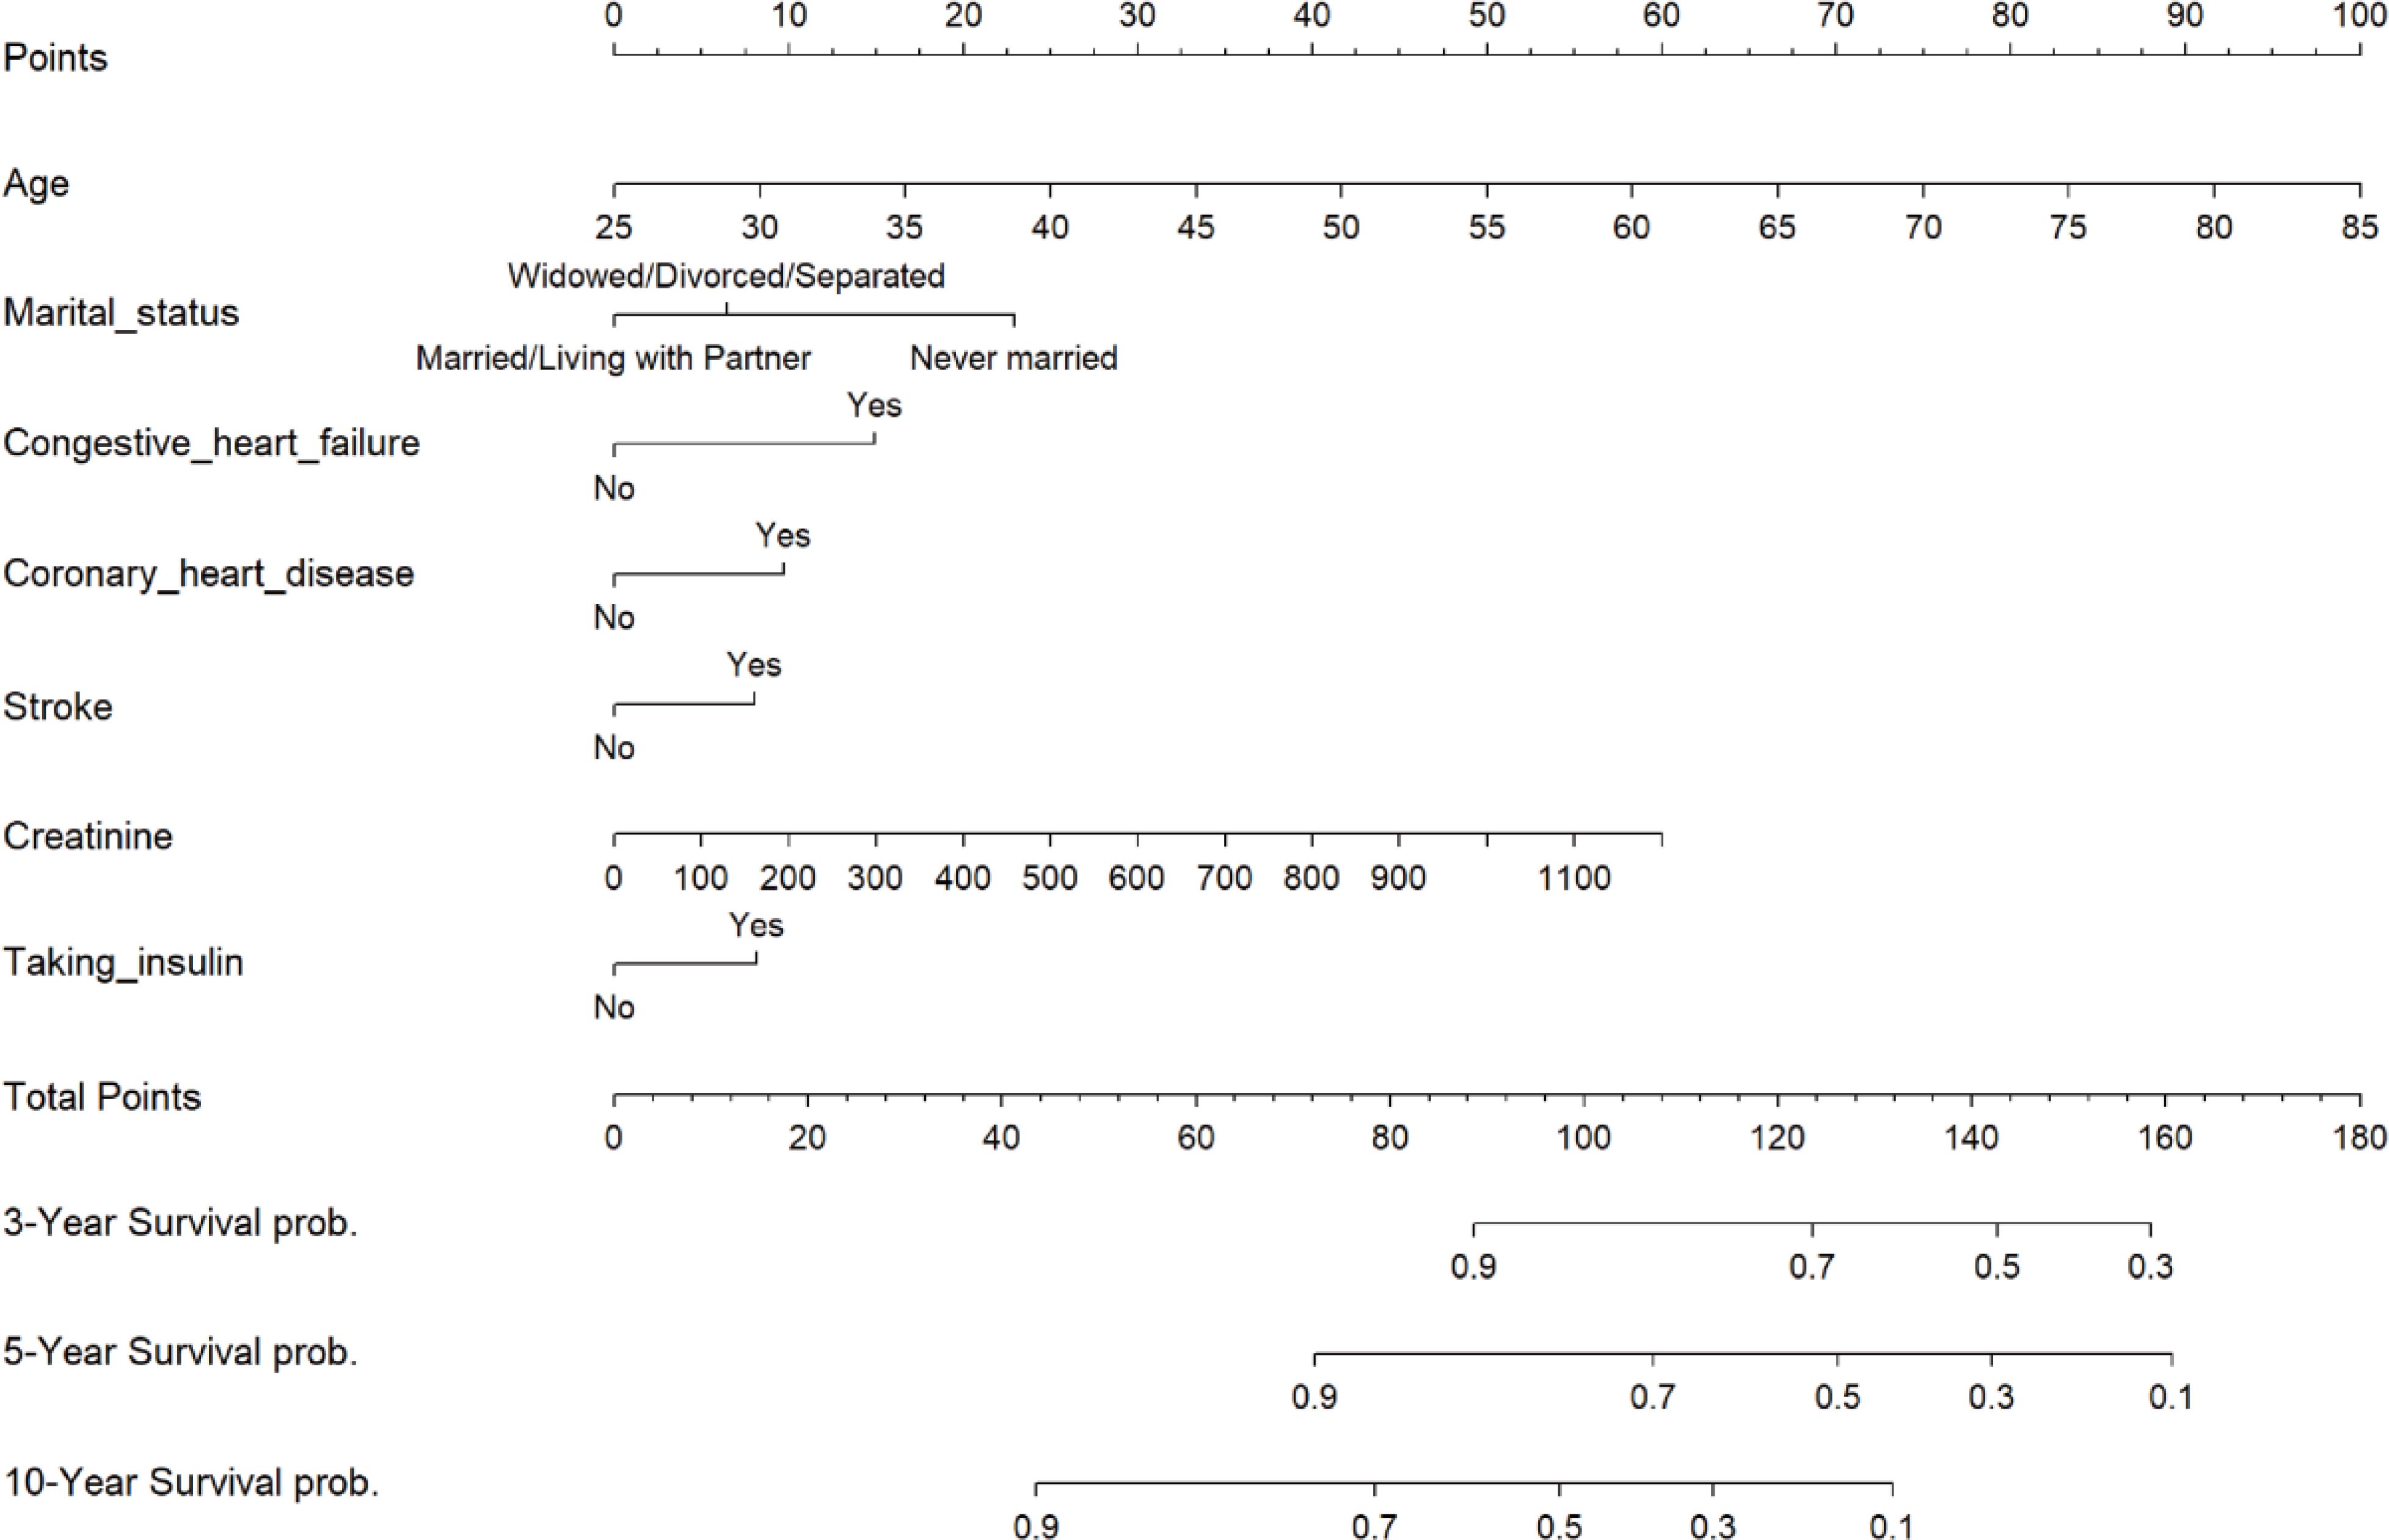
Figure 3. Nomogram of risk of all-cause mortality after 3, 5, and 10 years in patients with diabetic retinopathy. .
To evaluate the robustness of the constructed clinical prediction models, we tested them using both the training and test sets and calculated the overall C-index of the models. For the training set, the nomogram model’s C-index was 0.738 (95% CI: 0.704-0.771), and for the test set, it was 0.716 (95% CI: 0.663-0.768). Furthermore, a time-dependent receiver operating characteristic (ROC) curve analysis was conducted to evaluate the nomogram model’s prediction accuracy for the probability of all-cause mortality at various time intervals. The results showed that in the training set, the AUC values of the model for predicting 3-, 5-, and 10-year all-cause mortality risk were 0.739, 0.765, and 0.808, respectively, while in the test set, these values were 0.737, 0.717, and 0.732, respectively (Figure 4).
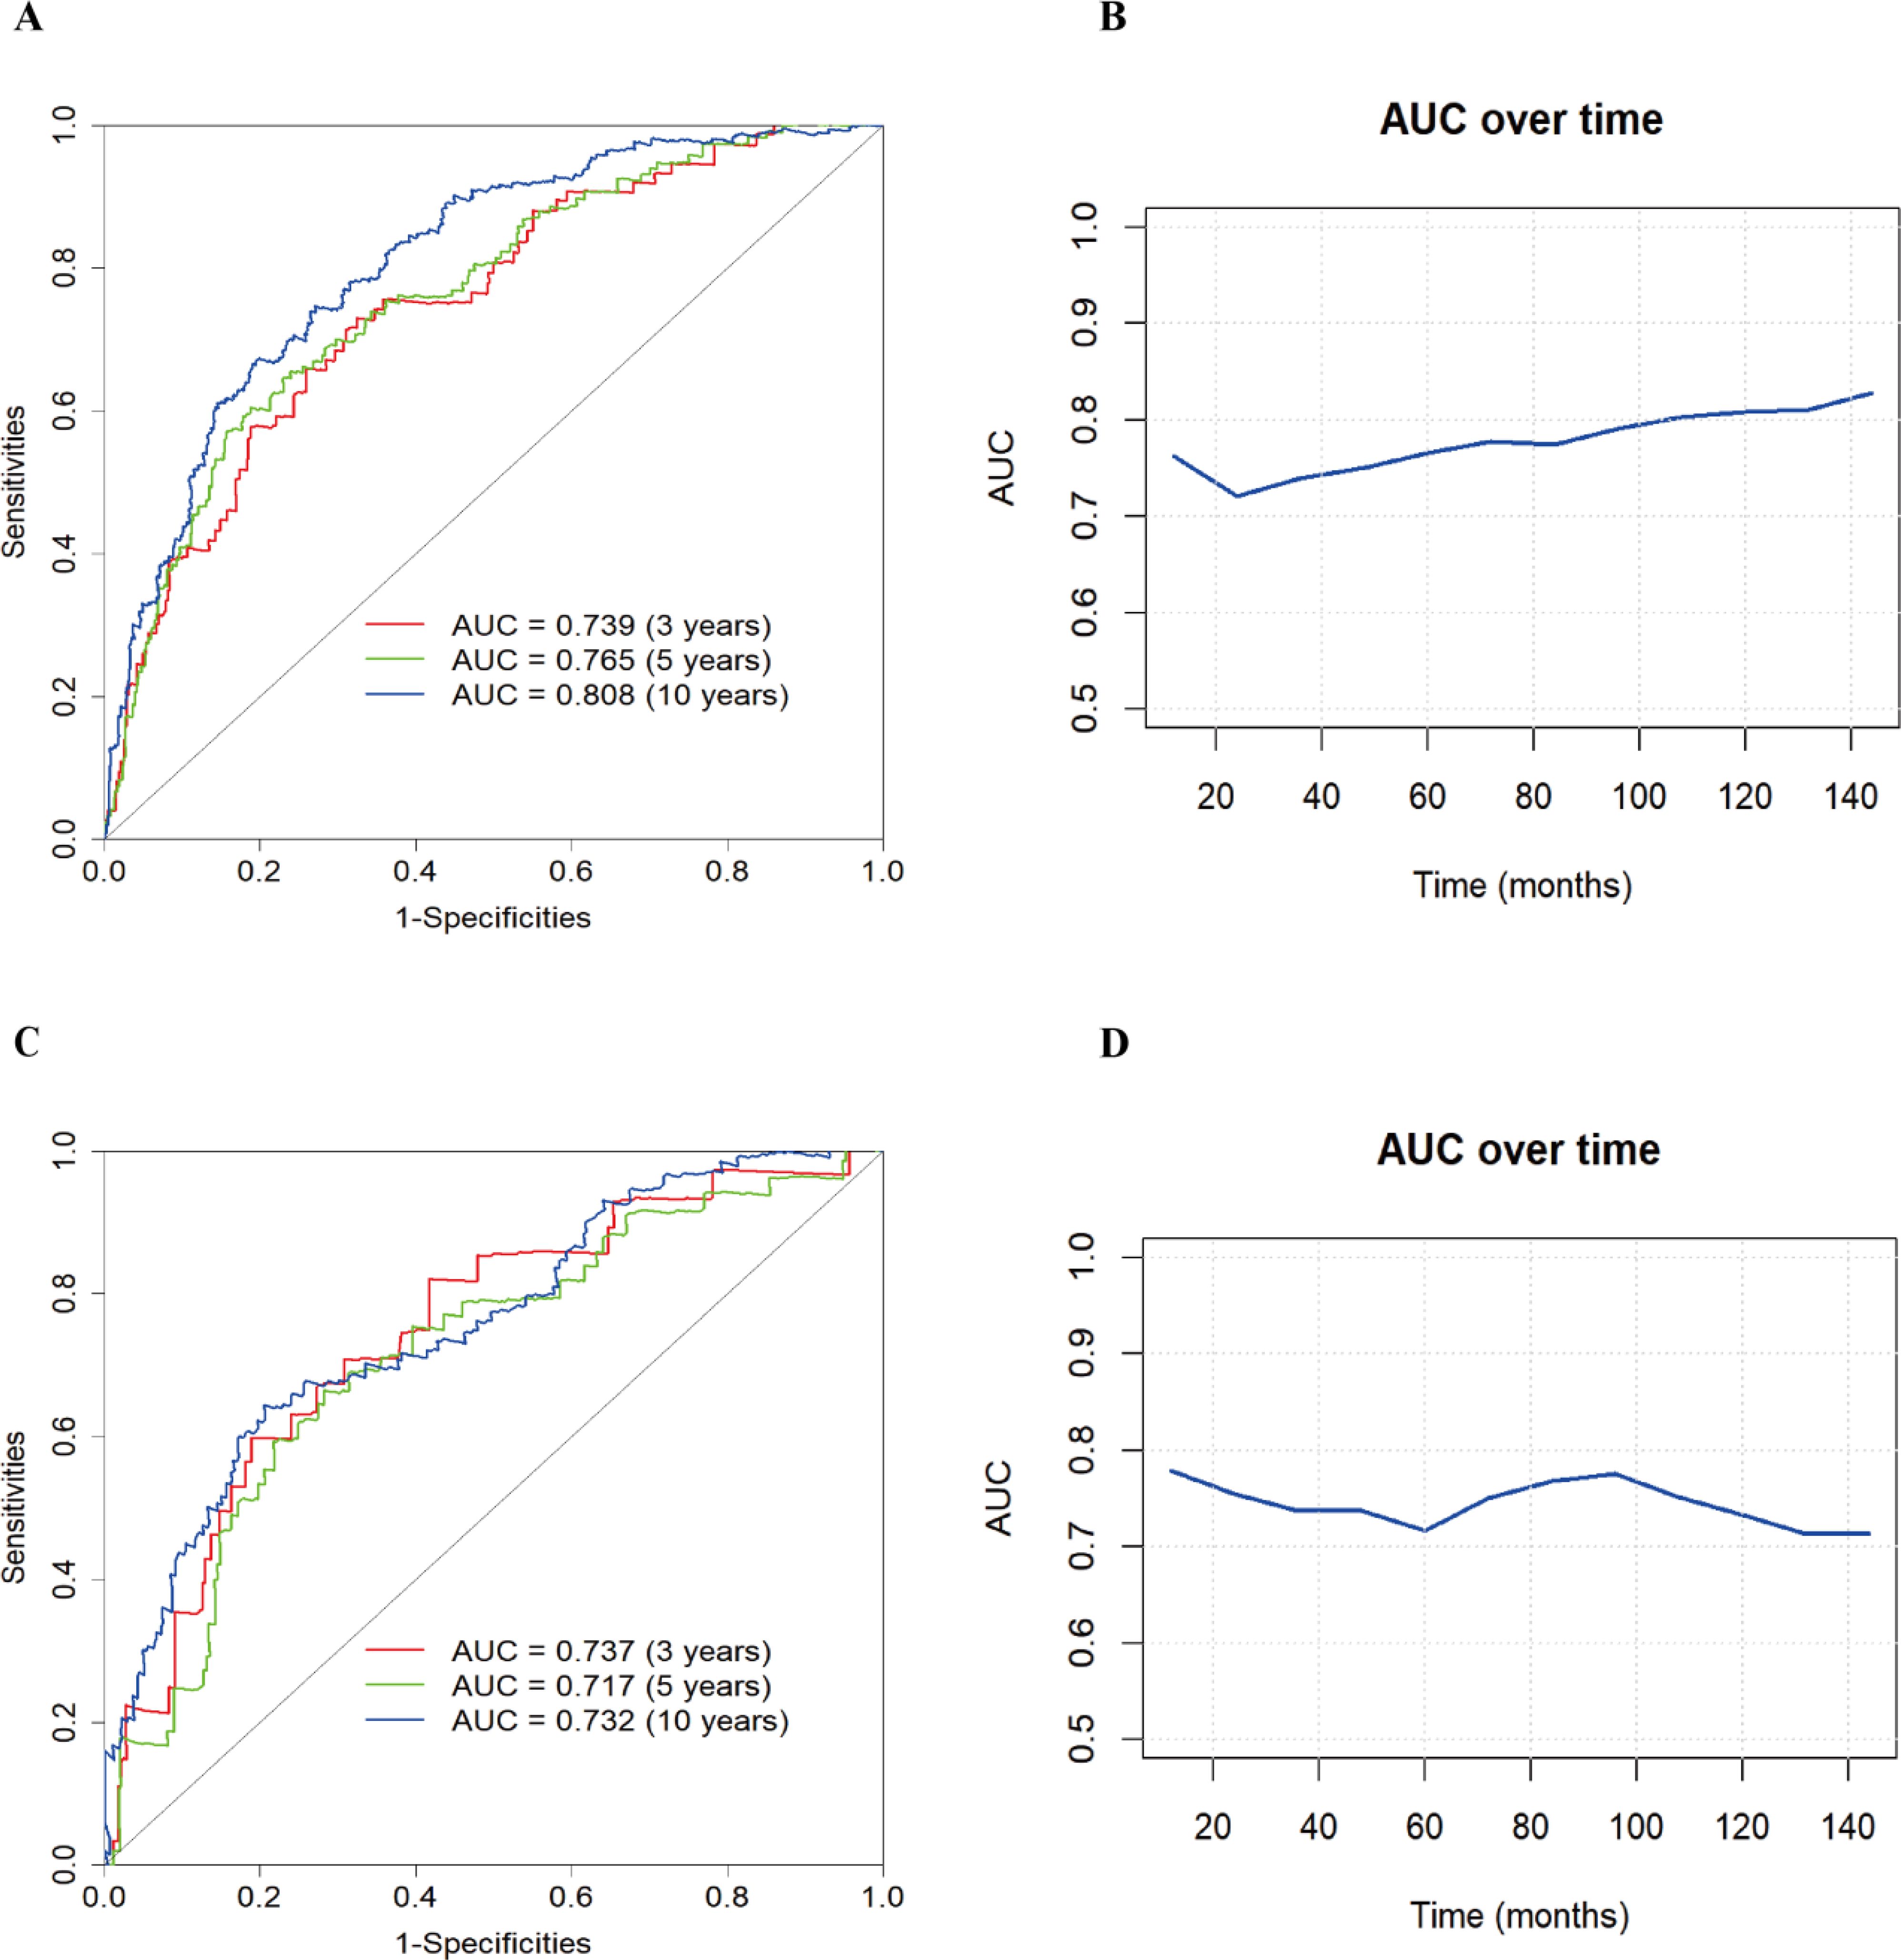
Figure 4. Nomogram modeling of all-cause mortality in patients with diabetic retinopathy for ROC analysis and AUC curves over time. (A) ROC curve of the training set; (B) AUC curve of the training set; (C) ROC curve of the test set; (D) AUC curve of the test set.
The calibration curves of the nomogram model for both the training and test sets demonstrated that the predicted probabilities closely aligned with the actual observed probabilities, forming a relationship that roughly followed a 45-degree diagonal line. This indicates that the nomogram model has a good agreement between predicted and actual event probabilities (Figure 5).
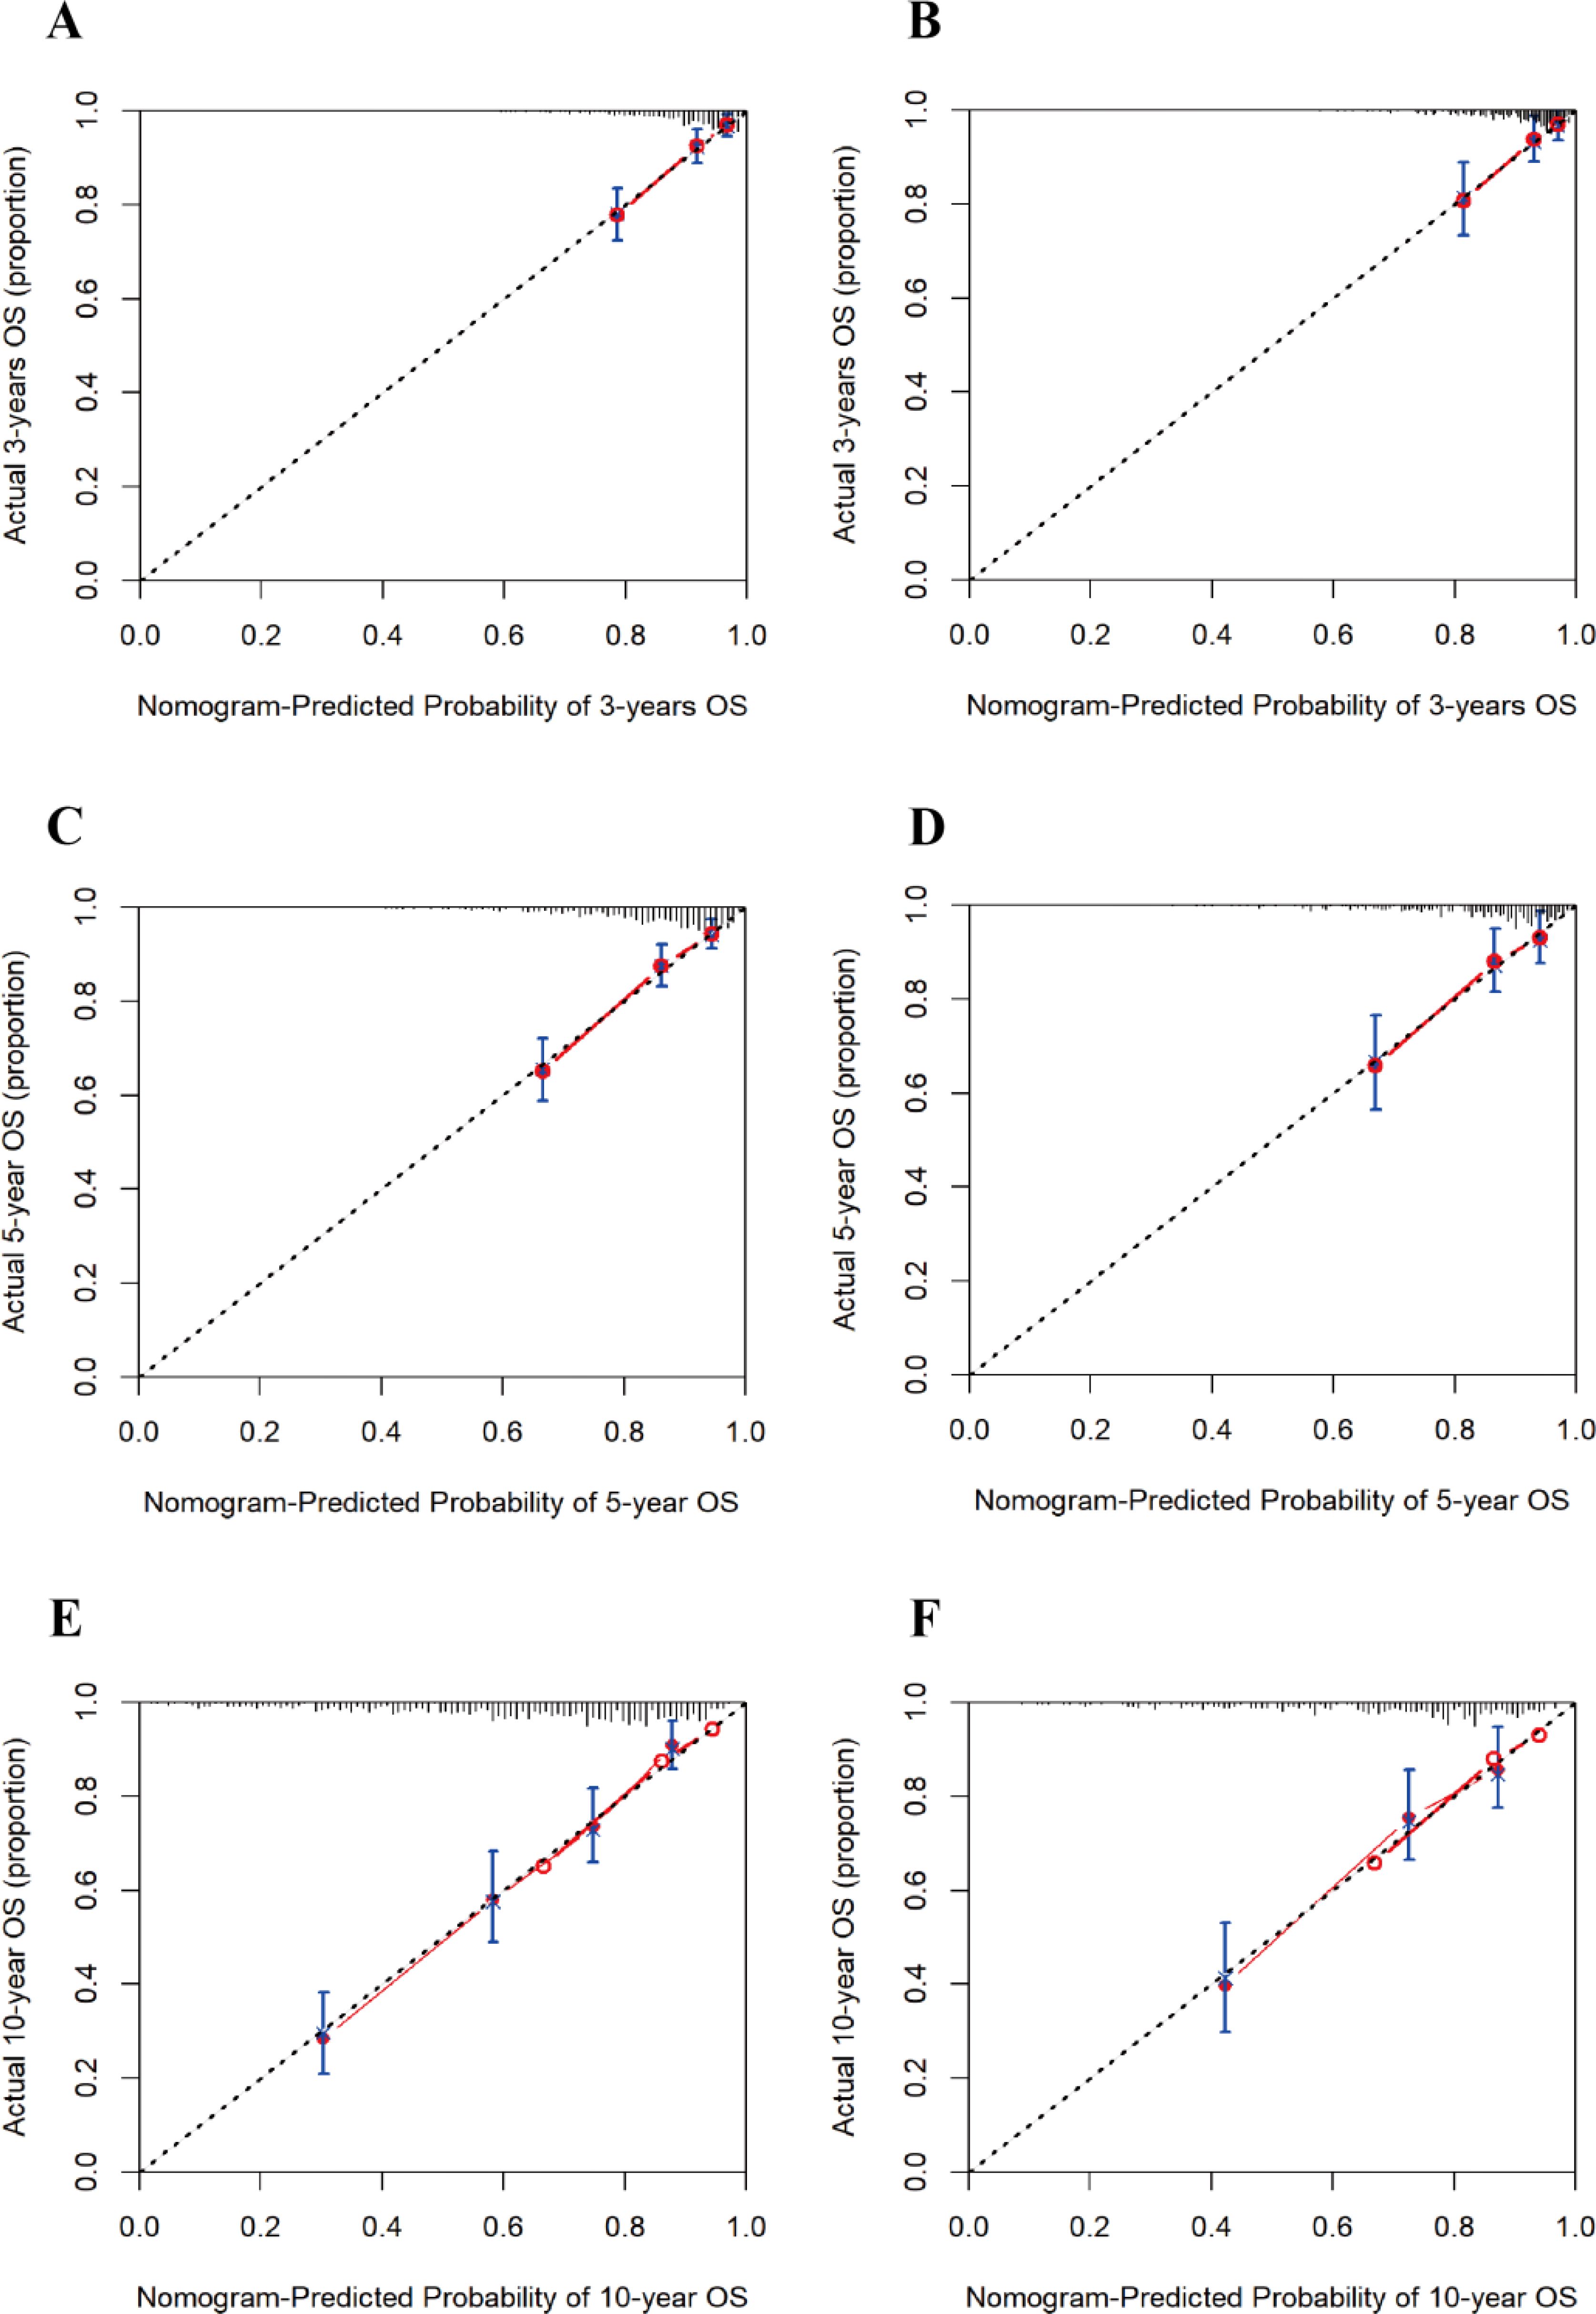
Figure 5. Calibration curves for 3-, 5-, and 10-year risk of all-cause mortality in patients with diabetic retinopathy. (A) 3-year training set; (B) 3-year test set; (C) 5-year training set; (D) 5-year test set; (E) 10-year training set; (F) 10-year test set.
Furthermore, our research findings indicated that in decision analysis, the model curve was above the “All (all interventions)” line and the “None (no interventions)” line within the clinically relevant threshold range. This finding suggested that the model could provide significant net benefits in clinical applications, supporting its potential value in actual medical decision-making. Specifically, as the prediction time extended, we observed that the net benefits of the 10-year diabetes mortality risk prediction were significantly greater than those of the 3-year and 5-year predictions. This suggested that clinicians could use the model to make more informed decisions among multiple treatment options, thereby potentially improving patient prognosis and survival outcomes (Figure 6). Collectively, these results supported the clinical applicability of the nomogram model and provided a reliable foundation for patient risk assessment.
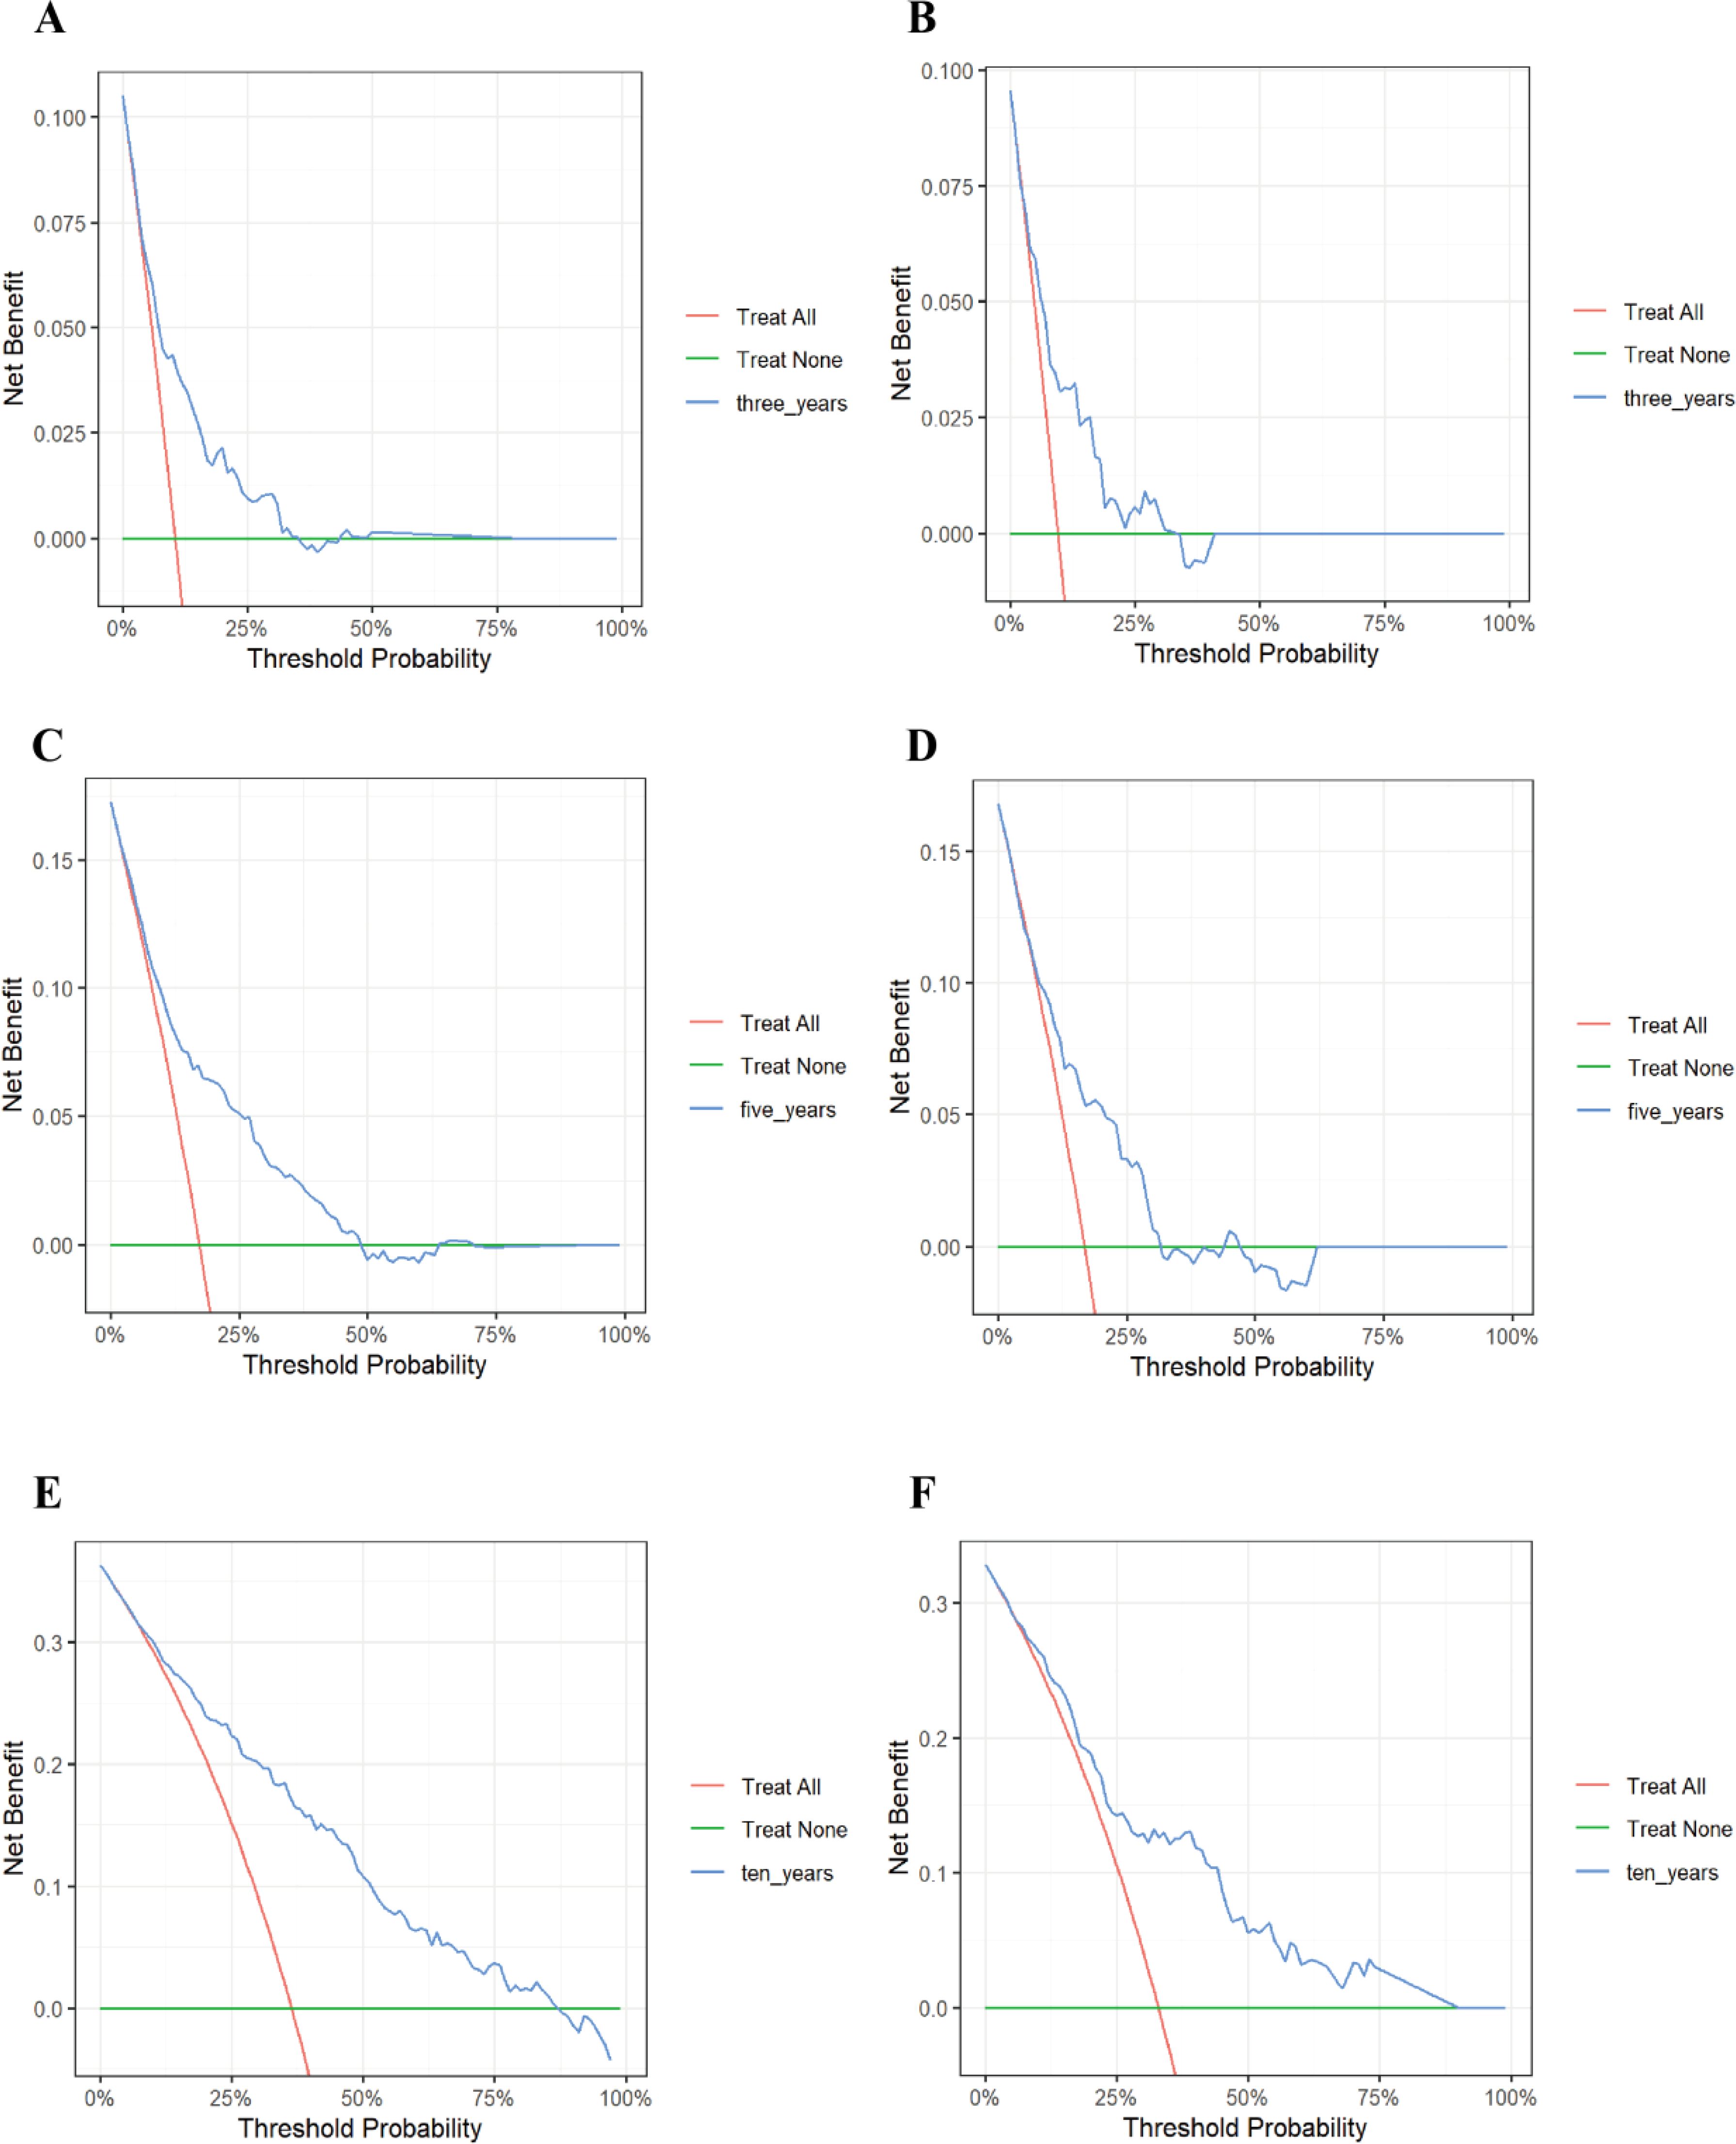
Figure 6. Decision curve analysis of the 3-, 5-, and 10-year risk of all-cause mortality in patients with diabetic retinopathy. (A) 3-year training set; (B) 3-year test set; (C) 5-year training set; (D) 5-year test set; (E) 10-year training set; (F) 10-year test set. The vertical coordinate represents the net benefit and the horizontal coordinate represents the critical probability. The red line represents “All” (assuming all participants receive the intervention), while the green line represents “None” (assuming all participants do not receive the intervention). The blue line is the DCA curve then reflects the net benefit at different decision thresholds. If the model consistently remains above the “All” line and the “None” line across a broad range of threshold values, this indicates that the model possesses practical applicability in various clinical contexts.
To date, there are no satisfactory predictive tools that effectively identify the risk of all-cause mortality in patients with DR. To address this issue, we constructed a nomogram using the NHANES database from 1999 to 2018, aiming to accurately assess the likelihood of all-cause mortality in this specific population. The model included seven predictors: age, marital status, CHF, CHD, stroke, creatinine level, and taking insulin. The model showed excellent discriminative ability in both the training and test sets, with C-indexes of 0.738 and 0.716, respectively, demonstrating the great accuracy of the model in identifying the risk for mortality for various patients. Furthermore, the calibration curve analysis results showed that the model had very high accuracy in both groups, demonstrating a strong correlation between the model’s predictions and the actual observations. To further validate the clinical utility of the model, DCA was performed, which showed that the model provided good clinical decision support at different thresholds.
Our study found that the risk of death in patients with DR increased significantly with increasing age. Age is an important factor affecting the health status of diabetic patients, and higher age is usually accompanied by multiple comorbidities, which further aggravate the patient’s burden and increase the risk of death (27). Studies have shown that in older diabetic patients, the incidence of cardiovascular disease and nephropathy is significantly higher than in younger patients, leading to a significant increase in their all-cause mortality (28, 29). Additionally, the incidence of DR increased with age, which was closely related to the aging of retinal blood vessels and the long-term effects of diabetes on the microvasculature (30, 31). At the same time, older patients often face additional challenges in diabetes management, including drug interactions, comorbidity management, and decreased quality of life, all of which may lead to decreased treatment adherence and thus further increase the risk of death (32–34). Therefore, individualized management strategies for elderly patients with DR are particularly important to reduce their risk of death and improve their quality of life. Marital status has a significant effect on the risk of death in patients with DR. Studies have shown that married patients usually have a lower risk of death than unmarried patients, a phenomenon that may be closely related to various factors such as social support, mental health, and health behaviors (35). A study from the United States showed that divorce or separation status was significantly associated with diabetes mortality in men (HR: 1.318, 95% CI: 1.010-1.719; HR: 1.283, 95% CI: 1.054-1.562). For women, widowed status was similarly associated with diabetes mortality (HR: 1.349, 95% CI: 1.107-1.643; HR: 1.262, 95% CI: 1.113-1.431) (36). Married individuals usually enjoyed stronger social support networks and could receive support from their partners both emotionally and practically, which made them more likely to maintain a positive psychological state in the face of illness (37, 38). Thus, marital status may be considered an important social factor that influences survival in patients with DR. Future studies should further explore how social support can be utilized to improve health outcomes in patients with DR.
Patients with DR who have a history of comorbid CHF, CHD, and stroke face a higher risk of death. CHF is one of the common complications in patients with diabetes, and studies have shown that it is positively associated with all-cause mortality and cardiovascular mortality (39). Heart failure leads to cardiac decompensation, which affects systemic circulation, exacerbating the development of other diseases, including DR (40). Therefore, patients with heart failure have a significantly increased risk of death following a cardiovascular event. CHD is one of the most common cardiovascular diseases among diabetic patients, and studies have shown that the incidence of coronary artery disease is higher in diabetic patients than in non-diabetic patients (41). When CHD is combined with DR, the risk of cardiovascular events is significantly increased, leading to higher mortality rates (42). This phenomenon may be related to the impairment of vascular endothelial function and chronic inflammatory responses caused by diabetes, which accelerate atherosclerosis formation and ultimately lead to cardiovascular events (43, 44). In addition, a history of stroke is an important predictor of mortality risk in patients with DR. A prospective cohort study found that a history of clinical stroke significantly increased the risk of cardiovascular disease-related death in patients with retinopathy (HR: 3.30, 95% CI: 2.05-5.32) (45). Stroke not only leads to acute disability but also severely affects patients’ quality of life and self-care ability, increasing the difficulty of long-term care and health management, thus increasing mortality (46). Therefore, clinicians should pay great attention to these comorbidities and develop more effective intervention strategies in diabetes management to reduce the risk of patient mortality.
The present study showed a significant association between elevated creatinine levels and the risk of death in patients with DR. Creatinine is a waste product of muscle metabolism that is usually excreted by the kidneys, and elevated levels often indicate impaired renal function (47). In patients with diabetes, worsening kidney function not only signals the progression of diabetic nephropathy but may also be associated with systemic problems such as cardiovascular disease, chronic inflammation, and increased oxidative stress (48, 49). High creatinine levels usually reflect more severe diabetic complications, and the severity of retinopathy is also strongly associated with overall health (50). Studies have found that diabetics who also have high creatinine levels are at higher risk of death (51). This phenomenon may be related to the chronic inflammatory state and metabolic disorders triggered by high creatinine levels, which affect the patient’s overall health (52). Therefore, regular monitoring of kidney function and fundus health is crucial for diabetic patients. Early detection of retinopathy and renal function problems can help in taking effective interventions, thereby reducing the risk of death. In addition, our study found that immediate insulin administration was a significant predictor of mortality risk in patients with DR. DR is usually the result of chronic hyperglycemia in diabetic patients, whose overall health may have been severely compromised (53). A large controlled cohort study showed that glucose-lowering medications were associated with increased mortality in diabetic patients of all ages (54). The possible explanation is that although immediate insulin administration is effective in lowering blood glucose, it may not rapidly improve the general health of these patients and may instead trigger complications such as hypoglycemia, which can increase the risk of death (55, 56). Therefore, the manner and timing of glycemic control in patients with DR need to be considered in the context of their overall health status and potential risks.
Identifying predictors and performing high-risk stratification are important medical decisions for preventing death in patients with DR. To this end, this study included patients with DR from the NHANES database between 1999 and 2018, with all-cause mortality as an outcome indicator, to develop a validated clinical prediction model to assess the risk of all-cause mortality in these patients. We used Lasso regression for variable selection, a method that effectively identifies significant predictors associated with mortality risk and prevents overfitting by adjusting the complexity of model fitting, making the model more robust and plausible. Additionally, we applied Cox proportional risk regression analysis to further evaluate the screened predictors to determine their statistical significance in mortality risk prediction. We developed a nomogram model based on these screened variables, designed to transform complex regression equations into visual graphs that enable clinicians to understand and interpret the results of the prediction model more intuitively. With this model, we assign a score to each predictor and aggregate all scores to calculate the probability of a risk event for each patient. Clinicians can use this tool to identify high-risk patients promptly so that appropriate interventions can be implemented to improve patient survival. For example, consider a 60-year-old married patient with congestive heart failure, coronary artery disease, and stroke and a blood creatinine level of 200 µmol/L who is not taking insulin. According to our predictive model, this patient has a total score of approximately 100, and his or her 3-year survival rate is approximately 0.95, the 5-year survival rate is approximately 0.75, and the 10-year survival rate is approximately 0.45. Such survival data provide clinicians with important information that can help with more precise risk management and intervention planning.
There are several limitations to our study. First, the diagnosis of DR was based on self-reported information from the NHANES, which may introduce information bias due to cognitive deficits or recall bias in participants. Second, participants with missing data were usually in poorer health, which may have led to fewer observed deaths, thus introducing selection bias. Additionally, our model has only been internally validated, and external validation is yet to be conducted to ensure its reliability and generalizability. Finally, the sample in this study was limited to patients with DR in the United States, which may limit the applicability of the model to other countries and regions.
This study successfully developed, validated, and visualized a nomogram for predicting the risk of all-cause mortality in patients with DR at 3, 5, and 10 years. The nomogram incorporates seven common clinical characteristics: age, marital status, CHF, CHD, stroke, creatinine levels, and taking insulin. By utilizing this tool, clinicians can more accurately assess patients’ mortality risk and implement targeted interventions for high-risk individuals, potentially reducing the risk of premature death in patients with DR. Future research should focus on prospective and interventional studies to further validate and enhance the accuracy and reliability of this nomogram.
The datasets presented in this article are not readily available because The data in our study are publicly available online from the NHANES https://www.cdc.gov/nchs/nhanes/index.htm. Requests to access the datasets should be directed to https://www.cdc.gov/nchs/nhanes/index.htm.
All study participants gave informed consent following the Institutional Review Board and study ethics guidelines at the Centers for Disease Control and Prevention. The studies were conducted in accordance with the local legislation and institutional requirements. The participants provided their written informed consent to participate in this study. Written informed consent was obtained from the individual(s) for the publication of any potentially identifiable images or data included in this article.
WZ: Conceptualization, Data curation, Writing – original draft. XY: Conceptualization, Data curation, Funding acquisition, Methodology, Supervision, Writing – review & editing.
The author(s) declare financial support was received for the research, authorship, and/or publication of this article. This research was supported by the General Program of Shanghai Pudong New Area Health Commission (No. PW2022A-12).
We thank all the staff in the NHANES for sharing data publicly.
The authors declare that the research was conducted in the absence of any commercial or financial relationships that could be construed as a potential conflict of interest.
All claims expressed in this article are solely those of the authors and do not necessarily represent those of their affiliated organizations, or those of the publisher, the editors and the reviewers. Any product that may be evaluated in this article, or claim that may be made by its manufacturer, is not guaranteed or endorsed by the publisher.
The Supplementary Material for this article can be found online at: https://www.frontiersin.org/articles/10.3389/fendo.2025.1493984/full#supplementary-material
1. Kong X. Diabetic retinopathy in the us-where we are now and what is next. JAMA Ophthalmol. (2023) 141:754–5. doi: 10.1001/jamaophthalmol.2023.2558
2. Teo ZL, Tham YC, Yu M, Chee ML, Rim TH, Cheung N, et al. Global prevalence of diabetic retinopathy and projection of burden through 2045: systematic review and meta-analysis. Ophthalmology. (2021) 128:1580–91. doi: 10.1016/j.ophtha.2021.04.027
3. Lundeen EA, Burke-Conte Z, Rein DB, Wittenborn JS, Saaddine J, Lee AY, et al. Prevalence of diabetic retinopathy in the us in 2021. JAMA Ophthalmol. (2023) 141:747–54. doi: 10.1001/jamaophthalmol.2023.2289
4. Perais J, Agarwal R, Evans JR, Loveman E, Colquitt JL, Owens D, et al. Prognostic factors for the development and progression of proliferative diabetic retinopathy in people with diabetic retinopathy. Cochrane Database Syst Rev. (2023) 2:Cd013775. doi: 10.1002/14651858.CD013775.pub2
5. Mazhar K, Varma R, Choudhury F, McKean-Cowdin R, Shtir CJ, Azen SP. Severity of diabetic retinopathy and health-related quality of life: the los angeles latino eye study. Ophthalmology. (2011) 118:649–55. doi: 10.1016/j.ophtha.2010.08.003
6. Das T, Takkar B, Sivaprasad S, Thanksphon T, Taylor H, Wiedemann P, et al. Recently updated global diabetic retinopathy screening guidelines: commonalities, differences, and future possibilities. Eye (Lond). (2021) 35:2685–98. doi: 10.1038/s41433-021-01572-4
7. Takao T, Suka M, Yanagisawa H, Kasuga M. Combined effect of diabetic retinopathy and diabetic kidney disease on all-cause, cancer, vascular and non-cancer non-vascular mortality in patients with type 2 diabetes: A real-world longitudinal study. J Diabetes Investig. (2020) 11:1170–80. doi: 10.1111/jdi.13265
8. Cheung CY, Biousse V, Keane PA, Schiffrin EL, Wong TY. Hypertensive eye disease. Nat Rev Dis Primers. (2022) 8:14. doi: 10.1038/s41572-022-00342-0
9. Liang K, Gui S, Wang X, Wang Q, Qiao J, Tao L, et al. Association of diabetic retinopathy on all-cause and cause-specific mortality in older adults with diabetes: national health and nutrition examination survey, 2005-2008. Sci Rep. (2024) 14:10458. doi: 10.1038/s41598-024-58502-z
10. Zhu Z, Shang X, Wang W, Ha J, Chen Y, He J, et al. Impact of retinopathy and systemic vascular comorbidities on all-cause mortality. Front Endocrinol (Lausanne). (2021) 12:750017. doi: 10.3389/fendo.2021.750017
11. Sacchetta L, Chiriacò M, Nesti L, Leonetti S, Forotti G, Natali A, et al. Synergistic effect of chronic kidney disease, neuropathy, and retinopathy on all-cause mortality in type 1 and type 2 diabetes: A 21-year longitudinal study. Cardiovasc Diabetol. (2022) 21:233. doi: 10.1186/s12933-022-01675-6
12. Modjtahedi BS, Wu J, Luong TQ, Gandhi NK, Fong DS, Chen W. Severity of diabetic retinopathy and the risk of future cerebrovascular disease, cardiovascular disease, and all-cause mortality. Ophthalmology. (2021) 128:1169–79. doi: 10.1016/j.ophtha.2020.12.019
13. van Hecke MV, Dekker JM, Stehouwer CD, Polak BC, Fuller JH, Sjolie AK, et al. Diabetic retinopathy is associated with mortality and cardiovascular disease incidence: the eurodiab prospective complications study. Diabetes Care. (2005) 28:1383–9. doi: 10.2337/diacare.28.6.1383
14. Zhou H, Wang J, Cui X. Causal effect of immune cells, metabolites, cathepsins, and vitamin therapy in diabetic retinopathy: A mendelian randomization and cross-sectional study. Front Immunol. (2024) 15:1443236. doi: 10.3389/fimmu.2024.1443236
15. Qiao Q, Liu X, Xue W, Chen L, Hou X. Analysis of the association between high antioxidant diet and lifestyle habits and diabetic retinopathy based on nhanes cross-sectional study. Sci Rep. (2024) 14:11868. doi: 10.1038/s41598-024-62707-7
16. Li B, Cheng X, Huang Y, Zhou C, Gu C, Zhu X, et al. The differences of metabolic profiles, socioeconomic status and diabetic retinopathy in U.S. Working-age and elderly adults with diabetes: results from nhanes 1999-2018. Acta Diabetol. (2024) 62:25–34. doi: 10.1007/s00592-024-02328-8
17. Li B, Zhou C, Gu C, Cheng X, Wang Y, Li C, et al. Modifiable lifestyle, mental health status and diabetic retinopathy in U.S. Adults aged 18-64 years with diabetes: A population-based cross-sectional study from nhanes 1999-2018. BMC Public Health. (2024) 24:11. doi: 10.1186/s12889-023-17512-8
18. Sun XJ, Zhang GH, Guo CM, Zhou ZY, Niu YL, Wang L, et al. Associations between psycho-behavioral risk factors and diabetic retinopathy: nhanes (2005-2018). Front Public Health. (2022) 10:966714. doi: 10.3389/fpubh.2022.966714
19. Zhang Y, Liu X, Zhang X, Li L, Li Q, Geng H, et al. Association between serum heavy metal levels and diabetic retinopathy in nhanes 2011-2020. Sci Rep. (2024) 14:1268. doi: 10.1038/s41598-024-51749-6
20. Li W, Lai Z, Tang N, Tang F, Huang G, Lu P, et al. Diabetic retinopathy related homeostatic dysregulation and its association with mortality among diabetes patients: A cohort study from nhanes. Diabetes Res Clin Pract. (2024) 207:111081. doi: 10.1016/j.diabres.2023.111081
21. Cao K, Wang B, Friedman DS, Hao J, Zhang Y, Hu A, et al. Diabetic retinopathy, visual impairment, and the risk of six-year death: A cohort study of a rural population in China. Ophthalmic Res. (2021) 64:983–90. doi: 10.1159/000512667
22. Fu W, Hu F, Xu C. Association between red blood cell distribution width/albumin ratio and all-cause mortality or cardiovascular diseases mortality in patients with diabetic retinopathy: A cohort study. PloS One. (2023) 18:e0296019. doi: 10.1371/journal.pone.0296019
23. Shen R, Guo X, Zou T, Ma L. Associations of cardiovascular health assessed by life’s essential 8 with diabetic retinopathy and mortality in type 2 diabetes. Prim Care Diabetes. (2023) 17:420–8. doi: 10.1016/j.pcd.2023.08.001
24. Yang L, Shen X, Seyiti Z, Tang J, Kasimujiang A, Dejite T, et al. Development and validation of a nomogram for predicting all-cause mortality in american adult hypertensive populations. Front Pharmacol. (2023) 14:1266870. doi: 10.3389/fphar.2023.1266870
25. Zhang H, Tian W, Sun Y. Development, validation, and visualization of a web-based nomogram to predict 5-year mortality risk in older adults with hypertension. BMC Geriatr. (2022) 22:392. doi: 10.1186/s12877-022-03087-3
26. Vickers AJ, Elkin EB. Decision curve analysis: A novel method for evaluating prediction models. Med Decis Making. (2006) 26:565–74. doi: 10.1177/0272989x06295361
27. Nowakowska M, Zghebi SS, Ashcroft DM, Buchan I, Chew-Graham C, Holt T, et al. The comorbidity burden of type 2 diabetes mellitus: patterns, clusters and predictions from a large english primary care cohort. BMC Med. (2019) 17:145. doi: 10.1186/s12916-019-1373-y
28. Chou MY, Huang ST, Liang CK, Peng LN, Lin YT, Hsiao FY, et al. All-cause mortality, cardiovascular mortality, major cardiovascular events and hypoglycaemia of patients with diabetes onset at an older age: results from the 10-year nationwide cohort study. Age Ageing. (2021) 50:2094–104. doi: 10.1093/ageing/afab183
29. Drion I, van Hateren KJ, Joosten H, Alkhalaf A, Groenier KH, Kleefstra N, et al. Chronic kidney disease and mortality risk among older patients with type 2 diabetes mellitus (Zodiac-24). Age Ageing. (2012) 41:345–50. doi: 10.1093/ageing/afs002
30. Chen R, Chen Y, Zhang J, Wang W, Hu W, He M, et al. Retinal age gap as a predictive biomarker for future risk of clinically significant diabetic retinopathy. Acta Diabetol. (2024) 61:373–80. doi: 10.1007/s00592-023-02199-5
31. Leley SP, Ciulla TA, Bhatwadekar AD. Diabetic retinopathy in the aging population: A perspective of pathogenesis and treatment. Clin Interv Aging. (2021) 16:1367–78. doi: 10.2147/cia.S297494
32. Al-Musawe L, Martins AP, Raposo JF, Torre C. The association between polypharmacy and adverse health consequences in elderly type 2 diabetes mellitus patients; a systematic review and meta-analysis. Diabetes Res Clin Pract. (2019) 155:107804. doi: 10.1016/j.diabres.2019.107804
33. Pandya N, Hames E, Sandhu S. Challenges and strategies for managing diabetes in the elderly in long-term care settings. Diabetes Spectr. (2020) 33:236–45. doi: 10.2337/ds20-0018
34. Hussain S, Chowdhury TA. The impact of comorbidities on the pharmacological management of type 2 diabetes mellitus. Drugs. (2019) 79:231–42. doi: 10.1007/s40265-019-1061-4
35. Escolar-Pujolar A, Córdoba Doña JA, Goicolea Julían I, Rodríguez GJ, Santos Sánchez V, Mayoral Sánchez E, et al. The effect of marital status on social and gender inequalities in diabetes mortality in andalusia. Endocrinol Diabetes Nutr (Engl Ed). (2018) 65:21–9. doi: 10.1016/j.endinu.2017.10.006
36. Kposowa AJ, Aly Ezzat D, Breault K. Diabetes mellitus and marital status: evidence from the national longitudinal mortality study on the effect of marital dissolution and the death of a spouse. Int J Gen Med. (2021) 14:1881–8. doi: 10.2147/ijgm.S307436
37. Holt-Lunstad J, Birmingham W, Jones BQ. Is there something unique about marriage? The relative impact of marital status, relationship quality, and network social support on ambulatory blood pressure and mental health. Ann Behav Med. (2008) 35:239–44. doi: 10.1007/s12160-008-9018-y
38. Zhang X, Norris SL, Gregg EW, Beckles G. Social support and mortality among older persons with diabetes. Diabetes Educ. (2007) 33:273–81. doi: 10.1177/0145721707299265
39. Hippisley-Cox J, Coupland C. Diabetes treatments and risk of heart failure, cardiovascular disease, and all cause mortality: cohort study in primary care. Bmj. (2016) 354:i3477. doi: 10.1136/bmj.i3477
40. Yen FS, Wei JC, Shih YH, Hsu CC, Hwu CM. Impact of individual microvascular disease on the risks of macrovascular complications in type 2 diabetes: A nationwide population-based cohort study. Cardiovasc Diabetol. (2023) 22:109. doi: 10.1186/s12933-023-01821-8
41. Xu S, Liu J, Zhao D, Yang N, Hao Y, Zhou Y, et al. The association between the aip and undiagnosed diabetes in acs patients with different body mass indexes and ldl-C levels: findings from the ccc-acs project. Cardiovasc Diabetol. (2024) 23:77. doi: 10.1186/s12933-024-02162-w
42. Juutilainen A, Lehto S, Rönnemaa T, Pyörälä K, Laakso M. Retinopathy predicts cardiovascular mortality in type 2 diabetic men and women. Diabetes Care. (2007) 30:292–9. doi: 10.2337/dc06-1747
43. An Y, Xu BT, Wan SR, Ma XM, Long Y, Xu Y, et al. The role of oxidative stress in diabetes mellitus-induced vascular endothelial dysfunction. Cardiovasc Diabetol. (2023) 22:237. doi: 10.1186/s12933-023-01965-7
44. Ménégaut L, Laubriet A, Crespy V, Leleu D, Pilot T, Van Dongen K, et al. Inflammation and oxidative stress markers in type 2 diabetes patients with advanced carotid atherosclerosis. Cardiovasc Diabetol. (2023) 22:248. doi: 10.1186/s12933-023-01979-1
45. Fisher DE, Jonasson F, Klein R, Jonsson PV, Eiriksdottir G, Launer LJ, et al. Mortality in older persons with retinopathy and concomitant health conditions: the age, gene/environment susceptibility-reykjavik study. Ophthalmology. (2016) 123:1570–80. doi: 10.1016/j.ophtha.2016.02.045
46. Gurková E, Štureková L, Mandysová P, Šaňák D. Factors affecting the quality of life after ischemic stroke in young adults: A scoping review. Health Qual Life Outcomes. (2023) 21:4. doi: 10.1186/s12955-023-02090-5
47. Kannapiran M, Nisha D, Madhusudhana Rao A. Underestimation of impaired kidney function with serum creatinine. Indian J Clin Biochem. (2010) 25:380–4. doi: 10.1007/s12291-010-0080-4
48. Jin Q, Luk AO, Lau ESH, Tam CHT, Ozaki R, Lim CKP, et al. Nonalbuminuric diabetic kidney disease and risk of all-cause mortality and cardiovascular and kidney outcomes in type 2 diabetes: findings from the hong kong diabetes biobank. Am J Kidney Dis. (2022) 80:196–206.e1. doi: 10.1053/j.ajkd.2021.11.011
49. Gutiérrez OM, Shlipak MG, Katz R, Waikar SS, Greenberg JH, Schrauben SJ, et al. Associations of plasma biomarkers of inflammation, fibrosis, and kidney tubular injury with progression of diabetic kidney disease: A cohort study. Am J Kidney Dis. (2022) 79:849–57.e1. doi: 10.1053/j.ajkd.2021.09.018
50. Trott M, Driscoll R, Pardhan S. Associations between diabetic retinopathy, mortality, disease, and mental health: an umbrella review of observational meta-analyses. BMC Endocr Disord. (2022) 22:311. doi: 10.1186/s12902-022-01236-8
51. Marassi M, Fadini GP. The cardio-renal-metabolic connection: A review of the evidence. Cardiovasc Diabetol. (2023) 22:195. doi: 10.1186/s12933-023-01937-x
52. Beddhu S, Kimmel PL, Ramkumar N, Cheung AK. Associations of metabolic syndrome with inflammation in ckd: results from the third national health and nutrition examination survey (Nhanes iii). Am J Kidney Dis. (2005) 46:577–86. doi: 10.1053/j.ajkd.2005.06.014
53. Kaur G, Harris NR. Endothelial glycocalyx in retina, hyperglycemia, and diabetic retinopathy. Am J Physiol Cell Physiol. (2023) 324:C1061–c77. doi: 10.1152/ajpcell.00188.2022
54. Claesen M, Gillard P, De Smet F, Callens M, De Moor B, Mathieu C. Mortality in individuals treated with glucose-lowering agents: A large, controlled cohort study. J Clin Endocrinol Metab. (2016) 101:461–9. doi: 10.1210/jc.2015-3184
55. Roumie CL, Hung AM, Greevy RA, Grijalva CG, Liu X, Murff HJ, et al. Comparative effectiveness of sulfonylurea and metformin monotherapy on cardiovascular events in type 2 diabetes mellitus: A cohort study. Ann Intern Med. (2012) 157:601–10. doi: 10.7326/0003-4819-157-9-201211060-00003
Keywords: diabetic retinopathy, all-cause mortality, NHANES, nomogram, type 2 diabetes
Citation: Zuo W and Yang X (2025) Construction of a nomogram for predicting the risk of all-cause mortality in patients with diabetic retinopathy. Front. Endocrinol. 16:1493984. doi: 10.3389/fendo.2025.1493984
Received: 10 September 2024; Accepted: 07 February 2025;
Published: 21 February 2025.
Edited by:
Åke Sjöholm, Gävle Hospital, SwedenReviewed by:
José Alexandre Bachur, University of Franca, BrazilCopyright © 2025 Zuo and Yang. This is an open-access article distributed under the terms of the Creative Commons Attribution License (CC BY). The use, distribution or reproduction in other forums is permitted, provided the original author(s) and the copyright owner(s) are credited and that the original publication in this journal is cited, in accordance with accepted academic practice. No use, distribution or reproduction is permitted which does not comply with these terms.
*Correspondence: Xuelian Yang, U0gzMDg5QDEyNi5jb20=
Disclaimer: All claims expressed in this article are solely those of the authors and do not necessarily represent those of their affiliated organizations, or those of the publisher, the editors and the reviewers. Any product that may be evaluated in this article or claim that may be made by its manufacturer is not guaranteed or endorsed by the publisher.
Research integrity at Frontiers
Learn more about the work of our research integrity team to safeguard the quality of each article we publish.