
94% of researchers rate our articles as excellent or good
Learn more about the work of our research integrity team to safeguard the quality of each article we publish.
Find out more
CLINICAL TRIAL article
Front. Endocrinol. , 28 January 2025
Sec. Clinical Diabetes
Volume 16 - 2025 | https://doi.org/10.3389/fendo.2025.1487058
This article is part of the Research Topic Advances in Diabetes and Hypertension Research View all 10 articles
 Haoyi Yang1
 Yuwen Zhang2
 Yuxin Hong1Yuan Wei1Yuning Zhu1Lei Huang3
 Yuanxun Yang3
 Runbin Sun1,2,3*Juan Li1,2,3*
Context: As a novel SGLT1 inhibitor, SY-009 has been preliminarily confirmed in a phase Ib clinical study for its ability to reduce postprandial blood glucose in patients with type 2 diabetes mellitus (T2DM). However, the effects of SY-009 on human plasma metabolomics are still unknown.
Objective: This study aimed to explore the effects of SY-009 on plasma metabolomics in patients with T2DM and the potential metabolic regulatory mechanism involved.
Study design: In the phase Ib study, a total of 50 participants with T2DM were enrolled and randomly assigned to the 0.5 mg BID, 1 mg BID, 2 mg BID, 1 mg QD, and 2 mg QD dose groups, with a 4:1 random allocation within each group to receive either the SY-009 capsule or placebo. We conducted untargeted and targeted metabolomics analyses on plasma samples from the phase Ib clinical study.
Results: Untargeted metabolomics revealed that, after SY009 treatment, there were differences in metabolic pathways, including primary bile acid biosynthesis; biosynthesis of unsaturated fatty acid; steroid hormone biosynthesis; purine metabolism; phenylalanine, tyrosine and tryptophan biosynthesis. In particular, the increase in bile acid-related metabolites in the 2 mg BID group was significantly greater than that in the placebo group, and unsaturated fatty acid-related metabolites decreased in both the 2 mg BID group and the placebo group, but there was no significant difference between the two groups. After comprehensive consideration, bile acids were taken as our target for accurate quantification via targeted metabolomics. Compared with those in the placebo group, the levels of several bile acids were significantly greater in the SY-009-treated groups. Moreover, the proportion of free bile acids decreased significantly, the proportion of glycine-conjugated bile acids increased significantly, the proportion of taurine-conjugated bile acids tended to be stable, and PBA/SBA significantly increased after SY-009 administration.
Conclusions: SY-009 caused a series of postprandial plasma metabolite changes in patients with T2DM, especially significant changes in the bile acid profile, which provides a new perspective on the mechanism by which SY-009 lowers blood glucose.
Clinical trial registration: https://www.clinicaltrials.gov, identifier NCT04345107.
Diabetes is a common chronic metabolic disease characterized by hyperglycaemia, with type 2 diabetes mellitus (T2DM) being the most common form, accounting for more than 90% of all diabetes cases worldwide. According to the statistical analysis of the International Diabetes Federation (IDF), the number of diabetic patients worldwide will reach 783 million in 2045 (1). The epidemic of diabetes has become a major global issue. There is an urgent need to explore new targets and optimize glycaemic control strategies.
Recently, the sodium-glucose cotransporter (SGLT) has emerged as a hot new target because of its unique hypoglycaemic mechanism. There are six main subtypes of SGLTs: SGLT1, SGLT2, SGLT3, SGLT4, SGLT5, and SGLT6. However, only the SGLT1 and SGLT2 subtypes have been extensively studied (2). SGLT1 is primarily responsible for absorbing glucose and galactose in the intestines, whereas SGLT2 is responsible for reabsorbing glucose in the kidneys (3). Both operate through active transport mechanisms that depend on sodium cooperative transport systems (4). In the first stage, glucose or galactose enters the cell from the lumen through SGLTs and accumulates. In the second stage, facilitated diffusion occurs from the cell into the blood via glucose transporter 2 (GLUT2), which islocated in the basolateral membrane.
In recent years, SGLT2 inhibitors and SGLT1/2 dual-target inhibitors have been marketed and approved for treating T2DM (5, 6). Currently, SGLT2 inhibitors have become a new mainstay in the treatment of T2DM (7), especially in combination with cardiovascular and renal disease, where SGLT2 inhibitors offer important benefits (8, 9). Compared with SGLT2 inhibitors alone, SGLT1/2 dual-target inhibitors have a greater effect on lowering blood glucose (10). SGLT1 inhibitors have not yet been marketed. However, research on SGLT1 inhibitors continues actively. For example, a novel nonabsorbable SGLT1 inhibitor, LX2761, which was developed by modifying Sotagliflozin, has demonstrated the ability to delay intestinal glucose absorption, thereby improving glycaemic control (11). In addition, SGLT1 inhibition has been shown to delay postprandial intestinal glucose absorption and increase the plasma levels of GLP-1 and GIP in healthy volunteers (12). In addition, for diabetic patients with renal insufficiency, SGLT1 inhibitors that act on the intestine may be better treatment options.
Since it was first proposed by J.K. Nicholson et al. in 1999 (13), metabolomics has become a powerful tool for screening disease biomarkers and studying the mechanisms of disease occurrence and development. Xing Chen et al. revealed the metabonomics-based renoprotective mechanism of empagliflozin in obese mice for the first time (14), which was the first application of metabolomics in SGLT inhibitors. In addition, many studies on T2DM have been based on metabolomics technology (15). Xiaoyi Yu et al., on the basis of GC-MS, reported that metabolic disorders of the tricarboxylic acid cycle (TCA) may have an important relationship with diabetic nephropathy (16). Chang Young Ha et al. reported that decanoyl carnitine and lysoPC (C14:0) are the best metabolites for predicting the risk of developing T2DM via UPLC-TOF-MS (17). Additionally, a series of potential biomarkers have been identified, including bile acid, 3-hydroxybutyric acid with ketogenesis, 2-hydroxybutyric acid, branched-chain amino acids, and aromatic amino acids (18–21). In summary, diabetes metabolomics provides researchers with a new perspective to uncover global changes in T2DM and better understand its pathophysiological mechanisms.
SY-009 is a novel SGLT1 inhibitor, that is not listed at home or abroad. With the permission of Eli Lilly Company, Suzhou Yabao Pharmaceutical Research and Development Co., Ltd., initiated the clinical study as the sponsor. Currently, a phase Ib clinical study has been completed, indicating that SY-009 can significantly reduce postprandial blood glucose (22). However, research on SGLT1 inhibitors in human plasma metabolomics is currently lacking. Therefore, this study aimed to use metabolomics technology to clarify the effects of SY-009 on the plasma metabolome profile of patients with T2DM, search for potential biomarkers, and explore the potential metabolic regulatory mechanisms of SY-009 in T2DM.
In this study, plasma samples were collected from “A randomized, double-blind, placebo-controlled, dose-escalation Phase Ib study to evaluate the safety, tolerability, and PK/PD profile of SY-009 in patients with T2DM” conducted at the Nanjing Drum Tower Hospital Phase I Clinical Trial Center.
In the phase Ib study, 50 participants with T2DM were randomly assigned to the 1 mg, 2 mg, or 4 mg daily dose groups (Supplementary Figure S1). The 1 mg daily dose group was divided into two administration groups, 0.5 mg BID and 1 mg QD; the 2 mg daily dose group was divided into two administration groups, 1 mg BID and 2 mg QD; and the 4 mg daily dose group was administered 2 mg BID. Ten participants were enrolled in each of these dosing groups and randomly assigned to receive SY-009 capsules or placebo at a ratio of 4:1 to be taken orally immediately before meals (QD before breakfast, BID before breakfast and dinner). Subjects were first dosed before breakfast on Day 1, followed by continuous daily dosing until dinner on Day 7.
Only blood samples from Day 1 and Day 7 were collected (Supplementary Figure S1). The blood collection points were 10 min before administration and 10 min, 0.5 h, 1 h, 2 h, and 4 h after administration. After blood collection, the collection tubes were placed in a precooled low-temperature centrifuge and centrifuged at 4°C and 1500 × g for 10 min to separate the plasma. Before metabolomics analysis, the plasma samples were stored at -80°C.
The sample preparation method was as follows: 50 μL of plasma was taken into a centrifuge tube, followed by the addition of 150 μL of methanol solution containing the internal standard (4-chlorophenylalanine, 1 μg/mL). The samples were shaken for 3 min and then centrifuged at 18000 rpm for 5 min at 4°C. Next, 150 μL of the supernatant was transferred to an EP tube. The mixture was subsequently centrifuge again in the same way, after which 100 μL of the supernatant was transferred into a sample vial. Subsequently, 30 μl of each sample was mixed to prepare the quality control (QC) samples. QC samples are essential for system regulation and quality control processes, which help to obtain reliable and high-quality metabolomics data.
Liquid chromatography coupled with a quadrupole time-of-flight tandem mass spectrometer (AB SCIEX TripleTOF®5600 LC-QTOF/MS, Foster City, Canada) was used to determine the changes in the plasma metabolome before and after drug administration. The instrument conditions were as follows: the chromatographic column used was a Waters HSS T3 column (1.8 μm, 2.1×100 mm). The flow rate was 0.3 mL/min, and the column temperature was 40°C. The mobile phase was A: aqueous phase (0.1% formic acid-water) and B: organic phase (acetonitrile). The organic phase gradient elution procedure was as follows: 0-1.5 min, 5% B; 1.5-6 min, 5%-60% B; 6-9.5 min, 60%-95% B; 9.5-12 min, 95% B; 12-12.5 min, 95%-5% B; 12.5-15.5 min, 5% B. In the mass spectrometry detection, Turbo V electrospray ionization (ESI) was used for scan analysis. The parameters were set as follows: ion source gas 1 (GS1), 60 psi; ion source gas 2 (GS2), 60 psi; curtain gas (CUR), 35 psi; temperature (TEM), 550 °C; ionSpray voltage floating (ISVF), 5500 V in positive ion mode and -4500 V in negative ion mode; declustering potential (DP), 60 V in positive ion mode and -60 V in negative ion mode; collision energy (CE), 35 eV in positive ion mode and -10 eV in negative ion mode; and mass spectrum scanning range, 50-1200 Da.
On the basis of the untargeted raw metabolomics data (wiff format) obtained via LC-QTOF-MS, we used MSConvet and R (version 4.2.3) to convert and process the data, respectively. The steps were as follows: First, the primary mass spectrum (MS1) information of the raw data was converted to MZxml format by MSConvert, and the secondary mass spectrum (MS2) information was converted to mgf format. Then, using TidyMass package developed by Shen Xiaotao’s team (23), a series of operations, such as peak area extraction and alignment, noise signal removal, missing value filling, and metabolite identification, were carried out. The missing values were filled by the KNN method, and metabolites were identified on the basis of the KEGG and HMDB databases. Finally, the cleaned peak area data were calibrated with the MetNormalizer package for further analysis.
First, 16 bile acids, including cholic acid (CA), glycocholic acid (GCA), taurocholic acid (TCA), chenodesoxycholic acid (CDCA), glycochenodeoxycholic acid (GCDCA), taurochenodeoxycholic acid (TCDCA), deoxycholic acid (DCA), glycodesoxycholic acid (GDCA), taurodeoxycholic acid (TDCA), ursodeoxycholic acid (UDCA), glycoursodeoxycholic acid (GUDCA), tauroursodeoxycholic acid (TUDCA), hyodeoxycholic acid (HDCA), glycohyodeoxycholic acid (GHDCA), taurohyodeoxycholic acid (THDCA) and lithocholic acid (LCA) were processed for the drawing of standard curves. The mass−charge ratio (m/z) was determined according to previous methods (24).
The bile acid standard mixture and plasma samples were processed similarly. Fifty-microlitre samples were added to 200 μL of methanol solution containing an internal standard (0.1 μg/mL 2,2,4,4-D4-cholic acid, taurocholic-2,2,4,4-D4 acid, and glycocholic-2,2,4,4-D4 acid). Then, the mixture was shaken for 3 min and centrifuged at 18000 rpm for 5 min at 4°C. Next, 150 μL of the supernatant was transferred into an EP tube. The mixture was subsequently centrifuged again in the same way, and 100 μL of the supernatant was transferred to a sample vial. Finally, 5 μl of the sample was injected for targeted detection.
An ultra-performance liquid chromatography system with a 5500 mass spectrometer (AB Sciex, Toronto, Canada) was used to determine the changes in bile acids before and after drug administration. A Waters Atlantis T3 column (2.1×100 mm, 3 μm) was used for chromatographic separation. The mobile phase consisted of aqueous phase A and organic phase B. A: 0.1% formic acid: water, and B: methanol with the following gradient: 0-2 min 60% B, 2-10 min 60%-90% B, 10-15 min 90% B, 15-15.1 min 90%-60% B, 15.1-20 min 60% B.
After the plasma samples were analysed by LC-MS/MS, Analyst software® 1.7.1 was used to identify peaks corresponding to bile acids in the samples. The bile acid concentrations were subsequently obtained on the basis of standard curves and the concentrations of internal standard compounds.
For untargeted metabolomics analysis, principal component analysis (PCA) was used to detect the stability of the QC samples to determine whether the metabolic data were reliable. Partial least squares discrimination analysis (PLS-DA), which provides better separation than PCA does, was used to understand the difference in the total metabolites before and after administration. In addition, we combined the fold change (FC) values of metabolites before and after administration with the variable importance in projection (VIP) values obtained from PLS-DA for the preliminary screening of differentially abundant metabolites. The default criteria were as follows: VIP > 1, FC ≥ 1.5 or FC ≤ 0.67, and P < 0.05. Hierarchical cluster analysis (HCA) was performed to evaluate the similarities and differences among the potential biomarkers. Metabolic pathway enrichment analysis was performed via the KEGG database.
A paired t test was used to compare differences before and after drug administration. Multiple comparisons were performed via one-way analysis of variance (ANOVA) to analyse the differences between the SY-009 and placebo groups. Statistical analysis and data visualization were performed via MetaboAnalyst 6.0 (https://www.metaboanalyst.ca/), MetWare Cloud (https://cloud.metware.cn), Genes Cloud (https://www.genescloud.cn), Omic Studio (https://www.omicstudio.cn/tool), GraphPad Prism 9, and SPSS 27. All the data are presented as the means ± standard deviations, and P < 0.05 was considered statistically significant.
This study was approved by the Ethics Committee of Nanjing Drum Tower Hospital with the ethics number 2022-187-02. The Phase Ib clinical study was registered on the website of ClinicalTrials.gov (https://www.clinicaltrials.gov/) with the identifier: NCT04345107. This study strictly complied with the Declaration of Helsinki and relevant policies and regulations, and all participants provided written informed consent before undergoing the study procedure. The criteria for inclusion and exclusion, as well as the demographic data of the participants, are presented in the Supplementary Materials, and the demographic and baseline characteristics were generally balanced among the groups.
For the untargeted metabolomics analysis, the representative total ion chromatograms (TICs) are shown in Supplementary Figure S2. After R Studio processing, firstly, PCA diagrams were first generated using the metabolic data of the QC samples and some of the plasma samples to assess data reliability. The tight clustering observed among the QC samples confirmed the accuracy and stability of the instrument (Supplementary Figure S3). Given that the hypoglycaemic effect of SY-009 is dose-dependent, with 2 mg BID showing the most pronounced effect (22), we initially focused on the highest-dose group, the 2 mg BID group. As shown in Figure 1, the PLS-DA results indicated a significant separation trend on Days 1 and 7 at 1h or 2h postadministration of SY-009 compared with preadministration levels, and there was no “overfitting” phenomenon. The model parameters are shown in Supplementary Table S1. These results suggest that SY-009 had a significant effect on the plasma metabolism profile of patients with T2DM.
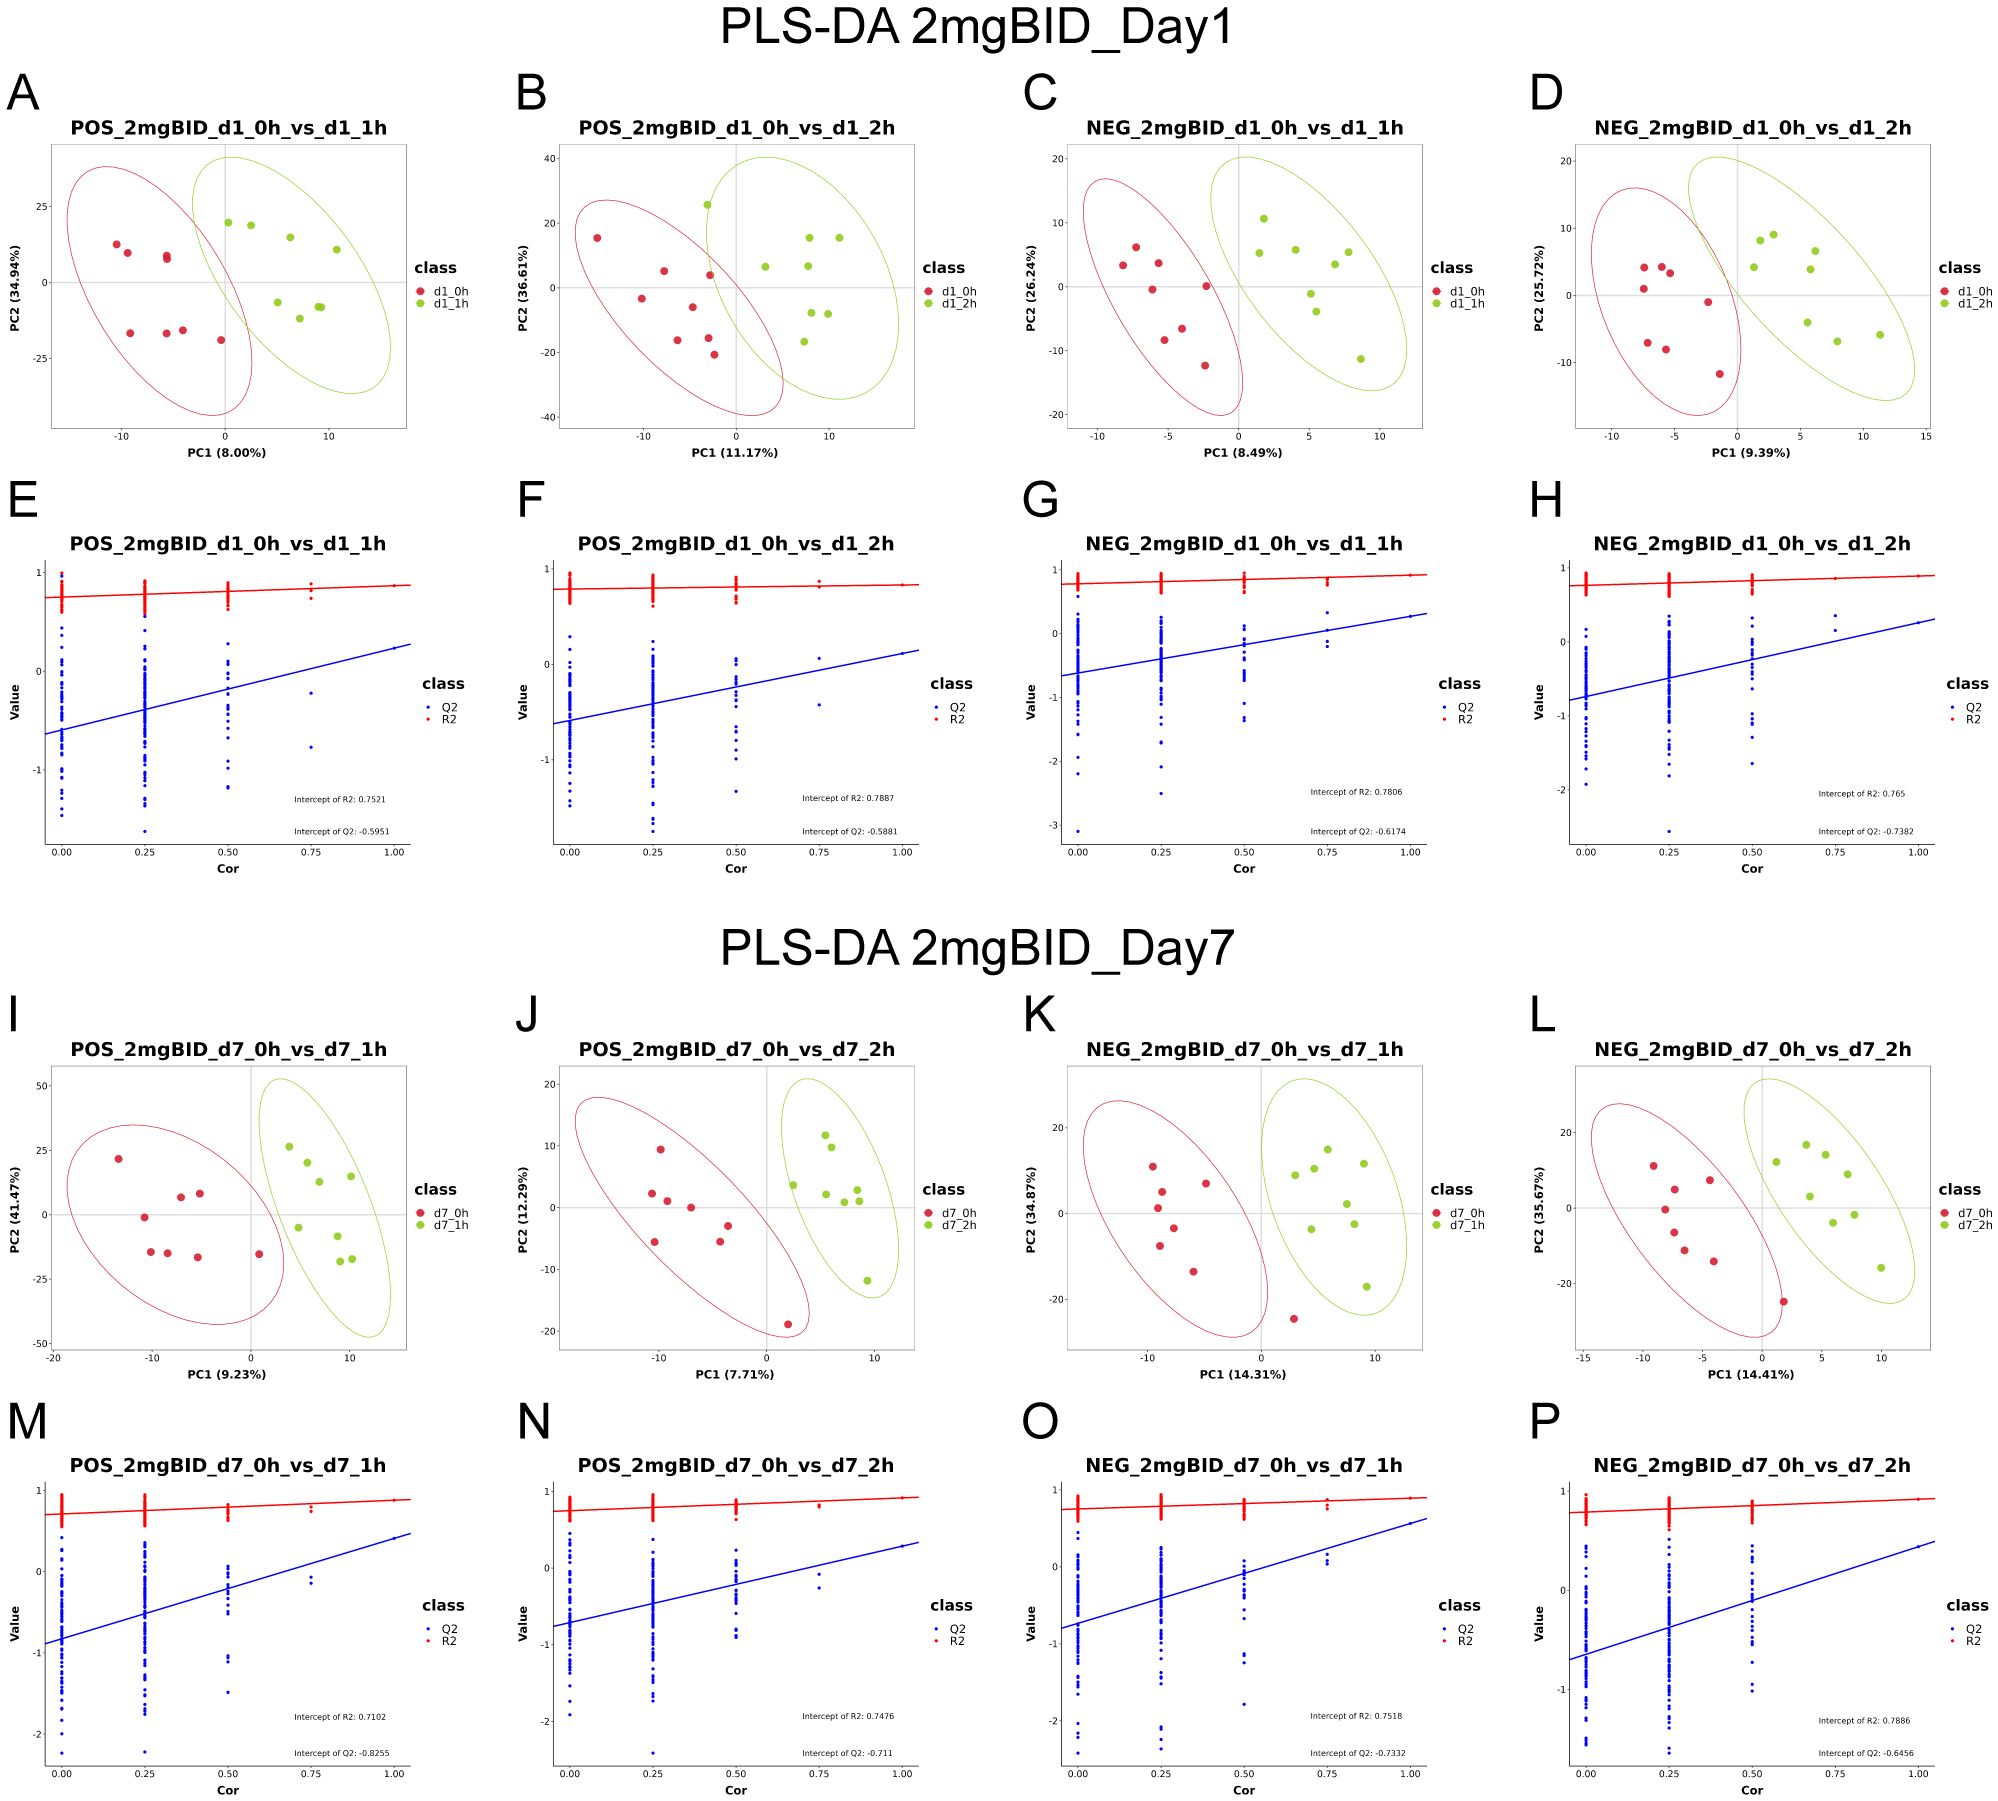
Figure 1. (A–H) are PLS-DA in positive or negative ion mode on day 1. (I–P) are PLS-DA in positive or negative ion mode on day 7.
Next, volcano plots of the 2 mg BID group were constructed to observe the changes in the metabolites. As shown in Supplementary Figure S4, on Days 1 and 7, changes in the contents of many metabolites occurred 1 h or 2 h after administration. After identification via the KEGG and HMDB databases, screening of differentially abundant metabolites was conducted basis of the following conditions: VIP>1, FC≥1.5 or FC ≤ 0.67, and P<0.05. As shown in Supplementary Table S2, Supplementary Table S3, the contents of 64 and 57 metabolites changed on Days 1 and 7, respectively. Among them, 25 and 36 metabolites with P < 0.05 were considered potential biomarkers.
MetaboAnalyst was utilized for metabolic pathway enrichment analysis of potential biomarkers on Days 1 and 7. As shown in Figures 2A, B, the biosynthesis of unsaturated fatty acids and primary bile acid biosynthesis were the two most important pathways on both Day 1 and Day 7. Therefore, these two metabolic pathways were the focus of subsequent analyses.
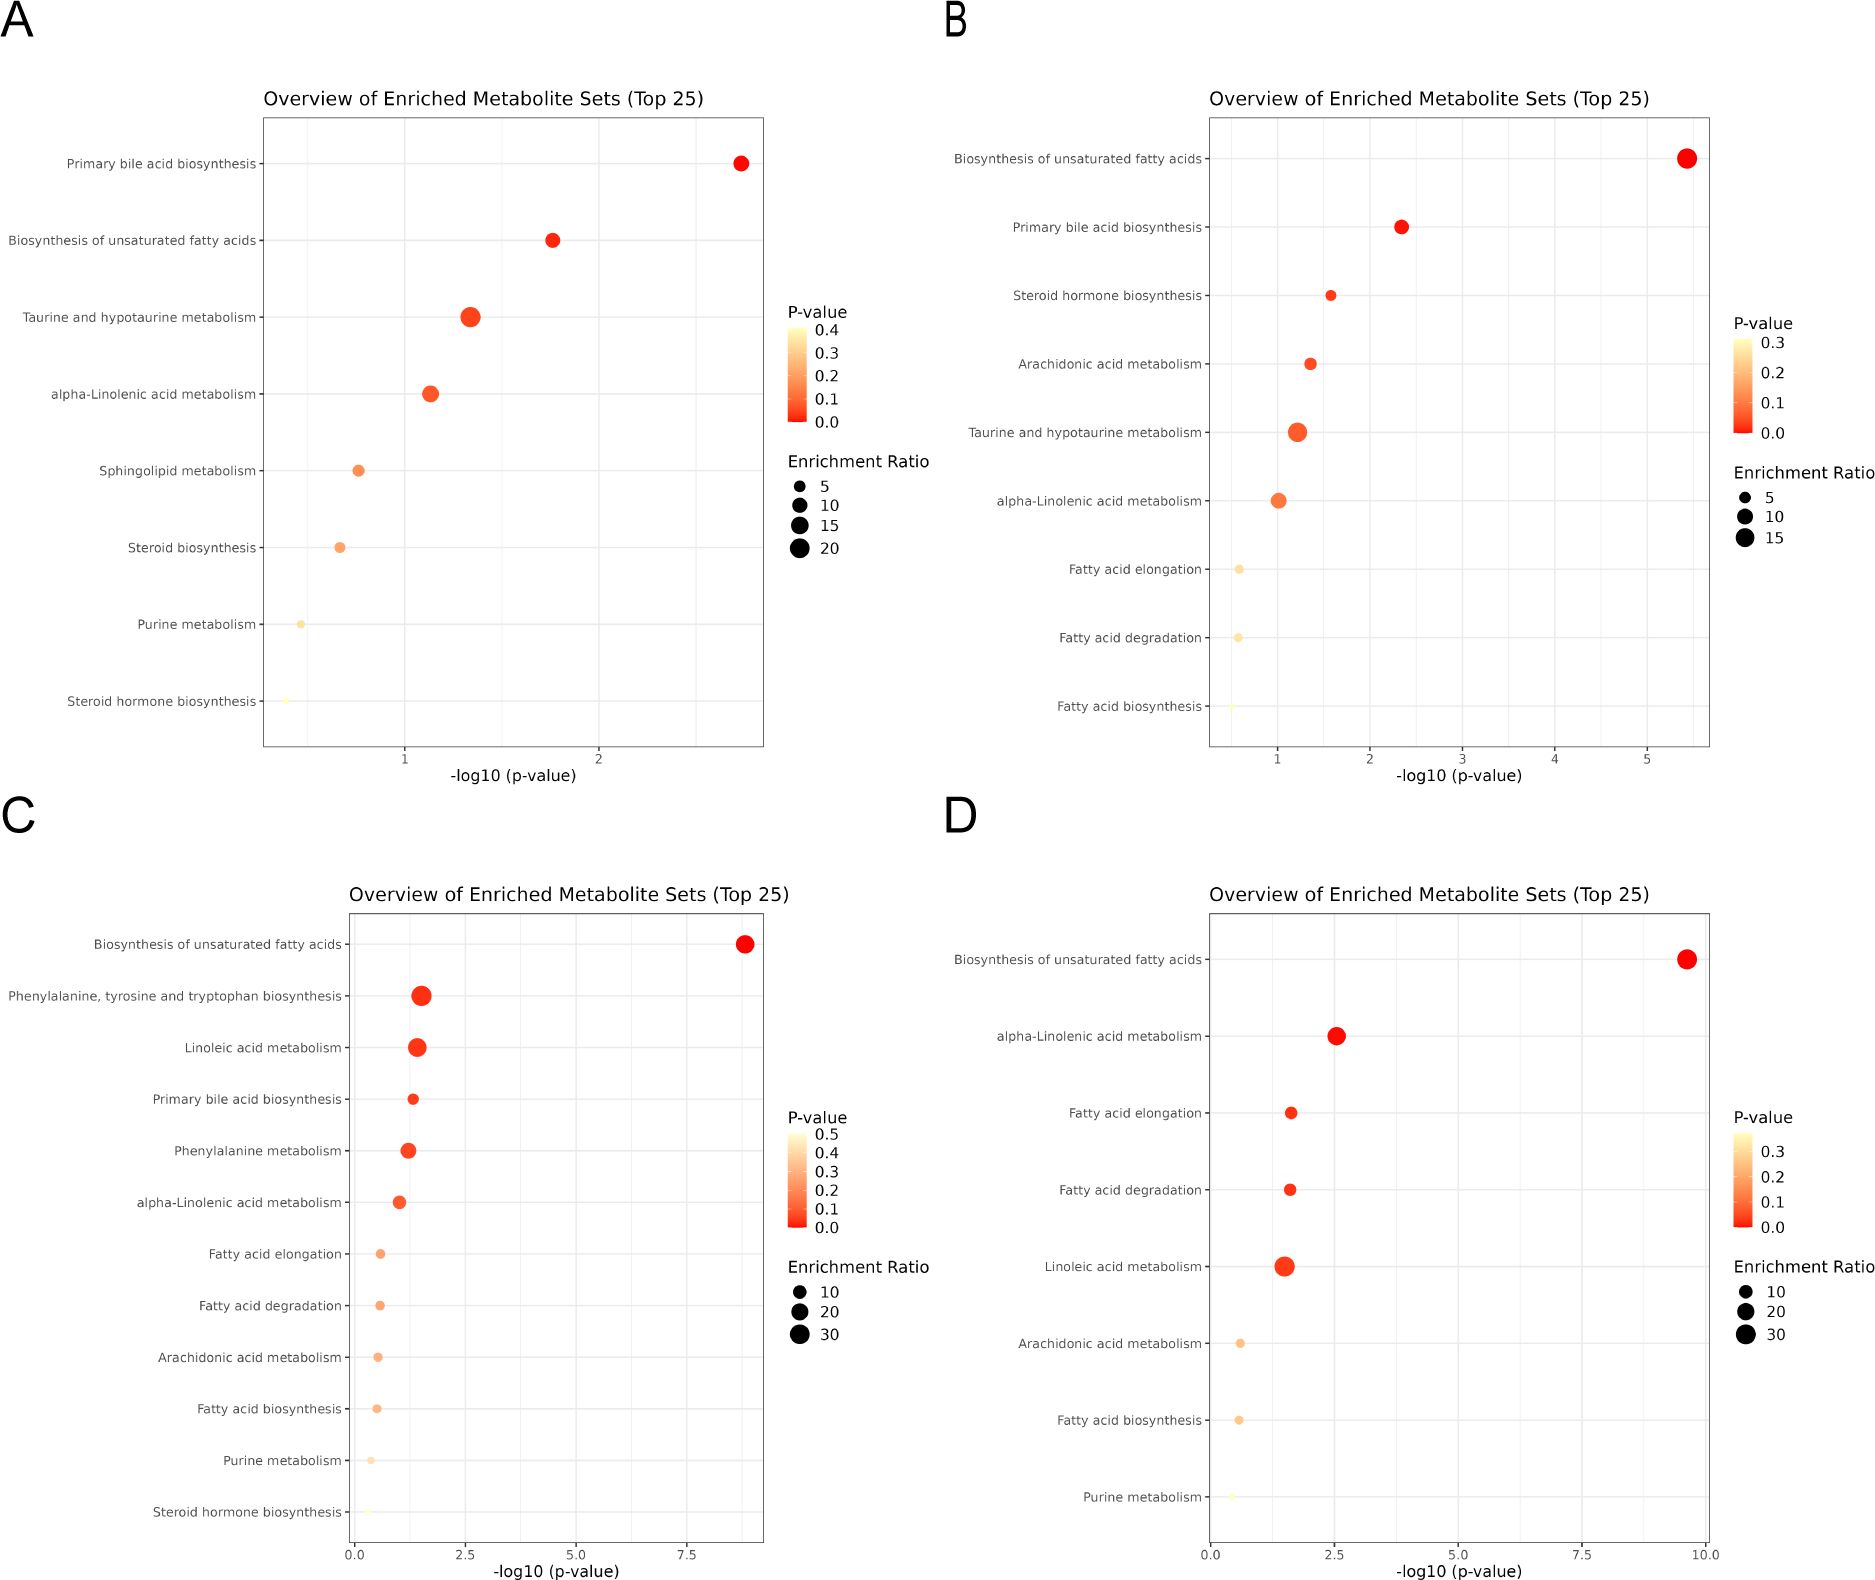
Figure 2. (A, B) are the differential metabolite pathway enrichment maps of the 2 mg BID group on day 1 and day 7, respectively. (C, D) are the differential metabolite pathway enrichment maps of the placebo group on day 1 and day 7, respectively.
In the placebo group, differentially abundant metabolite screening and identification (Supplementary Tables S4, S5) and metabolic pathway enrichment analysis (Figures 2C, D) were also performed. Figures 3A–D show the Venn diagrams for the placebo group and the 2 mg BID group, as well as bar charts depicting the number of upregulated and downregulated metabolites. The results of the metabolic pathway enrichment analysis (Figures 2C, D) revealed that the biosynthesis of unsaturated fatty acids and primary bile acid biosynthesis were also enriched in the placebo group.
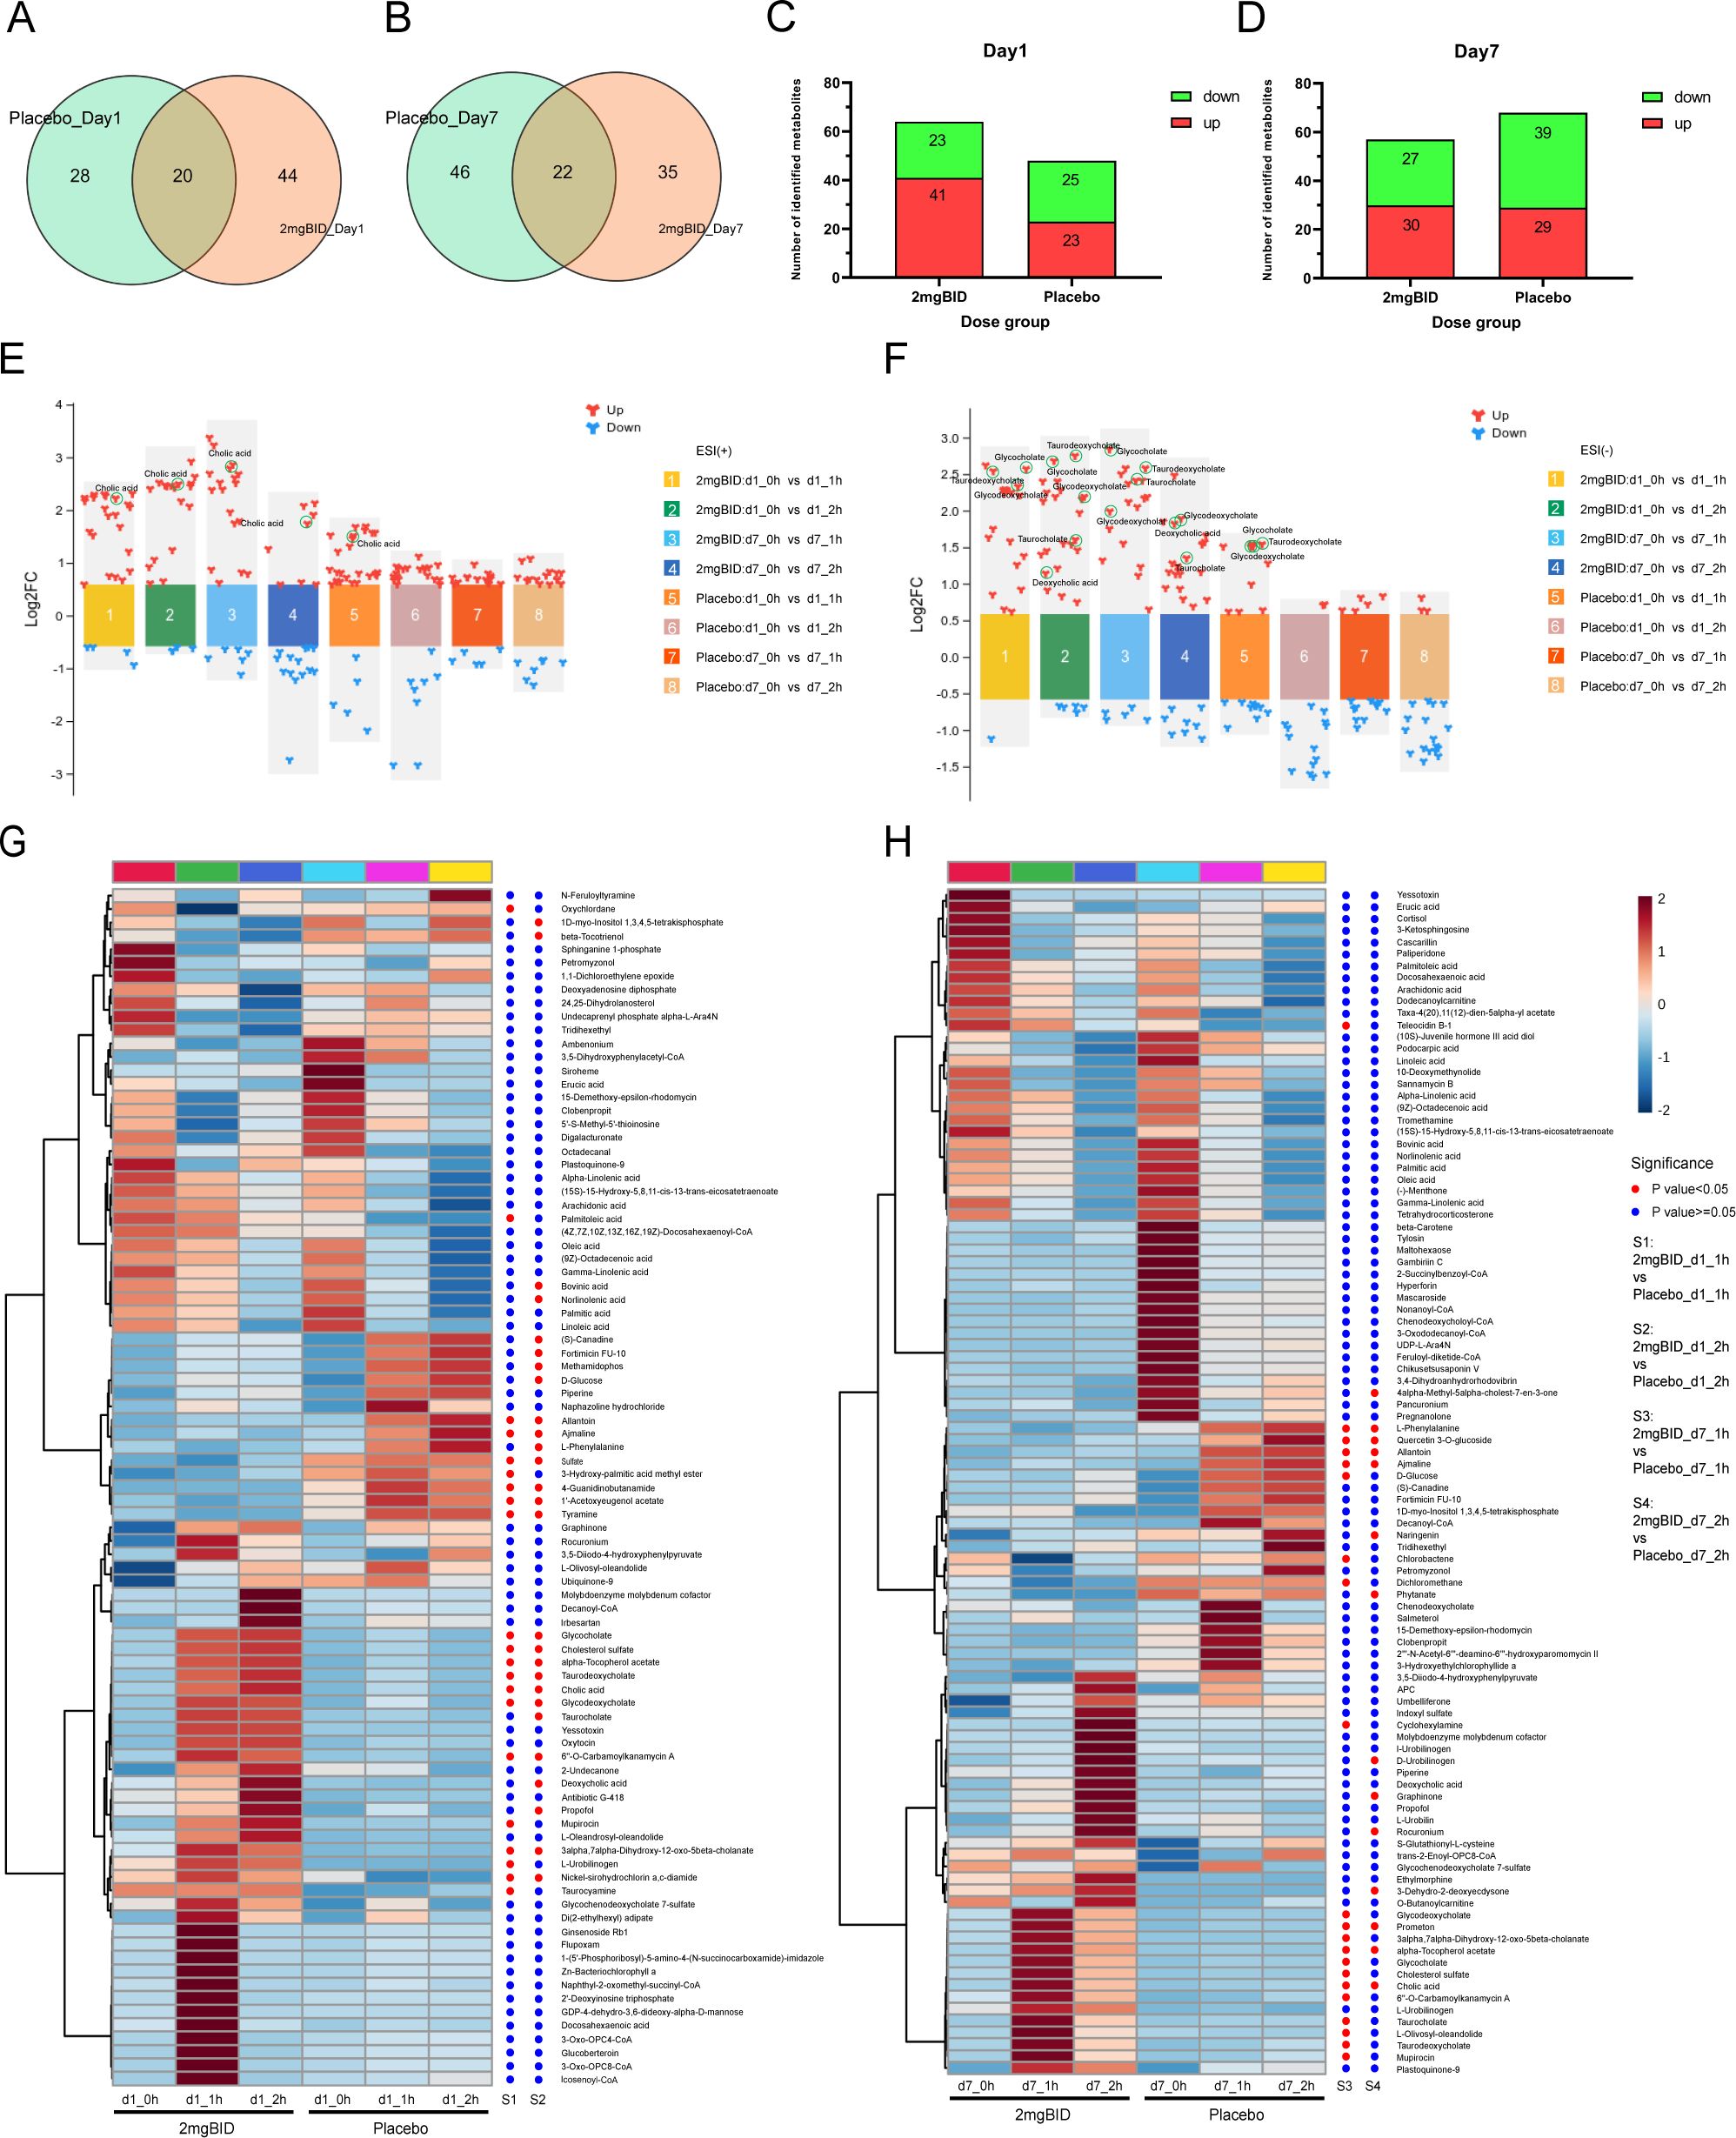
Figure 3. (A, B) Venn diagram of 2 mg BID group and placebo group on day 1 and day 7. (C, D) Histogram of the number of upregulated or down-regulated metabolites in the 2 mg BID group and placebo group on day 1 and day 7. (E, F) Multicomponent difference scatter plot of SY-009 before and after administration in positive and negative ion modes. (G, H) Heat maps of the 2 mg BID group and the placebo group, with dots on the right of the heat maps indicating whether the difference between the two groups was statistically significant. A red dot means P<0.05, and a blue dot means P≥0.05.
As shown in Figures 3E, F, on both Day 1 and Day 7, the increase in bile acid-related metabolites in the 2 mg BID group was greater than that in the placebo group. Heatmaps (Figures 3G, H) also showed the clustering of bile acid-related metabolites together, indicating that they had similar trends of change. Furthermore, as shown in Figures 4A–C, the upregulation of three primary bile acids (CA, GCA, and TCA) was statistically significant between the 2 mg BID group and the placebo group at 1 h or 2 h after administration on Days 1 and 7. Other secondary bile acids (DCA, GDCA, and TDCA) showed the same trend (Figures 4D–F). These changes suggested that the hypoglycaemic effect of SY-009 might be closely related to changes in the bile acid profile.
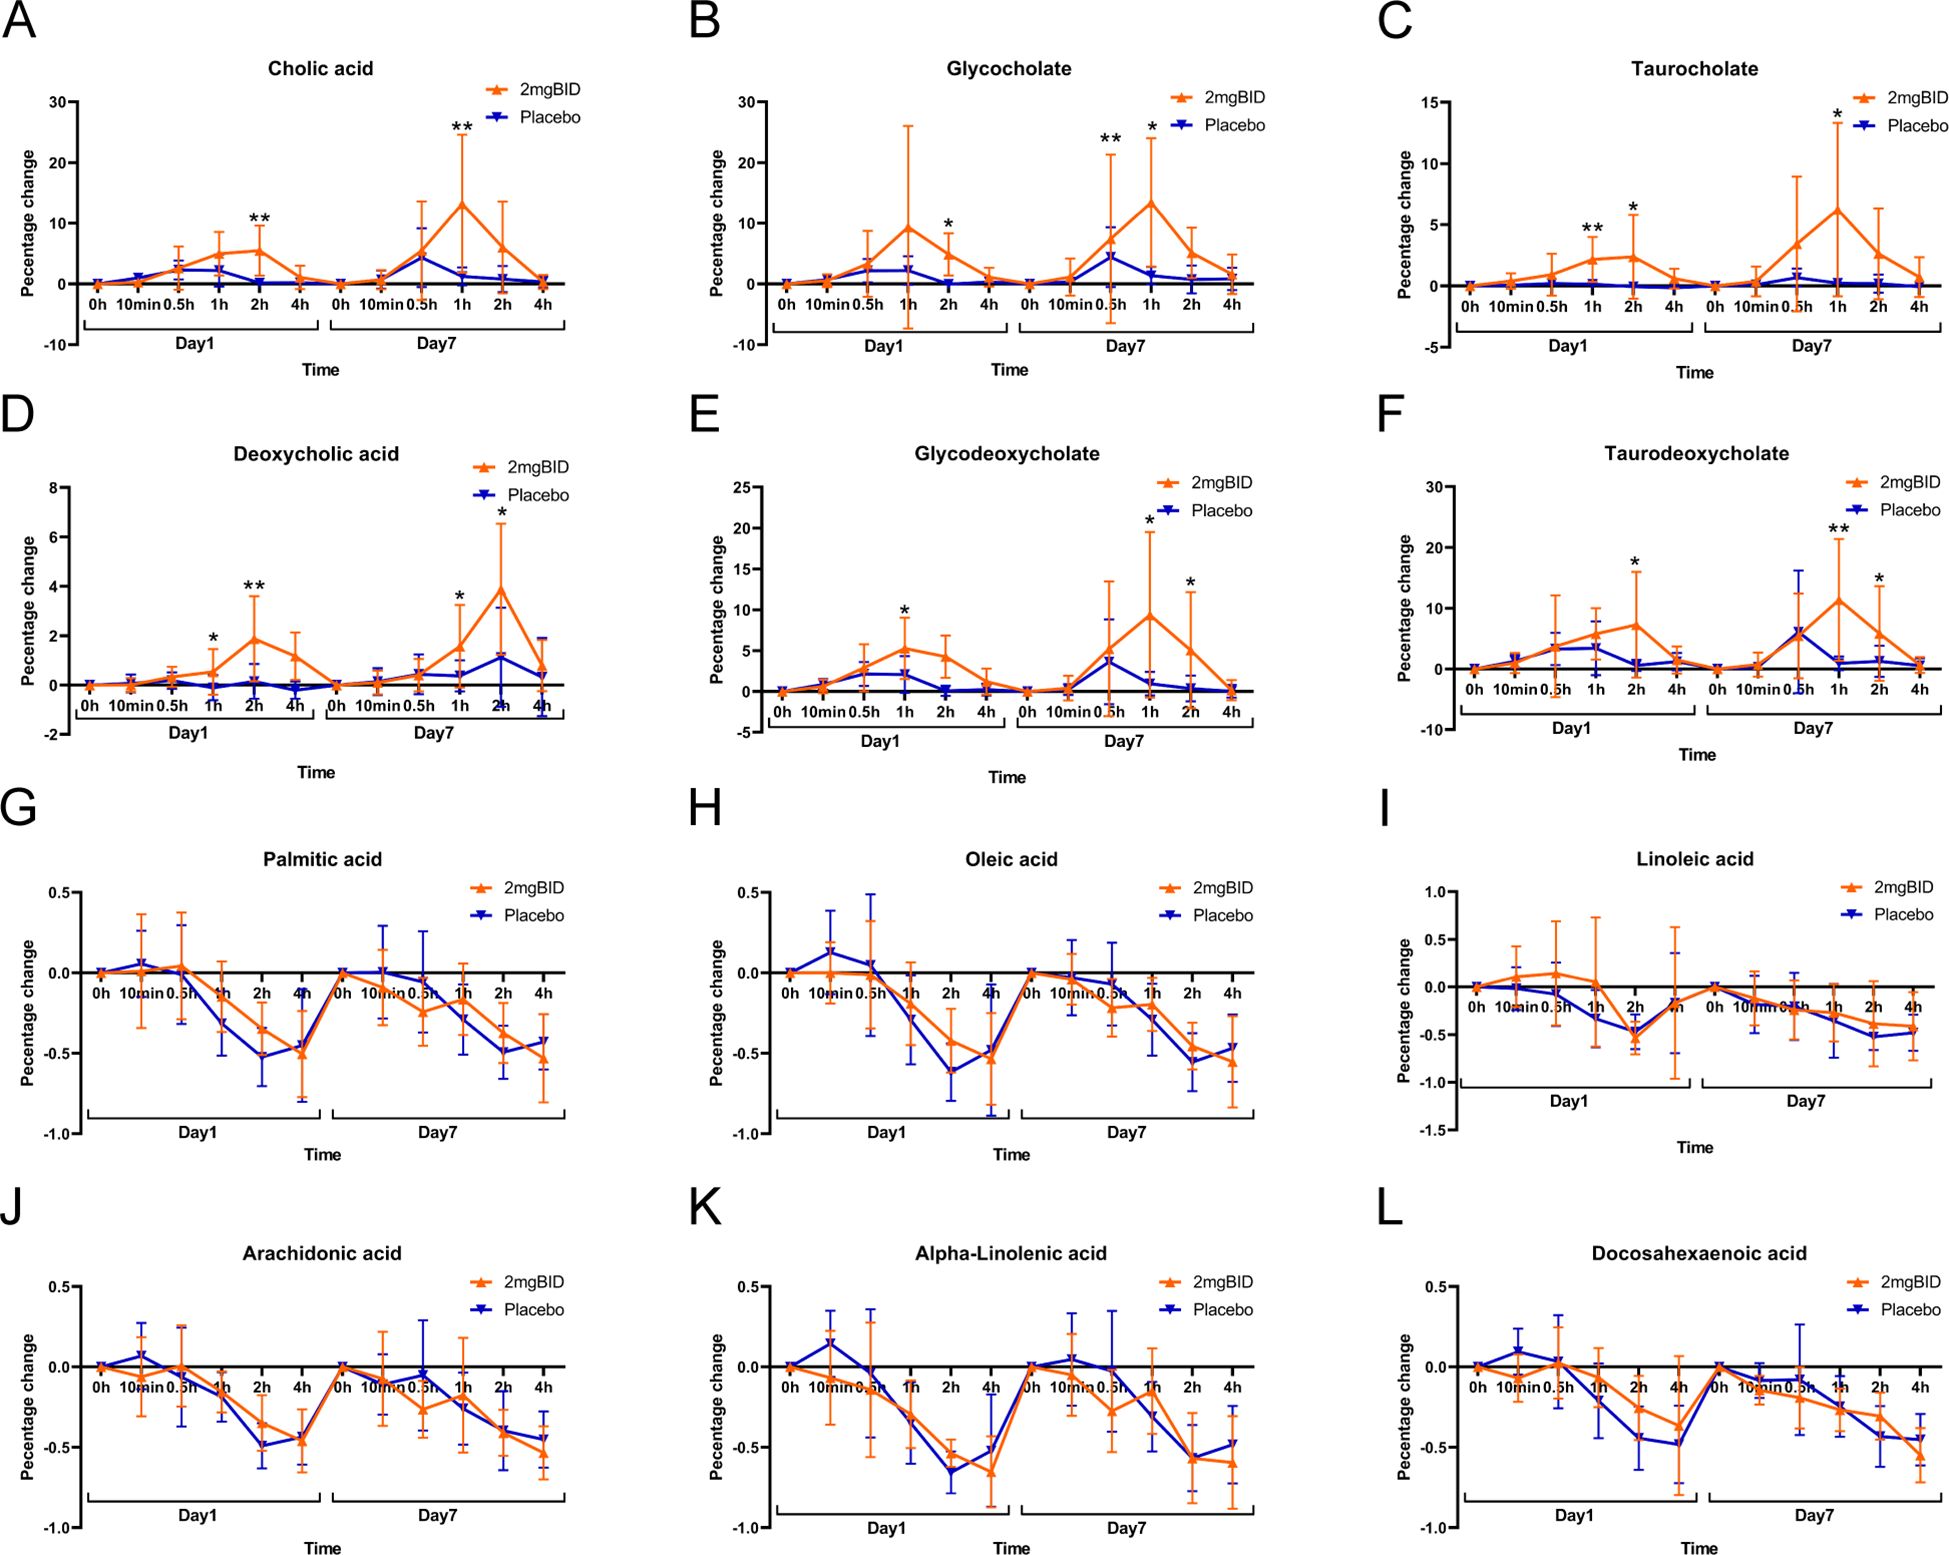
Figure 4. (A–F) Primary bile acid biosynthesis-related metabolite changes. (G–L) Biosynthesis of unsaturated fatty acids-related metabolite changes. *P < 0.05, **P < 0.01.
However, the metabolites involved in the biosynthesis of unsaturated fatty acids were downregulated in both the 2 mg BID group and the placebo group, and the decrease was not statistically significant (Figures 4G–L). Therefore, the changes in this metabolic pathway were not considered an effect of taking SY-009 capsules, and the same was true for several other metabolic pathways associated with unsaturated fatty acids.
In addition, as shown in Figure 2 and Figures 3G, H, other metabolic pathways, including steroid hormone biosynthesis, purine metabolism, and phenylalanine, tyrosine and tryptophan biosynthesis, also differed between the 2 mg BID group and the placebo group. The level of cholesterol sulfate, which is involved in steroid hormone biosynthesis, was significantly greater in the 2 mg BID group than in the placebo group. Allantoin, a metabolite involved in purine metabolism, was significantly upregulated in the placebo group compared with the 2 mg BID group. Phenylalanine, tyrosine and tryptophan biosynthesis was the specific pathway of the placebo group, and the metabolite involved in this pathway, L-phenylalanine, was significantly upregulated.
The differentially abundant metabolite tables (Supplementary Tables S6-S13), metabolic pathway enrichment plots (Supplementary Figures S5, S6A, B), and Venn diagrams (Supplementary Figures S6C, D) of the other dose groups, including 0.5 mg BID, 1 mg BID, 1 mg QD, and 2 mg QD, revealed that no special important pathways or metabolites were present. Therefore, on the basis of the results of untargeted metabolomics, we comprehensively considered bile acids as our target metabolites for accurate quantitation, focusing on the effects of SY-009 on the bile acid profile.
For the targeted metabolomics analysis, a representative chromatogram of bile acids is shown in Supplementary Figure S7A. After quantitative analysis of the common bile acids of all the samples via LC-MS/MS, as shown in Figure 5, in the 2 mg BID group, CA, CDCA, DCA, HDCA, GCA, GCDCA, GDCA, GHDCA, GUDCA, TCA, TCDCA, and TDCA significantly increased 1 h or 2 h after drug administration, whereas UDCA, LCA, THDCA, and TUDCA did not significantly change. Moreover, in the placebo group, GCA, GCDCA, and TCDCA significantly increased on Day 1 and Day 7. The levels of some bile acids also slightly but not significantly increased. In addition, only UDCA was downregulated in the placebo group, but there was a trend towards recovery after SY-009 capsules were taken. The changes in the 1 mg BID group and 0.5 mg BID group tended to be similar to those in the 2 mg BID group, but the degree of change was not as large as that in the 2 mg BID group. The changes in the 1 mg QD and 2 mg QD groups after drug treatment are shown in Supplementary Figures S7B–E, and no special conditions were observed.
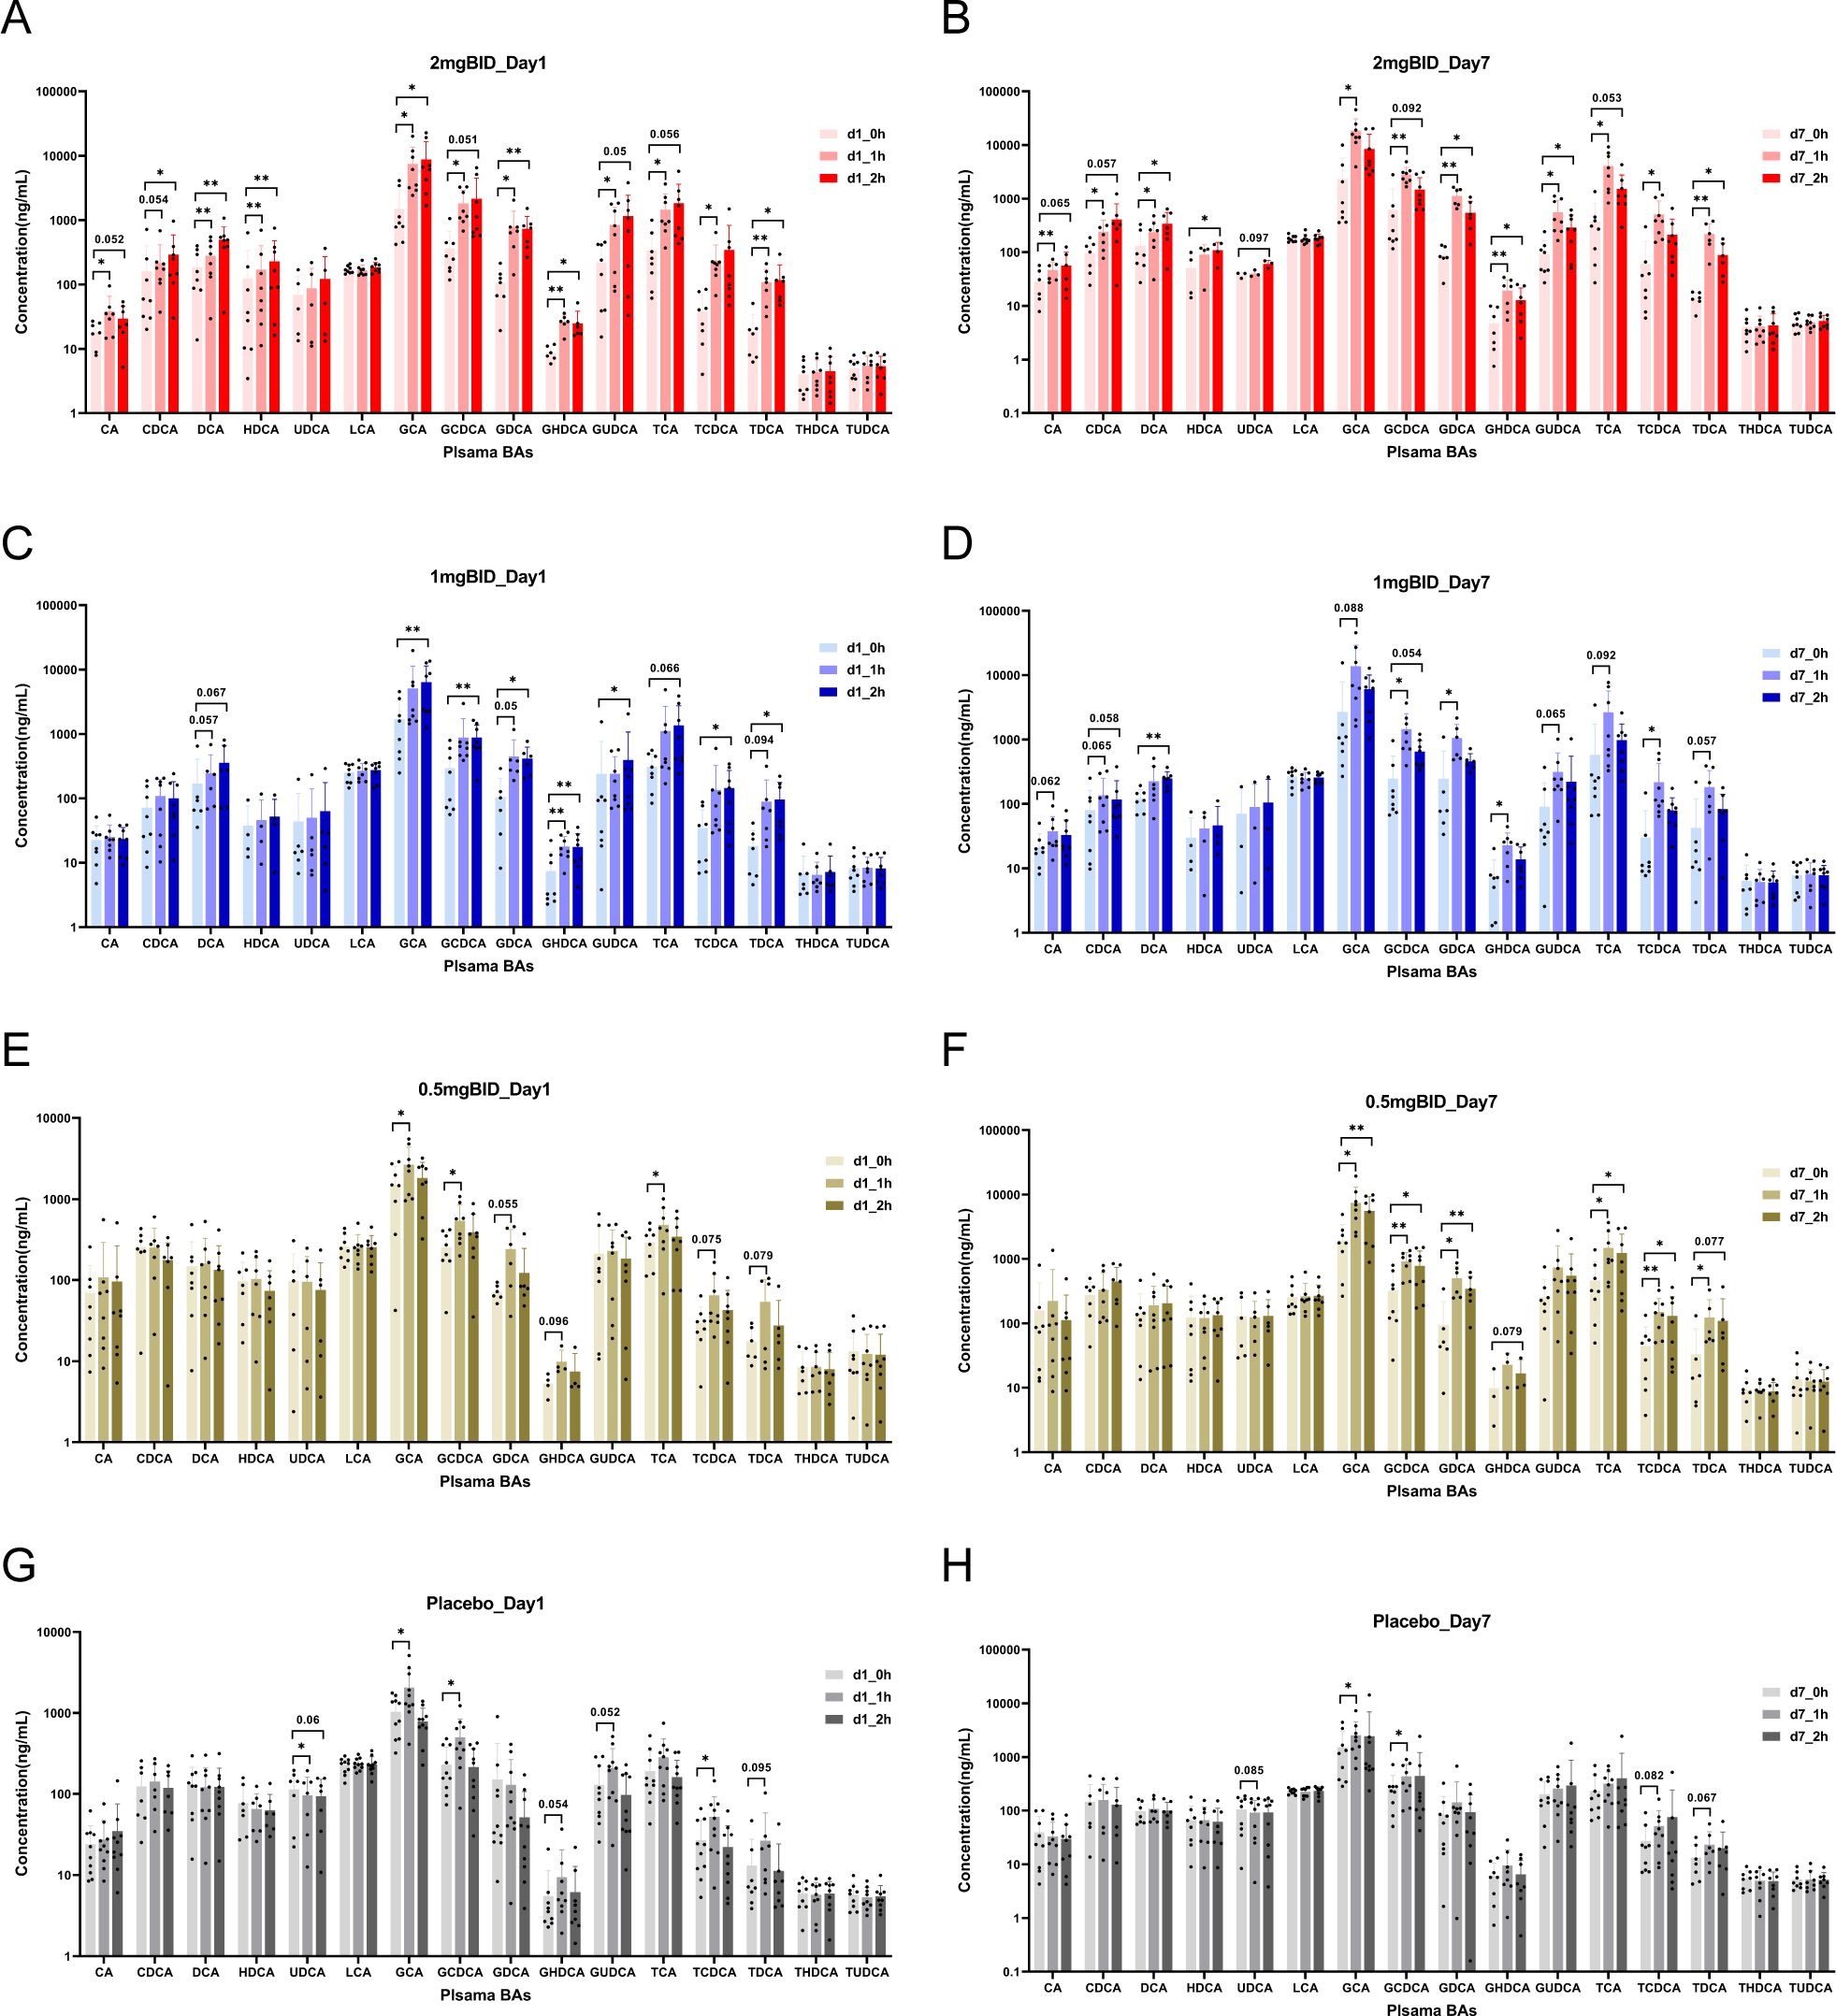
Figure 5. On day 1 or day 7, the changes of bile acids before and after administration in 2 mg BID group, 1 mg BID group, 0.5 mg BID group, and placebo group. (A) 2 mg BID_Day 1; (B) 2 mg BID_Day 7; (C) 1 mg BID_Day 1; (D) 1 mg BID_Day 7; (E) 0.5 mg BID_Day 1; (F) 0.5 mg BID_Day 7; (G) Placebo_Day 1; (H) Placebo_Day 7. *P < 0.05, **P < 0.01, ns P≥0.05.
The BID dose group and the placebo group were subsequently selected to plot the percentage change in bile acid levels compared with the baseline levels (Figure 6). The results revealed that the levels of LCA, THDCA, and TUDCA in each SY-009 group remained stable after administration, with no significant difference compared with those in the placebo group. However, CA, CDCA, DCA, HDCA, UDCA, GCA, GCDCA, GDCA, GHDCA, GUDCA, TCA, TCDCA, and TDCA increased after treatment and peaked at 1 h or 2 h, with the degree of increase being dose-dependent. The increases in these bile acids in the 2 mg BID group was significantly greater than that in the placebo group. Some bile acids in the 1 mg BID group also showed a similar effect to that of the 2 mg BID group or even slightly exceeded it. This might have been due to individual differences, or the 1 mg BID dose possibly achieve maximum efficacy in certain cases. Furthermore, some bile acids tended to increase on Day 7 compared with Day 1, which might be related to continuous medication.
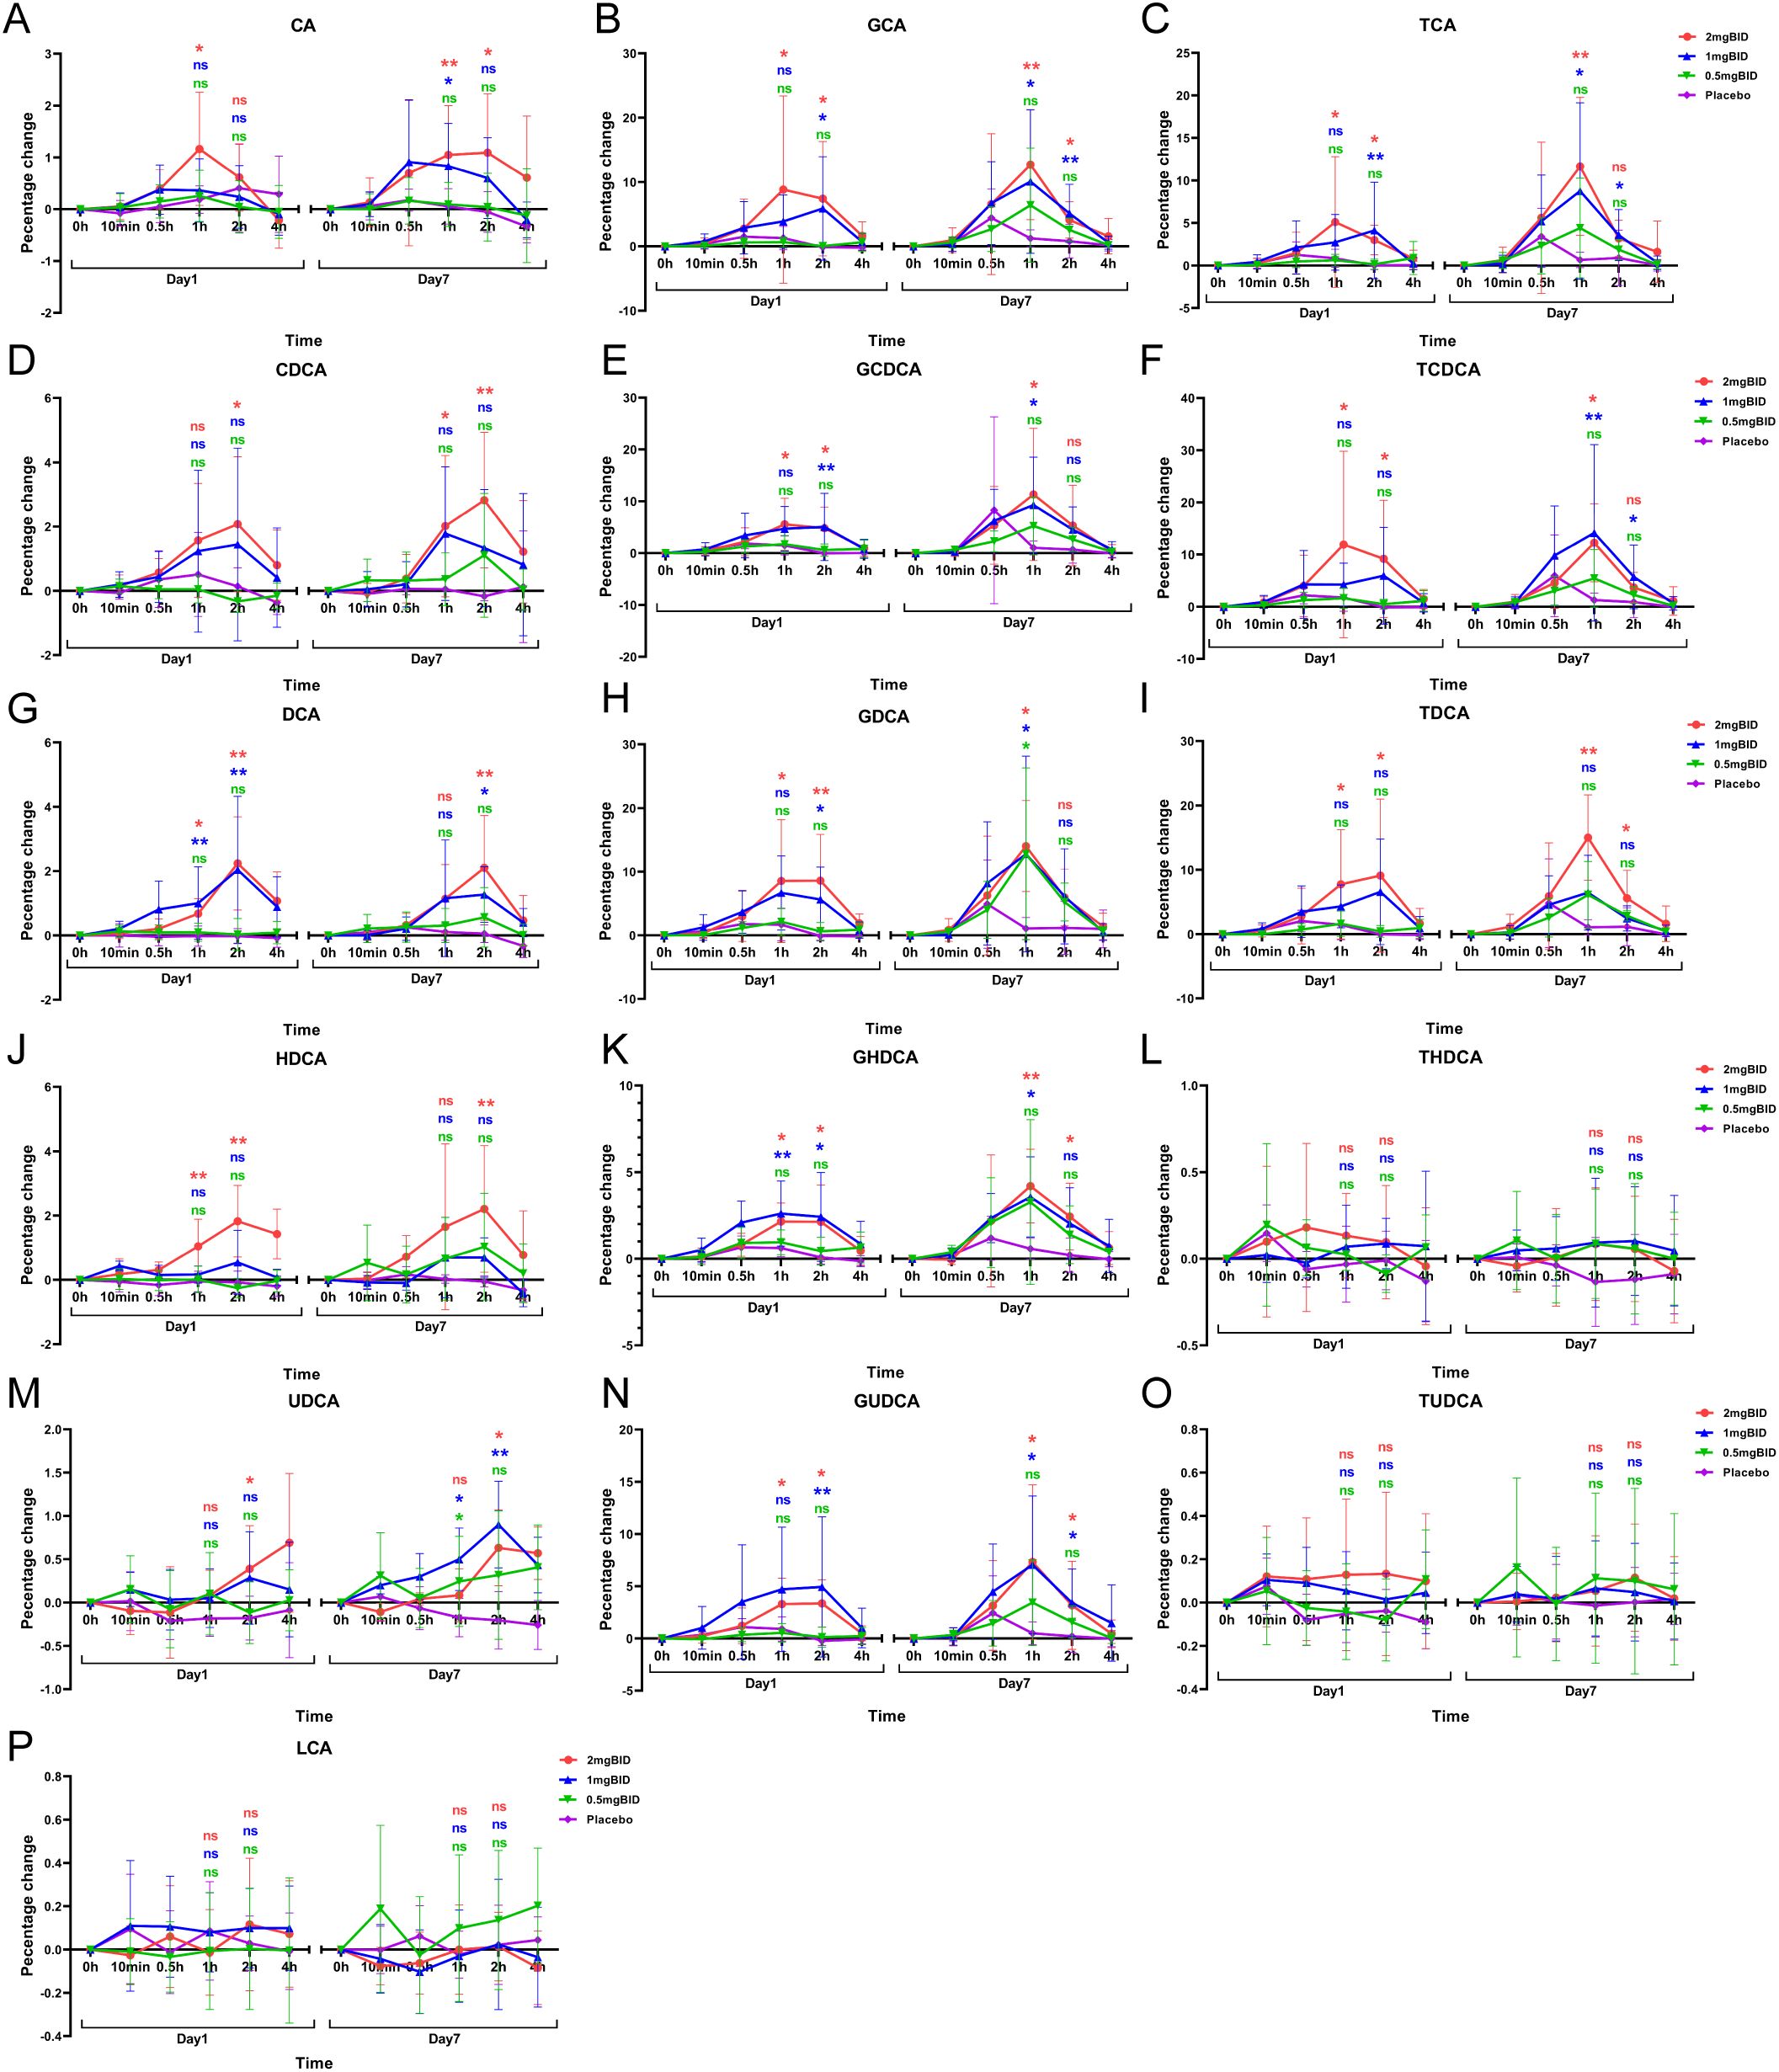
Figure 6. Percentage change from baseline after administration of 16 bile acids: CA(A), GCA(B), TCA(C), CDCA(D), GCDCA(E), TCDCA(F), DCA(G), GDCA(H), TDCA(I), HDCA(J), GHDCA(K), THDCA(L), UDCA(M), GUDCA(N), TUDCA(O), LCA(P). *P < 0.05, **P < 0.01, ns P≥0.05. The LSD method was used to perform multiple comparisons.
The proportion of bile acids in the 2 mg BID group and placebo group were subsequently analysed. Figures 7A–C shows that after administration, the levels of free bile acids, glycine-conjugated bile acids, and taurine-conjugated bile acids were significantly greater in the 2 mg BID group than in the placebo group. However, regarding the proportions of the three types of bile acids, in both the 2 mg BID group and the placebo group, the proportion of free bile acids in the total bile acid content decreased, the proportion of glycine-conjugated bile acids increased, and the proportion of taurine-conjugated bile acids tended to remain stable (Figure 7D). In addition, the degree of decrease in free bile acid and the degree of increase in glycine-conjugated bile acid in the 2 mg BID group were significantly greater than those in the placebo group, and there was no significant difference in the taurine-conjugated bile acid ratio between the two groups (Figures 7E–G).
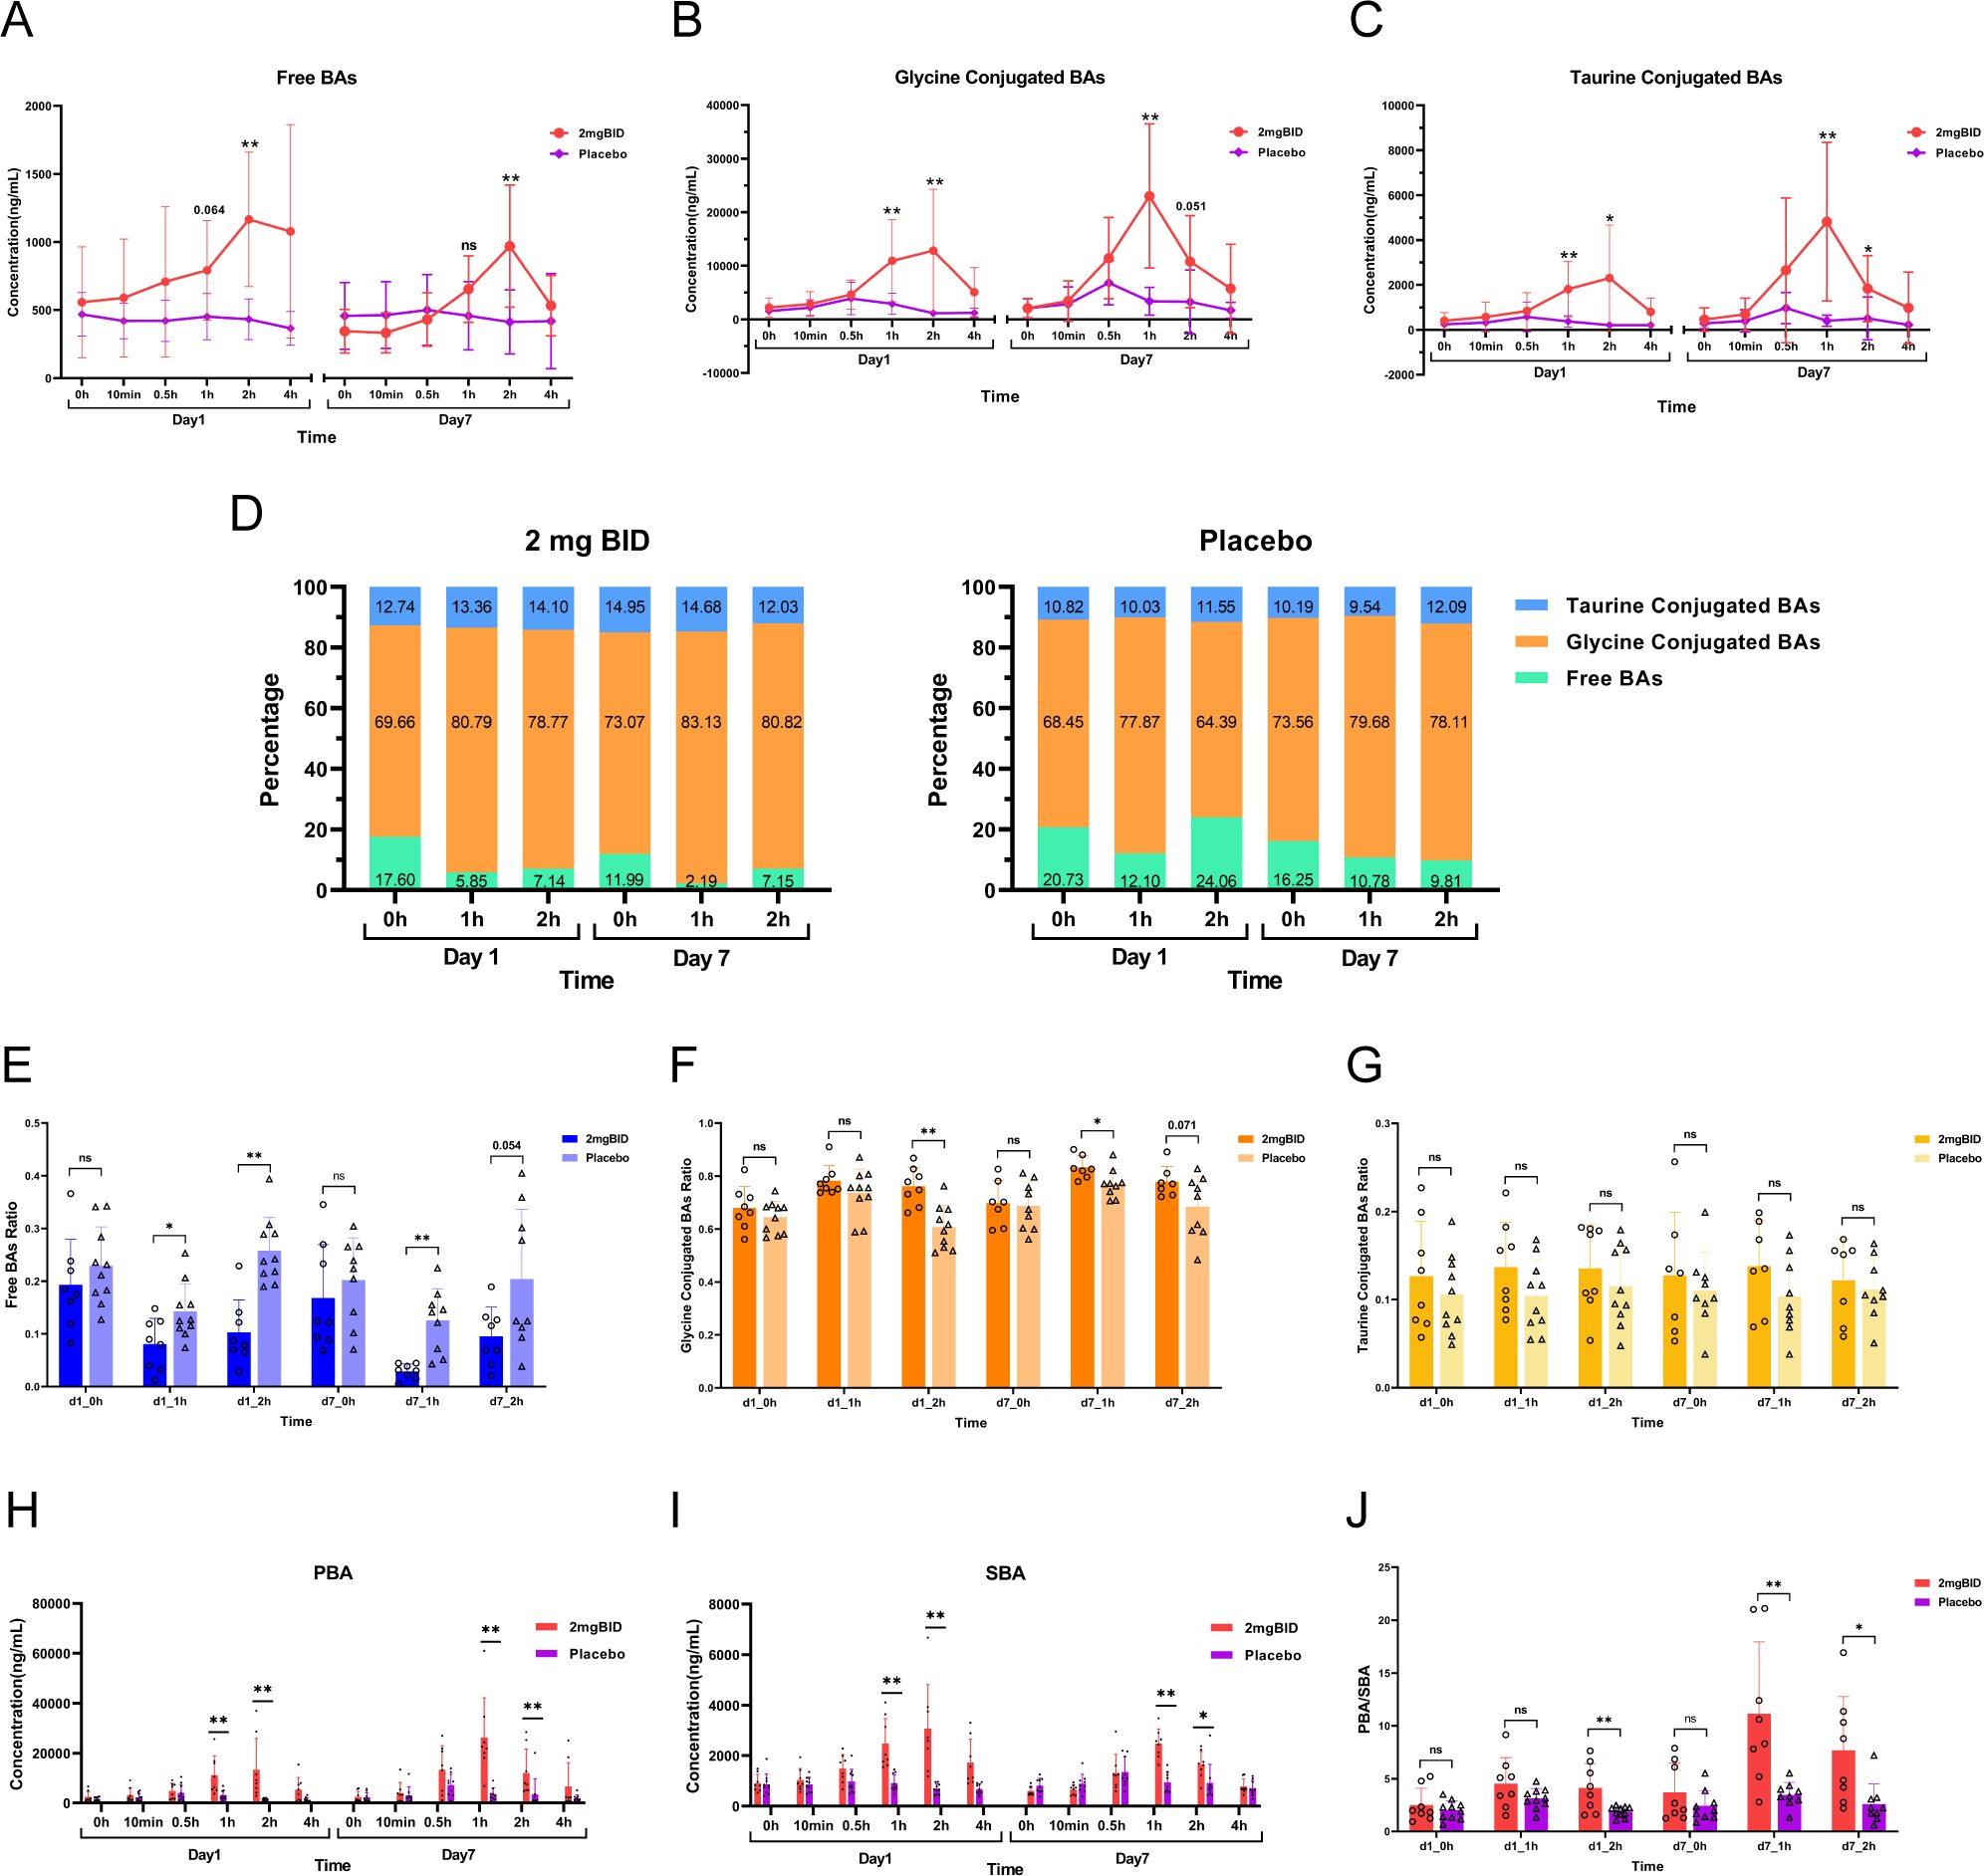
Figure 7. (A–C) Changes and differences in the concentration of free bile acids, glycine-conjugated bile acids, and taurine-conjugated bile acids in the 2 mg BID group and placebo group. (D) Changes in the ratio of free bile acids, glycine-conjugated bile acids, and taurine-conjugated bile acids in the 2 mg BID group and placebo group. (E–G) Difference in proportion of three types of bile acids between the 2 mg BID group and the placebo group. (H, I) Changes and differences in the concentration of PBA and SBA in the 2 mg BID group and placebo group. (J) The difference of PBA/SBA between the 2 mg BID group and the placebo group. *P < 0.05, **P < 0.01, ns P≥0.05.
Moreover, the concentrations of primary bile acid (PBA) and secondary bile acid (SBA) in the 2 mg BID group were significantly greater than those in the placebo group at 1 h or 2 h after administration (Figures 7H, I). Furthermore, the PBA/SBA ratio in the 2 mg BID group also increased, and the degree of increase in the ratio was significantly greater than that in the placebo group, especially on Day 7 (Figure 7J).
Preliminary clinical studies have shown that SY-009 can reduce postprandial blood glucose but does not affect fasting blood glucose (22). Data on C-peptide and other indices related to T2DM have been obtained. Changes in these indices were also accompanied by changes in bile acid levels. Therefore, we selected the data 2 hours after the seventh day of administration and analysed the correlation between the percentage change in bile acid levels compared with baseline levels and the change in these indices. The results revealed that the free or conjugated status of bile acids in the bile acid pool was closely related to HOMA-β (Figure 8).
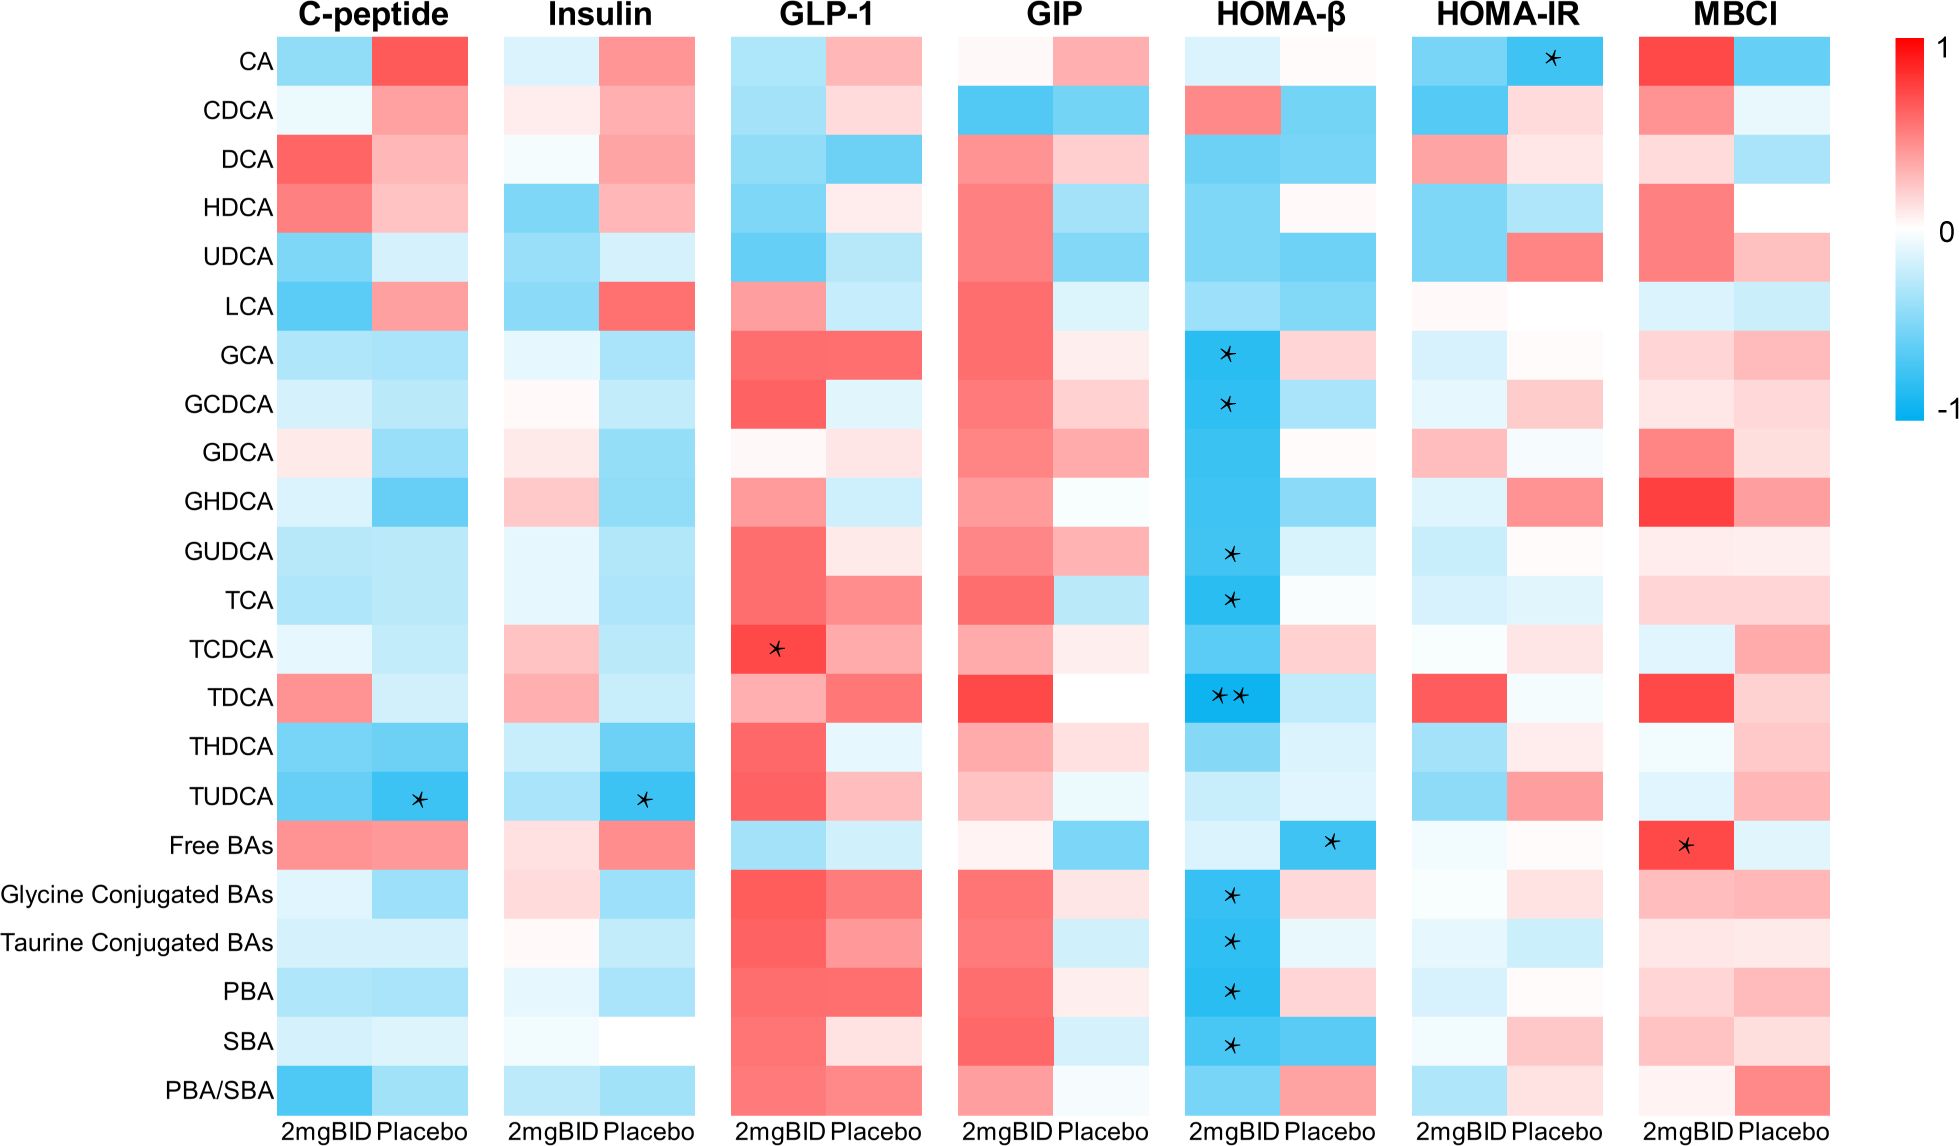
Figure 8. On day 7, spearman correlation analysis of percentage changes of various bile acids at 2h after administration with C-peptide and other indicators. *P < 0.05, **P < 0.01.
Metabolomics can reflect the dynamic changes in metabolites throughout the body. T2DM is a common metabolic disease, and investigating the pathophysiological and metabolic regulatory mechanisms of T2DM using metabolomics technology is highly important. Therefore, this study was based mainly on untargeted and targeted metabolomics technologies to analyse subjects’ plasma samples obtained from patients in the SY-009 phase Ib clinical study, aiming to reveal the effect of SY-009 on T2DM.
In the untargeted metabolomics analysis, after SY-009 administration, a series of metabolic pathways, including primary bile acid biosynthesis, biosynthesis of unsaturated fatty acids, steroid hormone biosynthesis, purine metabolism, and phenylalanine, tyrosine and tryptophan biosynthesis, were altered. Among them, the unsaturated fatty acid-related metabolic pathways and the bile acid-related metabolic pathways in the 2 mg BID group were among the key metabolic pathways enriched. However, there were no significant differences in unsaturated fatty acids, including palmitic acid, oleic acid, linoleic acid, alpha-linolenic acid, docosahexaenoic acid, or arachidonic acid, between the 2 mg BID group and the placebo group, suggesting that the changes in these unsaturated fatty acids may not be attributable to the effects of SY-009. Unlike the increase in unsaturated fatty acids, the increase in bile acids, including CA, GCA, TCA, DCA, GDCA, and TDCA, in the 2 mg BID group was significantly greater than that in the placebo group. Many studies have shown a close correlation between bile acids and T2DM. For example, Alessandro Mantovani et al. reported significant differences in bile acid profiles between T2DM patients and non-T2DM patients (25). Bingting Chen et al. revealed that GUDCA may play a hypoglycaemic role by regulating bile acid metabolism (26). With respect to other metabolic pathways affected by SY-009, some relevant studies have investigated the metabolites involved in these pathways. The level of cholesterol sulfate involved in the steroid hormone biosynthesis pathway was significantly greater in the 2 mg BID group than in the placebo group. Cholesterol sulfate, which is abundant in the gut (27), is an important regulatory molecule and acts as an endogenous regulator of cholesterol synthesis (28). Dongke Xu et al. reported that cholesterol sulfate promotes cholesterol synthesis in colon epithelial cells to relieve ulcerative colitis (29). Bile acids are produced by cholesterol, and the changing trend of cholesterol sulfate is consistent with that of bile acids, suggesting that the change in bile acids may be related to the promotion of cholesterol sulfate by SY-009. In addition, Xueping Zhang et al. proposed that cholesterol sulfate may have a protective effect on β-cells (30). Therefore, the increase in cholesterol sulfate caused by SY-009 may be important. With respect to the metabolic pathways of phenylalanine, tyrosine and tryptophan biosynthesis, the increase in phenylalanine in the placebo group was mitigated to some extent by SY-009. In previous studies, phenylalanine-related aromatic amino acids have been reported as potential biomarkers of T2DM in several studies (21, 31, 32). Qian Zhou et al. reported that phenylalanine impairs insulin signalling and inhibits glucose uptake by modifying insulin receptor beta (33). These studies suggest that SY-009 may ameliorate T2DM by affecting the metabolism of aromatic amino acids. In addition, the level of allantoin in the placebo group was significantly greater than that in 2 mg BID group. However, both Junnan Ma et al. (34) and Hyeon-Kyu Go et al. (35) reported the antiglucose effect of allantoin on diabetic mice. This contradicts our experimental results and requires further consideration.
Given the limited number of plasma samples, bile acids were selected as our targeted quantitative metabolites to reveal the effect of SY-009 on the bile acid profile because bile acids play an important role in regulating systemic metabolism and inflammation to affect diabetes, and they are key regulators and novel treatment targets in T2DM (36). In particular, GUDCA can regulate bile acid levels and alter gut microbiota to attenuate diabetes (26). Moreover, modulating bile acids is also a mechanism by which metformin exerts its glucose-lowering effect (37). Thus, targeting bile acid metabolism is a potential strategy for treating T2DM.
In the targeted metabolomics results, after SY-009 administration, in addition to LCA, THDCA, and TUDCA, other bile acids, including CA, CDCA, DCA, HDCA, UDCA, GCA, GCDCA, GDCA, GHDCA, GUDCA, TCA, TCDCA, and TDCA were significantly increased compared with those in the placebo group, and these increases were dose-dependent. In addition, in the whole bile acid pool, the proportions of free, glycine-conjugated, and taurine-conjugated bile acids also changed greatly. Compared with those in the placebo group, in the SY-009 group, the proportion of free types decreased significantly, the proportion of glycine-conjugated types increased significantly, and the proportion of taurine-conjugated types tended to be stable. Moreover, PBA/SBA also showed a significant upward trend.
At present, increasing evidence shows that the coregulation of the intestinal flora and bile acids may mediate host metabolism and affect the occurrence and development of diabetes (26, 38, 39). In the bile acid synthesis pathway in humans, the metabolism of cholesterol produces primary bile acids, including CA and CDCA, in the liver. Besides, free bile acids are usually combined with glycine or taurine to form conjugated bile acids. Then, the primary bile acids enter the intestine and are deconjugated by bacterial bile salt hydrolase (BSH) and dehydroxylated by bacterial 7a-dehydroxylase to form DCA and LCA. A small amount of CDCA is converted to UDCA, and LCA can be converted to HDCA by intestinal 6α- and 6β-hydroxylase (40).
According to the results of our study, the increase in primary bile acid content after the consumption of SY-009 suggests that SY-009 may promote the conversion of cholesterol to primary bile acids. In addition, DCA significantly increased after drug treatment, suggesting that BSH and 7α-dehydroxylase are likely to be activated. The stable trend of LCA after taking the drug may be due to the inhibition of other unknown channels or because LCA is conjugated with sulfate and excreted in the stool and urine rather than entering the bloodstream (Chiang and Ferrell 2020). The intestinal environment has a strong influence on bile acid deconjugation and conjugation. Besides, BSH activity is restricted to the genera Clostridium, Enterococcus, Bifidobacterium, Bacteroides, and Lactobacillus, while 7α-dehydroxylase activity mainly originates from Clostridium XIVa clusters (41, 42). All BSH reactions rely on the hydrolysis of amide bonds to release taurine or glycine (43–46). Moreover, the intestinal flora has different preferences for glycine-conjugated BAs and taurine-conjugated BAs. For example, in Bifidobacterium, three types of BSH have been found, two of which have high activity. They all prefer glycine-conjugated BAs to taurine-conjugated BAs (47). Moreover, after SY-009 capsules were taken, secondary bile acids, including HDCA and UDCA, tended to bind to glycine rather than taurine and were associated with the gut microbiota. In addition, the significant increase in PBA/SBA is also worth paying attention to. At present, studies in other fields have shown the importance of changes in the bile acid ratio. For example, Tianlu Chen et al. chose the bile acid glycine: taurine ratio as a biomarker to monitor the progression of liver disease (48). Tingting Gao et al. reported that the primary/secondary bile acid ratio was a serum diagnostic marker for the need for surgery in infants with necrotizing enterocolitis (49). Taken together, although the effect and mechanism of the change in the plasma bile acid ratio after SY-009 administration have not been clarified, modulating the gut microbiota composition may be a possible mechanism by which SY-009 affects diabetes.
Importantly, the nuclear farnesoid X receptor (FXR) and the membrane Takeda G protein-coupled receptor 5 (TGR5) are currently the most important receptors mediating the regulation of bile acids (50). The effect of intestinal FXR on liver metabolism was first reported by Sayin et al. (51). Yangfeng Hou et al. also conducted a systematic review of the multi-pathway regulation of blood glucose by FXR (52). The important role of TGR5 in the occurrence and development of metabolic syndrome, such as diabetes, has also been reviewed and reported by Xianmei Gou et al. (53). Therefore, whether SY-009 has an effect on FXR and TGR5 is a future research direction.
SY-009, a novel SGLT1 inhibitor, is difficult to absorb orally, and SGLT1 receptors are abundantly distributed in the intestine (4). In the phase Ib clinical study, after SY-009 was taken, the drug concentration in plasma was below the limit of quantitation (LOQ), and PK parameters were not available (22). The characteristic of unrelated PK/PD may be that SY-009 is not directly absorbed into the digestive tract and instead acts on SGLT1 locally. Our results showed that SY-009 significantly modulated the composition of bile acids. There is a bidirectional relationship between the intestinal microbial community and bile acids (54). The microbial flora closely regulates the metabolism and synthesis of bile acids, and the composition of the bile acid pool affects the diversity and homeostasis of the intestinal flora. However, whether SY-009 can directly modulate the activities of enzymes responsible for cholesterol metabolism and bile acid synthesis or regulate the intestinal flora is unclear. The results of our metabolomics study suggest that the coregulation of bile acids and the intestinal flora may be an important part of the hypoglycaemic mechanism of SY-009. Further studies can be conducted in the future if there is an opportunity to obtain stool samples from patients after taking the drug.
Considering various conditions, such as manpower, material resources, and limited blood samples, we only quantified bile acids based via targeted metabolomics, which is a limitation of this study. However, the untargeted metabolomics results suggest that SY-009, and even other SGLT1 inhibitors, may affect on more metabolic pathways related to T2DM, which needs to be clarified. Furthermore, the specific mechanisms of SY-009 need to be further investigated.
In summary, our results revealed that there are significant changes in plasma metabolomics in patients with T2DM after taking SY-009 capsules. In particular, a series of bile acids, including CA, CDCA, DCA, HDCA, UDCA, GCA, GCDCA, GDCA, GHDCA, GUDCA, TCA, TCDCA, and TDCA, were increased significantly, and the bile acid ratios, including free bile acids, glycine-conjugated bile acids and PBA/SBA, were also significantly affected by SY009. These changes in the bile acid profile provide a new perspective on the hypoglycaemic effect of SY-009. This study is the first application of metabolomics for SGLT1 inhibitors, which is highly important for understanding the pathogenesis, progression, prognosis, and treatment of T2DM.
The original contributions presented in the study are included in the article/Supplementary Material. Further inquiries can be directed to the corresponding author/s.
This study was approved by the Ethics Committee of Nanjing Drum Tower Hospital with the ethics number 2022-187-02. The Phase Ib clinical study was registered on the website of ClinicalTrials.gov (https://www.clinicaltrials.gov/) with the identifier: NCT04345107. The studies were conducted in accordance with the local legislation and institutional requirements. The participants provided their written informed consent to participate in this study.
HY: Data curation, Formal analysis, Investigation, Methodology, Software, Validation, Visualization, Writing – original draft, Writing – review & editing. YZha: Formal analysis, Software, Visualization, Writing – original draft. YH: Software, Visualization, Writing – original draft. YW: Visualization, Writing – original draft. YZhu: Visualization, Writing – original draft. LH: Writing – review & editing. YY: Resources, Writing – original draft. RS: Conceptualization, Methodology, Project administration, Supervision, Writing – review & editing. JL: Conceptualization, Funding acquisition, Investigation, Project administration, Resources, Supervision, Writing – review & editing.
The author(s) declare financial support was received for the research, authorship, and/or publication of this article. This study was supported by fundings for Clinical Trials from the Affiliated Drum Tower Hospital, Medical School of Nanjing University (2022-LCYJ-MS-33), the Drug Regulatory Science Research Program of Jiangsu Provincial Drug Administration (2022-37) and the National Natural Science Foundation of China (31371399).
The authors would like to thank all the subjects who participated in this study. The authors also thank the teams of Nanjing Drum Tower Hospital Phase I Clinical Trial Center and Suzhou Yabao Pharmaceutical Research and Development Co., Ltd for their efforts in the Phase 1b clinical study, which enabled this study to be conducted with blood samples.
The authors declare that the research was conducted in the absence of any commercial or financial relationships that could be construed as a potential conflict of interest.
All claims expressed in this article are solely those of the authors and do not necessarily represent those of their affiliated organizations, or those of the publisher, the editors and the reviewers. Any product that may be evaluated in this article, or claim that may be made by its manufacturer, is not guaranteed or endorsed by the publisher.
The Supplementary Material for this article can be found online at: https://www.frontiersin.org/articles/10.3389/fendo.2025.1487058/full#supplementary-material
Supplementary Table 1 | 2 mg BID PLS-DA model parameters
Supplementary Table 2 | 2 mg BID_day 1: The identification of differential metabolites based on untargeted metabolomics.
Supplementary Table 3 | 2 mg BID_day 7: The identification of differential metabolites based on untargeted metabolomics.
Supplementary Table 4 | Placebo_Day 1: The identification of differential metabolites based on untargeted metabolomics.
Supplementary Table 5 | Placebo_Day 7: The identification of differential metabolites based on untargeted metabolomics.
Supplementary Table 6 | 0.5 mg BID_Day 1: The identification of differential metabolites based on untargeted metabolomics.
Supplementary Table 7 | 0.5 mg BID_Day 7: The identification of differential metabolites based on untargeted metabolomics.
Supplementary Table 8 | 1 mg BID_Day 1: The identification of differential metabolites based on untargeted metabolomics.
Supplementary Table 9 | 1 mg BID_Day 7: The identification of differential metabolites based on untargeted metabolomics.
Supplementary Table 10 | 1 mg QD_Day 1: The identification of differential metabolites based on non-targeted metabolomics.
Supplementary Table 11 | 1 mg QD_Day 7: The identification of differential metabolites based on untargeted metabolomics.
Supplementary Table 12 | 2 mg QD_Day 1: The identification of differential metabolites based on untargeted metabolomics.
Supplementary Table 13 | 2 mg QD_Day 7: The identification of differential metabolites based on untargeted metabolomics.
1. Sun H, Saeedi P, Karuranga S, Pinkepank M, Ogurtsova K, Duncan BB, et al. IDF Diabetes Atlas: Global, regional and country-level diabetes prevalence estimates for 2021 and projections for 2045 (vol 183, 109119, 2022). Diabetes Res Clin Pract. (2023) 204:1. doi: 10.1016/j.diabres.2023.110945
2. Wright EM, Loo DDF, Hirayama BA. Biology of human sodium glucose transporters. Physiol Rev. (2011) 91:733–94. doi: 10.1152/physrev.00055.2009
3. Koepsell H. The Na+-D-glucose cotransporters SGLT1 and SGLT2 are targets for the treatment of diabetes and cancer. Pharmacol Ther. (2017) 170:148–65. doi: 10.1016/j.pharmthera.2016.10.017
4. Raja M, Puntheeranurak T, Hinterdorfer P, Kinne R. SLC5 and SLC2 transporters in epithelia-cellular role and molecular mechanisms. In: Bevensee MO, editor. Co-Transport Systems. Elsevier Academic Press Inc, San Diego (2012). p. 29–76.
5. Traynor K. Dapagliflozin approved for type 2 diabetes. Am J Health-System Pharm. (2014) 71:263–3. doi: 10.2146/news140013
6. Markham A, Keam SJ. Sotagliflozin: first global approval. Drugs. (2019) 79:1023–9. doi: 10.1007/s40265-019-01146-5
7. Rieg T, Vallon V. Development of SGLT1 and SGLT2 inhibitors. Diabetologia. (2018) 61:2079–86. doi: 10.1007/s00125-018-4654-7
8. Verma S, McMurray JJV. SGLT2 inhibitors and mechanisms of cardiovascular benefit: a state-of-the-art review. Diabetologia. (2018) 61:2108–17. doi: 10.1007/s00125-018-4670-7
9. Rabizadeh S, Nakhjavani M, Esteghamati A. Cardiovascular and renal benefits of SGLT2 inhibitors: A narrative review. Int J Endocrinol Metab. (2019) 17:e84353. doi: 10.5812/ijem.84353
10. Powell DR, DaCosta CM, Gay J, Ding ZM, Smith M, Greer J, et al. Improved glycemic control in mice lacking Sglt1 and Sglt2. Am J Physiology-Endocrinology Metab. (2013) 304:E117–30. doi: 10.1152/ajpendo.00439.2012
11. Goodwin NC, Ding ZM, Harrison BA, Strobel ED, Harris AL, Smith M, et al. Discovery of LX2761, a sodium-dependent glucose cotransporter 1 (SGLT1) inhibitor restricted to the intestinal lumen, for the treatment of diabetes. J Medicinal Chem. (2017) 60:710–21. doi: 10.1021/acs.jmedchem.6b01541
12. Rieg JAD, Rieg T. What does sodium-glucose co-transporter 1 inhibition add: Prospects for dual inhibition. Diabetes Obes Metab. (2019) 21:43–52. doi: 10.1111/dom.13630
13. Nicholson JK, Lindon JC, Holmes E. 'Metabonomics': understanding the metabolic responses of living systems to pathophysiological stimuli via multivariate statistical analysis of biological NMR spectroscopic data. Xenobiotica; fate foreign compounds Biol Syst. (1999) 29:1181–9. doi: 10.1080/004982599238047
14. Chen X, Chen SC, Ren QJ, Niu S, Yue L, Pan XY, et al. A metabonomics-based renoprotective mechanism analysis of empagliflozin in obese mice. Biochem Biophys Res Commun. (2022) 621:122–9. doi: 10.1016/j.bbrc.2022.06.091
15. Zhang AH, Qiu S, Xu HY, Sun H, Wang XJ. Metabolomics in diabetes. Clinica Chimica Acta. (2014) 429:106–10. doi: 10.1016/j.cca.2013.11.037
16. Yu X, Zhou Z, Xie Y, Sun R, Fei F, Gao H, et al. Preliminary study on mechanism of tricarboxylic acid cycle disruption in diabetic nephropathy cell model. Chin J Clin Pharmacol Ther. (2017) 22:481–9.
17. Ha CY, Kim JY, Paik JK, Kim OY, Paik YH, Lee EJ, et al. The association of specific metabolites of lipid metabolism with markers of oxidative stress, inflammation and arterial stiffness in men with newly diagnosed type 2 diabetes. Clin Endocrinol. (2012) 76:674–82. doi: 10.1111/j.1365-2265.2011.04244.x
18. Dutta T, Chai HS, Ward LE, Ghosh A, Persson XMT, Ford GC, et al. Concordance of changes in metabolic pathways based on plasma metabolomics and skeletal muscle transcriptomics in type 1 diabetes. Diabetes. (2012) 61:1004–16. doi: 10.2337/db11-0874
19. Li X, Xu ZL, Lu X, Yang XH, Yin PY, Kong HW, et al. Comprehensive two-dimensional gas chromatography/time-of-flight mass spectrometry for metabonomics: Biomarker discovery for diabetes mellitus. Analytica Chimica Acta. (2009) 633:257–62. doi: 10.1016/j.aca.2008.11.058
20. Newgard CB. Interplay between lipids and branched-chain amino acids in development of insulin resistance. Cell Metab. (2012) 15:606–14. doi: 10.1016/j.cmet.2012.01.024
21. Wang TJ, Larson MG, Vasan RS, Cheng S, Rhee EP, McCabe E, et al. Metabolite profiles and the risk of developing diabetes. Nat Med. (2011) 17:448–U83. doi: 10.1038/nm.2307
22. Huang L, Cao B, Geng Y, Zhou XL, Yang YX, Ma TT, et al. A randomized double-blind phase Ib clinical trial of SY-009 in patients with type 2 diabetes mellitus. Eur J Pharm Sci. (2024) 192:10. doi: 10.1016/j.ejps.2023.106644
23. Shen XT, Yan H, Wang CC, Gao P, Johnson CH, Snyder MP. TidyMass an object-oriented reproducible analysis framework for LC-MS data. Nat Commun. (2022) 13:12. doi: 10.1038/s41467-022-32155-w
24. Sun RB, Yang N, Kong B, Cao B, Feng D, Yu XY, et al. Orally administered berberine modulates hepatic lipid metabolism by altering microbial bile acid metabolism and the intestinal fxr signaling pathway. Mol Pharmacol. (2017) 91(2):110–22. doi: 10.1124/mol.116.106617
25. Mantovani A, Dalbeni A, Peserico D, Cattazzo F, Bevilacqua M, Salvagno GL, et al. Plasma bile acid profile in patients with and without type 2 diabetes. Metabolites. (2021) 11:14. doi: 10.3390/metabo11070453
26. Chen BT, Bai Y, Tong FL, Yan JL, Zhang R, Zhong YW, et al. Glycoursodeoxycholic acid regulates bile acids level and alters gut microbiota and glycolipid metabolism to attenuate diabetes. Gut Microbes. (2023) 15:15. doi: 10.1080/19490976.2023.2192155
27. Strott CA, Higashi Y. Cholesterol sulfate in human physiology: what's it all about? J Lipid Res. (2003) 44:1268–78. doi: 10.1194/jlr.R300005-JLR200
28. Prah J, Winters A, Chaudhari K, Hersh J, Liu R, Yang SH. Cholesterol sulfate alters astrocyte metabolism and provides protection against oxidative stress. Brain Res. (2019) 1723:10. doi: 10.1016/j.brainres.2019.146378
29. Xu DK, Ma RJ, Ju Y, Song XW, Niu BL, Hong WT, et al. Cholesterol sulfate alleviates ulcerative colitis by promoting cholesterol biosynthesis in colonic epithelial cells. Nat Commun. (2022) 13:17. doi: 10.1038/s41467-022-32158-7
30. Zhang XP, Deng D, Cui DX, Liu Y, He SY, Zhang HM, et al. Cholesterol sulfate exerts protective effect on pancreatic β-cells by regulating β-cell mass and insulin secretion. Front Pharmacol. (2022) 13:840406. doi: 10.3389/fphar.2022.840406
31. Bloomgarden Z. Diabetes and branched-chain amino acids: What is the link? J Diabetes. (2018) 10:350–2. doi: 10.1111/1753-0407.12645
32. Newgard CB, An J, Bain JR, Muehlbauer MJ, Stevens RD, Lien LF, et al. A branched-chain amino acid-related metabolic signature that differentiates obese and lean humans and contributes to insulin resistance. Cell Metab. (2009) 9:565–6. doi: 10.1016/j.cmet.2009.05.001
33. Zhou Q, Sun WW, Chen JC, Zhang HL, Liu J, Lin Y, et al. Phenylalanine impairs insulin signaling and inhibits glucose uptake through modification of IRβ. Nat Commun. (2022) 13:19. doi: 10.1038/s41467-022-32000-0
34. Ma JN, Meng XL, Liu Y, Yin C, Zhang T, Wang P, et al. Effects of a rhizome aqueous extract of Dioscorea batatas and its bioactive compound, allantoin in high fat diet and streptozotocin-induced diabetic mice and the regulation of liver, pancreas and skeletal muscle dysfunction (vol 259, 112926, 2020). J Ethnopharmacology. (2024) 327:2. doi: 10.1016/j.jep.2024.118071
35. Go HK, Rahman MM, Kim GB, Na CS, Song CH, Kim JS, et al. Antidiabetic effects of yam (Dioscorea batatas) and its active constituent, allantoin, in a rat model of streptozotocin-induced diabetes. Nutrients. (2015) 7:8532–44. doi: 10.3390/nu7105411
36. Chávez-Talavera O, Tailleux A, Lefebvre P, Staels B. Bile acid control of metabolism and inflammation in obesity, type 2 diabetes, dyslipidemia, and nonalcoholic fatty liver disease. Gastroenterology. (2017) 152:1679–1694.e3. doi: 10.1053/j.gastro.2017.01.055
37. Guo GL, Xie W. Metformin action through the microbiome and bile acids. Nat Med. (2018) 24:1789–90. doi: 10.1038/s41591-018-0273-6
38. Tawulie D, Jin LL, Shang X, Li YM, Sun L, Xie HX, et al. Jiang-Tang-San-Huang pill alleviates type 2 diabetes mellitus through modulating the gut microbiota and bile acids metabolism. Phytomedicine. (2023) 113:26. doi: 10.1016/j.phymed.2023.154733
39. Gong T, Chen G, Liu C. Studies on the association between intestinal florabile acid pathway and metabolic disorders. Chin J Diabetes. (2019) 27:953–5.
40. Chiang JYL, Ferrell JM. Up to date on cholesterol 7 alpha-hydroxylase (CYP7A1) in bile acid synthesis. Liver Res. (2020) 4:47–63. doi: 10.1016/j.livres.2020.05.001
41. Ridlon JM, Kang DJ, Hylemon PB, Bajaj JS. Bile acids and the gut microbiome. Curr Opin Gastroenterol. (2014) 30:332–8. doi: 10.1097/mog.0000000000000057
42. Ikegami T, Honda A. Reciprocal interactions between bile acids and gut microbiota in human liver diseases. Hepatol Res. (2018) 48:15–27. doi: 10.1111/hepr.13001
43. Guzior DV, Quinn RA. Review: microbial transformations of human bile acids. Microbiome. (2021) 9:13. doi: 10.1186/s40168-021-01101-1
44. Wijaya A, Hermann A, Abriouel H, Specht I, Yousif NMK, Holzapfel WH, et al. Cloning of the bile salt hydrolase (bsh) gene from Enterococcus faecium FAIR-E 345 and chromosomal location of bsh genes in food enterococci. J Food Prot. (2004) 67:2772–8. doi: 10.4315/0362-028x-67.12.2772
45. Percy-Robb IW, Collee JG. Bile acids: a pH dependent antibacterial system in the gut? Br Med J. (1972) 3:813–5. doi: 10.1136/bmj.3.5830.813
46. Stellwag EJ, Hylemon PB. Purification and characterization of bile salt hydrolase from Bacteroides fragilis subsp. fragilis. Biochim Biophys Acta. (1976) 452:165–76. doi: 10.1016/0005-2744(76)90068-1
47. Kim GB, Yi SH, Lee BH. Purification and characterization of three different types of bile salt hydrolases from Bifidobacterium strains. J Dairy Sci. (2004) 87:258–66. doi: 10.3168/jds.S0022-0302(04)73164-1
48. Chen TL, Zhou KJ, Sun T, Sang C, Jia W, Xie GX. Altered bile acid glycine: taurine ratio in the progression of chronic liver disease. J Gastroenterol Hepatol. (2022) 37:208–15. doi: 10.1111/jgh.15709
49. Gao TT, Hu SH, Xu WJ, Wang ZR, Guo T, Chen F, et al. Targeted LC-MS/MS profiling of bile acids reveals primary/secondary bile acid ratio as a novel biomarker for necrotizing enterocolitis. Analytical Bioanalytical Chem. (2024) 416:287–97. doi: 10.1007/s00216-023-05017-7
50. Chiang JYL, Ferrell JM. Bile acid receptors FXR and TGR5 signaling in fatty liver diseases an therapy. Am J Physiology-Gastrointestinal Liver Physiol. (2020) 318:G554–73. doi: 10.1152/ajpgi.00223.2019
51. Sayin SI, Wahlström A, Felin J, Jäntti S, Marschall HU, Bamberg K, et al. Gut microbiota regulates bile acid metabolism by reducing the levels of tauro-beta-muricholic acid, a naturally occurring FXR antagonist. Cell Metab. (2013) 17:225–35. doi: 10.1016/j.cmet.2013.01.003
52. Hou YF, Fan WJ, Yang WL, Samdani AQ, Jackson AO, Qu SL. Farnesoid X receptor: An important factor in blood glucose regulation. Clinica Chimica Acta. (2019) 495:29–34. doi: 10.1016/j.cca.2019.03.1626
53. Gou XM, Qin L, Wu D, Xie J, Lu YL, Zhang QR, et al. Research progress of takeda G protein-coupled receptor 5 in metabolic syndrome. Molecules. (2023) 28:15. doi: 10.3390/molecules28155870
Keywords: SY-009, SGLT1 inhibitor, type 2 diabetes mellitus, metabolomics, bile acids
Citation: Yang H, Zhang Y, Hong Y, Wei Y, Zhu Y, Huang L, Yang Y, Sun R and Li J (2025) Effect of SY009, a novel SGLT1 inhibitor, on the plasma metabolome and bile acids in patients with type 2 diabetes mellitus. Front. Endocrinol. 16:1487058. doi: 10.3389/fendo.2025.1487058
Received: 27 August 2024; Accepted: 07 January 2025;
Published: 28 January 2025.
Edited by:
Christiano Argano, ARNAS Ospedali Civico Di Cristina Benfratelli, ItalyReviewed by:
Hsien-Hui Chung, Kaohsiung Veterans General Hospital, TaiwanCopyright © 2025 Yang, Zhang, Hong, Wei, Zhu, Huang, Yang, Sun and Li. This is an open-access article distributed under the terms of the Creative Commons Attribution License (CC BY). The use, distribution or reproduction in other forums is permitted, provided the original author(s) and the copyright owner(s) are credited and that the original publication in this journal is cited, in accordance with accepted academic practice. No use, distribution or reproduction is permitted which does not comply with these terms.
*Correspondence: Juan Li, anVhbmxpMjAwM0BuamdseXkuY29t; Runbin Sun, cnVuYmluc3VuQGdtYWlsLmNvbQ==
Disclaimer: All claims expressed in this article are solely those of the authors and do not necessarily represent those of their affiliated organizations, or those of the publisher, the editors and the reviewers. Any product that may be evaluated in this article or claim that may be made by its manufacturer is not guaranteed or endorsed by the publisher.
Research integrity at Frontiers
Learn more about the work of our research integrity team to safeguard the quality of each article we publish.