 Meng Gong
 Haichao Liu2†
 Zhixiang Liu
 Yongshen Wang
 Hong Guo
94% of researchers rate our articles as excellent or good
Learn more about the work of our research integrity team to safeguard the quality of each article we publish.
Find out more
ORIGINAL RESEARCH article
Front. Endocrinol., 10 February 2025
Sec. Systems Endocrinology
Volume 16 - 2025 | https://doi.org/10.3389/fendo.2025.1439341
Background: The aim of this study was to explore the genetic level association between obesity, lipids, adipokines, and cognitive ability using bidirectional Mendelian randomization (MR) strategies.
Methods: Summary data for three obesity indicators [body mass index (BMI), body fat percentage (BFP) and waist-hip ratio (WHR)], three lipid indicators [HDL cholesterol (HDL), LDL cholesterol (LDL) and triglycerides (TG)], three adipokines [circulating leptin (LEP), Agouti-related protein (AgRP) and Adiponectin (APDN)], and four cognitive ability indicators [cognitive function (CF), cognitive performance (CP), simple reaction time (SRT) and fluid intelligence score (FIS)] were collected. Bidirectional inverse-variance weighted Mendelian randomization (MR) was employed to evaluate the relationship between adiposity and cognitive function. We employed genetic instruments for adiposity indicators as exposures in one direction, and repeated the analysis in the opposite direction using instruments for cognitive function. Sensitivity analyses were conducted to explore heterogeneity and potential horizontal pleiotropy.
Results: Genetically predicted adiposity showed robust associations with markers of cognitive ability. Higher genetically predicted obesity indicators (such as BMI, BFP and WHR), and lipid and adipokineslevels (such as HDL and AgRP) with reduced cognitive ability indicators (such as CF and CP). In the opposite direction, FIS and SRT may influence BMI and HDL respectively. MR estimates for the effects of cognition ability on all obesity, lipids and adipokines measures indicated worse FIS and SRT were associated with higher BMI and lower HDL.
Conclusions: Our MR reveals that high BMI, BFP, WHR and AgRP have negative causal direct effects with cognitive ability, while high HDL and ADPN have positive causal direct effects with cognitive ability. For the reverse causal direction, our consistent findings that worse cognitive function such as SRT and FIS may influence serum HDL level and BMI.
The increasing prevalence of obesity has accentuated concerns regarding its impact on public health. Obesity is widely acknowledged as a prominent risk factor for numerous ailments, including cardiovascular disease, metabolic syndrome, hypertension, diabetes, etc. (1) Moreover, recent studies have demonstrated the detrimental effects of adiposity on cognitive function (2). Conversely, less known, is the influence of cognition on obesity (3). Consequently, it is imperative to prioritize research that investigates the bidirectional relationship between obesity and cognitive function, thus advancing our understanding of this complex interplay.
Obesity is consistently linked to lower cognitive functioning across various age groups, including adults, middle-aged individuals, older adults, and even young children (4–6). It is notably with poor cognitive flexibility, psychomotor speed, intelligence, attention. While both generalized and visceral obesity have been linked to reduced cognitive performance (7), the impact of adiposity location (i.e. central vs. peripheral) on the adiposity-cognition relationship remains uncertain. This uncertainty arises from the predominant use of body mass index (BMI) as a measure of overall obesity in research studies (8, 9). Recent reports suggest that waist-to-hip ratio (WHR) may independently contribute to adverse cognitive outcomes, regardless of BMI. Additionally, in terms of total body fatness, the association between body fat percentage (BFP) and cognitive ability has also yielded contradictory evidence (10, 11).
High-density lipoprotein (HDL), low-density lipoprotein (LDL) cholesterol, and triglycerides (TG) are among the highest commonly measured biomarkers in clinical medicine (12). Epidemiological studies have reported associations between HDL, LDL, TG, and cognitive function (13, 14). However, the existing evidence from these studies is limited in establishing a causal relationship, and inconsistencies exist among various studies (15). Adipokines such as leptin (LEP) and adiponectin (ADPN) have been linked to cognitive function (16). Cognitive flexibility may be modulated by abnormal levels of the appetite-regulating agouti-related protein (AgRP) (17). Nevertheless, conflicting results have been reported in several studies (18, 19). For instance, an early study from the United States found no significant correlation between leptin and cognitive abilities (18), and another study did not find an association between serum leptin levels and cognitive decline (19).
Recent studies have demonstrated that cognitive function is not only a consequence but also a contributor to obesity (20). There is evidence supporting a bidirectional relationship between adiposity and cognitive function exists (21). Furthermore, a vicious cycle has been proposed, where adiposity may lead to cognitive function impairment, which in turn exacerbates further cognitive complications (22). As such, it is crucial to consider this complex bidirectional association in future research (23).
Mendelian randomization (MR), a genetics-based approach in epidemiological research, specifically bidirectional MR, can help elucidate the reciprocal causal pathway between adiposity and cognitive function (24). Recently, Tom and colleagues (8) conducted a bidirectional MR of visual memory (VM) and reaction time (RT) on BMI, BFP and WHR, and vice versa. They observed associations between adiposity on cognitive function likely not causal. Conversely, worse visual memory was causally link to lower adiposity. However, this study primarily focused on VM and RT as indicators of cognitive performance, and the relationship between other cognitive performance indicators and adiposity remains unclear. Conflicting findings have been reported elsewhere, with genetically higher visceral adiposity and raised BMI concentration associated with lower cognition (25). This study, however, may be subject to sample selection bias as it primarily included individuals of Asian ancestry in the Genome-Wide Association Studies (GWASs). Furthermore, there is a dearth of MR studies investigating the potential influence of obesity, lipids, and adipokines on cognitive ability.
In this study, therefore, we aimed to utilize univariable, multivariable and bidirectional MR to examine the causal relationship between obesity (BMI, BFP, WHR), lipids (HDL, LDL, TG) and adipokines (LEP, ADPN, AgRP) with cognitive ability. Our objective was to enhance our understanding of the genetic-level associations between a range of obesity, lipids, adipokines and cognitive ability, thereby providing a more comprehensive and elucidated understanding of causality.
Several indicators of obesity, lipid and adipokines were identified as the exposures in the study. The obesity indicators were BMI, BFP and WHR. The lipid indicators were HDL, LDL and TG. The adipokines were LEP, AgRP and ADPN. In addition, Cognitive Function (CF), Cognitive Performance (CP), Simple Reaction Time (SRT) and Fluid Intelligence Score (FIS) were defined as the outcome of this study.
We obtained participant data from various sources, including the UK Biobank (UKB) studies and other large consortia such as the Medical Research Council - Imperial College London (MRC-IEU) (26). The UK Biobank (UKB) is a comprehensive resource that contains genotype data from approximately 500,000 individuals across the UK (27). The summary data for BMI, BFP and FIS were collected from the MRC Integrative Epidemiology Unit at the university of bristol (MRC-IEU). The aggregate data for WHR was obtained from a series of anthropometric traits GWASs involving more than 49,960 individuals of European ancestry (28). The Phenotypes available in UKB included HDL, LDL and TG. For LEP, we utilized summary data from a GWAS that evaluated genomic targets for leptin concentrations in 57,232 individuals of mixed ancestry (29). The summary data for AgRP was obtained from a GWAS that evaluated genomic targets for 90 cardiovascular proteins in 30,931 individuals of European ancestry (30). Genetic instruments for ADPN were obtained from summary statistics of ADIPO-Gen. Moreover, the summary data for CF was collected from a GWAS conducted by the within family consortium. The aggregate datas for CP and SRT were respectively obtained from a series GWASs of educational attainment in 257,841 European individuals (31) and influencing information processing speed (32) using 2,378 individuals of European ancestry.
Ethical approval and participant consent were obtained from the respective original studies.
From all GWAS summary data of BMI, BFP, etc., we conducted a series of quality control steps to select eligible instrumental SNPs. To meet the correlation assumption, we identified SNPs for inclusion based on two criteria: a genome-wide correlation P-value of less than 5 × 10⁻⁸ or 5 × 10⁻⁶ (for SRT), and the absence of linkage disequilibrium (defined as r2 > 0.01). To satisfy the independence assumption, we performed the clumping process (r2 < 0.001, window size = 10 MB) to estimate linkage disequilibrium between SNPs. Ambiguous SNPs with non-concordant alleles (e.g., A/G vs. A/C) and palindromic SNPs with ambiguous strand (i.e., A/T or G/C) were either corrected or directly excluded from the above-selected instrument SNPs to harmonize the effect of SNPs on the exposure outcome, ensuring that the effects corresponded to the same allele. These rigorously selected SNPs were employed as the instrumental variables in subsequent MR analysis. To ensure that MR analysis meets the three core assumptions. The overall research design is depicted in Figure 1.
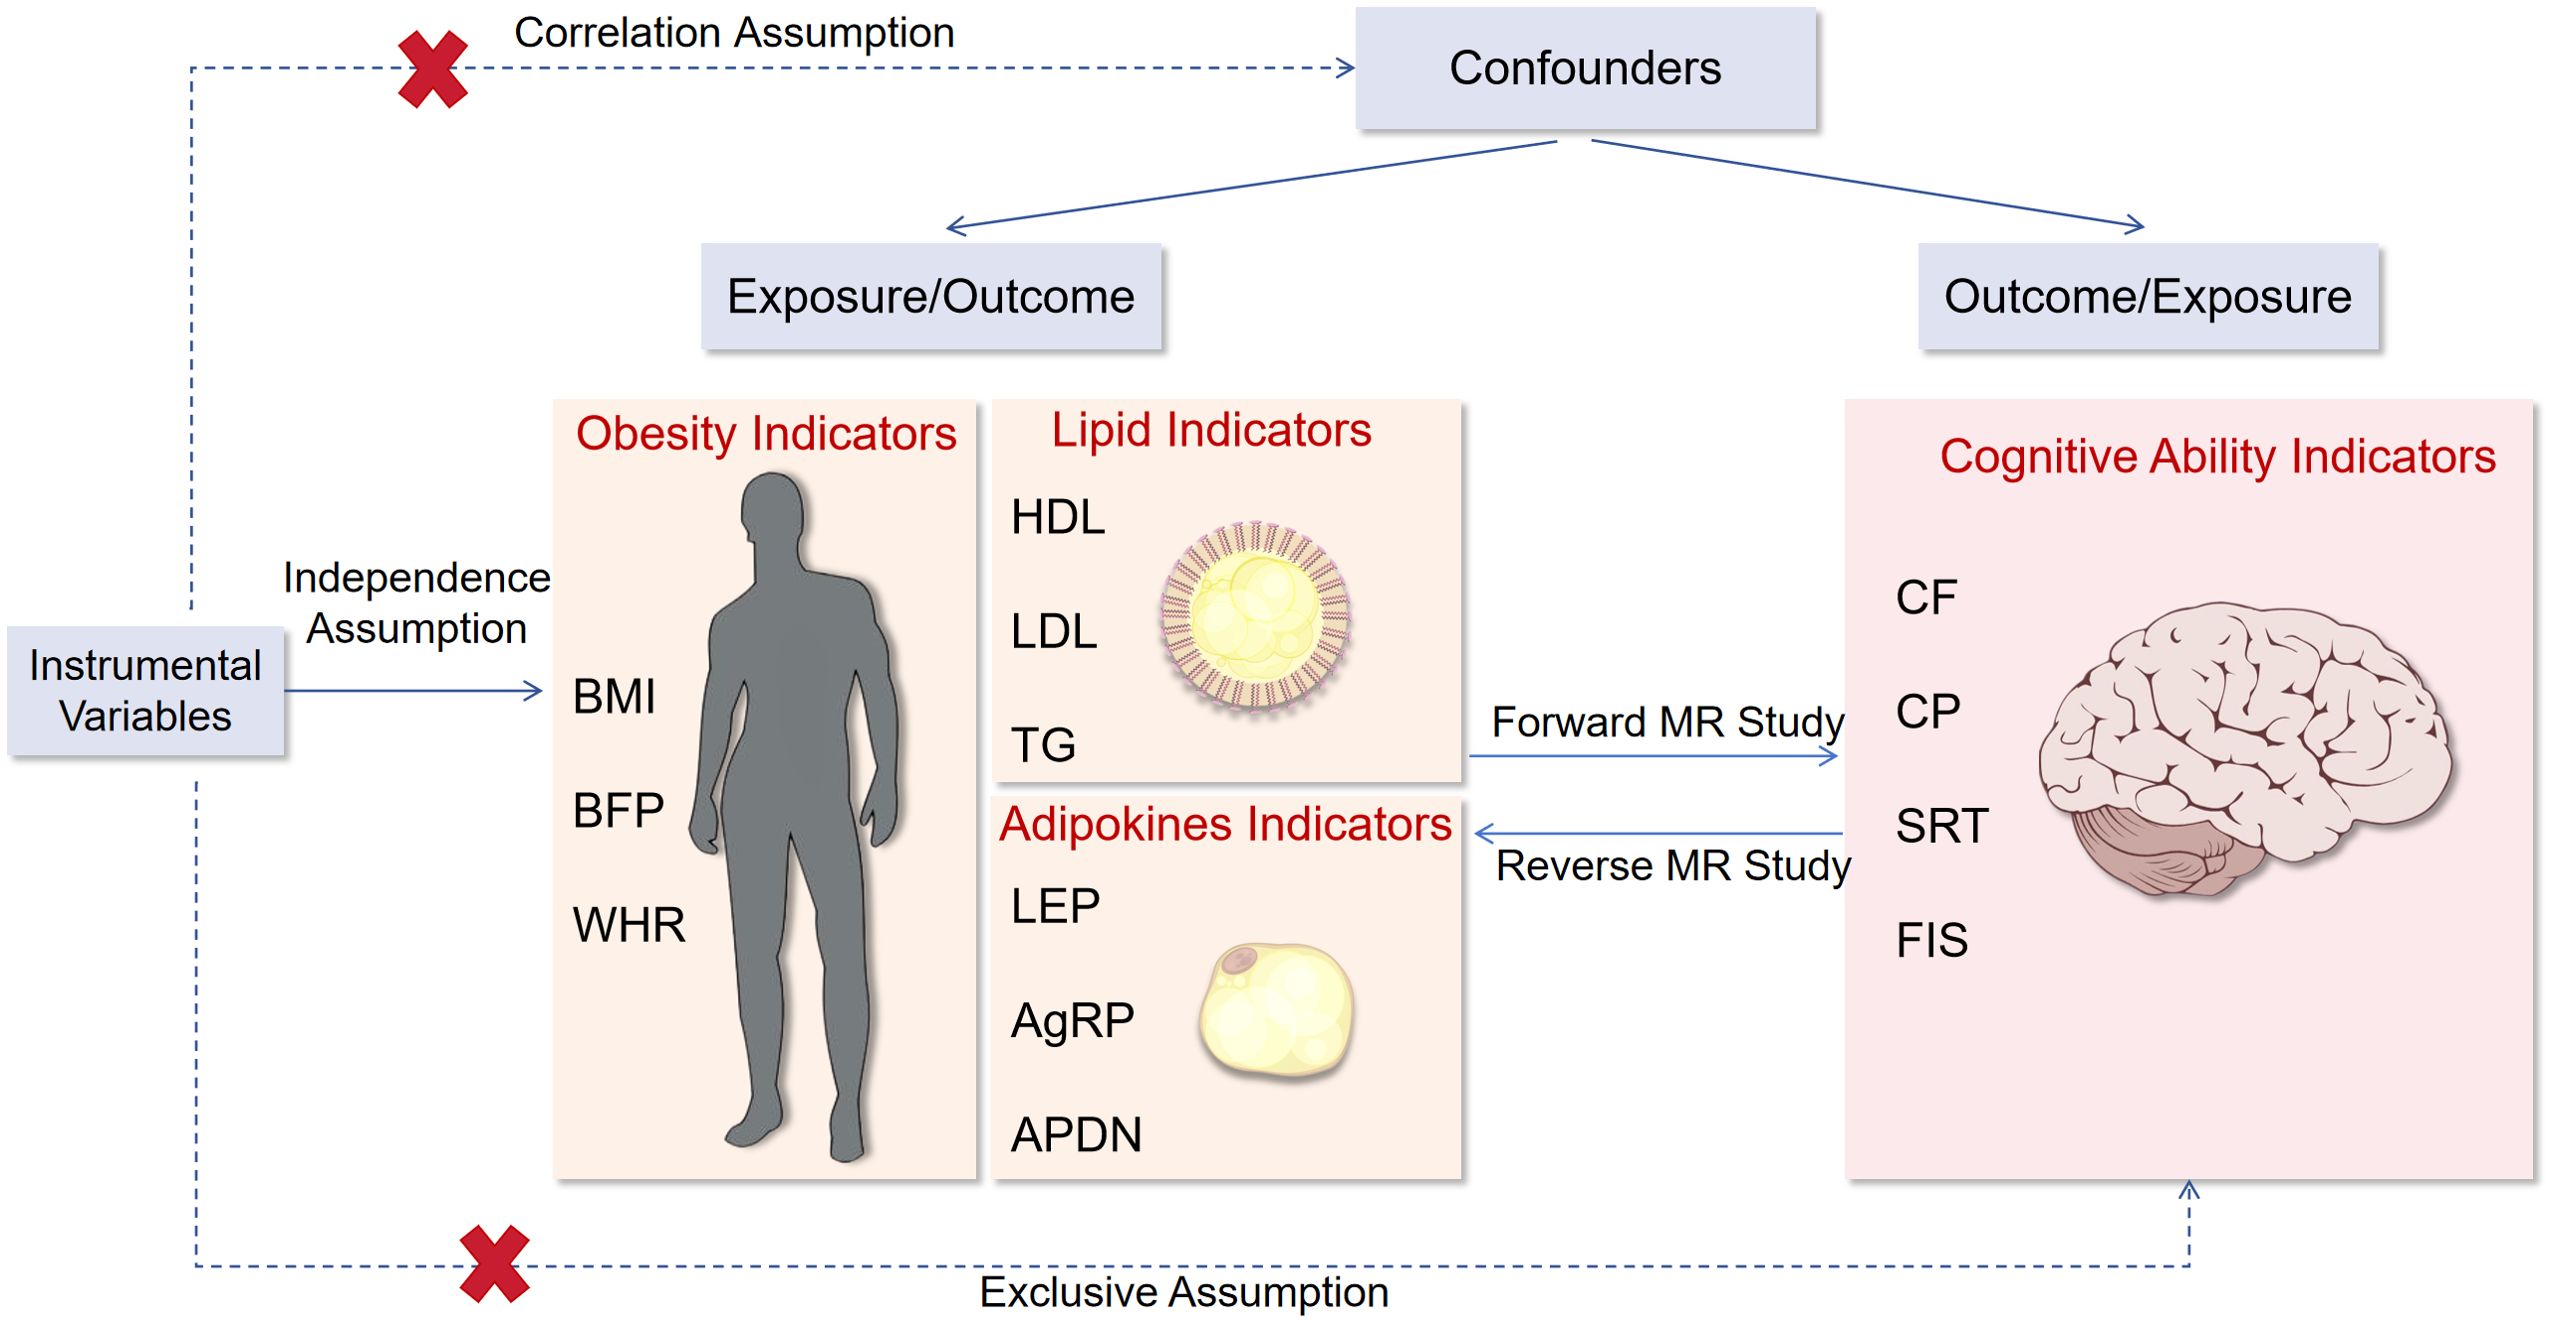
Figure 1. Flow chart of this study. BMI, body mass index; BFP, body fat percentage; WHR, waist-to-hip ratio adjusted for BMI; HDL, high-density lipoprotein cholesterol; LDL, low-density lipoprotein cholesterol; TG, triglycerides; LEP, circulating leptin levels; AgRP, agouti-related protein level; ADPN, adiponectin; CF, cognitive function; CP, Cognitive performance; SRT, simple reaction time; FIS, fluid intelligence score.
In this two-sample MR, we employed three main methods for causal inference, namely random-effect inverse-weighted variance (IVW), weighted median and MR-Egger (33). The IVW method is considered reasonably accurate for causal inference when all SNPs are unaffected by horizontal pleiotropy and heterogeneity (34). While the other two methods are less accurate, they have broader applicability under certain conditions. Following the harmonization and selection of instrumental variables, we utilized the IVW method to estimate the causal effects of obesity, lipids and adipokines fractions on CF, CP, SRT, FIS.
Multivariable MR is an extension of MR that allows for multiple genetic instruments. In the MVMR method, it is not necessary for the genetic instruments to be exclusively associated with a single risk factor. Instead, they can be associated with a set of measured risk factors, while still satisfying the equivalent instrumental variable assumptions (35). Therefore, we applied this method by considering all instrumental variables for BMI, BFP, WHR, HDL and LDL, TG, as well as LEP, AgRP, and ADPN, respectively, to evaluate their independent effects on CF, CP, SRT, and FIS. Additionally, Reverse-MR analysis was performed to investigate whether CF, CP, SRT, and FIS, as indicators of cognitive ability, may influence obesity, lipid traits, or adipokine traits.
Reverse-MR analysis was performed to examine the potential influence of cognitive ability, as represented by CF, CP, SRT and FIS, on obesity, lipids and adipokines traits. Additionally, multivariable MR analysis was also used to assess the causal effect of cognitive ability on obesity, lipids or adipokines traits.
Heterogeneity among SNPs was assessed using IVW method and quantified heterogeneities using the Cochran Q statistic. To assess the potential pleiotropic effects of the SNPs used as IVs, we employed the MR-Egger regression. Furthermore, we addressed restriction assumption, by applying method like the MR-PRESSO, which identifies outliers and provides causal estimates after their removal. The MR-PRESSO analysis includes a distortion test that compares estimates before and after outlier removal. We set the number of distributions in MR-PRESSO analysis to 2000. To evaluate the strength of the association between these SNPs and the exposure factors, we used R2 and F-statistics to estimate the proportion of phenotypic variance explained and the statistical power, respectively. The F-statistics is calculated using the formula: F = R2 × (N − K − 1)/K × (1 − R2). We included SNPs with strong statistical power (F statistics > 10) as IVs. Horizontal pleiotropy among SNPs using the MR-Egger intercept test. In all sensitivity analyses, p-values were reported, and the values less than 0.05 were considered indicative of heterogeneity or horizontal pleiotropy. Moreover, we conducted a “leave-one-out” sensitivity analysis to identify potentially influential SNPs. This analysis involved iteratively excluding each SNP one at a time and re-performing the MR analysis to assess the impact of each SNP on the pooled results.
We performed the MR analyses using the two-sample random-effects IVW method, which was implemented in the Mendelian Randomization R package. When there were more tahn 3 SNPs instrumenting the exposures, the estimates for variants were then pooled using the random-effect IVW method. For exposures instrumented by only 2 SNPs, the fixed-effects IVW method was employed. The IVW method was used to access the causal associations along with adiposity and cognitive ability. To account for the documented horizontal pleiotropy between adiposity and cognitive ability, we conducted a multivariable MR (MVMR). Given the high number of comparisons between obesity, lipids and adipokines with cognitive ability (and vice versa) (n = 3 tests for Forward-MR, n = 4 tests for Reverse-MR), we applied a Bonferroni adjustment to all P-value thresholds (i.e. P-value threshold/number of tests (3 or 4); P <0.05 corresponds to P <0.0167, and P <0.0125).
The present study adheres to the STROBE-MR guidelines to ensure transparent and thorough reporting of our MR analysis (36). All MR analyses were conducted using TwoSampleMR package in R software (version 4.3.1).
The multivariable and bidirectional MR analysis were conducted according to the workflow presented in Figure 2. Details information regarding the instrumental variables selected were listed in Table 1.
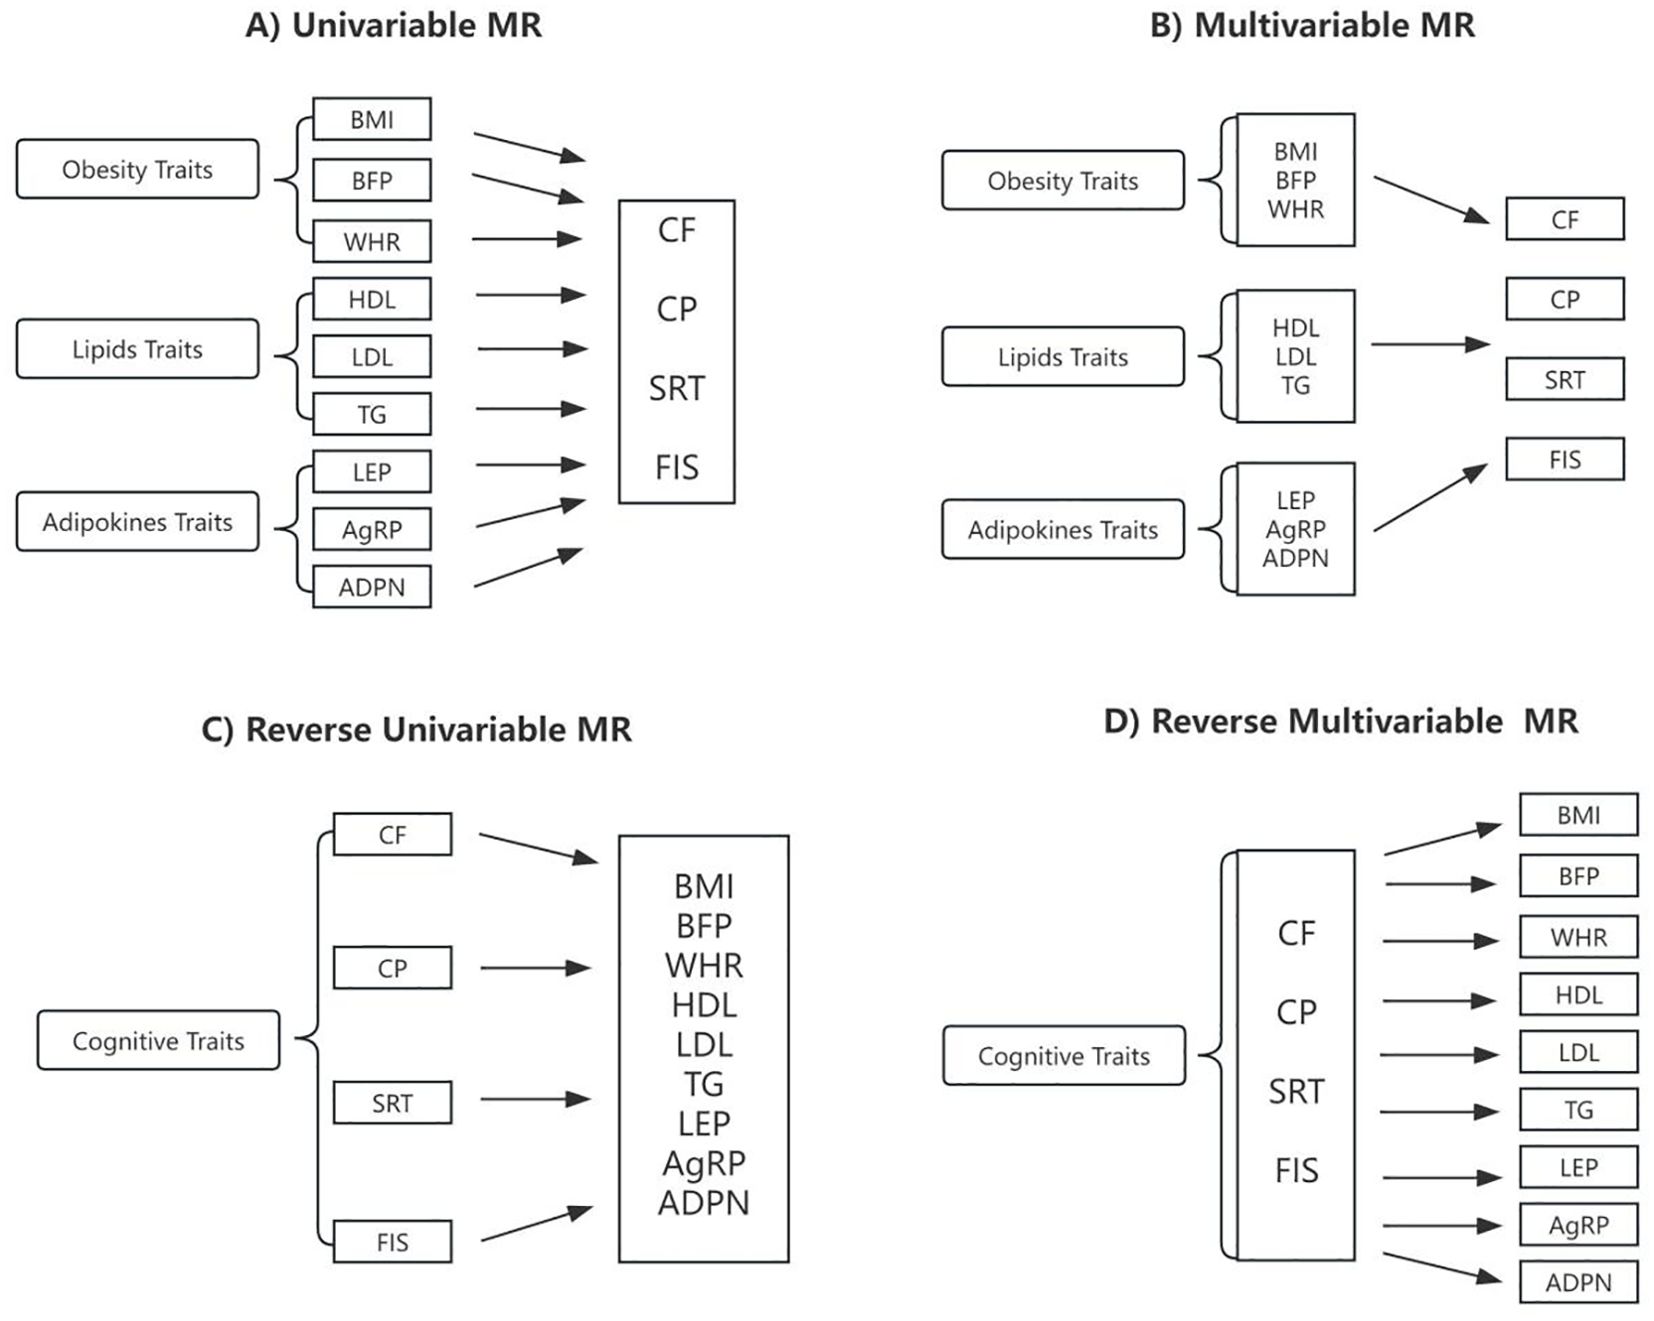
Figure 2. Schematic presentation of (A) univariable; (B) multivariable; (C) reverse univariable; and (D) reverse multivariable Mendelian randomization. BMI, body mass index; BFP, body fat percentage; WHR, waist-to-hip ratio adjusted for BMI; HDL, high-density lipoprotein cholesterol; LDL, low-density lipoprotein cholesterol; TG, triglycerides; LEP, circulating leptin levels; AgRP, agouti-related protein level; ADPN, adiponectin; CF, cognitive function; CP, Cognitive performance; SRT, simple reaction time; FIS, fluid intelligence score.
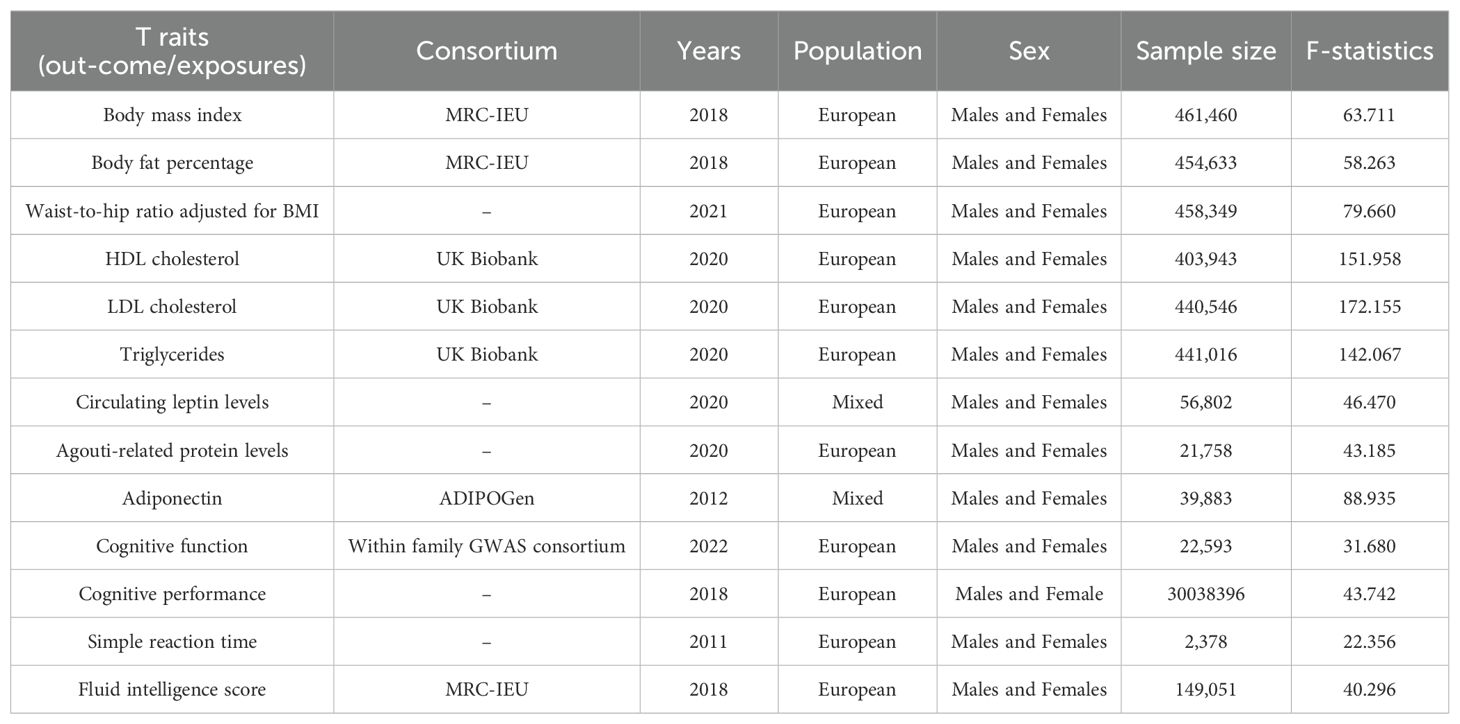
Table 1. Characteristics of the summary data in the study.
The relationships between genetically predicted obesity traits and cognitive ability are presented in Table 2A and visualized in Figures 2A, 3A, 4A. We found that the estimated effects (β) of obesity traits of BMI and BFP on CF had the following values within the 95% confidence intervals (CI) were 0.815([0.761 to 0.873]; P = 4.948 × 10⁻⁹), and 0.752([0.680 to 0.833]; P = 4.591 × 10⁻⁸). For SRT, the effect estimates (β) [95% confidence intervals (CIs)] of BMI and BFP were 1.221([1.015 to 1.469]; P = 3.400 × 10⁻²) and 1.221([1.015 to 1.469]; P = 3.400 × 10⁻²). These estimations show a significant association between obesity characteristics and CF and SRT. Moreover, the evidence of a significant causal effect of genetically predicted BMI, BFP, WHR, and HDL on CP were 0.889([0.855 to 0.924]; P = 2.379 × 10⁻⁹), 0.846([0.798 to 0.896]; P = 1.440 × 10⁻⁸), 0.937([0.902 to 0.973]; P = 6.719 × 10⁻⁴), and 1.033([1.005 to 1.062]; P = 2.000 × 10⁻²). Univariable MR yielded little evidence of associations between genetically predicted adipokines and cognitive-ability markers.

Table 2. Univariable Mendelian randomization results.
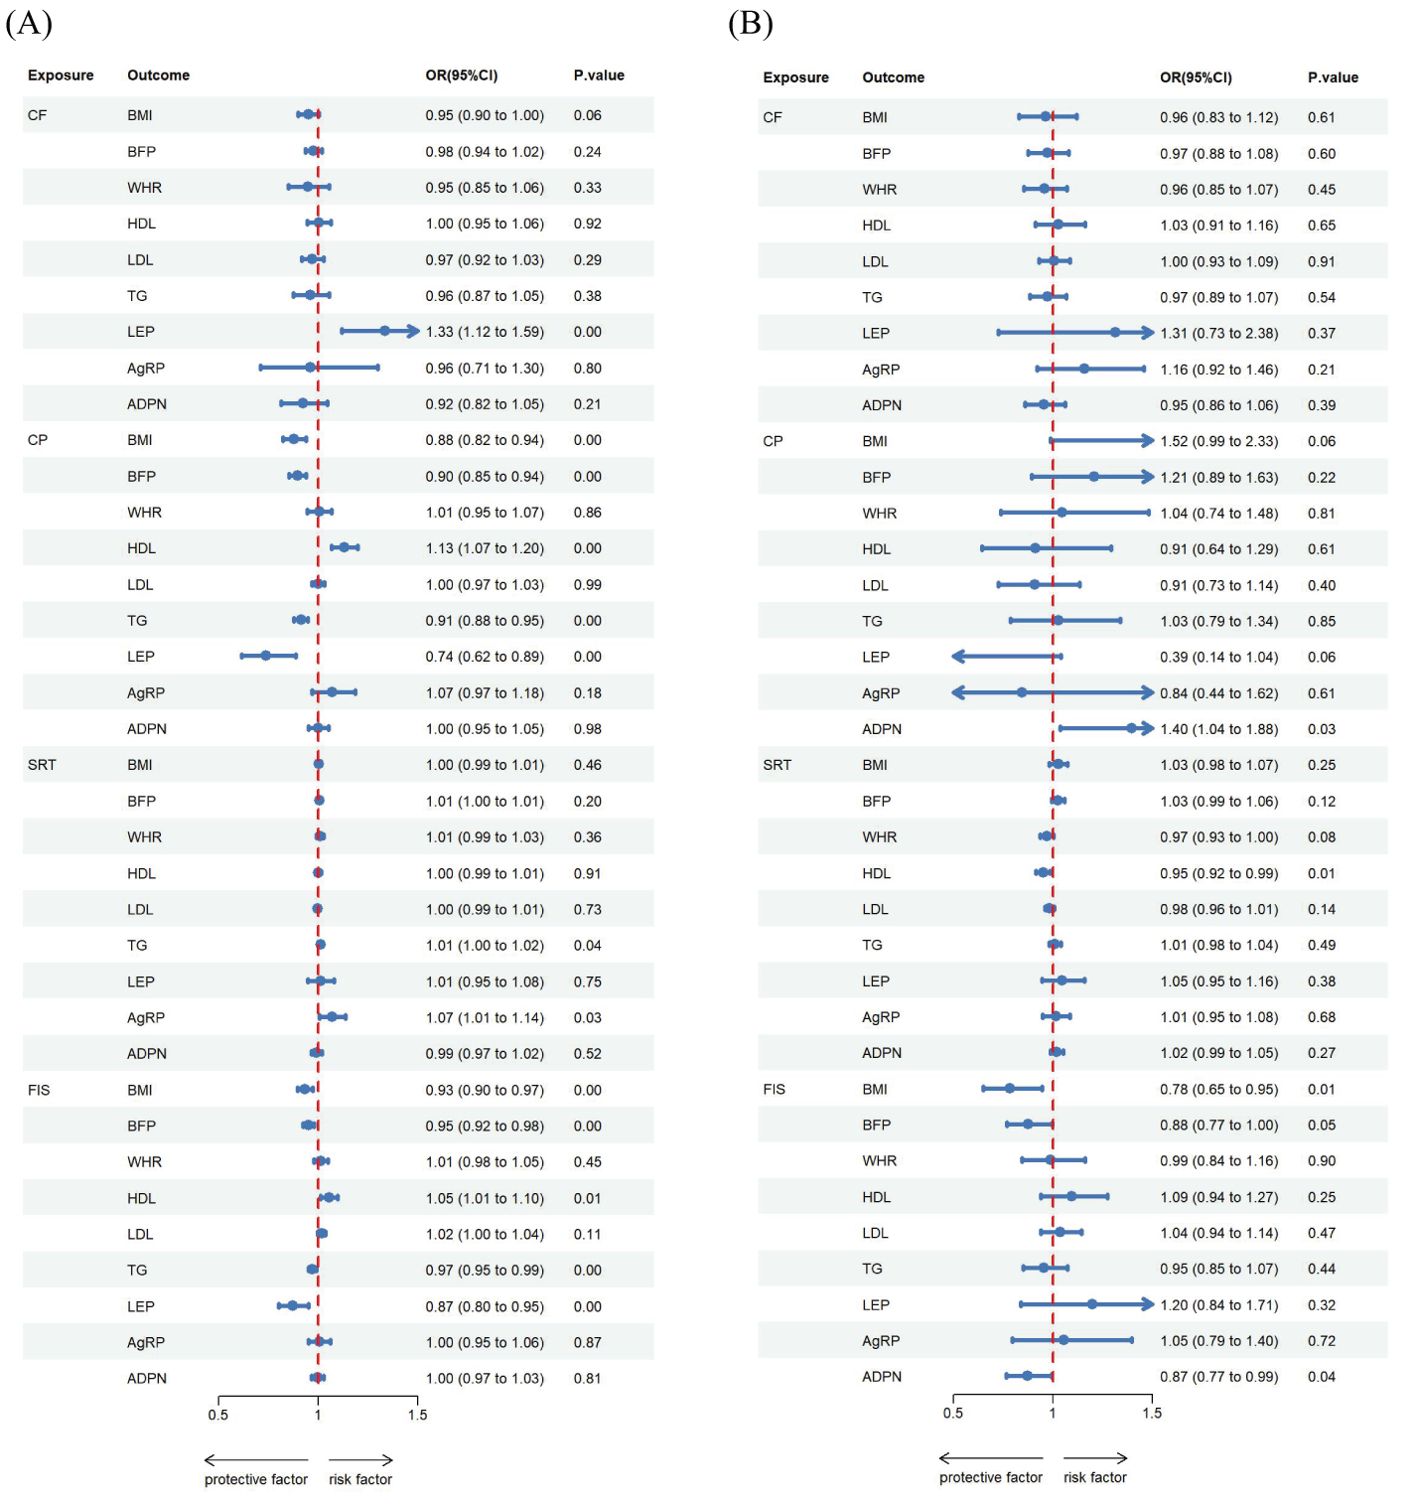
Figure 3. Estimated causal effects of cognitive ability on obesity, lipids and adipokines markers using univariable and multivariable MR, presented as the SD-unit change in obesity, lipids and adipokines marker per genetically predicted 1-SD change in cognitive ability. Schematic presentation of (A) univariable; (B) multivariable Mendelian randomization.
For the reverse MR (Table 2B, Figures 2C, 3A, 4C, 5A), the effect estimate ([95% CI]) of CP on BMI, BFP, HDL, TG and LEP was 0.879([0.822 to 0.939]; P = 1.392 × 10⁻⁴), 0.896([0.855 to 0.940]; P = 7.100 × 10⁻⁶), 1.130([1.066 to 1.198]; P = 4.058 × 10⁻⁵), 0.913([0.879 to 0.949]; P = 4.125 × 10⁻⁶), and 0.740([0.616 to 0.887]; p = 1.190 × 10⁻³) respectively. Furthermore, the reverse MR analysis revealed compelling evidence of a significant causal effect stemming from genetically predicted FIS on the same set of adiposity parameters. The effect estimates for FIS were as follows: 0.934([0.897 to 0.974]; P = 1.324 × 10⁻³) for BMI, 0.950([0.923 to 0.977]; P = 3.828 × 10⁻⁴) for BFP, 1.054([1.014 to 1.096]; P = 8.268 × 10⁻³) for HDL, 0.970([0.950 to 0.990]; P = 3.945 × 10⁻³) for TG, and 0.873([0.802 to 0.952]; P =2.008 × 10⁻³) for LEP. In addition, the reverse MR analysis also showed statistically significant causal effect of genetically predicted CF on LEP 1.334 ([1.119 to 1.592]; p = 1.344 × 10⁻³). There was evidence of a significant causal effect of genetically predicted SRT on TG and AG were 1.011([1.000 to 1.022]; P = 4.200 × 10⁻²) and 1.070([1.007 to 1.138]; P = 3.000 × 10⁻²).
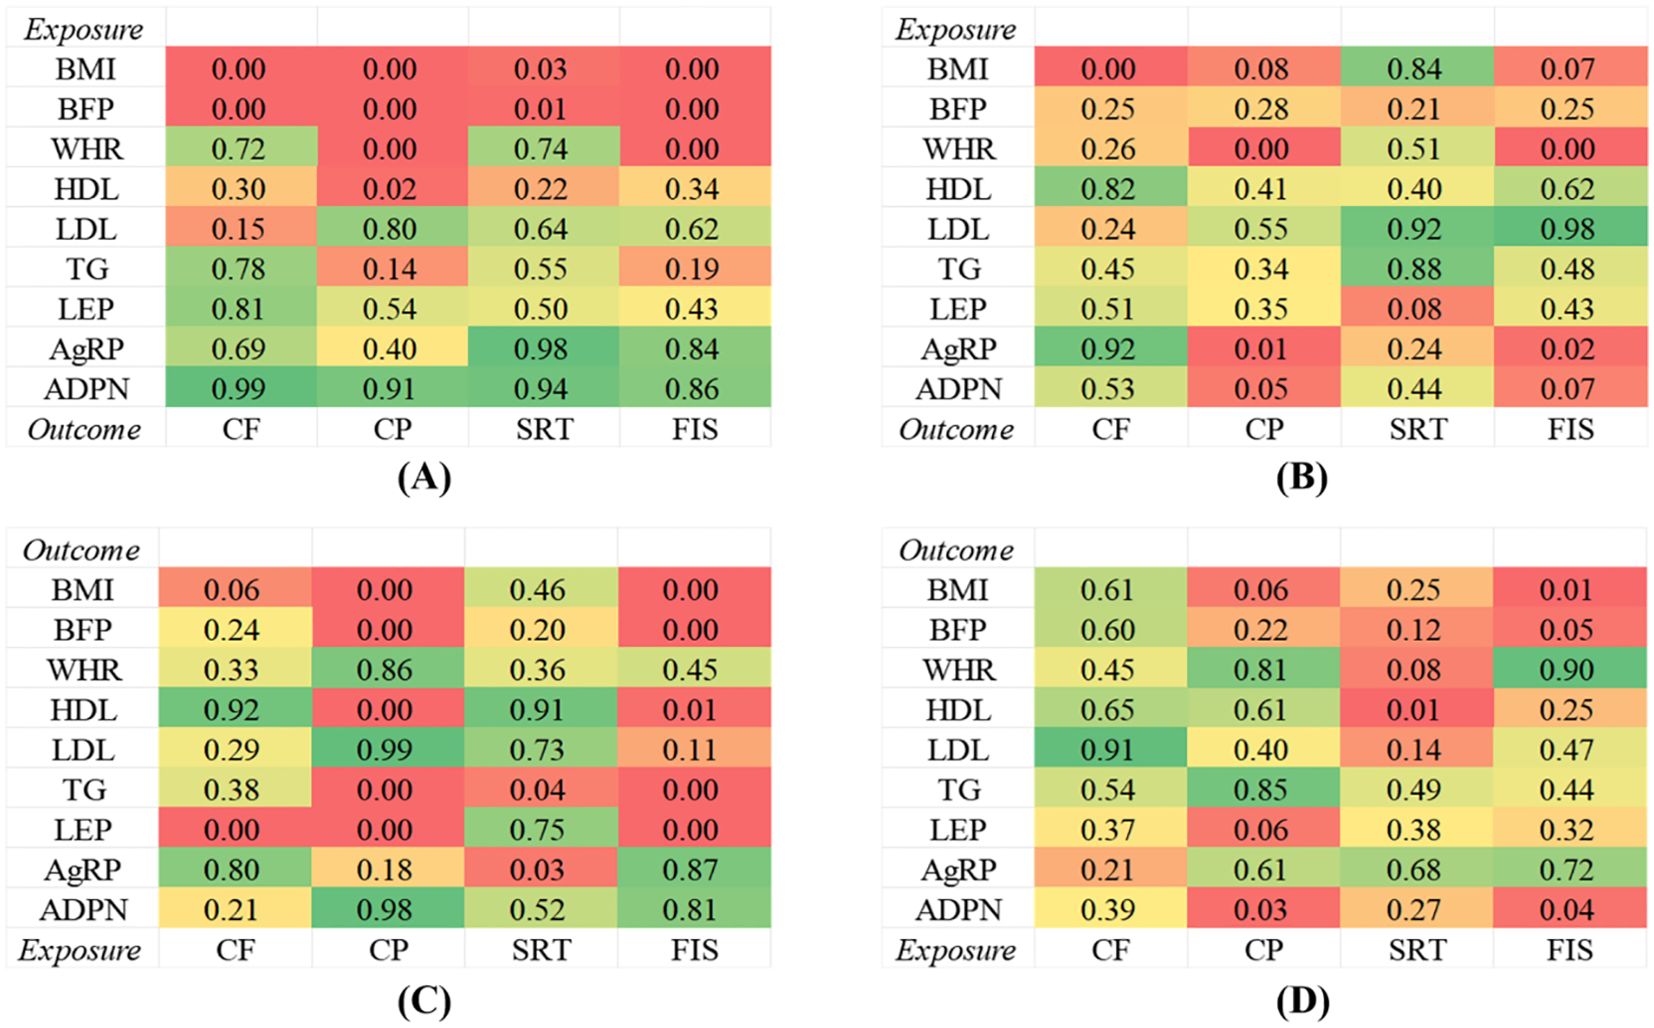
Figure 4. Genetic correlations between obesity, lipids and adipokines factors and cognitive ability. (A) Univariable MR between obesity, lipids and adipokines factors on cognitive ability. (B) Multivariable MR between obesity, lipids and adipokines factors on cognitive ability. (C) Univariable MR between cognitive ability on obesity, lipids and adipokines factors. (D) Multivariable MR between cognitive ability on obesity, lipids and adipokines factors.
The MVMR analysis revealed significant causal associations between genetically predicted obesity and adipokines traits; BMI on CF, WHR on CP and FIS, AgRP on CP and FIS, ADPN on CP (Table 3A, Figures 2B, 4B, 5B). Specifically, BMI showed a significant negative causal effect on CF, consistent with the findings from the forward univariable analysis (β= 0.635([0.472–0.853]; P = 3.000 × 10⁻²). Genetically predicted WHR had a significant causal effect on CP 0.910([0.860 to 0.961]; P = 1.000 × 10⁻²) and FIS 0.793([0.701 to 0.900]; P = 0.000). Additionally, AgRP exhibited a significant negative causal effect on CF 0.687([0.515–0.916]; P = 1.100 × 10⁻²). In contrast, there were no significant associations between lipid traits and cognitive ability, consistent with previous analyses.
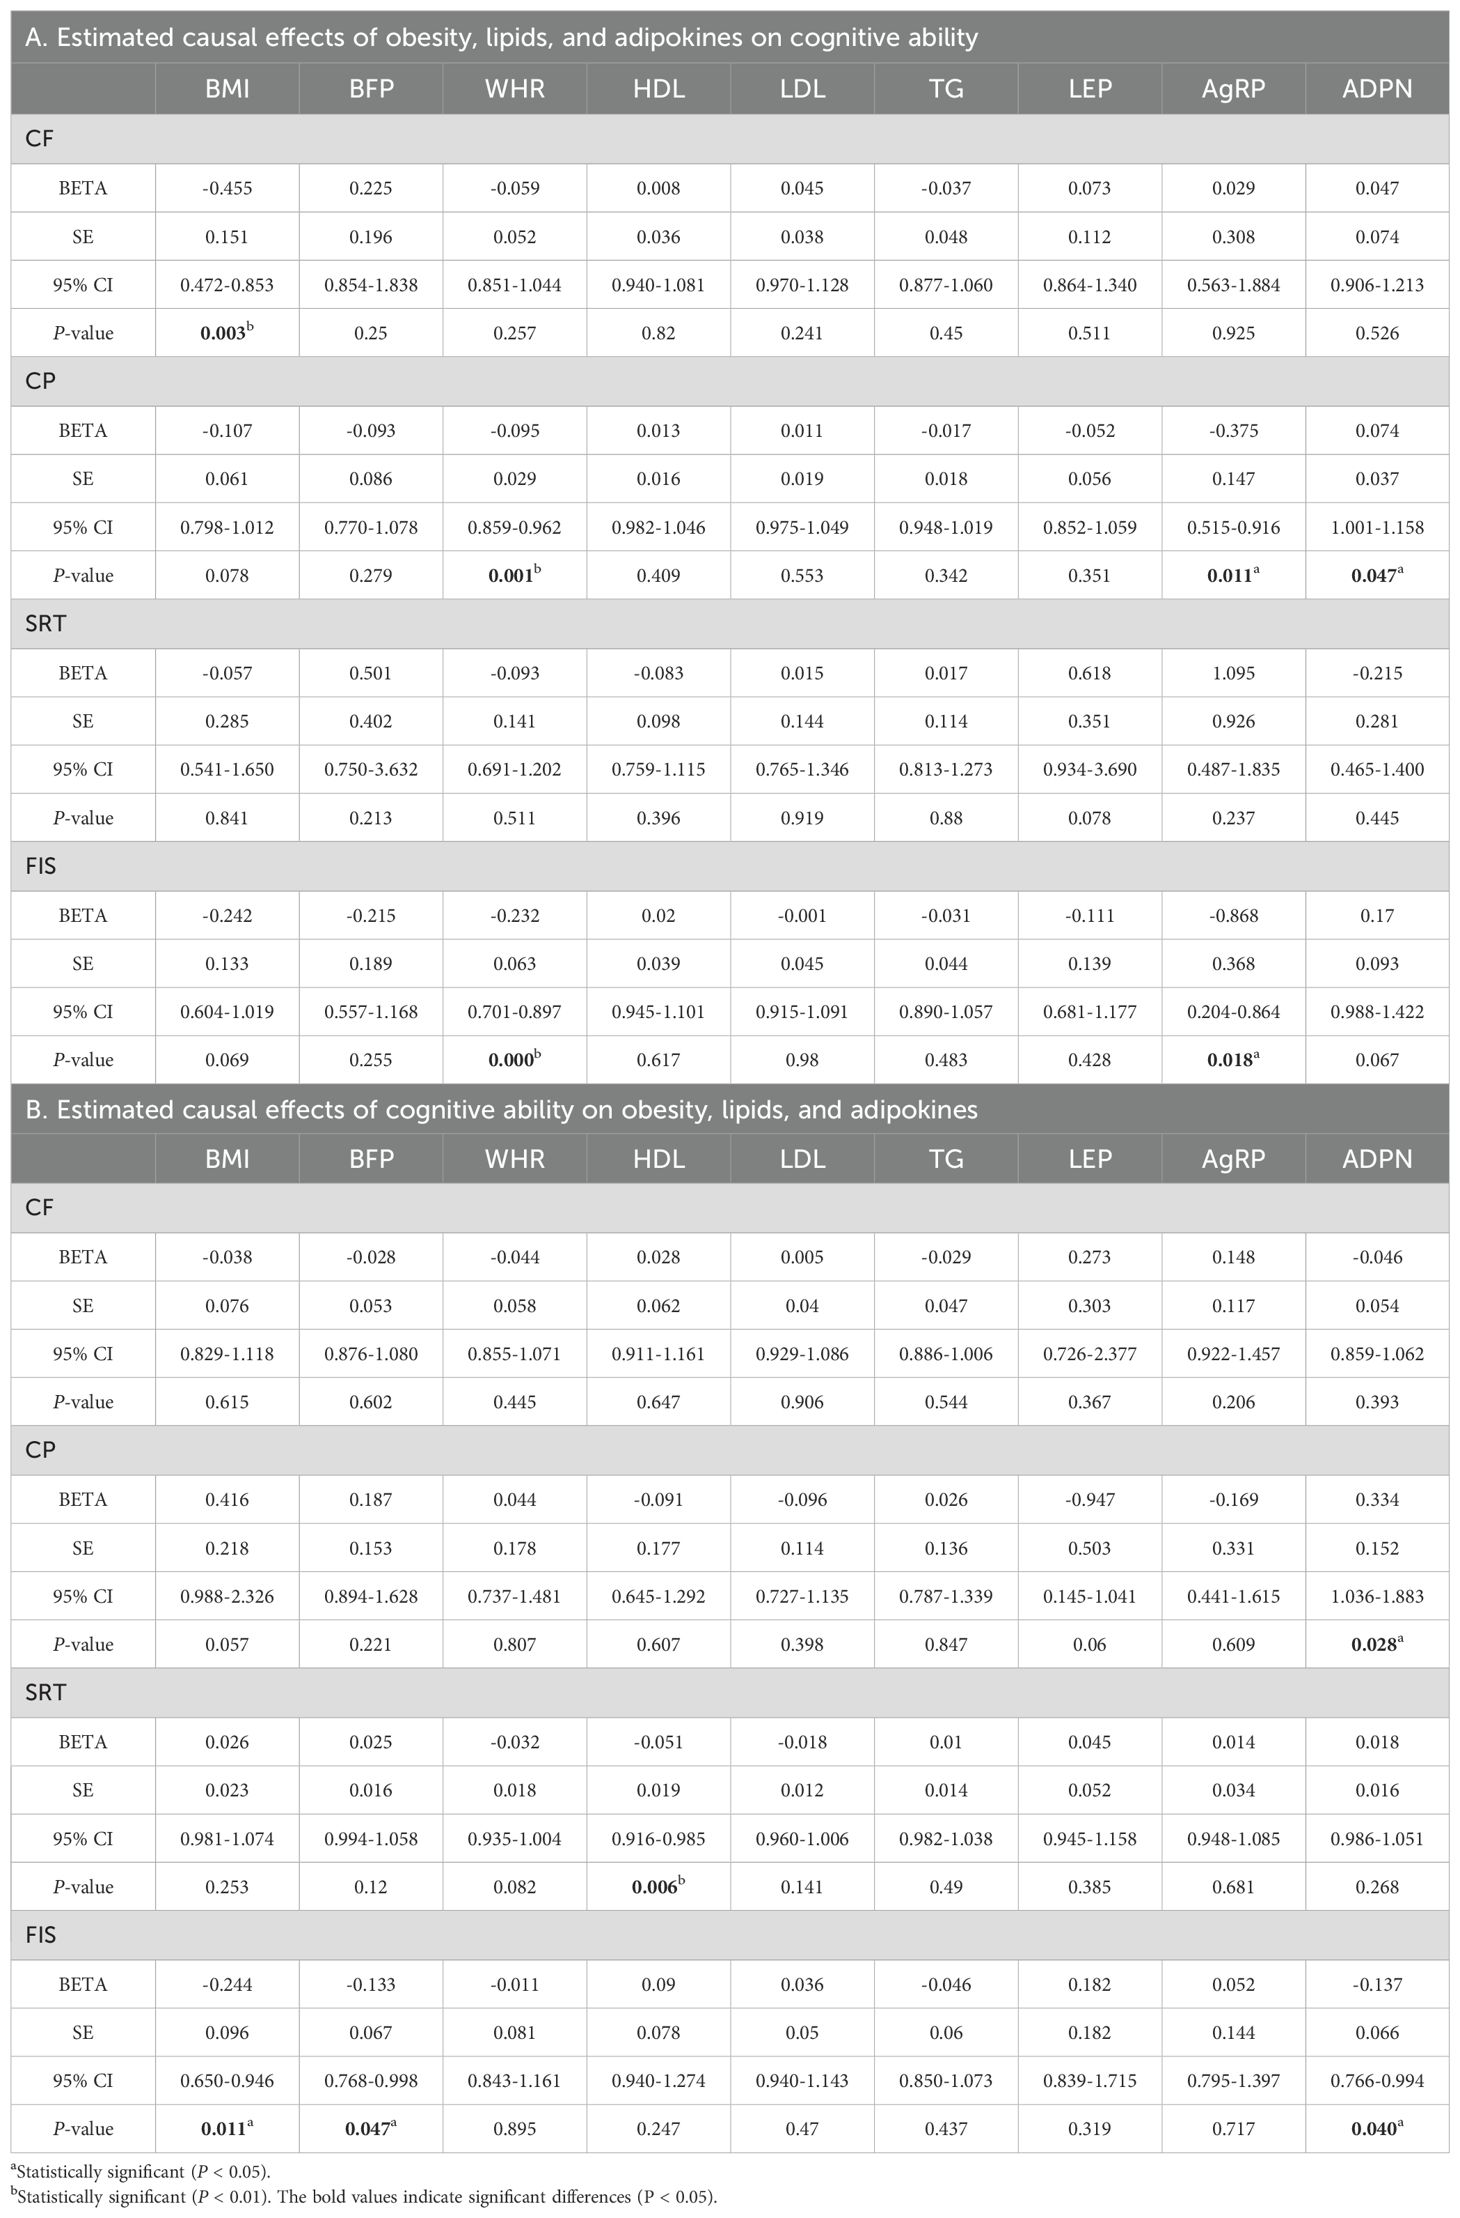
Table 3. Multivariable Mendelian randomization results.
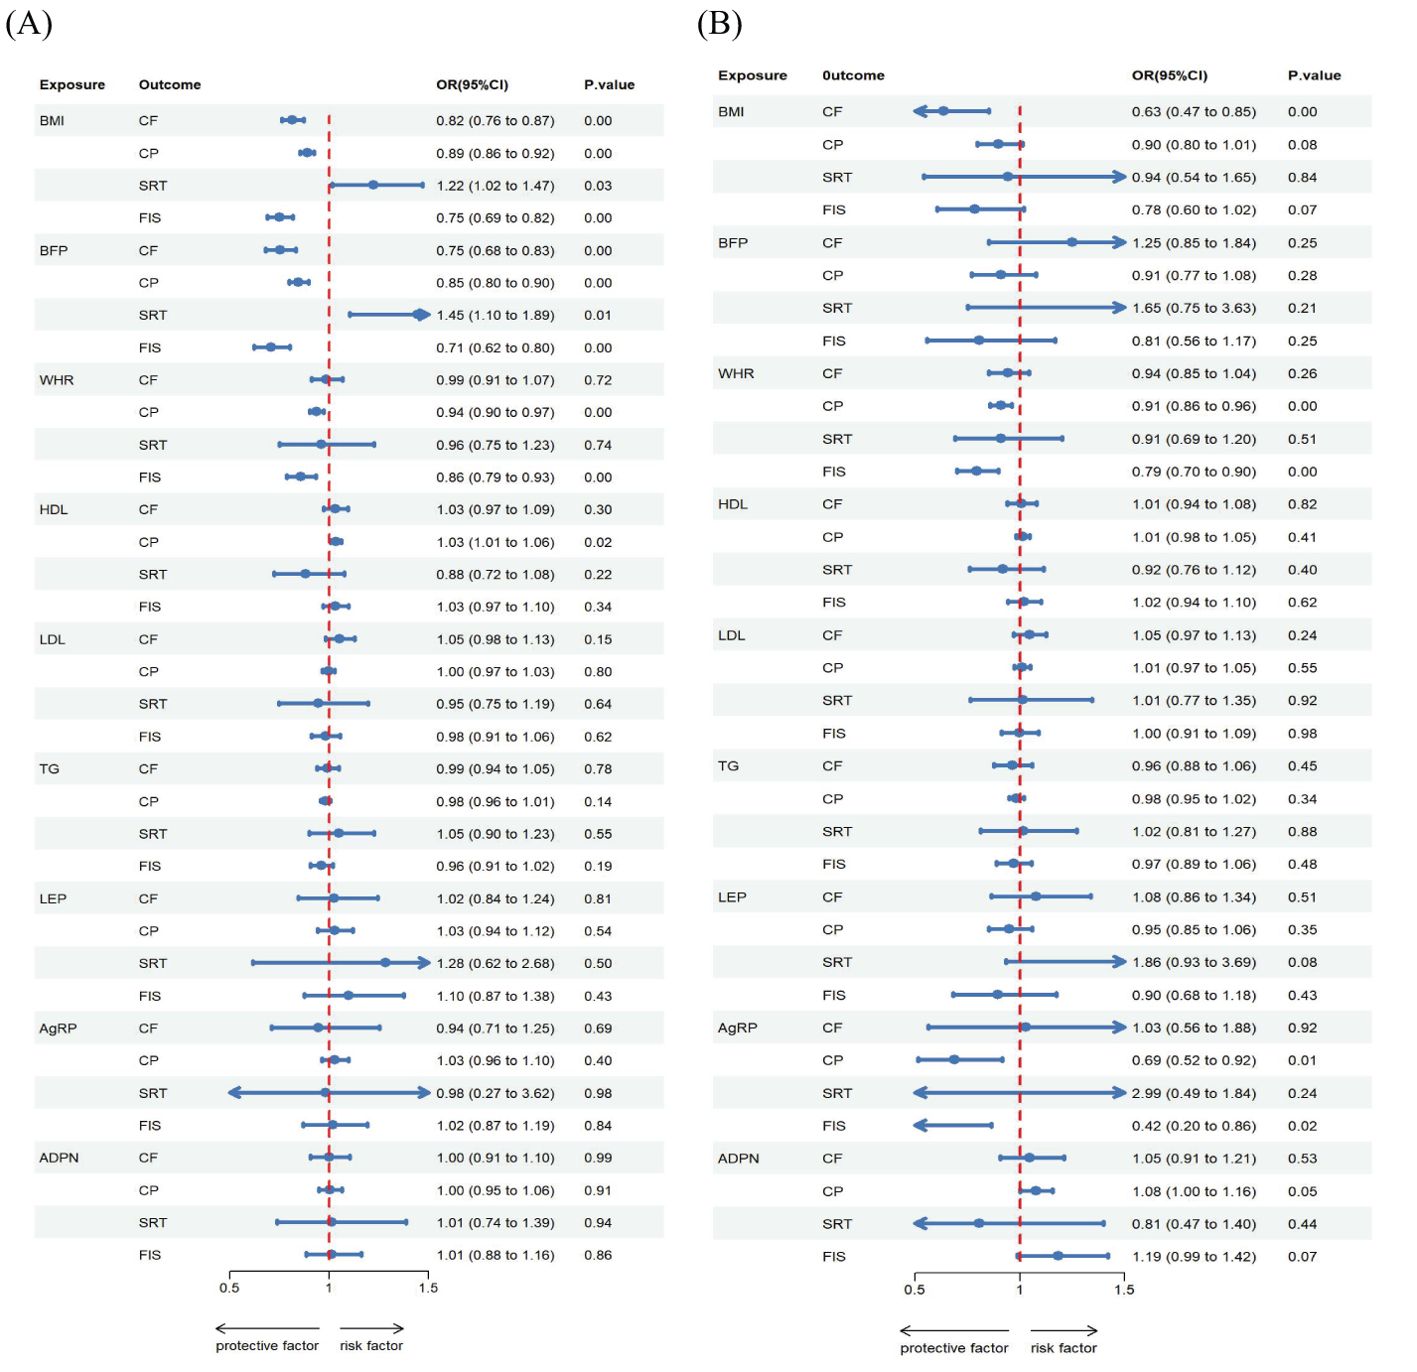
Figure 5. Estimated causal effects of obesity, lipids and adipokines on cognitive ability markers using both univariable and multivariable MR, presented as the SD-unit change in cognitive ability marker per genetically predicted 1-SD change in obesity, lipids and adipokines. Schematic presentation of (A) univariable; (B) multivariable Mendelian randomization.
The reverse MR analysis revealed significant causal association between cognitive ability and obesity, lipids and adipokines traits, as shown in the Table 3B, Figures 2D, 3B, 4D Specifically, for the reverse MR, the effect estimate ([95% CI]) on BMI for FIS was 0.784([0.650 to 0.946]; P = 1.100 × 10⁻²). The multivariable MR yielded evidence of a significant causal effect of genetically predicted SRT on HDL 0.950([0.916 to 0.985]; P = 6.000 × 10⁻²). However, there was no evidence of reverse causal effects from other cognitive ability traits on genetically predicted obesity, lipids, or adipokine traits in this population.
We accounted for the pleiotropic effects between instrumental variables using MR-Egger. There were two instance of horizontal pleiotropy: for the effect of CP and FIS on WHR (P = 0.0004 and 0.018). This pleiotropic of CP on WHR effect remained (P = 0.0008) after removing 9 SNPs (rs112780312, rs12448902, rs148696809, rs2005078, rs2737339, rs34811474, rs4470366, rs6708515, rs78382112) which were associated with identified outliers. Furthermore, MR-PRESSO identified 6 potentially pleiotropic SNPs (rs13107325, rs34811474, rs4456117 rs4852252, rs6125540, rs7775835) of FIS on WHR effect. When we performed the analysis without these specific SNPs, there was no significant evidence of pleiotropy (P = 0.2780). Heterogeneity was observed in approximately half of the heterogeneity test results However, when we conducted the MR-Egger regression intercept analysis to investigate horizontal pleiotropy between the IVs, we found no significant evidence of such pleiotropy. All associations showed P > 0.05 for the MR-Egger intercept, indicating no substantial horizontal pleiotropy. The same pattern was observed in the reverse MR analysis. To further assess potential confounding effects due to pleiotropy between SNPs, we employed the leave-one-out approach. The results indicated no evidence of confounding caused by pleiotropy among the SNPs.
To the best of our knowledge, this is the first investigation that explores the potential causal relationship between obesity, lipids, adipokines and cognitive ability markers using univariable and multivariable MR approaches in both forward and reverse directions respectively. We presented evidence suggesting possible causal effects of several obesity and lipids traits, such as BMI, BFP, WHR and HDL, on cognitive ability through univariable MR analyses. However, these effects estimation altered once accounting for diverse obesity characteristics by various representative indicators using multivariable MR analyses. In the primary multivariable MR analysis conducted in the forward direction, the adipokines of AgRP and ADPN also showed evidence of a significant causal association with cognitive ability. Our reverse-MR analysis yielded compelling evidence indicating that FIS and SRT may influence BMI and HDL respectively. Collectively, these findings not only enhance our mechanistic insights into the complex interplay between obesity and cognition but also carry substantial clinical implications, underscoring potential therapeutic targets and preventive strategies for mitigating cognitive decline amidst the backdrop of obesity and dyslipidemia.
In the adiposity to cognition direction, we corroborated the direct effects of obesity and lipids on cognitive ability. The obesity and lipids traits including BMI, BFP, WHR, AgRP and ADPN have effects on cognitive ability through two primary pathways: (i) a directed path from BMI, BFP and WHR to CF, CP, SRT; (ii) a pathway from AgRP and ADPN to CP through HDL. For the causal relations between adiposity on cognition, while one study reported no significant differences in cognitive performance among normal, overweight, and obese individuals, this might be attributed to the utilization of Mini Mental State Examination (MMSE), which is not highly sensitive to mild cognitive deficits (37). Our selection of cognitive metrics was guided by their sensitivity to detect subtle changes in cognitive function and their relevance to different aspects of cognitive processing, such as memory, attention, and executive function (38, 39). Our study aligns with previous research suggesting that the obesity traits like BMI, BFP and WHR were causal factors for increasing risks of cognitive function (40, 41). Meanwhile, obesity was found to have an adverse effect on reaction speed across some epidemiological and experimental studies (42, 43), which supports our present findings. More importantly, this study was the first to reveal the effects of ADPN and AgRP on CP. An observational study observed that lower adiponectin levels in individuals with obesity (44). As the ADPN appeared to induce an increase in serum HDL (45), the protective effects of ADPN on CP might be mediated through HDL, which displayed positive associations with the ADPN, HDL, and CP in this study. Similarly, our study also found a negative association between plasma AGRP and cognitive (46), corroborating previous research. Despite previous demonstrations indicating that leptin has cognitive enhancing properties (47), our analysis did not provide evidence of a significant causal association between leptin and cognitive traits.
In the direction cognition to adiposity, although we reported that CF, CP, SRT, and FIS had a significant causal effect on obesity traits with the main univariable analysis, only SRT and FIS had a strong effect on HDL and BMI with the multivariable MR analysis. These results contradict previous studies that reported either no association or positive correlations between cognitive function and adiposity risks (8, 48). Our study, based on prospectively longitudinal data, provides robust evidence that lower cognitive function, as indicated by worse SRT and FIS, is associated with lower HDL cholesterol levels and higher BMI (49, 50). Nevertheless, it is unclear how the cognition specifically affects obesity and further studies are needed.
Furthermore, it is important to consider the broader context of obesity-related metabolic disturbances that may contribute to cognitive decline and neurodegeneration. Obesity is associated with increased levels of pro-inflammatory cytokines and chemokines, which can lead to chronic low-grade inflammation. This inflammatory state can promote neuroinflammation and gliosis, key pathological features in neurodegenerative disorders (51). Additionally, obesity-induced decreases in adipokines such as leptin, along with elevated lipid and glucose levels, may exacerbate these processes (52). Our results hint at potential causal relationships where such factors could induce gliosis and contribute to cognitive impairment, providing a mechanistic framework for the observed associations.
The strengths of our study lie in the updated genetic instruments for lipid and adipokine traits in obesity and cognitive MR analyses. We incorporated data from large consortia, which provided robust genetic evidence for the reported associations. By including TG, LEP, ADPN, and AgRP as additional traits, our study expanded the scope of genetic factors considered in the analysis. On the other hand, the utilization of data from populations of European ancestry in our MR study helped mitigate the risks of confounding and reverse causality, while minimizing bias caused by population stratification (53). Meanwhile, our study employed both univariate and multivariate MR analyses in a bidirectional design, enabling us to establish the direction of causal effects between adiposity and cognitive function.
Several limitations of our MR investigation should be acknowledged. First, we did not stratify the causal association between obesity and cognition by gender or age, which may influence fat distribution in different anatomical regions (54). Second, there are various testing methods related to cognitive function. Whether or not these tests represent directly represent cognitive related functions remained unclear. Meanwhile, the representative indicators of obesity and cognitive function included in our study are also limited. Third, the small sample size of GWAS in LEP and AgRP may resulted in imprecision in the selection of SNPs. Therefore, there is a need for larger GWAS to identify more genetic variants for adipokines. Furthermore, it is crucial to validate our findings through longitudinal cohort studies in future research.
Taken together, we demonstrate that high BMI, BFP, WHR and AgRP have negative causal direct effects with cognitive ability, while high HDL and ADPN have positive causal direct effects with cognitive ability. The total effects of obesity on cognitive ability may be mediated by lipids and adipokines including HDL, ADPN and AgRP. For the reverse causal direction, there was a consistent evidence that worse cognitive function such as SRT and FIS may influence serum HDL level and BMI. These studies helped us to objectively validate previous observational studies and deepen our understanding of the association with obesity, lipids and adipokines on cognitive ability. Our study thereby contributes a pivotal piece to the clinical puzzle, elucidating potential biomarkers and pathways implicated in obesity-related cognitive decline. Nevertheless, further mechanistic explorations are imperative to decipher the precise molecular mechanisms underpinning these causal associations, which may ultimately inform targeted interventions and preventative strategies aimed at preserving cognitive integrity amidst the obesity epidemic.
The raw data supporting the conclusions of this article will be made available by the authors, without undue reservation.
MG: Conceptualization, Data curation, Formal analysis, Methodology, Project administration, Software, Visualization, Writing – original draft, Writing – review & editing. HL: Conceptualization, Data curation, Formal analysis, Methodology, Software, Writing – original draft, Writing – review & editing. ZL: Methodology, Writing – original draft. YW: Data curation, Formal analysis, Methodology, Software, Writing – original draft, Writing – review & editing. SQ: Methodology, Writing – original draft. HG: Conceptualization, Methodology, Visualization, Writing – original draft. SJ: Conceptualization, Project administration, Writing – original draft.
The author(s) declare financial support was received for the research, authorship, and/or publication of this article. Sichuan Provincial Administration of Traditional Chinese Medicine, China (No. 2022CP0992).
We would like to express our gratitude to the investigators of the original GWAS for generously sharing the summary data that were utilized in this study.
The authors declare that the research was conducted in the absence of any commercial or financial relationships that could be construed as a potential conflict of interest.
All claims expressed in this article are solely those of the authors and do not necessarily represent those of their affiliated organizations, or those of the publisher, the editors and the reviewers. Any product that may be evaluated in this article, or claim that may be made by its manufacturer, is not guaranteed or endorsed by the publisher.
1. Liu J, Lee B, McLeod DM, Choung H. Framing obesity: effects of obesity labeling and prevalence statistics on public perceptions. Health Educ Behav. (2019) 46:322–8. doi: 10.1177/1090198118788907
2. Farruggia MC, Small DM. Effects of adiposity and metabolic dysfunction on cognition: A review. Physiol Behav. (2019) 208:112578. doi: 10.1016/j.physbeh.2019.112578
3. Nazmus SM, Best JR, Ramezan R, Thompson ME, Hall PA. Bidirectional associations between adiposity and cognitive function: A prospective analysis of the canadian longitudinal study on aging (CLSA). J Gerontol A Biol Sci Med Sci. (2023) 78:314–25. doi: 10.1093/gerona/glac115
4. Alosco ML, Spitznagel MB, Gunstad J. Obesity as a risk factor for poor neurocognitive outcomes in older adults with heart failure. Heart Fail Rev. (2014) 19:403–11. doi: 10.1007/s10741-013-9399-2
5. West NA, Lirette ST, Cannon VA, Turner ST, Mosley TJ, Windham BG, et al. Adiposity, change in adiposity, and cognitive decline in mid- and late life. J Am Geriatr Soc. (2017) 65:1282–8. doi: 10.1111/jgs.14786
6. Forte R, Pesce C, De Vito G, Boreham CA. The body fat-cognition relationship in healthy older individuals: does gynoid vs android distribution matter? J Nutr Health Aging. (2017) 21:284–91. doi: 10.1007/s12603-016-0783-1
7. Sellbom KS, Gunstad J. Cognitive function and decline in obesity. J Alzheimers Dis. (2012) 30 Suppl 2:S89–95. doi: 10.3233/JAD-2011-111073
8. Norris T, Salzmann A, Henry A, Garfield V, Pinto PS. The relationship between adiposity and cognitive function: a bidirectional Mendelian randomization study in UK Biobank. Int J Epidemiol. (2023) 52:1074–85. doi: 10.1093/ije/dyad043
9. Zhang T, Yan R, Chen Q, Ying X, Zhai Y, Li F, et al. Body mass index, waist-to-hip ratio and cognitive function among Chinese elderly: a cross-sectional study. BMJ Open. (2018) 8:e022055. doi: 10.1136/bmjopen-2018-022055
10. Kim HJ, Kim C, Jeon S, Kang M, Kim YJ, Lee JM, et al. Association of body fat percentage and waist-hip ratio with brain cortical thickness: A study among 1777 cognitively normal subjects. Alzheimer Dis Assoc Disord. (2015) 29:279–86. doi: 10.1097/WAD.0000000000000079
11. Raine L, Drollette E, Kao SC, Westfall D, Chaddock-Heyman L, Kramer AF, et al. The associations between adiposity, cognitive function, and achievement in children. Med Sci Sports Exerc. (2018) 50:1868–74. doi: 10.1249/MSS.0000000000001650
12. Kintu C, Soremekun O, Kamiza AB, Kalungi A, Mayanja R, Kalyesubula R, et al. The causal effects of lipid traits on kidney function in Africans: bidirectional and multivariable Mendelian-randomization study. EBioMedicine. (2023) 90:104537. doi: 10.1016/j.ebiom.2023.104537
13. Grasset L, Smit R, Caunca MR, Elfassy T, Odden MC, Grond der van J, et al. Association of high-density lipoprotein cholesterol with cognitive function: findings from the PROspective study of pravastatin in the elderly at risk. J Aging Health. (2020) 32:1267–74. doi: 10.1177/0898264320916959
14. Stough C, Pipingas A, Camfield D, Nolidin K, Savage K, Deleuil S, et al. Increases in total cholesterol and low density lipoprotein associated with decreased cognitive performance in healthy elderly adults. Metab Brain Dis. (2019) 34:477–84. doi: 10.1007/s11011-018-0373-5
15. Prickett C, Brennan L, Stolwyk R. Examining the relationship between obesity and cognitive function: a systematic literature review. Obes Res Clin Pract. (2015) 9:93–113. doi: 10.1016/j.orcp.2014.05.001
16. Ha J, Kwak S, Kim KY, Kim H, Cho SY, Kim M, et al. Relationship between adipokines, cognition, and brain structures in old age depending on obesity. J Gerontol A Biol Sci Med Sci. (2023) 78:120–8. doi: 10.1093/gerona/glac021
17. Sarrar L, Ehrlich S, Merle JV, Pfeiffer E, Lehmkuhl U, Schneider N. Cognitive flexibility and Agouti-related protein in adolescent patients with anorexia nervosa. Psychoneuroendocrinology. (2011) 36:1396–406. doi: 10.1016/j.psyneuen.2011.03.014
18. Li N, Arbuckle TE, Muckle G, Lanphear BP, Boivin M, Chen A, et al. Associations of cord blood leptin and adiponectin with children's cognitive abilities. Psychoneuroendocrinology. (2019) 99:257–64. doi: 10.1016/j.psyneuen.2018.10.021
19. Teunissen CE, van der Flier WM, Scheltens P, Duits A, Wijnstok N, Nijpels G, et al. Serum leptin is not altered nor related to cognitive decline in Alzheimer's disease. J Alzheimers Dis. (2015) 44:809–13. doi: 10.3233/JAD-141503
20. Gunstad J, Sanborn V, Hawkins M. Cognitive dysfunction is a risk factor for overeating and obesity. Am Psychol. (2020) 75:219–34. doi: 10.1037/amp0000585
21. Sakib MN, Best JR, Hall PA. Bidirectional associations between adiposity and cognitive function and mediation by brain morphology in the ABCD study. JAMA Netw Open. (2023) 6:e2255631. doi: 10.1001/jamanetworkopen.2022.55631
22. Hartanto A, Yong JC, Toh WX. Bidirectional associations between obesity and cognitive function in midlife adults: A longitudinal study. Nutrients. (2019) 11(10):2343. doi: 10.3390/nu11102343
23. Meo SA, Altuwaym AA, Alfallaj RM, Alduraibi KA, Alhamoudi AM, Alghamdi SM, et al. Effect of obesity on cognitive function among school adolescents: A cross-sectional study. Obes Facts. (2019) 12:150–6. doi: 10.1159/000499386
24. Emdin CA, Khera AV, Kathiresan S. Mendelian randomization. JAMA. (2017) 318:1925–6. doi: 10.1001/jama.2017.17219
25. Mina T, Yew YW, Ng HK, Sadhu N, Wansaicheong G, Dalan R, et al. Adiposity impacts cognitive function in Asian populations: an epidemiological and Mendelian Randomization study. Lancet Reg Health West Pac. (2023) 33:100710. doi: 10.1016/j.lanwpc.2023.100710
26. Barton AR, Sherman MA, Mukamel RE, Loh PR. Whole-exome imputation within UK Biobank powers rare coding variant association and fine-mapping analyses. Nat Genet. (2021) 53:1260–9. doi: 10.1038/s41588-021-00892-1
28. Sanderson E, Davey SG, Windmeijer F, Bowden J. An examination of multivariable Mendelian randomization in the single-sample and two-sample summary data settings. Int J Epidemiol. (2019) 48:713–27. doi: 10.1093/ije/dyy262
29. Yaghootkar H, Zhang Y, Spracklen CN, Karaderi T, Huang LO, Bradfield J, et al. Genetic studies of leptin concentrations implicate leptin in the regulation of early adiposity. Diabetes. (2020) 69:2806–18. doi: 10.2337/db20-0070
30. Folkersen L, Gustafsson S, Wang Q, Hansen DH, Hedman ÅK, Schork A, et al. Genomic and drug target evaluation of 90 cardiovascular proteins in 30,931 individuals. Nat Metab. (2020) 2:1135–48. doi: 10.1038/s42255-020-00287-2
31. Lee JJ, Wedow R, Okbay A, Kong E, Maghzian O, Zacher M, et al. Gene discovery and polygenic prediction from a genome-wide association study of educational attainment in 1.1 million individuals. Nat Genet. (2018) 50:1112–21. doi: 10.1038/s41588-018-0147-3
32. Luciano M, Hansell NK, Lahti J, Davies G, Medland SE, Räikkönen K, et al. Whole genome association scan for genetic polymorphisms influencing information processing speed. Biol Psychol. (2011) 86:193–202. doi: 10.1016/j.biopsycho.2010.11.008
33. Choudhury A, Brandenburg JT, Chikowore T, Sengupta D, Boua PR, Crowther NJ, et al. Meta-analysis of sub-Saharan African studies provides insights into genetic architecture of lipid traits. Nat Commun. (2022) 13:2578. doi: 10.1038/s41467-022-30098-w
34. Yavorska OO, Burgess S. MendelianRandomization: an R package for performing Mendelian randomization analyses using summarized data. Int J Epidemiol. (2017) 46:1734–9. doi: 10.1093/ije/dyx034
35. Pearman WS, Freed NE, Silander OK. Testing the advantages and disadvantages of short- and long- read eukaryotic metagenomics using simulated reads. BMC Bioinf. (2020) 21:220. doi: 10.1186/s12859-020-3528-4
36. Skrivankova VW, Richmond RC, Woolf B, Yarmolinsky J, Davies NM, Swanson SA, et al. Strengthening the reporting of observational studies in epidemiology using mendelian randomization: the STROBE-MR statement. JAMA. (2021) 326:1614–21. doi: 10.1001/jama.2021.18236
37. Gonzales MM, Tarumi T, Miles SC, Tanaka H, Shah F, Haley AP. Insulin sensitivity as a mediator of the relationship between BMI and working memory-related brain activation. Obes (Silver Spring). (2010) 18:2131–7. doi: 10.1038/oby.2010.183
38. Lopez CA, Konno T, van Gerpen JA. Personality changes, executive dysfunction, and motor and memory impairment. JAMA Neurol. (2017) 74:245–6. doi: 10.1001/jamaneurol.2016.2782
39. Lu R, Xi J, Zhang X, Shi J. High fluid intelligence is characterized by flexible allocation of attentional resources: Evidence from EEG. Neuropsychologia. (2022) 164:108094. doi: 10.1016/j.neuropsychologia.2021.108094
40. Smith E, Hay P, Campbell L, Trollor JN. A review of the association between obesity and cognitive function across the lifespan: implications for novel approaches to prevention and treatment. Obes Rev. (2011) 12:740–55. doi: 10.1111/j.1467-789X.2011.00920.x
41. Gunstad J, Paul RH, Cohen RA, Tate DF, Spitznagel MB, Gordon E. Elevated body mass index is associated with executive dysfunction in otherwise healthy adults. Compr Psychiatry. (2007) 48:57–61. doi: 10.1016/j.comppsych.2006.05.001
42. Ariza M, Garolera M, Jurado MA, Garcia-Garcia I, Hernan I, Sánchez-Garre C, et al. Dopamine genes (DRD2/ANKK1-TaqA1 and DRD4-7R) and executive function: their interaction with obesity. PloS One. (2012) 7:e41482. doi: 10.1371/journal.pone.0041482
43. Etou H, Sakata T, Fujimoto K, Kurata K, Terada K, Fukagawa K, et al. Characteristics of psychomotor performance and time cognition in moderately obese patients. Physiol Behav. (1989) 45:985–8. doi: 10.1016/0031-9384(89)90225-4
44. Guenther M, James R, Marks J, Zhao S, Szabo A, Kidambi S. Adiposity distribution influences circulating adiponectin levels. Transl Res. (2014) 164:270–7. doi: 10.1016/j.trsl.2014.04.008
45. Christou GA, Kiortsis DN. Adiponectin and lipoprotein metabolism. Obes Rev. (2013) 14:939–49. doi: 10.1111/obr.12064
46. Gilbert T, Roche S, Blond E, Bar JY, Drai J, Cuerq C, et al. Association between peripheral leptin and adiponectin levels and cognitive decline in patients with neurocognitive disorders ≥65 years. J Alzheimers Dis. (2018) 66:1255–64. doi: 10.3233/JAD-180533
47. Malekizadeh Y, Holiday A, Redfearn D, Ainge JA, Doherty G, Harvey J. A leptin fragment mirrors the cognitive enhancing and neuroprotective actions of leptin. Cereb Cortex. (2017) 27:4769–82. doi: 10.1093/cercor/bhw272
48. Davies NM, Hill WD, Anderson EL, Sanderson E, Deary IJ, Davey SG. Multivariable two-sample Mendelian randomization estimates of the effects of intelligence and education on health. Elife. (2019) 8:e43990. doi: 10.7554/eLife.43990
49. Kanazawa S. Intelligence and obesity: which way does the causal direction go? Curr Opin Endocrinol Diabetes Obes. (2014) 21:339–44. doi: 10.1097/MED.0000000000000091
50. Batty GD, Gale CR, Mortensen LH, Langenberg C, Shipley MJ, Deary IJ. Pre-morbid intelligence, the metabolic syndrome and mortality: the Vietnam Experience Study. Diabetologia. (2008) 51:436–43. doi: 10.1007/s00125-007-0908-5
51. Miller AA, Spencer SJ. Obesity and neuroinflammation: a pathway to cognitive impairment. Brain Behav Immun. (2014) 42:10–21. doi: 10.1016/j.bbi.2014.04.001
52. Witte AV, Kobe T, Graunke A, Schuchardt JP, Hahn A, Tesky VA, et al. Impact of leptin on memory function and hippocampal structure in mild cognitive impairment. Hum Brain Mapp. (2016) 37:4539–49. doi: 10.1002/hbm.23327
53. Chen J, Ruan X, Yuan S, Deng M, Zhang H, Sun J, et al. Antioxidants, minerals and vitamins in relation to Crohn's disease and ulcerative colitis: A Mendelian randomization study. Aliment Pharmacol Ther. (2023) 57:399–408. doi: 10.1111/apt.17392
Keywords: adipokines, bidirectional, cognitive ability, genetic correlation, lipids, Mendelian randomization, obesity
Citation: Gong M, Liu H, Liu Z, Wang Y, Qi S, Guo H and Jin S (2025) Causal links between obesity, lipids, adipokines, and cognition: a bidirectional Mendelian-randomization analysis. Front. Endocrinol. 16:1439341. doi: 10.3389/fendo.2025.1439341
Received: 29 May 2024; Accepted: 21 January 2025;
Published: 10 February 2025.
Edited by:
Darko Stefanovski, University of Pennsylvania, United StatesReviewed by:
Georgia Damoraki, National and Kapodistrian University of Athens, GreeceCopyright © 2025 Gong, Liu, Liu, Wang, Qi, Guo and Jin. This is an open-access article distributed under the terms of the Creative Commons Attribution License (CC BY). The use, distribution or reproduction in other forums is permitted, provided the original author(s) and the copyright owner(s) are credited and that the original publication in this journal is cited, in accordance with accepted academic practice. No use, distribution or reproduction is permitted which does not comply with these terms.
*Correspondence: Song Jin, MTA0OTE0NzAwMEBxcS5jb20=; Hong Guo, ODkyNzE3MDU0QHFxLmNvbQ==
†These authors have contributed equally to this work and share first authorship
Disclaimer: All claims expressed in this article are solely those of the authors and do not necessarily represent those of their affiliated organizations, or those of the publisher, the editors and the reviewers. Any product that may be evaluated in this article or claim that may be made by its manufacturer is not guaranteed or endorsed by the publisher.
Research integrity at Frontiers
Learn more about the work of our research integrity team to safeguard the quality of each article we publish.