 Xiao Gu
 Yaqi Du
- 1Department of Oncology, Shengjing Hospital of China Medical University, Shenyang, China
- 2Department of Gastroenterology, The First Hospital of China Medical University, Shenyang, China
Background: Previous research on the prognostic effectiveness of examined lymph nodes (ELN), lymph node ratio (LNR), and positive lymph nodes (pN) in postoperative gastric cancer (GC) has yielded inconsistent results despite their widespread use.
Methods: This study used a competing risk model (CRM) to evaluate the prognostic efficacy of these markers in patients with GC. Data from 337 patients with lymph node (LN)-positive stage II GC undergoing resection and chemotherapy between 2010 and 2015 were collected from the Surveillance, Epidemiology, and End Results database. Optimal cutoff values for ELN and LNR were determined using restricted cubic splines, and pN was divided into three groups based on the AJCC staging system. The survival analyses were conducted using Kaplan–Meier curves, Cox proportional hazards analysis, cumulative incidence curves, and CRM. Subgroup analysis and interaction tests were performed to evaluate the correlation between LN status and survival within subgroups.
Results: The results indicated that the optimal cutoff values for ELN, LNR, and pN were 16, 0.1, and 2. Multivariate Cox analysis showed that ELN (hazard ratio [HR] = 0.67), LNR (HR = 2.23), and pN (HR = 2.80) were independent predictors of overall survival, whereas only LNR (HR = 2.08) was independently associated with disease-specific survival. The CRM revealed that LNR (sub-distribution hazard ratio [SHR] = 1.89) and pN (SHR = 2.80) were independently associated with disease-specific survival.
Conclusion: In conclusion, ELN, LNR, and pN are all significant predictors of overall survival for GC. However, LNR demonstrates stronger robustness in predicting DSS than ELN and pN. The LNR may supplement the TNM staging system in identifying prognostic discrepancies.
1 Introduction
Gastric cancer (GC) is the fifth most diagnosed cancer and the fourth leading cause of cancer-related mortality worldwide. In 2020, 1,089,103 new cases of GC were reported, with 768,793 deaths (1). GC can be classified into four major types: adenocarcinoma, adenosquamous carcinoma, squamous carcinoma, and carcinoid. Adenocarcinoma is the most common histopathological type and represents an overwhelming majority (> 90%) of GC cases (2). The prognosis of patients with GC has improved owing to recent advances in comprehensive treatment. In a phase III randomized trial, patients with stage II GC who received adjuvant chemotherapy had a 5-year overall survival (OS) rate of 84.2% (3). LN status is a strong prognostic factor in patients with GC. The 5-year OS rate decreased to 30% once lymph node (LN) metastasis occurred (4).
Currently, the number of positive LNs (pN), the number of examined LNs (ELN), and the LN ratio (LNR) are widely used to evaluate LN status in patients with GC after gastrectomy. pN is the number of positive regional LNs and represents the N stage in the American Joint Committee on Cancer (AJCC) TNM staging system, which is the most widely used staging system for GC. N stage is categorized according to the number of metastatic regional LNs. In the seventh AJCC staging system, no metastatic LN, 1–2, 3–6, 7–15, and ≥ 16 metastatic regional LNs are classified as N0, N1, N2, N3a, and N3b, respectively. ELN is defined as the number of LNs examined, indicating locoregional disease clearance during gastrectomy, which may influence the accuracy of N staging and even lead to stage migration. ELN is negatively associated with the risk of distant metastasis and positively correlated with prognosis in patients with GC (5–7). The LNR refers to the ratio of the number of metastatic LN to the number of ELN. The LNR is a composite of both pN and ELN and is less affected by clinical stage migration. Thus, the LNR is considered a useful prognostic indicator in patients with GC.
Recent MD Anderson Cancer Center research demonstrated that patients with ELN ≥ 30 and LNR < 0.3 have longer relapse-free survival than those with ELN < 30 and LNR > 0.3, respectively. Using the National Clinical Database, Erstad et al. (8) investigated 22,018 patients with GC with LN metastasis and observed that patients with ELN ≥ 30 had a significant survival advantage. However, neither of the abovementioned studies considered potential competing events against disease-specific death in patients with GC. A competing event refers to an event that precludes or reduces the probability that an event of interest will occur. For instance, cardiac death, suicide, and accidental death will prevent the probability of cancer-specific death. When the study outcome is cancer-specific death, events other than the study outcome are termed competing events. Indeed, when study populations are susceptible to competing events, Cox proportional hazards regression model likely leads to a significant overestimation of the rates of overcoming events. In such cases, a competing risk model (CRM) is recommended (9) because it allows for a more accurate assessment of the association between predictor variables and outcomes than Cox regression model (10–12). A CRM is an analysis method for estimating the cumulative incidence probability of outcome events by using the cumulative incidence function and processing the survival data of outcomes and multiple competing risk events. Gao et al. conducted a study on long-term mortality using Cox proportional hazards analysis and competing risks regression analysis, emphasizing that CRM is more suitable for survival analysis in patients with classical Hodgkin lymphoma (10). Fu et al. found that the errors introduced by the Cox proportional hazards model could be corrected by CRM, thereby providing more accurate survival predictions, when exploring the impact of non-breast cancer-specific mortality on the overall survival of patients with resectable breast cancer (12). Few reports have used a CRM to conduct comparisons among ELN, LNR, and pN.
The prognosis of patients with stage II GC typically lies between early and advanced stages of GC. For patients with LN-positive stage II GC, LN status (such as ELN, LNR, and pN) plays a crucial role in predicting the prognosis (13). However, there is limited in-depth research in the literature on this specific group. Moreover, studies have indicated that patients with GC may experience higher toxicity during postoperative chemotherapy and radiotherapy, especially hematological and gastrointestinal toxicities (14). The patients with LN-positive stage II present with more complex conditions and may face a higher risk of treatment-related non-GCSD events. This makes the influence of competing risk events particularly significant when assessing overall survival, thus requiring a specialized analysis. In addition, in-depth research on LN-related markers (such as ELN, LNR, and pN) and their impact on the prognosis of patients with stage II LN-positive GC can contribute to optimizing the extent of LN dissection and postoperative follow-up strategies while also providing theoretical evidence for personalized treatment. Therefore, using a CRM, the present study aimed to evaluate the prognostic effects of ELN, LNR, and pN in patients with LN-positive stage II GC undergoing resection and chemotherapy. Because a cohort of patients from a single medical center usually has the disadvantages of small sample size, low statistical efficiency, and evident selection bias, we analyzed a large cohort of patients from the Surveillance, Epidemiology, and End Results (SEER) database.
2 Materials and methods
2.1 Data source
Data were obtained from the SEER database, which is funded by the National Cancer Institute. The publicly available SEER database collects and publishes comprehensive information on cancer incidence, characteristics, and survival in the United States (US). Additionally, the SEER database covers approximately 48% of the US population, including various races (15). The requirement for ethical approval was waived.
Patients who met the following criteria were enrolled: (i) being diagnosed with GC; (ii) having adenocarcinoma histology; (iii) having AJCC stage II; (iv) having undergone surgical treatment at primary sites; and (v) having received chemotherapy. The exclusion criteria were as follows: (i) AJCC stage N0; (ii) absence of regional LN or having no available regional LN; (iii) absence of pLN or having no available pLN; and (iv) follow-up time of < 1 year. The selection procedure is illustrated in Figure 1. Finally, 337 patients with GC were included in the analysis.
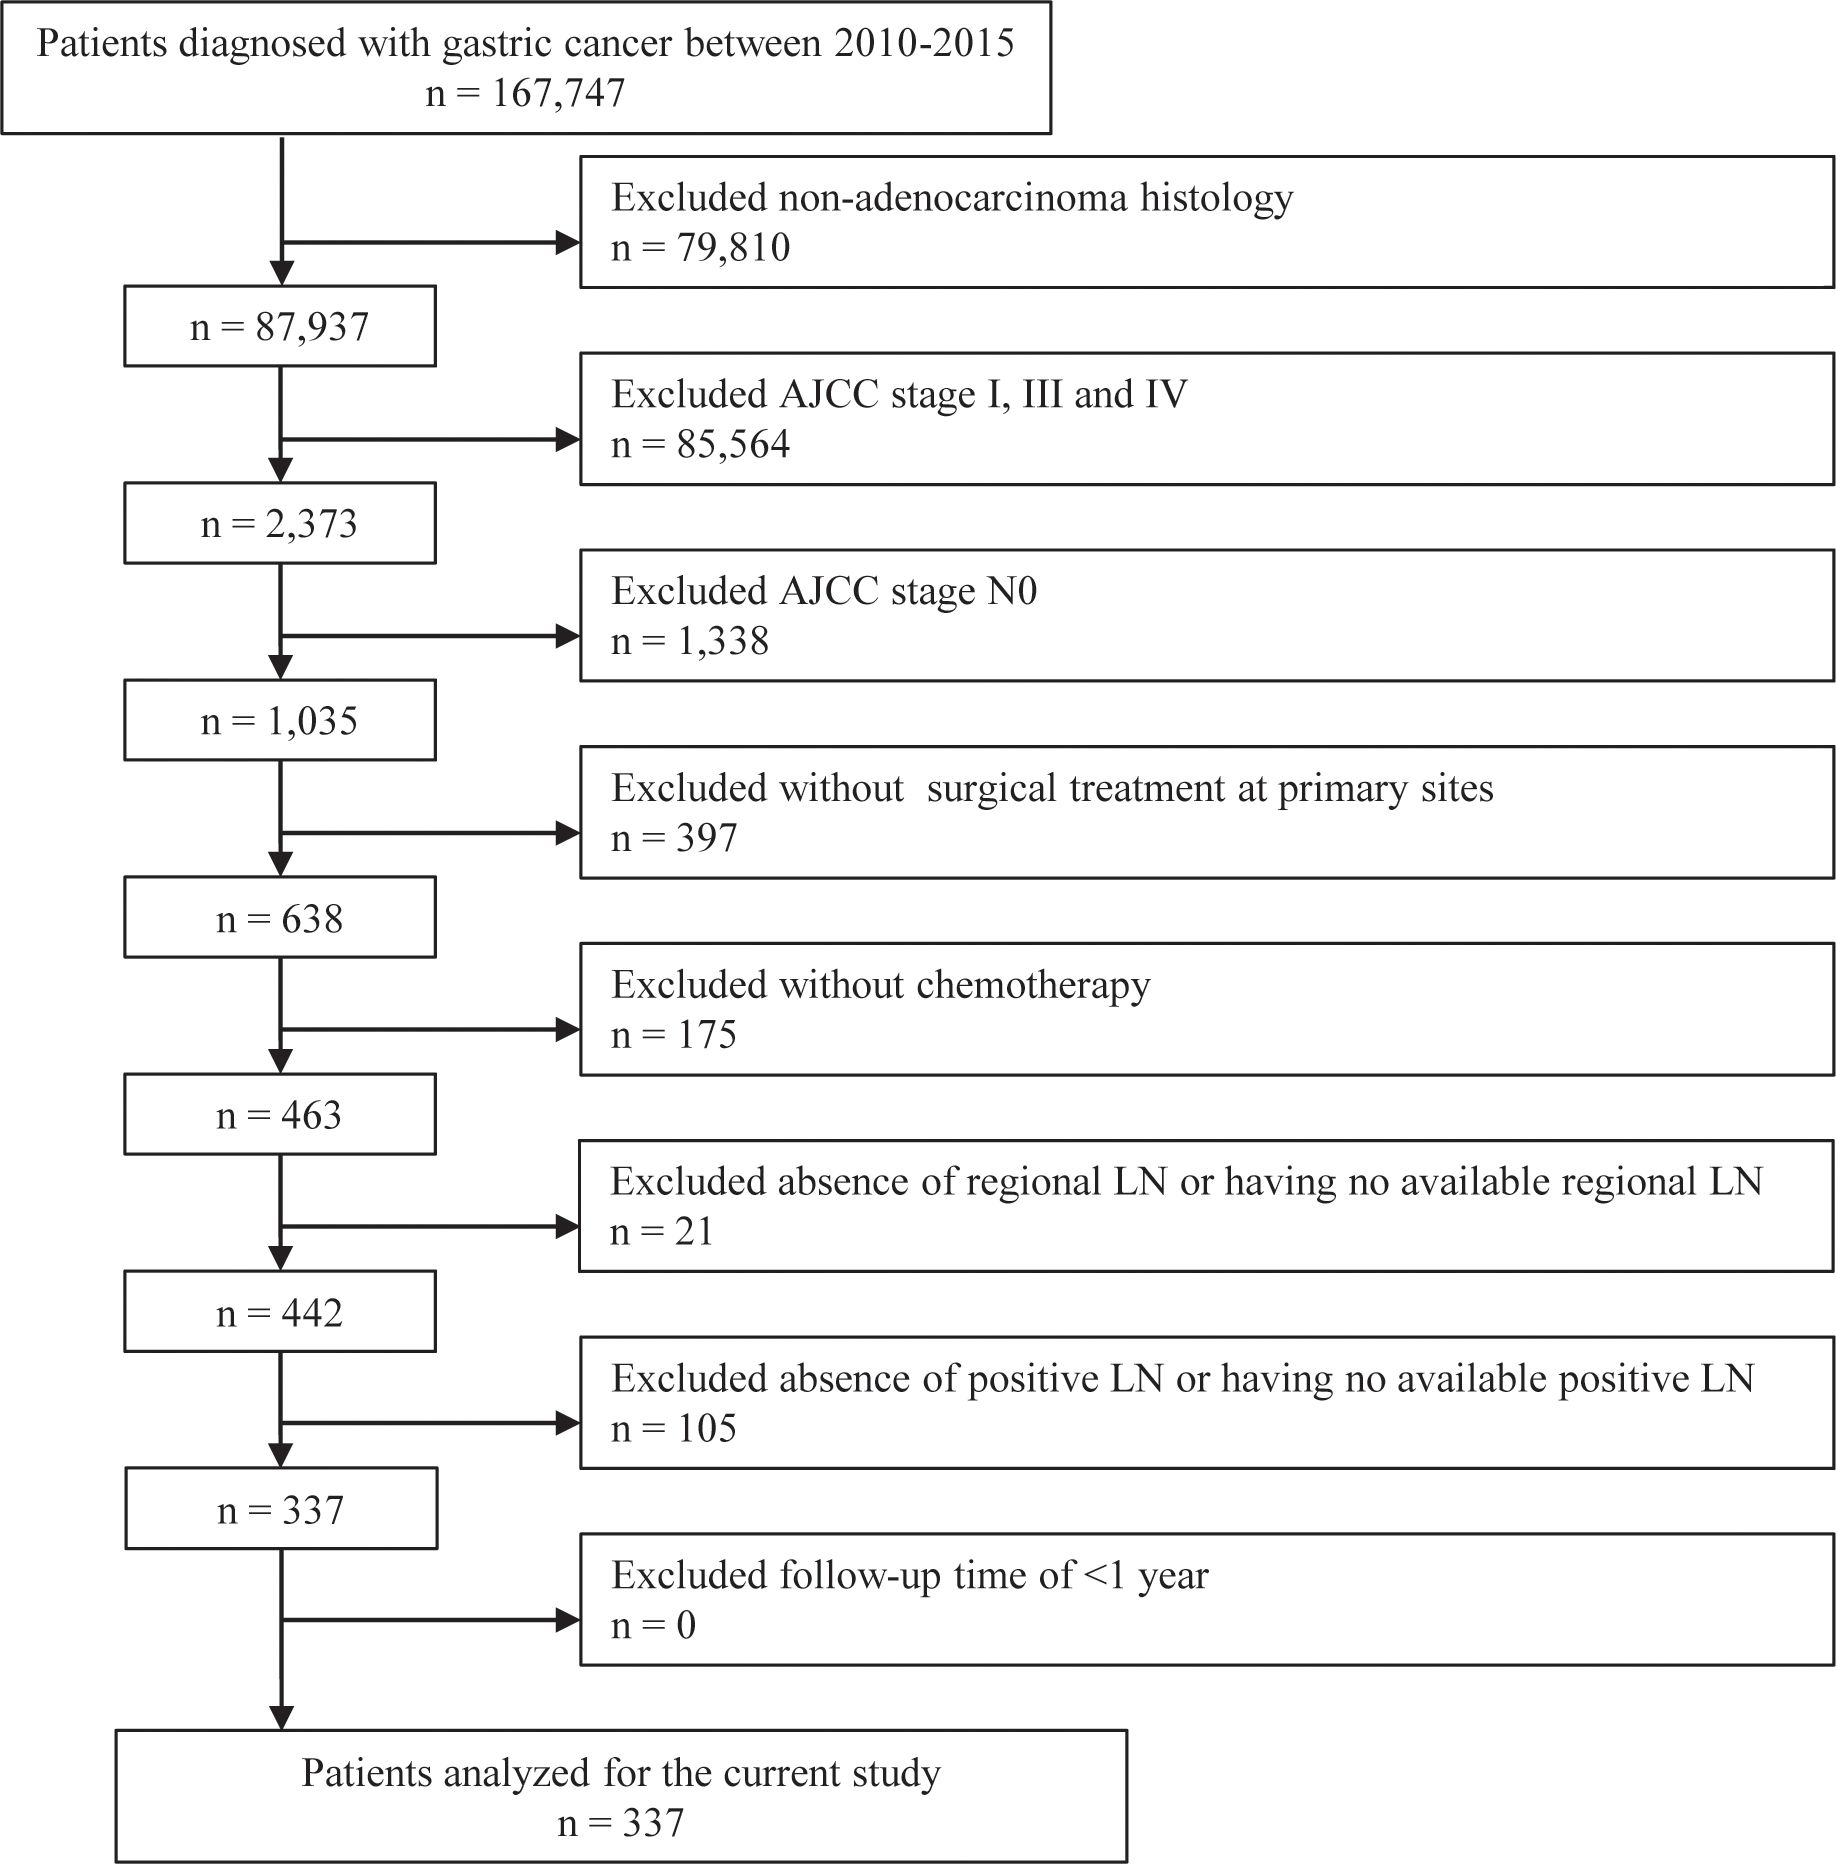
Figure 1. Flow diagram of patient selection. LN, lymph node.
2.2 Variables
We collected the following data for each patient: age at diagnosis (24–39, 40–59, or 60–88 years), sex (female or male), race (black, white, or other), marital status at the time of diagnosis (divorced/separated, married, single/unmarried, or widowed/other), year of diagnosis (2010, 2011, 2012, 2013, 2014, or 2015), AJCC stage (IIa or IIb according to the seventh AJCC staging system), T stage (T1, T2, or T3), N stage (N1 or N2–N3), radiotherapy (no/not available [NA] or yes), surgical procedure (proximal/distal gastrectomy [PG/DG], total gastrectomy [TG], or others), grade (I–II, III–IV, or unknown), multiple lesions (categorized as no or yes), prior malignancy history (categorized as no or yes), ELN (categorized as ≤ 16 or > 16), LNR (categorized as ≤ 0.1 or > 0.1), pN (categorized as pN1, pN2, or pN3, defined as the number of positive LNs [1–2, 3–6, or ≥ 7]), survival time, and survival outcome (alive, death from GC, death from non-GC causes, or censored). Alive was defined as survival until the end of follow-up. Death due to primary GC was defined as death from GC. Death due to non-GC causes and other secondary primary cancers was defined as death from non-GC causes. Other cases were censored.
2.3 Statistical analysis
Demographic and clinicopathological data were collected at baseline, classified as categorical data, described as frequencies and proportions, and then compared using χ2 test. ELN, LNR, and pN were described as median and interquartile ranges. Optimal cutoff values for ELN and LNR were determined using restricted cubic splines, and pN was divided into three groups based on the AJCC staging system for further analysis. OS and disease-specific survival (DSS) were assessed and plotted using Kaplan–Meier survival curves. Cox univariate and multivariate regression analyses were performed to identify the effects of ELN, LNR, and pN on OS and DSS, and hazard ratios (HRs) were reported with 95% confidence intervals (CIs). Competing risks of mortality were accommodated and plotted using cumulative incidence curves, while size effects were calculated using sub-distribution HRs (SHRs) with corresponding 95% CIs. A secondary analysis was conducted using the Fine and Gray regression method for competing risk analysis. In Cox regression model and CRM, we conducted a subgroup analysis to test the effects of ELN, LNR, and pN status on outcomes in each subgroup of covariates. Subsequently, interaction tests were conducted to evaluate the interactions between ELN, LNR, or pN and different subgroups. Statistical significance was defined as a two-sided P-value < 0.05. All statistical analyses were performed using R software version 4.1.1 (R Foundation for Statistical Computing, Vienna, Austria).
3 Results
3.1 Clinical characteristics
From 2010 to 2015, the data of 167,747 patients with GC were obtained from the SEER database. Among these patients, 167,410 were excluded due to the histological type, AJCC stage, surgery status, chemotherapy status, number of LNs, or survival times. Finally, 337 patients were included in subsequent analyses during a median follow-up period of 30 months. Among these patients, GC-specific death (GCSD group) occurred in 90 patients, non-GC-specific death (non-GCSD group) was observed in 44 patients, and 203 patients were alive at the end of follow-up (alive group). As shown in Table 1 for the CRM, the non-GCSD group included more patients diagnosed at 60–88 years of age (89%) than the GCSD (69%) and alive (65%) groups (P = 0.02). Statistically significant associations were observed for the year of diagnosis (P = 0.03). Moreover, patients in the non-GCSD group tended to have multiple lesions (59%) and prior malignancy history (57%) than those in the GCSD (6% and 0%) and alive (20% and 14%) groups (both P < 0.001). With respect to pathological LNs, the median ELN was higher in the alive group (18) than in the GCSD (14.5) and non-GCSD (12) groups (P < 0.001), whereas the median LNR was lower in the alive group (0.08) than in the GCSD (0.13) and non-GCSD (0.15) groups (P < 0.001). A comparison between the three groups revealed no significant differences in sex, race, marital status at diagnosis, AJCC stage, T stage, N stage, radiotherapy, surgical procedure, grade, and pN. Supplementary Table 1 presents the clinical characteristics of the normal model. In general, by comparing the death group to the alive group, significant differences were found in the year of diagnosis, ELN, and LNR (P < 0.05).
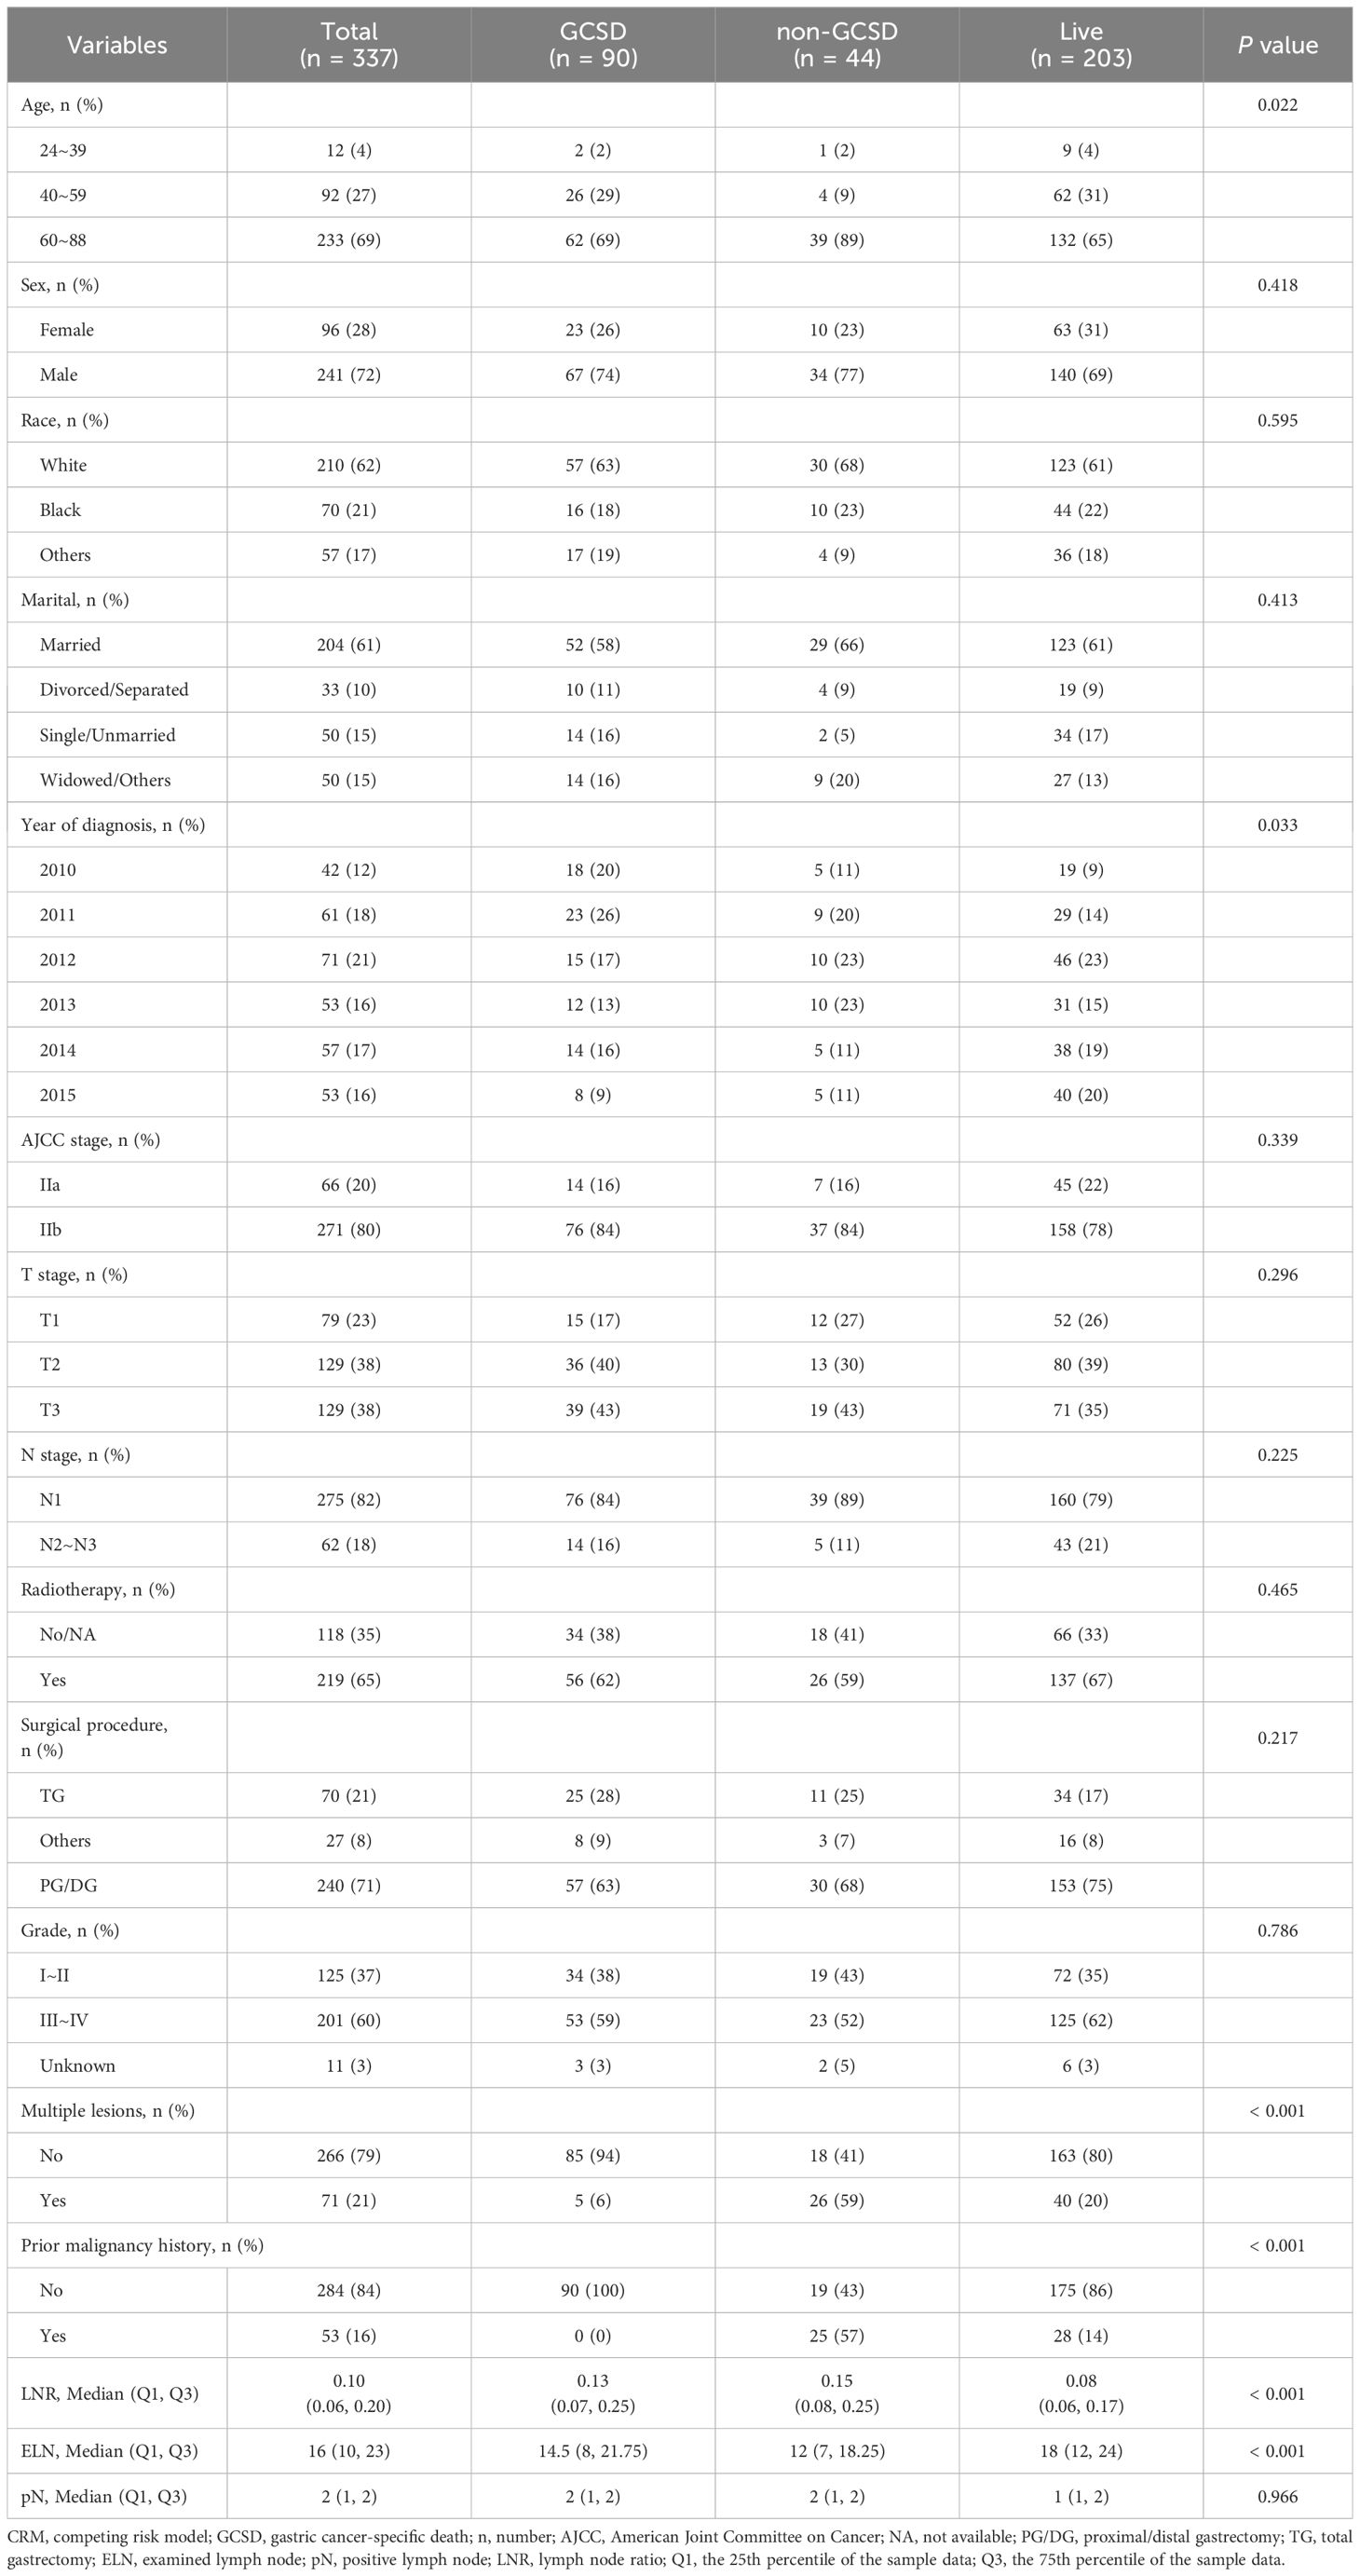
Table 1. Baseline clinicopathological characteristics of the enrolled patients for CRM.
3.2 Association between patient characteristics and outcomes using the normal model
Based on the restricted cubic splines, optimal cutoff values for ELN and LNR were 16 and 0.1 for further study (Figure 2). While pN was categorized as pN1, pN2, or pN3, defined as the number of positive LNs (1–2, 3–6, or ≥ 7) based on the AJCC staging system for further study. Figure 3, Supplementary Figures 1, 2 show Kaplan–Meier curves for OS and DSS in the normal model analysis and models stratified according to covariates, including age, sex, race, marital status at diagnosis, year of diagnosis, AJCC stage, T stage, N stage, radiotherapy, surgical procedure, grade, multiple lesions, prior malignancy history, ELN, pN, and LNR. As shown in Figures 3A, D, the patients with LN-positive stage II GC with LNR ≤ 0.1 had significantly superior OS and DSS compared to those with LNR > 0.1. As shown in Figure 3B, patients with an ELN > 16 had a significantly greater OS benefit than those with an ELN ≤ 16. The impact of pN on the OS of patients with LN-positive stage II GC varied extensively with different pN stages (Figure 3C). However, ELN > 16 and pN had no significant effect on DSS (Figures 2E, F). Regarding OS and DSS, similar findings were observed for patients with different surgical procedures and different years of diagnosis (Supplementary Figures 1, 2). Additionally, the results showed that age, race, sex, and marital status at the time of diagnosis had no significant impact on OS and DSS in patients with LN-positive stage II GC (Supplementary Figures 1, 2).
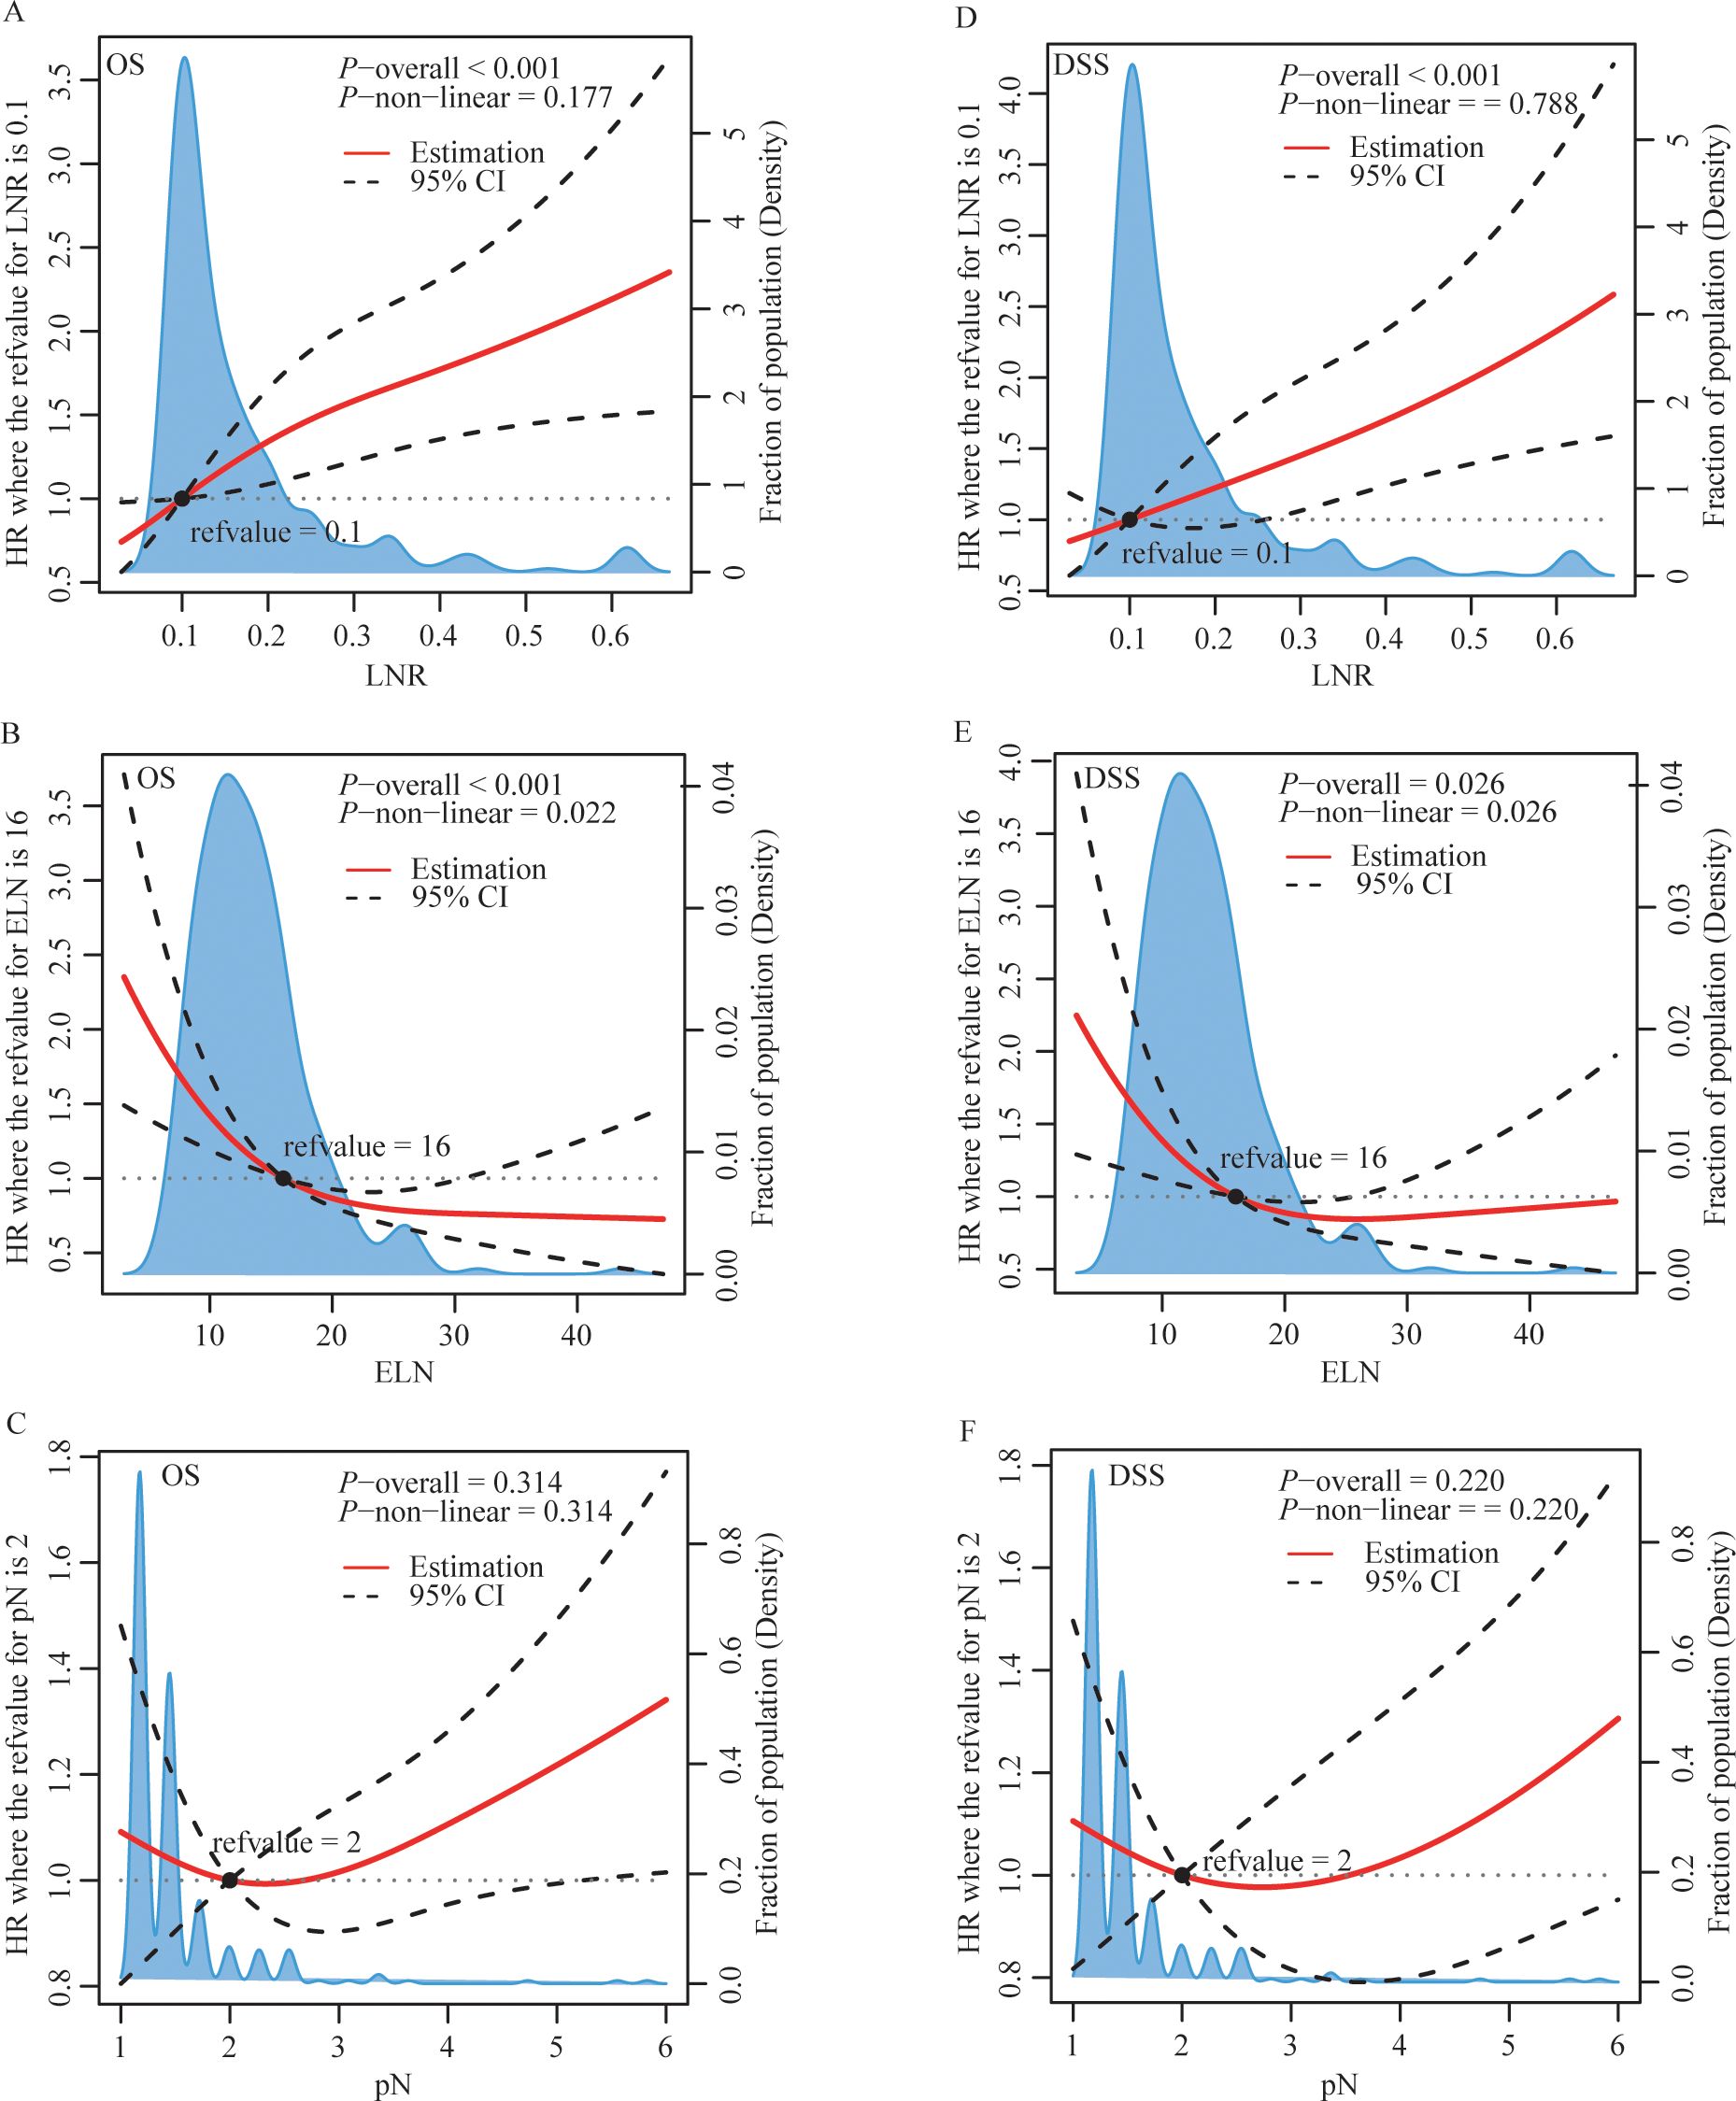
Figure 2. | Restricted cubic splines of LNR (A, D), ELN (B, E) and pN (C, F) for OS (A-C) and DSS (D-F). HR, hazard ratio; CI, confidence interval; LNR, lymph node ratio; ELN, examined lymph node; pN, positive lymph node.
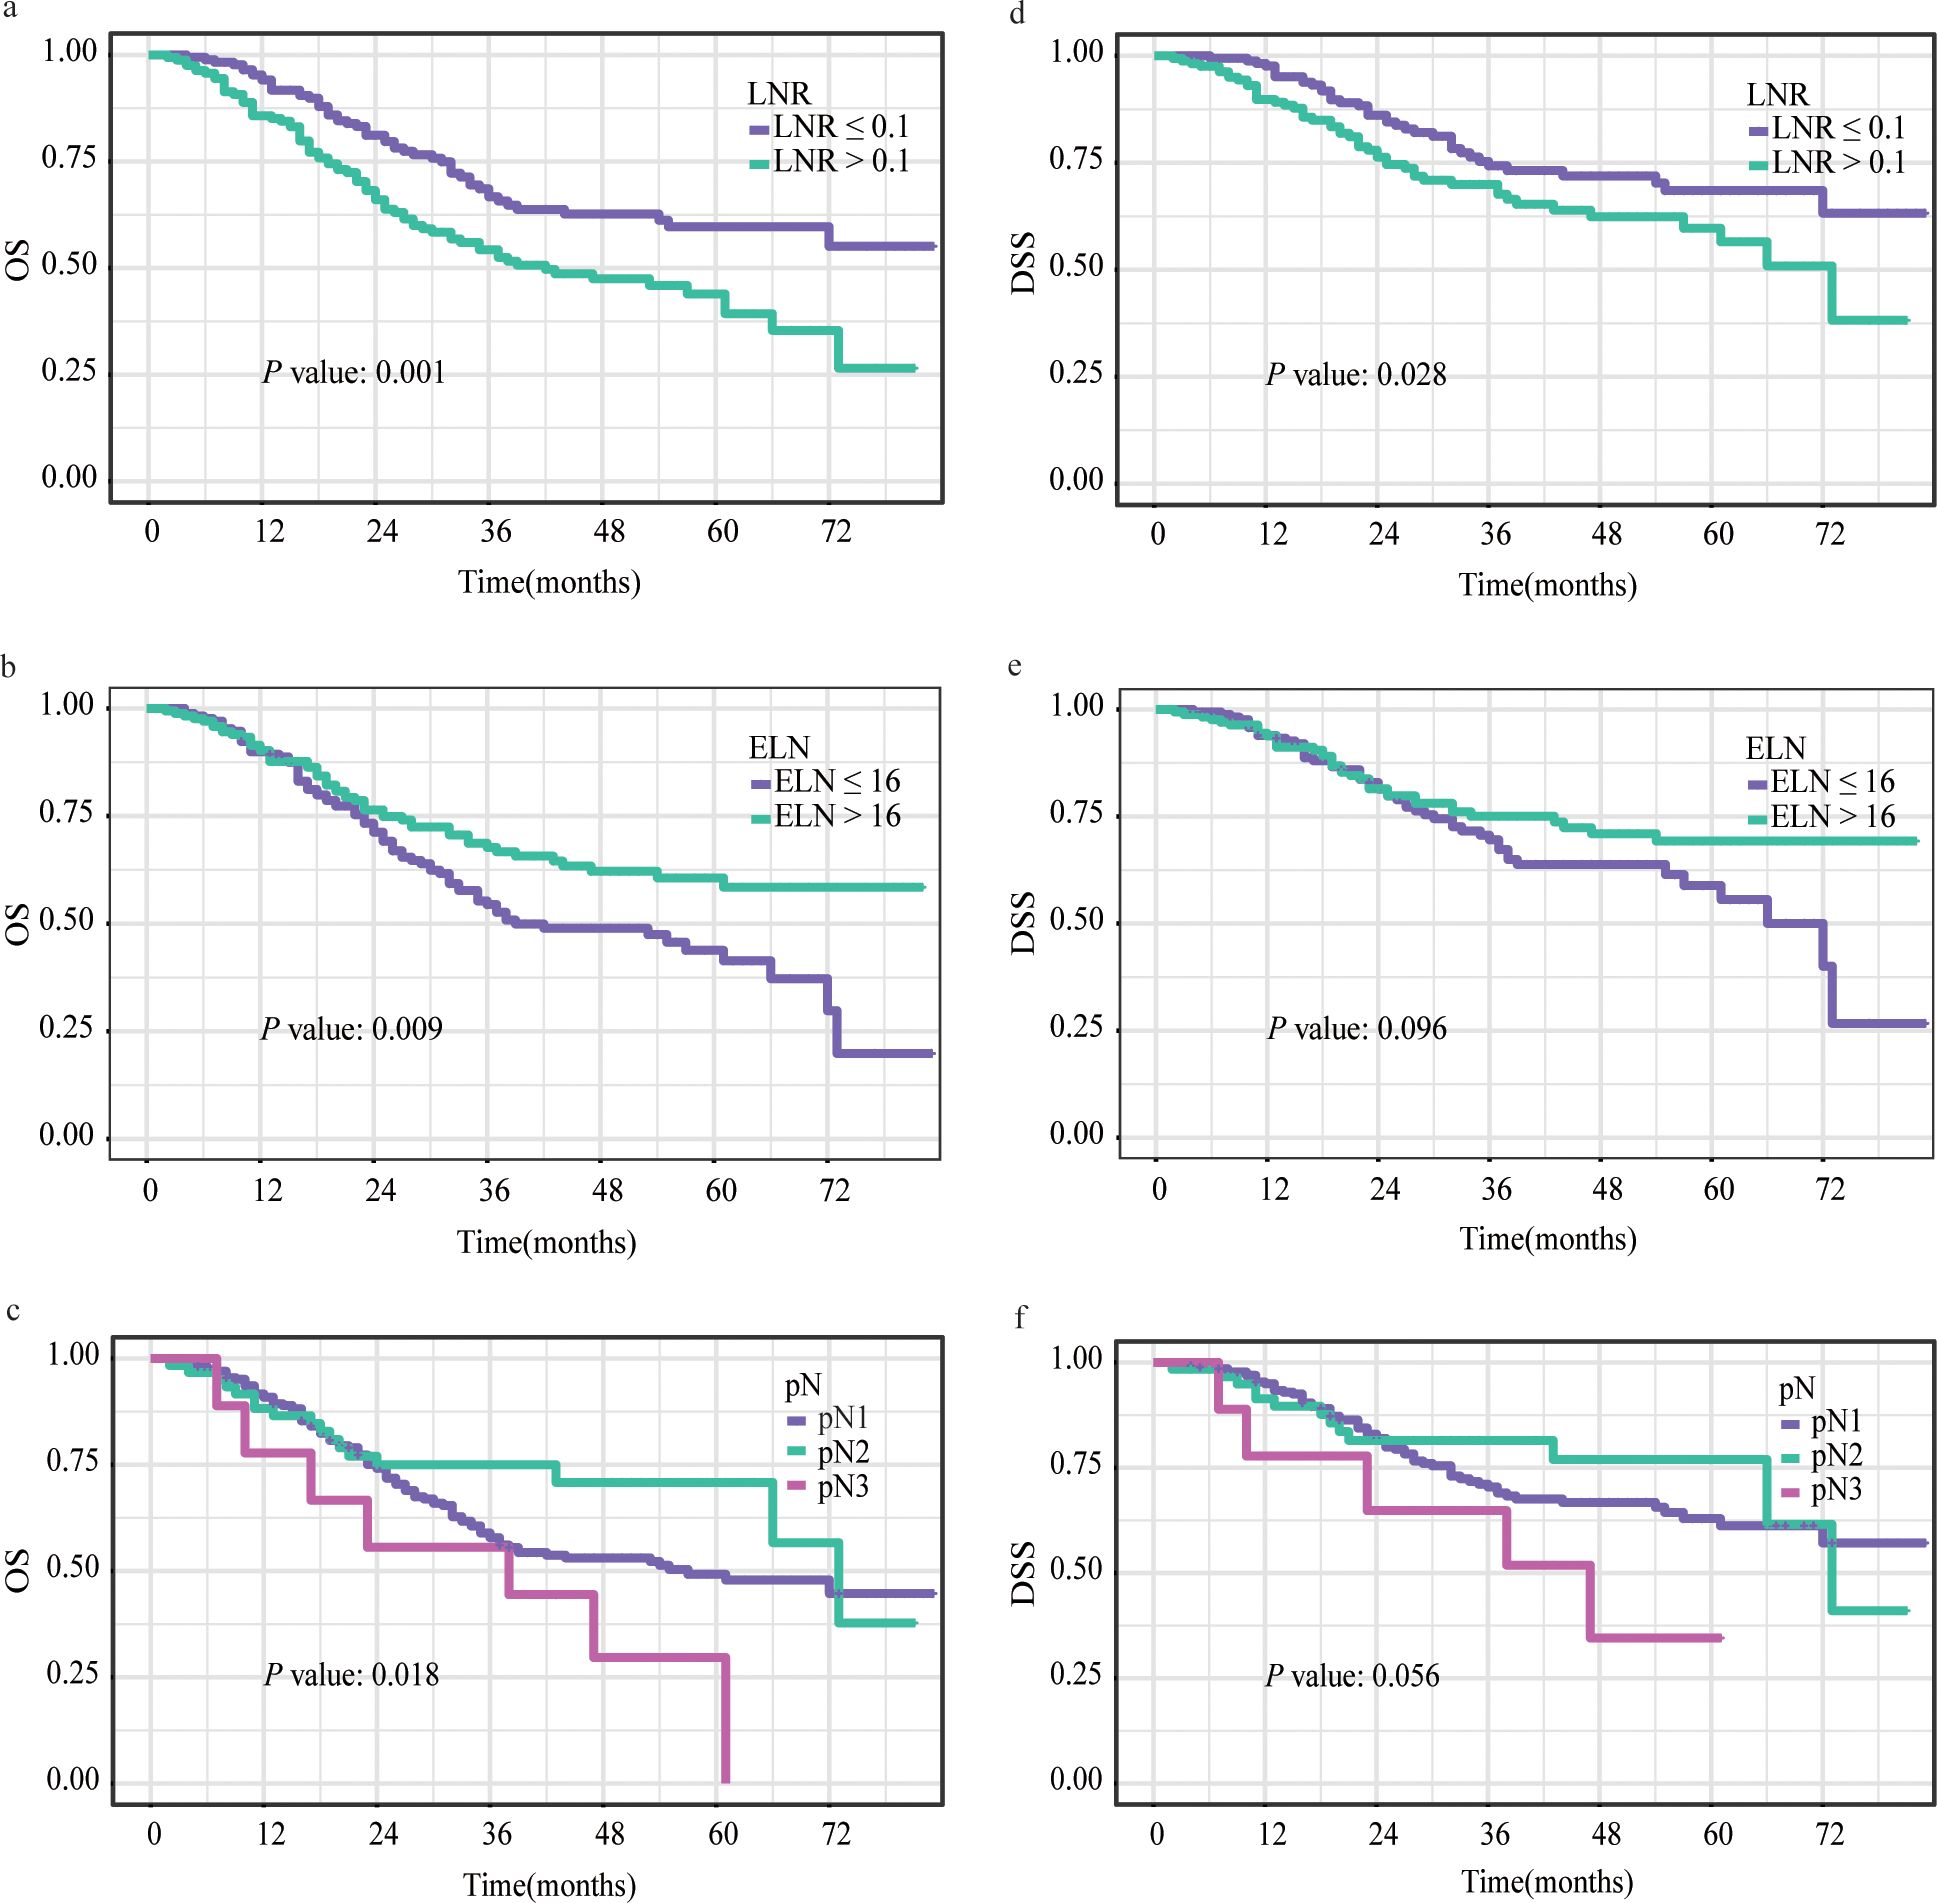
Figure 3. Kaplan–Meier survival curves for OS (A-C) and DSS (D-F) stratified by LNR (A, D), ELN (B, E) and pN (C, F). OS, overall survival; DSS, disease-specific survival; LNR, lymph node ratio; ELN, examined lymph node; pN, positive lymph node.
We subsequently performed Cox univariate and multivariate regression analyses to explore the prognostic factors for patients with LN-positive stage II GC. In univariate Cox regression analysis, compared to ELN ≥ 16, ELN <16 showed a significant correlation with OS (HR = 0.63, 95% CI: 0.45-0.90, P = 0.01); however, there was no significant association with DSS (HR = 0.70, 95% CI: 0.46-1.07, P = 0.10). Patients with LNR > 0.1 had worse OS (HR = 1.79, 95% CI: 1.27-2.53, P < 0.001) and DSS (HR = 1.59, 95% CI: 1.05-2.42, P = 0.03) than those with LNR ≤ 0.1. In contrast, compared to pN1, neither pN2 nor pN3 had a statistical relationship with OS or DSS (both P > 0.05) (Tables 2, 3).
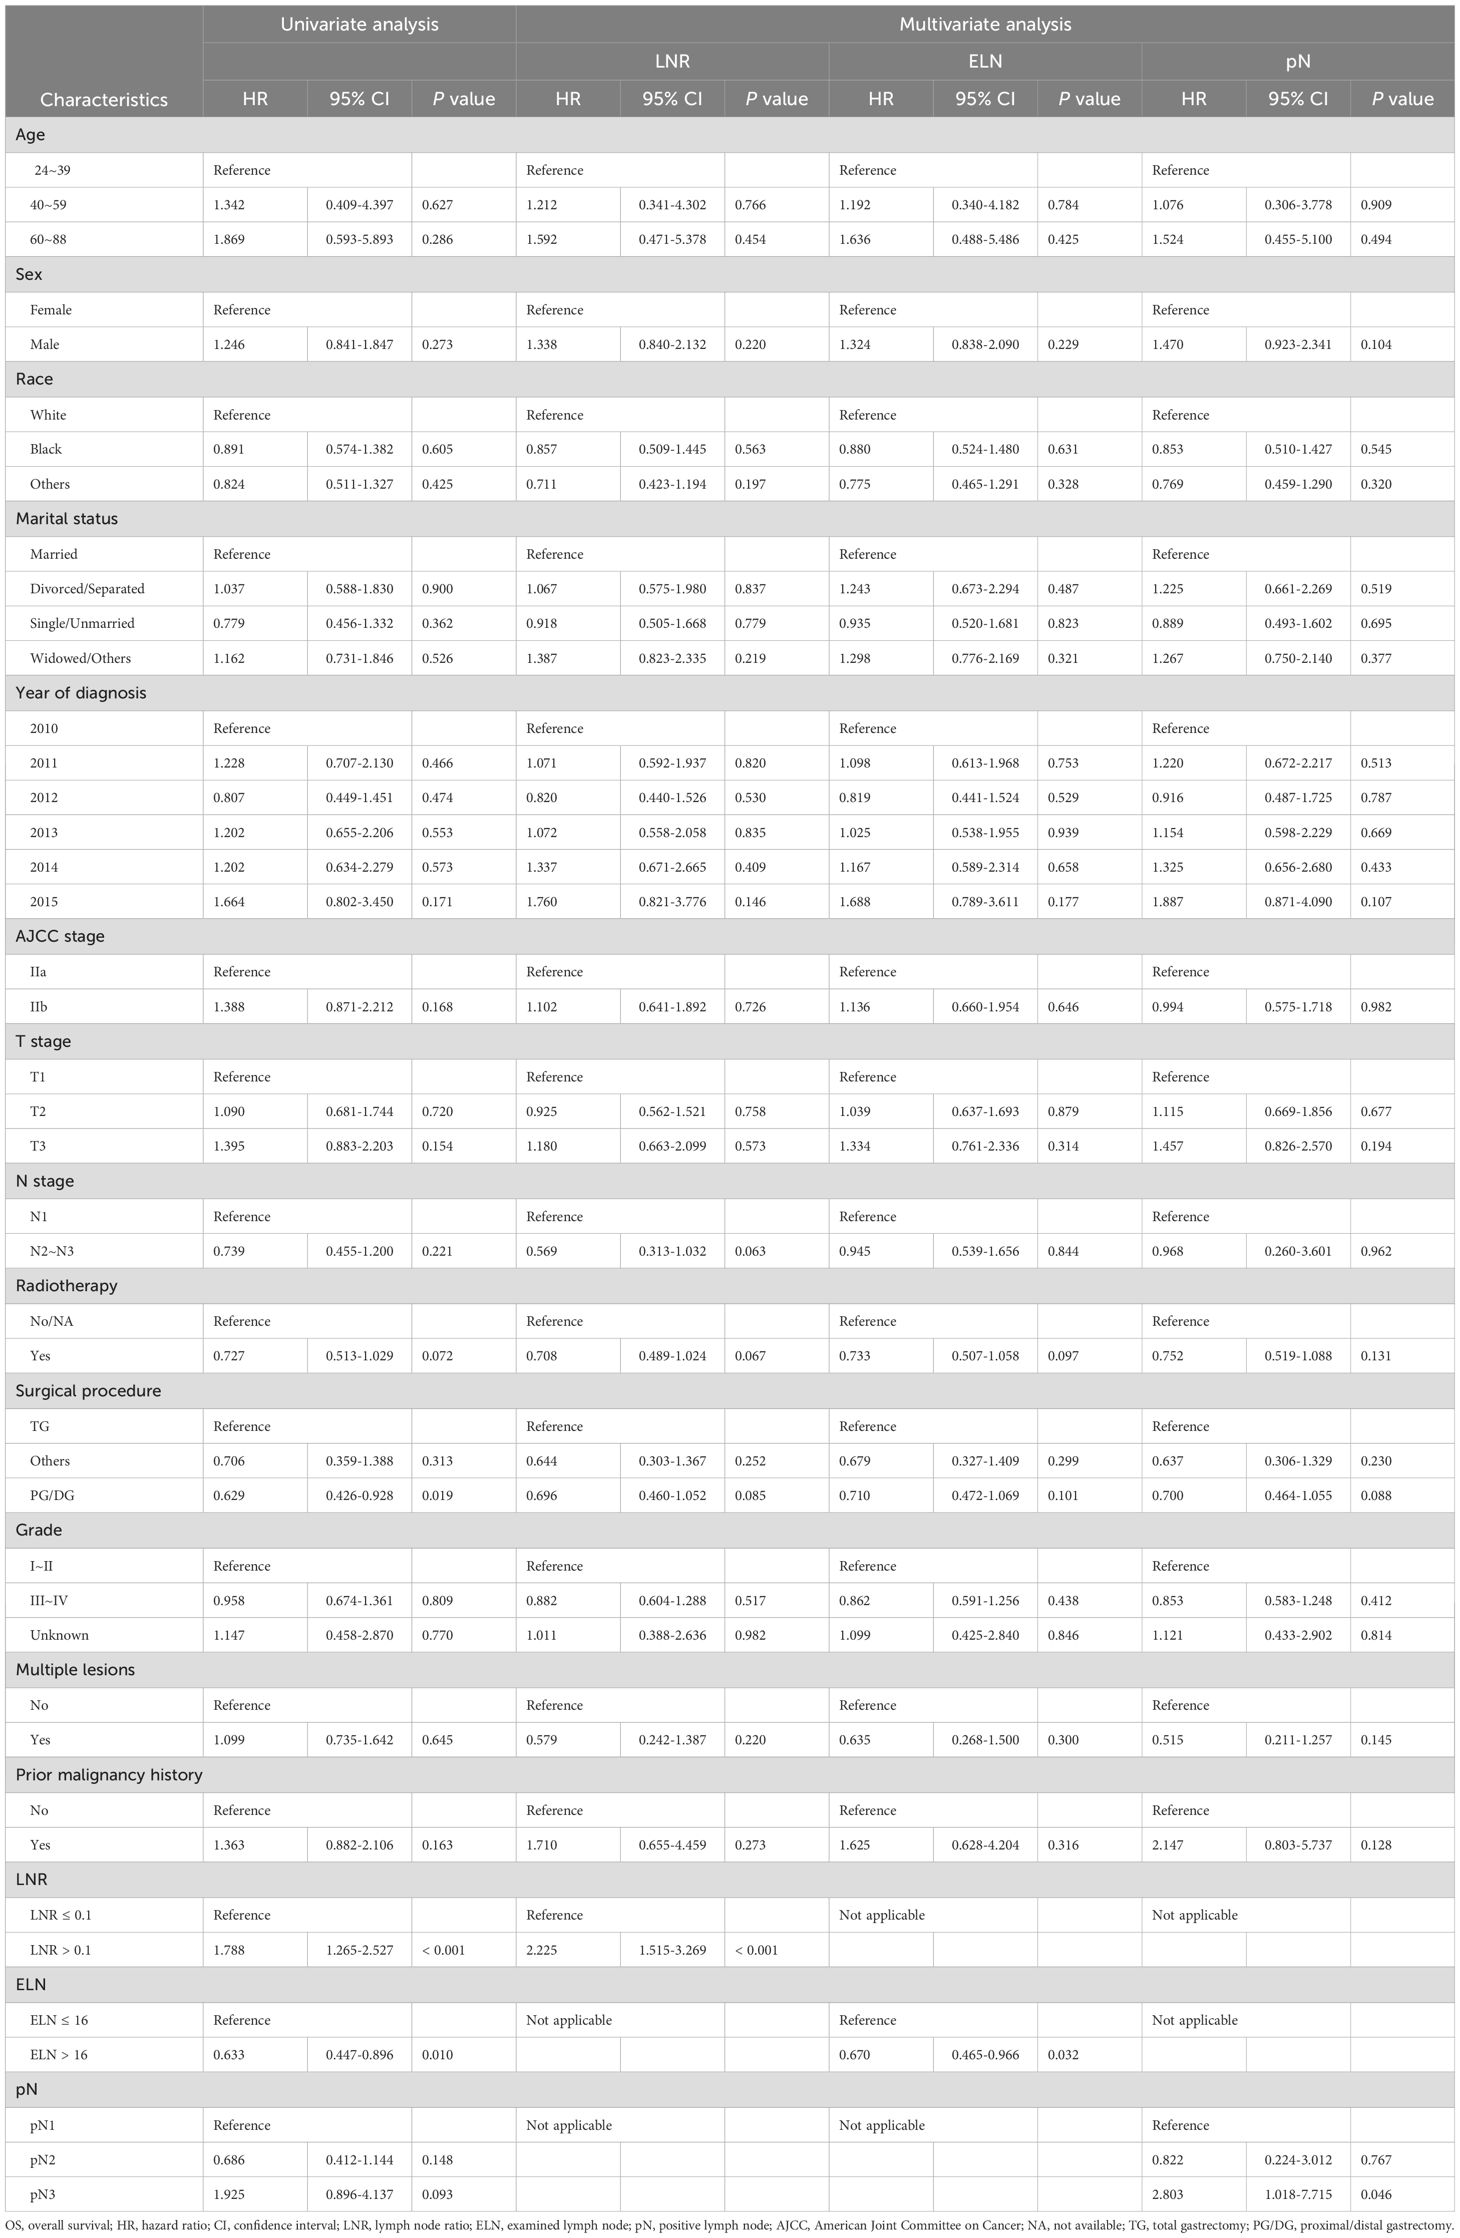
Table 2. Cox univariate and multivariate regression analyses of clinicopathological characteristics associated with OS.
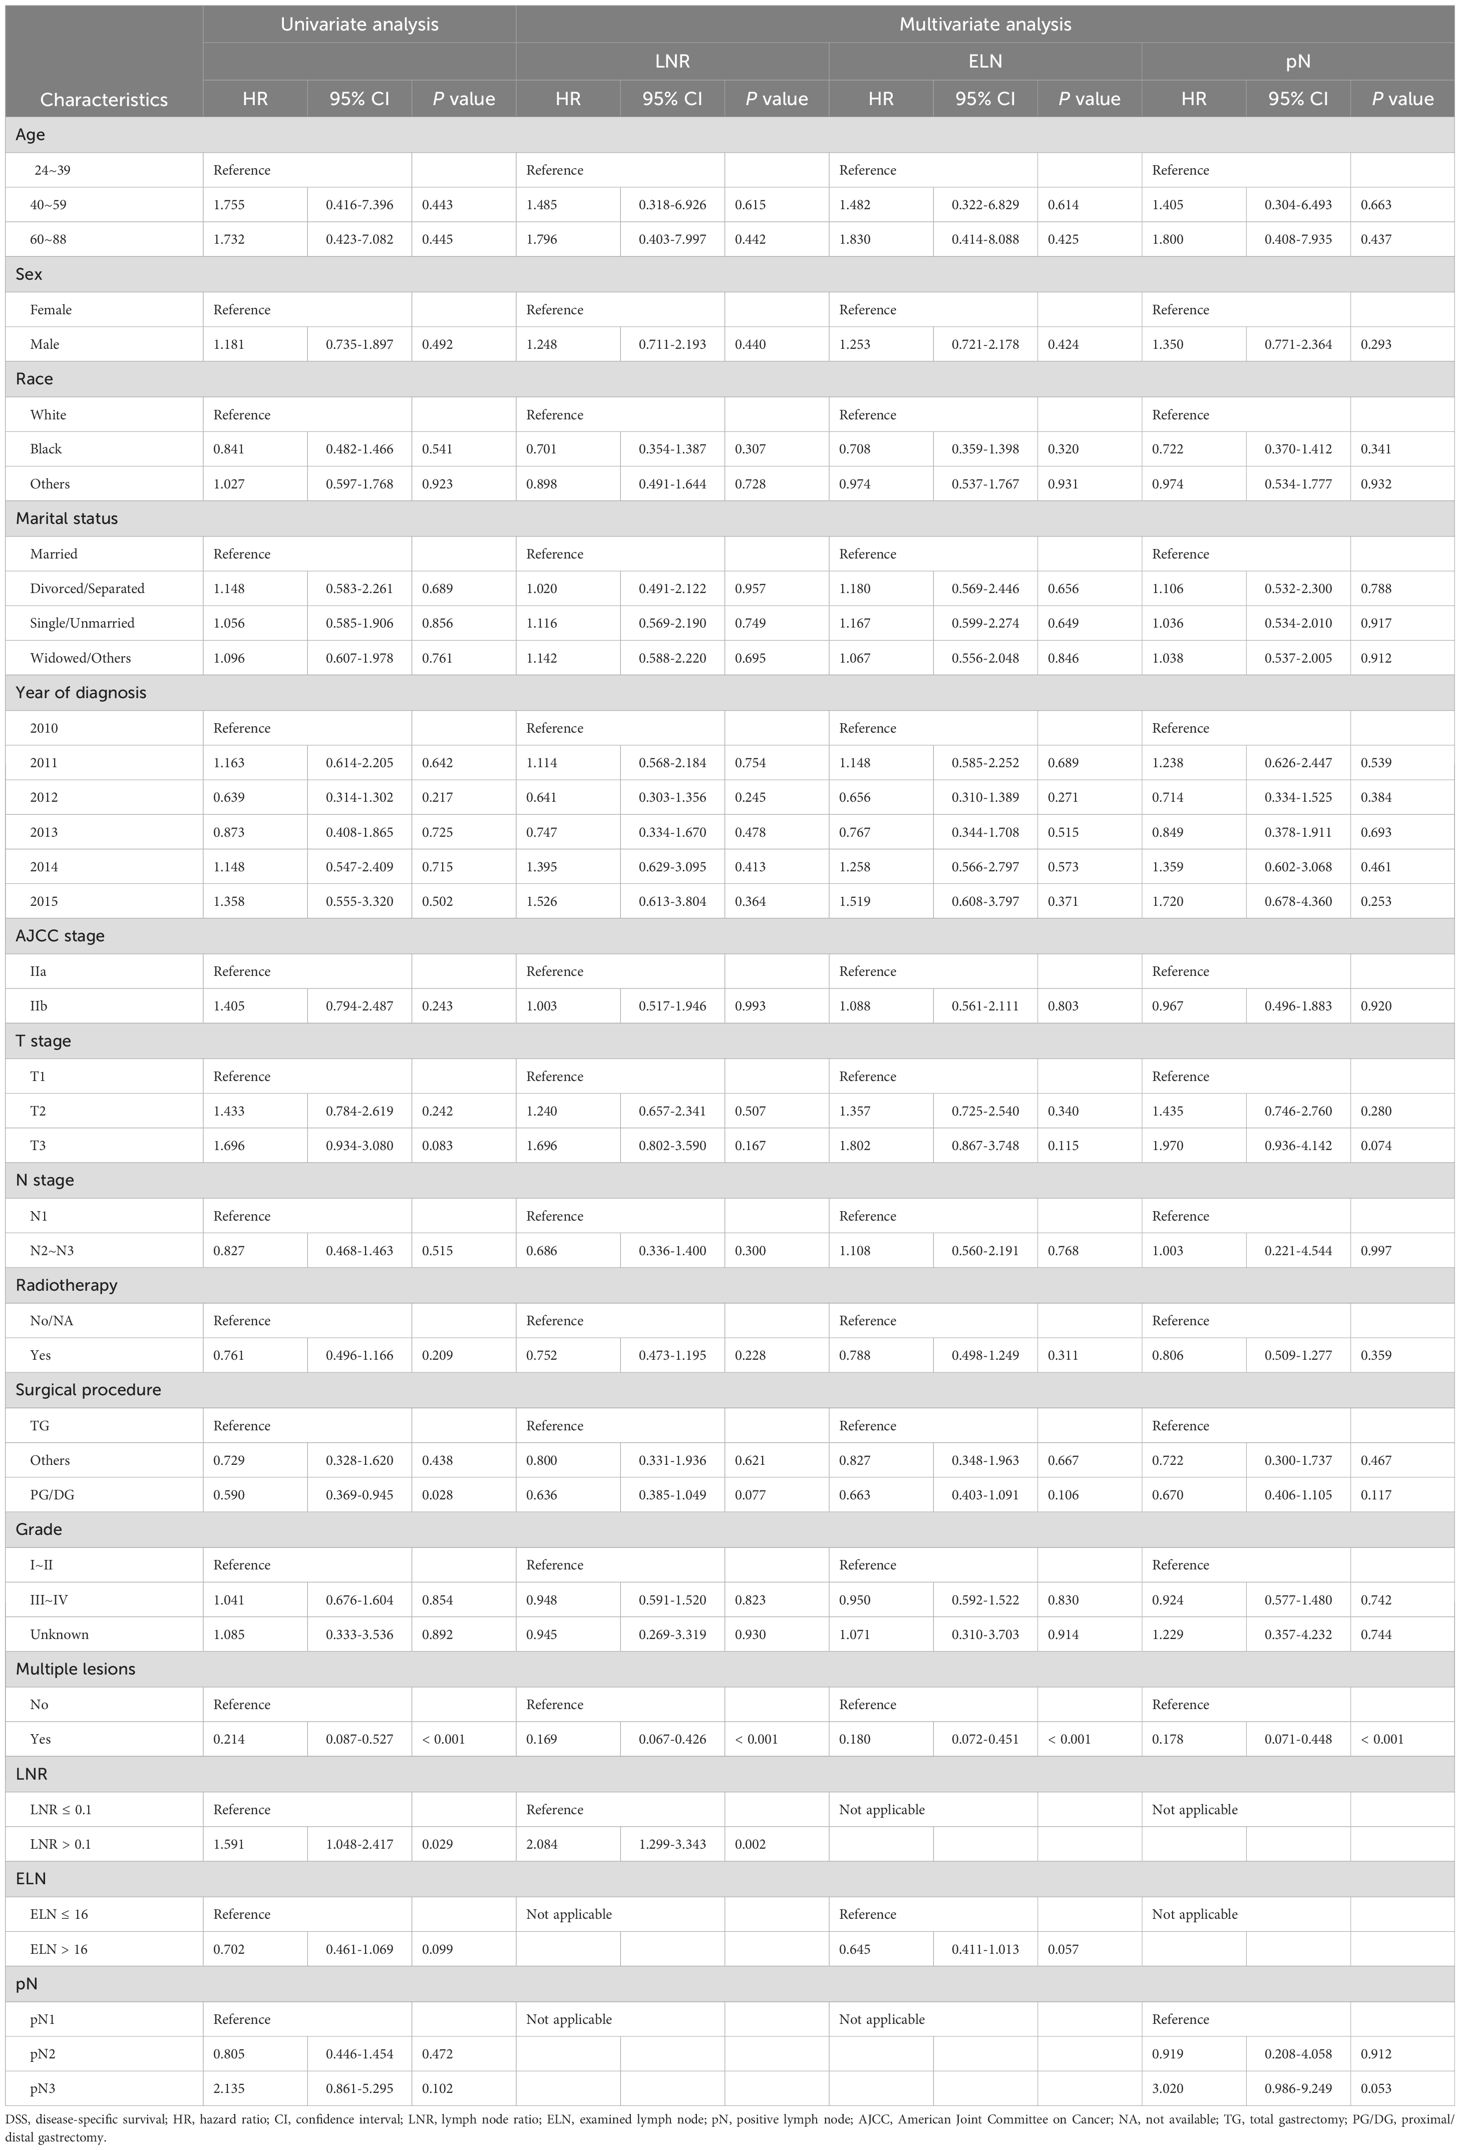
Table 3. Cox univariate and multivariate regression analyses of clinicopathological characteristics associated with DSS.
As indicated by the results of multivariate Cox regression analysis, LNR > 0.1 was an independent factor for shorter OS (HR = 2.23, 95% CI: 1.52-3.27, P < 0.001) and DSS (HR = 2.08, 95% CI: 1.30-3.34, P = 0.002), whereas ELN > 16 was independently associated with better OS (HR = 0.67, 95% CI: 0.47-0.97, P = 0.03); however, there was no significant difference in DSS (HR = 0.65, 95% CI: 0.41-1.01, P = 0.06). Compared to patients with pN1, those with pN3 had worse OS (HR = 2.80, 95% CI: 1.02-7.72, P = 0.046) but did not show a relationship with DSS (HR = 3.02, 95% CI: 0.99-9.25, P = 0.05). Detailed information on the univariate and multivariate regression analyses for OS and DSS is presented in Tables 2, 3.
We then conducted subgroup analyses and interaction tests to evaluate the relationship of the LN status with the OS and DSS in various subgroups in patients with LN-positive stage II GC. The subgroup analysis revealed that in the male subgroup (sex variable), ELN > 16 had a protective effect on OS (HR = 0.62, 95% CI: 0.41-0.94, P = 0.02), whereas LNR > 0.1 (HR = 1.98, 95% CI: 1.32-2.97, P < 0.001) and pN3 (HR = 2.89, 95% CI: 1.17-7.11, P = 0.02) showed the opposite effect. In contrast, neither ELN > 16, LNR > 0.1, nor pN3 were significantly associated with OS in the female subgroup (Supplementary Table 2).
As presented in Supplementary Tables 2, 3, LNR > 0.1 showed decreased OS for stages T1 (HR = 2.34, 95% CI: 1.04-5.24, P = 0.04) and T3 (HR = 2.13, 95% CI: 1.26-3.62, P = 0.005) but not stage T2. LNR > 0.1 showed a decreased DSS (HR = 3.29, 95% CI: 1.03-10.47, P = 0.04) for the stage T1 subtype but not stages T2 and T3. Regarding the different ELN and pN groups, no significant difference in OS or DSS was observed for each T stage subgroup.
The tests for interactions were not significant in the subgroup analysis, except for the ELN in the single/unmarried subgroup for OS (HR = 0.31, 95% CI: 0.10-0.97, P = 0.045) and the LNR in the year of diagnosis in the 2013 subgroup for OS (HR = 0.25, 95% CI: 0.07-0.84, P = 0.03) (Supplementary Tables 2, 3).
3.3 Association between patient characteristics and outcomes using the competing risk model
A CRM was used to further investigate the association between patient characteristics and outcomes of patients with LN-positive stage II GC according to the risk of GCSD relative to overall mortality.
The cumulative incidence curves for all variables are shown in Figure 4 and Supplementary Figure 3. Patients with LNR > 0.1 had more non-GCSD than those with LNR ≤ 0.1 (P = 0.02), but the cumulative incidences of GCSD were not significantly different (P = 0.072). There was a higher cumulative incidence of non-GCSD in patients with ELN ≤ 16 than in those with ELN > 16 (P = 0.04); however, the cumulative incidences of GCSD were not significantly different (P = 0.18). No statistically significant differences were detected for pN in the cumulative incidence of either GCSD or non-GCSD.
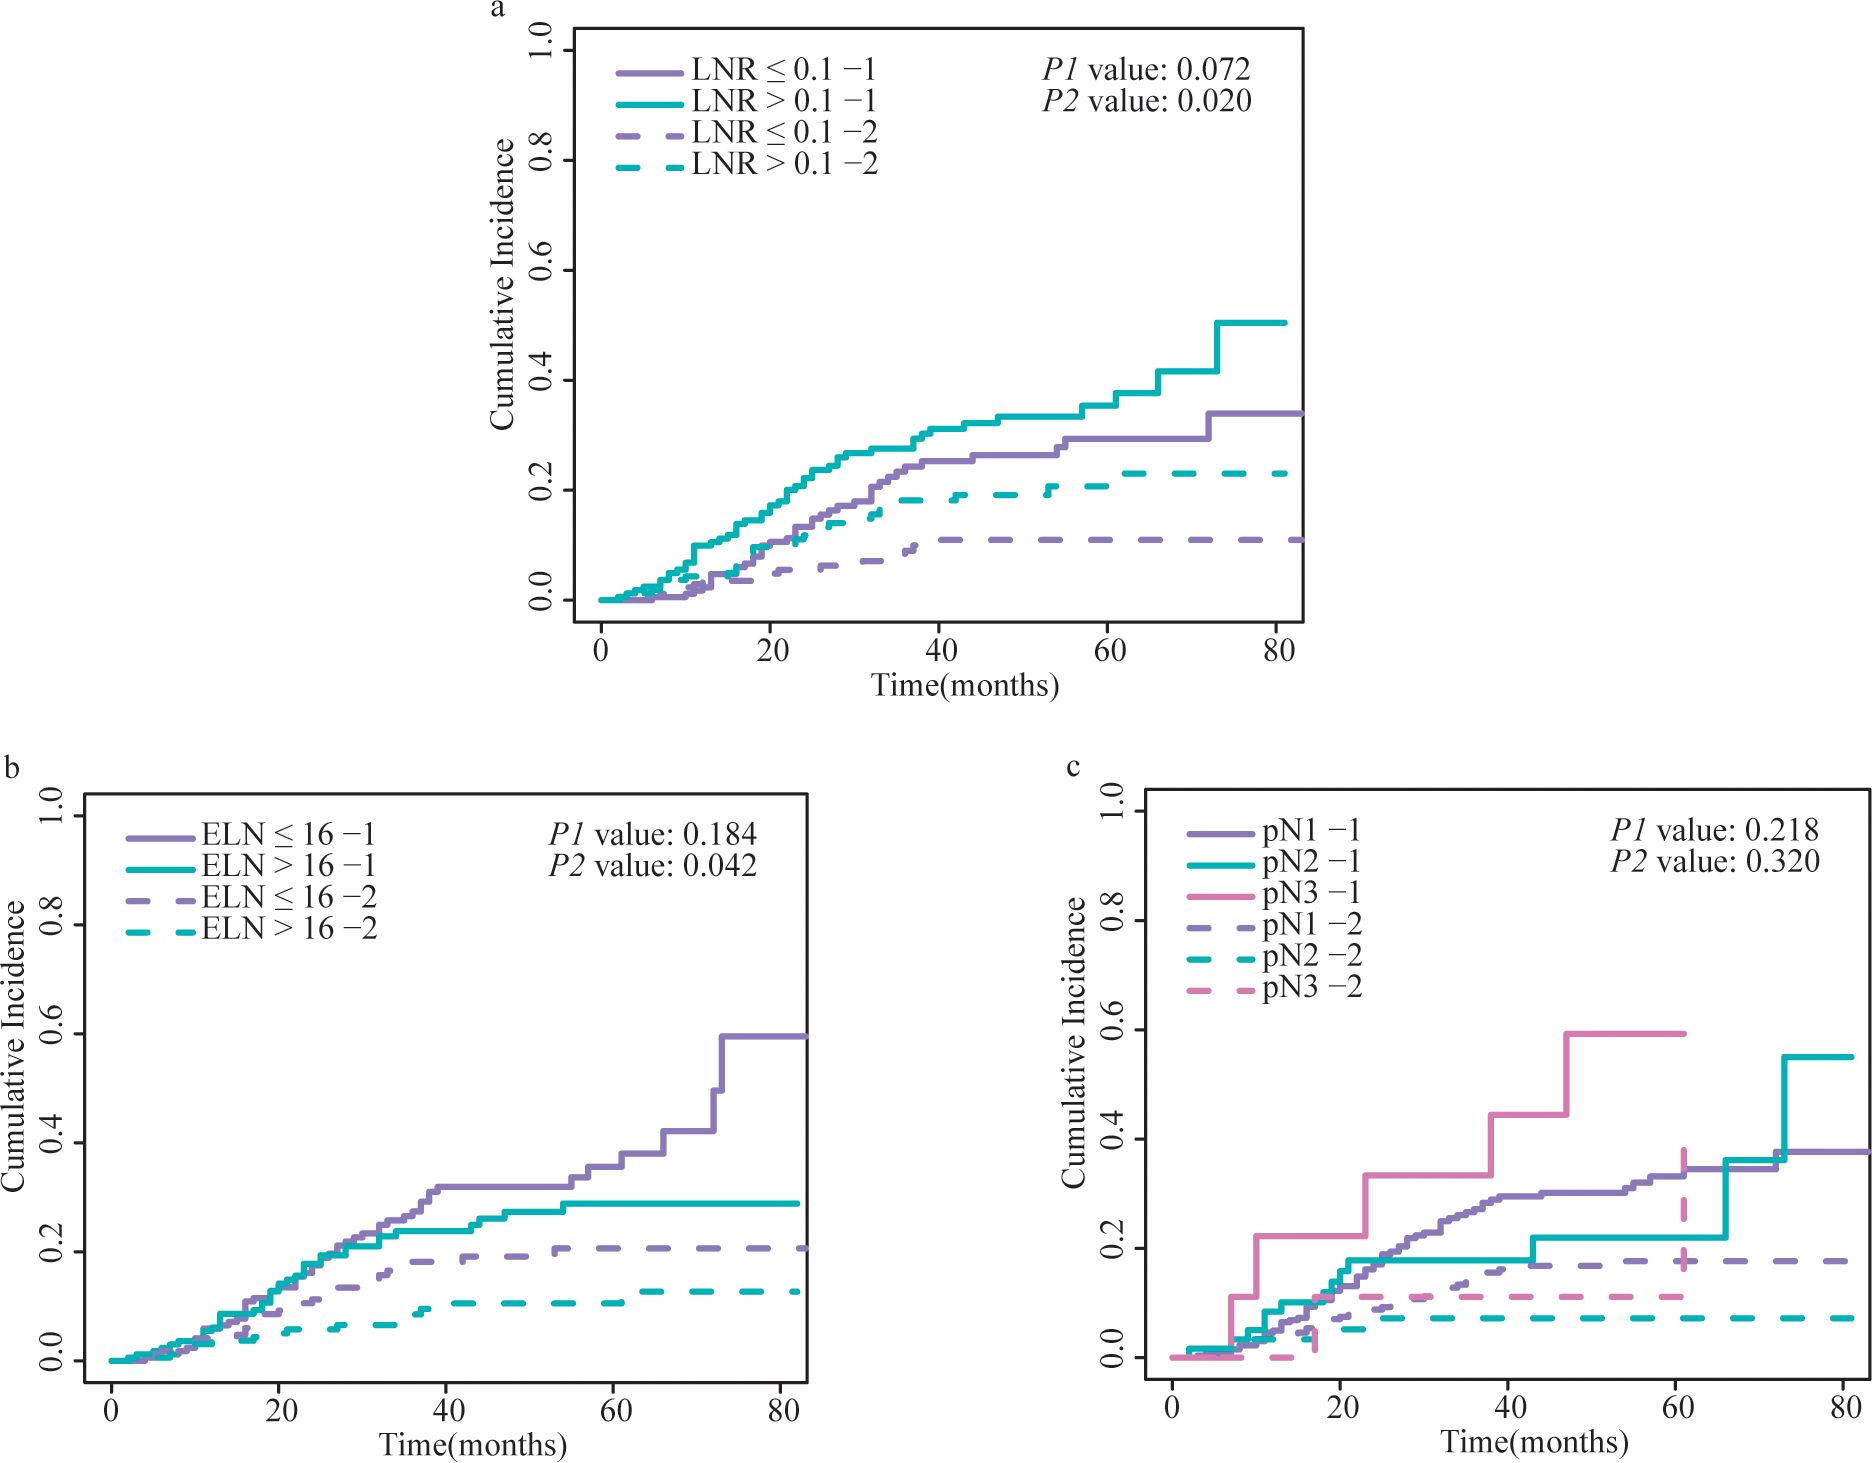
Figure 4. Cumulative incidence of GCSD and non-GCSD stratified by (A) LNR, (B) ELN and (C) pN. The P1 value represents the statistical result of comparing the cumulative incidence curves of GCSD between different groups using the Fine and Gray competing risks model. The P2 value represents the comparison of cumulative incidence curves for non-GCSD between different groups. GCSD, gastric cancer-specific death; LNR, lymph node ratio; ELN, examined lymph node; pN, positive lymph node.
We then performed a Fine and Gray regression analysis to explore the prognostic factors for patients with LN-positive stage II GC in a competing risk regression model.
Based on the results of the multivariate analysis, LNR > 0.1 was identified as an independent factor for shorter DSS (SHR = 1.89, 95% CI: 1.17-3.05, P = 0.001), whereas pN3 was independently associated with a lower DSS risk (SHR = 2.80, 95% CI: 1.31-5.97, P = 0.01). Compared with patients with ELN ≤ 16, those with ELN > 16 showed no relationship with DSS (SHR = 0.68, 95% CI: 0.42-1.10, P = 0.11).
Detailed information regarding the competing risk regression analysis for DSS is presented in Table 4.
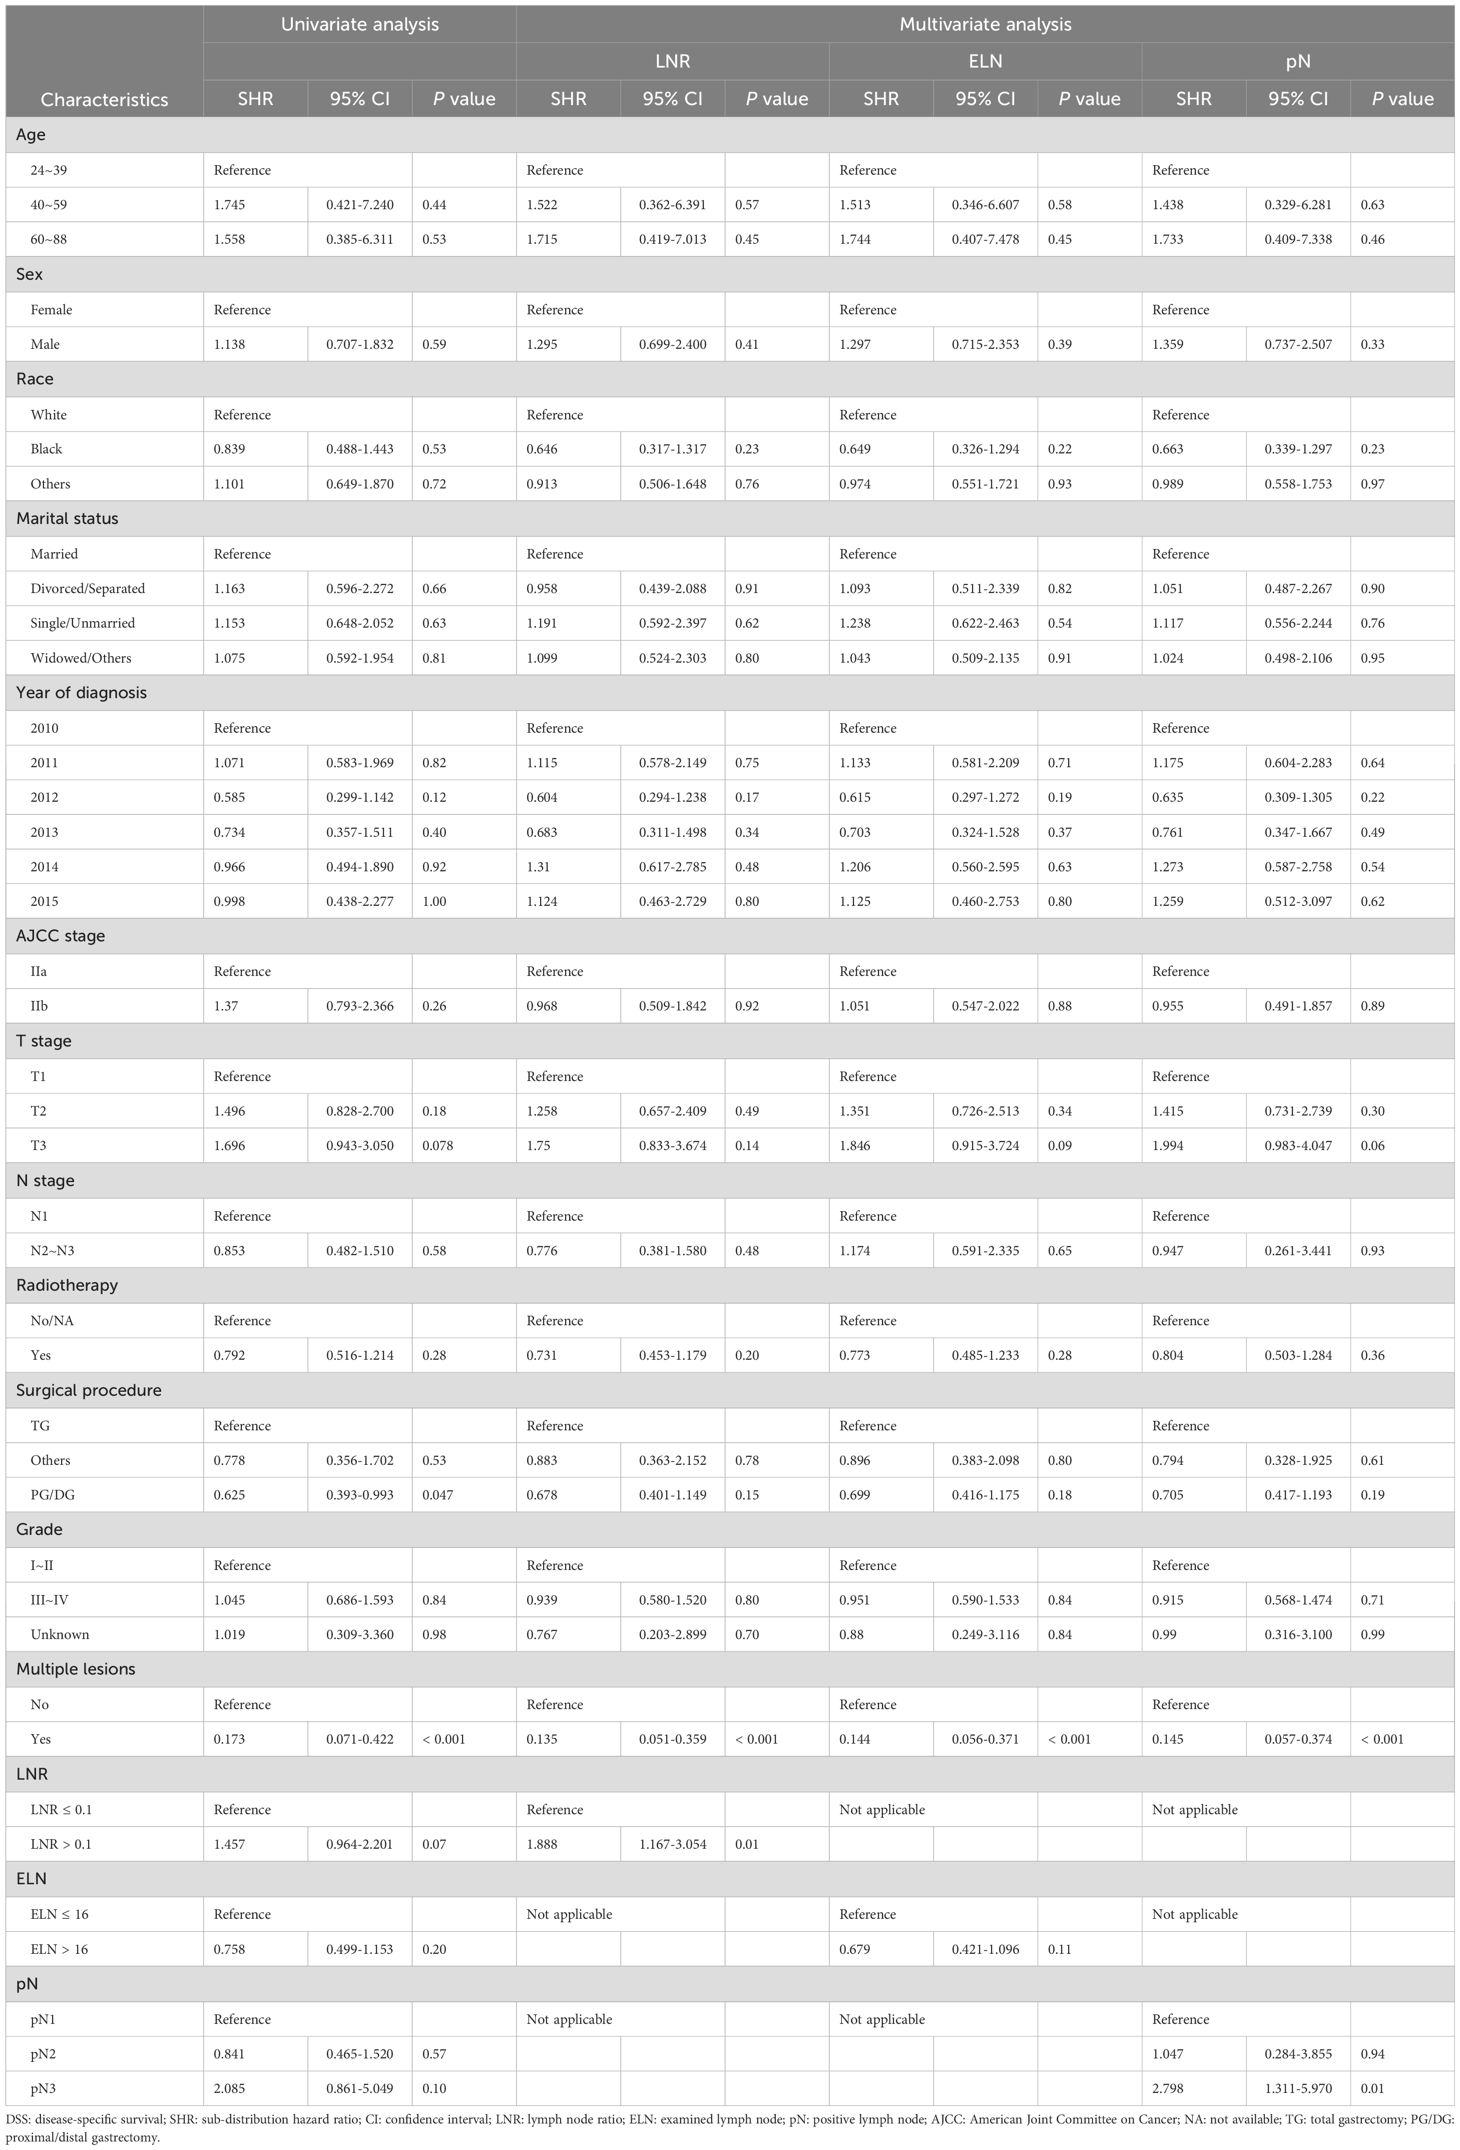
Table 4. Univariate and multivariate competing risk analyses of clinicopathological characteristics associated with DSS.
We subsequently conducted subgroup analyses and interaction tests to determine the correlation between LN status and DSS in patients with LN-positive stage II GC within various subgroups in the competing risk regression model. The subgroup analysis revealed that in the male subgroup (sex variable), LNR > 0.1 had an adverse effect on DSS (SHR = 1.71, 95% CI: 1.05-2.77, P = 0.03), and pN3 showed a similar effect (SHR = 3.18, 95% CI: 1.13-8.97, P = 0.03). Neither ELN > 16, LNR > 0.1, nor pN3 were significantly associated with DSS in the female subgroup (Supplementary Table 4).
4 Discussion
In this large retrospective study, we focused on the LN status (particularly ELN, LNR, and pN) in patients with LN-positive stage II GC undergoing resection and chemotherapy. This study had three main findings. First, the ELN, LNR, and pN were all independently associated with OS, and only LNR was independently associated with DSS. Second, when adjusted for the CRM, the LNR and pN maintained prognostic value beyond ELN. Third, the prognostic value of pN for DSS was likely to be influenced by death from other causes (competing events). LNR, in contrast, demonstrated stronger robustness in predicting DSS for patients with LN-positive stage II GC than ELN and pN. Thus, LNR may serve as a reliable and useful prognostic factor in patients with GC.
Using multivariate Cox analysis, we confirmed that pN3 was independently associated with poor OS, but not DSS. However, we found that pN3 was a prognostic factor for DSS when the competing risks were considered. Currently, the TNM classification is the most widely used staging system worldwide to predict prognosis and guide treatment strategies. pN stage is one of the most important prognostic indicators in patients with GC. A previous study showed that pN was an independent predictor of OS in patients with GC after curative-intent gastrectomy (16), and another study reported that pN stage was associated with OS after curative surgery in patients with LN-positive GC (17). Conversely, other cases have discussed that pN may be inappropriate and insufficient to stage and predict prognosis (18). Indeed, a previous study showed that the N3b stage had a better OS than N2 and N3a stages in patients with M0 GC (19). Moreover, Qian et al. (20) demonstrated that the pN stage was not independently associated with OS, which is consistent with the findings of Kulig et al. (21) Additionally, stage migration is another condition; this means that the number of pNs depends on the number of LN dissections. Therefore, an adequate marker for staging and meticulous prediction of prognosis is required.
Numerous studies have attempted to assess the prognostic significance and optimal number of ELN in patients with GC. A recent study demonstrated that ELN was independently associated with OS in patients with GC (8). Studies have also demonstrated that patients with GC with an ELN ≥ 16 have better survival outcomes than those with an ELN < 16 (22, 23). In the present study, Multivariate Cox analysis confirmed that ELN > 16 persisted in being independently related to superior OS. Additionally, both the National Comprehensive Cancer Network (24) and AJCC (25) committees recommend the assessment of at least 16 LNs for precise staging and accurate prognostic evaluation. Nevertheless, Wong et al. (26) showed that ELN was not significantly correlated with survival. Thus, it is worth further evaluating the optimal number of ELN and the relationship between ELN and prognosis in GC to guide clinical practice.
The results of the CRM demonstrated that patients with an ELN > 16 experienced less non-GCSD but did not have lower cumulative GCSD rates. Moreover, an ELN > 16 was still not a prognostic factor for DSS when competing risks were considered; this indicated that patients with ELN > 16 benefited from better OS likely because of less non-GCSD. We speculated that patients with ELN ≤ 16 may present with comorbidities that compel surgeons to retrieve a limited number of LNs. Non-GCSD from comorbidities may lead to poor prognosis in patients with ELN ≤ 16. A previous study also suggested that comorbidity is a risk factor for survival after gastrectomy (27). This risk should be carefully considered in the subsequent treatment of patients with GC and comorbidities.
Multivariate Cox analysis confirmed that LNR > 0.1 was an independent unfavorable factor for DSS and OS. Many recent studies have emphasized the importance of LNR as a prognostic factor in patients with GC. Both a large cohort study (28) and an integrated analysis (29) revealed that LNR could reliably and accurately predict survival in patients with GC. A recent study also demonstrated that a high LNR was associated with worse OS in patients with GC (30). Similar results were found in patients with GC after curative resection (31), patients with GC with LN metastasis (32), and patients with pathological Stage II/III GC (13). Additionally, LNR was a significant and independent predictor of prognosis regardless of the pathological stage (33) and the number of resected nodes (34) in patients with GC. Nevertheless, previous studies did not conduct competing risk analyses to evaluate the relationship between the LNR and prognosis. Based on our results, LNR > 0.1 was still an independent unfavorable factor for DSS when competing risks were considered, indicating that an LNR > 0.1 is a valuable prognostic indicator for GC that is of great value in clinical practice.
Aoyama et al. demonstrated that the prognostic value of LNR was higher in patients with pN3 stage disease than in those with pN1 or pN2 stage disease (30). Similar results were observed in another study by Hung et al. (35), who found that a higher LNR was independently related to inferior OS in patients with stage N3b GC. The abovementioned results were inconsistent with our findings, showing that LNR > 0.1 was an unfavorable factor for both DSS and OS in the cN1 subgroup but had no significant impact in the cN2 or cN3 subgroups. Interestingly, Wu et al. (36) demonstrated contradictory results, showing that LNR was an independent prognostic factor only in patients with stage III GC but not in those with stage I, II, and IV. In the present study, we demonstrated the promising prognostic value of LNR in patients with stage II GC.
These differences may be explained as follows. First, in view of the patients’ background, all patients in the studies by Aoyama et al. (30), Hung et al. (35), and Wu et al. (36) were from Asia (Japan, Taiwan, and China, respectively); in contrast, we evaluated patients from the US. Additionally, we enrolled more older patients than the other three studies. Furthermore, we did not evaluate patients with T4 stage GC, whereas the other studies did. Second, the number of retrieved LNs and the number of metastatic LNs were different. The median number of retrieved LNs was 31, 43, 22, and 16, while the median number of metastatic LNs was 7.7, 22, 4, and 2 in the studies by Aoyama et al. (30), Hung et al. (35), Wu et al. (36), and our study, respectively. The LNR may be affected by the number of retrieved and metastatic LNs. Third, the cut-off values of the LNR were different. We set the cut-off value at 0.1 using the restricted cubic splines; Aoyama et al. (30) set the cut-off value of the LNR to 0.23, based on the 3- and 5-year OS rates; Hung et al. (35) set a cut-off value of 0.8; and Wu et al. (36) stratified the cut-off value of the LNR into 0, 0–0.2, 0.2–0.5, and > 0.5, based on previous studies (37). Hence, the LNR may be more suitable under certain conditions, and a standardized LNR classification for GC should be further investigated.
Over the last few years, the LNR, an alternative LN staging system, has emerged as superior to pN and ELN in predicting the prognosis of GC. Previous studies have shown that the LNR predicts OS more powerful than N stage (38, 39) and pN (40). Additionally, the LNR maintained its effectiveness superior to the pN stage regardless of ELN (41, 42). LNR was an independent prognostic factor in patients with GC, whereas pN and ELN were not (43, 44). Additionally, the LNR remains an independent prognostic factor for OS when ELN < 16 rather than pN (45). Our results also demonstrated that the LNR has a better prognostic value than the ELN and pN. Furthermore, Huang et al. combined the LNR with the AJCC staging system to construct a new LNR-based AJCC (rAJCC) staging system for GC. The authors found that the rAJCC stratified patients better than the AJCC staging system (46). In contrast, the pN stage cannot distinguish the prognostic discrepancy between different LNR groups (47). Therefore, the above results suggest that the LNR provides greater prognostic validity than the pN or ELN. The mechanism contributing to the different effects of the LNR and pN on GC prognosis may be explained as follows. First, the LNR is only a ratio and is not affected by the ELN, which compensates for the stage migration (19). However, as there is a significant correlation between the pN and ELN (45), the LNR may be more useful even if the ELN is small. Second, the LNR is not affected by how the surgery or field of LN dissection is performed (29). Third, LNR exhibits a relationship with the immune response defense mechanism against cancer metastasis (33, 48).
The univariate and multivariate analyses showed no significant association between several factors (such as age, sex, AJCC stage, and T stage) and DSS. However, these factors are often considered important prognostic indicators in GC. Several reasons can be speculated for these results. In this specific population (patients with LN-positive stage II GC undergoing resection and chemotherapy), all patients were AJCC stage II (including IIa and IIb), and both T and N stages had relatively narrow ranges. As a result, these factors (such as age, sex, AJCC stage, and T stage) were unable to further distinguish the prognosis of patients in the present study. Additionally, the limited sample size may have reduced the statistical significance of these variables and the DSS. It is important to note that this does not imply that these factors lack prognostic significance in the overall GC population; rather, in the specific study cohort selected, their predictive value for prognosis was limited.
The present study had some strengths. Notably, traditional Kaplan–Meier and Cox analyses deal with competing events only as censored observations, leading to an overestimation of the cumulative incidence rate and, sometimes, resulting in false positives and false negatives. In contrast, the use of a CRM could mitigate the estimation bias because the competing events and interesting outcomes are separately taken into consideration, and the effect of competing events on interesting outcomes is precluded in the CRM (49). Thus, the CRM approach could serve the role of non-GCSD for the endpoint of interest and to accurately estimate the cumulative incidence of interesting events. This was particularly important in a clinical study of GC since > 10% of the patients died because of causes other than GC in the present study. To the best of our knowledge, this is the first study with a large population to report the impact of LN status on the survival of patients with GC using the CRM approach. In addition, we focused on patients with LN-positive stage II GC undergoing resection and chemotherapy, such as a special population with a large yield of LN. An accurate staging system is needed to determine adequate treatment schedules and predict prognosis. Moreover, although TNM staging system is widely used, it has some inevitable deficiencies, especially when ELN is insufficient. We found that the LNR was superior to the ELN and pN in predicting the prognosis (including both OS and DSS) of patients with GC.
Our study also had some limitations. First, this was an analysis of the SEER database, which had the potential to include heterogeneous data with respect to diagnosis and treatment strategies over a long period. Second, since this was a retrospective study, the study design was limited, and potential bias could not be avoided. Third, data for some treatment and clinicopathological factors, such as LN dissection method, preoperative therapy, margin status, comorbidities, and chemotherapy regimen, were unavailable. These factors may also affect the prognosis of patients with GC. Finally, the sample size in our study was relatively small.
In conclusion, our results suggest that ELN, LNR, and pN are all significant predictors of OS for GC. However, the prognostic value of pN for DSS is likely to be influenced by death from other causes (competing events). LNR, in contrast, demonstrates stronger robustness in predicting DSS for GC than ELN and pN. Further prospective studies with larger sample sizes and more rigorous designs are required for a more accurate analysis of the role of the LNR in the prognosis of patients with GC and to identify the optimum LNR classification for application in clinical practice.
Data availability statement
The original contributions presented in the study are included in the article/Supplementary Material. Further inquiries can be directed to the corresponding author.
Author contributions
XG: Conceptualization, Data curation, Formal analysis, Funding acquisition, Methodology, Software, Validation, Visualization, Writing – original draft. YD: Conceptualization, Investigation, Methodology, Project administration, Resources, Software, Supervision, Writing – review & editing.
Funding
The author(s) declare that financial support was received for the research, authorship, and/or publication of this article. This study was supported by Support for the High-Quality Development of China Medical University Project of Liaoning Province (grant number: 2023JH2/20200158; 2023JH2/20200051) and Young Talents of Education Ministry of Liaoning Province (grant number: QN2019016).
Conflict of interest
The authors declare that the research was conducted in the absence of any commercial or financial relationships that could be construed as a potential conflict of interest.
Publisher’s note
All claims expressed in this article are solely those of the authors and do not necessarily represent those of their affiliated organizations, or those of the publisher, the editors and the reviewers. Any product that may be evaluated in this article, or claim that may be made by its manufacturer, is not guaranteed or endorsed by the publisher.
Supplementary material
The Supplementary Material for this article can be found online at: https://www.frontiersin.org/articles/10.3389/fendo.2025.1434999/full#supplementary-material
Abbreviations
AJCC, American Joint Committee on Cancer; CI, confidence interval; CRM, competing risk model; DSS, disease-specific survival; ELN, examined lymph node; GC, gastric cancer; GCSD, gastric Cancer-specific death; HR, hazard ratio; LN, lymph node; LNR, lymph node ratio; NA, not available; OS, overall survival; PG/DG, proximal/distal gastrectomy; pN, positive lymph node; SEER, Surveillance, Epidemiology, and End Results; SHR, sub-distribution hazard ratio; TG, total gastrectomy; US, United States.
References
1. Sung H, Ferlay J, Siegel RL, Laversanne M, Soerjomataram I, Jemal A, et al. Global cancer statistics 2020: GLOBOCAN estimates of incidence and mortality worldwide for 36 cancers in 185 countries. CA Cancer J Clin. (2021) 71:209–49. doi: 10.3322/caac.21660
2. Waldum HL, Fossmark R. Types of gastric carcinomas. Int J Mol Sci. (2018) 19:4109. doi: 10.3390/ijms19124109
3. Sasako M, Sakuramoto S, Katai H, Kinoshita T, Furukawa H, Yamaguchi T, et al. Five-year outcomes of a randomized phase III trial comparing adjuvant chemotherapy with S-1 versus surgery alone in stage II or III gastric cancer. J Clin Oncol. (2011) 29:4387–93. doi: 10.1200/JCO.2011.36.5908
4. Shridhar R, Dombi GW, Weber J, Hoffe SE, Meredith K, Konski A. Adjuvant radiation therapy increases overall survival in node-positive gastric cancer patients with aggressive surgical resection and lymph node dissection: a SEER database analysis. Am J Clin Oncol. (2012) 35:216–21. doi: 10.1097/COC.0b013e31820dbf08
5. Hanna GB, Amygdalos I, Ni M, Boshier PR, Mikhail S, Lloyd J, et al. Improving the standard of lymph node retrieval after gastric cancer surgery. Histopathology. (2013) 63:316–24. doi: 10.1111/his.12167
6. Yin K, Jin X, Pan Y, Zi M, Zheng Y, Ma Y, et al. Revolutionizing T3-4N0-2M0 gastric cancer staging with an innovative pathologic N classification system. J Gastrointest Surg. (2024) 28:1283–93. doi: 10.1016/j.gassur.2024.05.031
7. Lu J, Wang W, Zheng CH, Fang C, Li P, Xie JW, et al. Influence of total lymph node count on staging and survival after gastrectomy for gastric cancer: an analysis from a two-institution database in China. Ann Surg Oncol. (2017) 24:486–93. doi: 10.1245/s10434-016-5494-7
8. Erstad DJ, Blum M, Estrella JS, Das P, Minsky BD, Ajani JA, et al. Navigating nodal metrics for node-positive gastric cancer in the United States: an NCDB-based study and validation of AJCC guidelines. J Natl Compr Canc Netw. (2021) 19:1–12. doi: 10.6004/jnccn.2021.7038
9. Hristov B, Eguchi T, Bains S, Dycoco J, Tan KS, Isbell JM, et al. Minimally invasive lobectomy is associated with lower noncancer-specific mortality in elderly patients: A propensity score matched competing risks analysis. Ann Surg. (2019) 270:1161–9. doi: 10.1097/SLA.0000000000002772
10. Gao J, Chen Y, Wu P, Wang F, Tao H, Shen Q, et al. Causes of death and effect of non-cancer-specific death on rates of overall survival in adult classic Hodgkin lymphoma: a populated-based competing risk analysis. BMC Cancer. (2021) 21:955. doi: 10.1186/s12885-021-08683-x
11. Wu J, Man D, Wang K, Li L. Impact of nonappendiceal cancer-specific death on overall survival: a competing risk analysis. Future Oncol. (2019) 15:4083–93. doi: 10.2217/fon-2019-0178
12. Fu J, Wu L, Jiang M, Li D, Jiang T, Fu W, et al. Real-world impact of non-breast cancer-specific death on overall survival in resectable breast cancer. Cancer. (2017) 123:2432–43. doi: 10.1002/cncr.30617
13. Kano K, Yamada T, Yamamoto K, Komori K, Watanabe H, Hara K, et al. Association between lymph node ratio and survival in patients with pathological stage II/III gastric cancer. Ann Surg Oncol. (2020) 27:4235–47. doi: 10.1245/s10434-020-08616-1
14. Macdonald JS, Smalley SR, Benedetti J, Hundahl SA, Estes NC, Stemmermann GN, et al. Chemoradiotherapy after surgery compared with surgery alone for adenocarcinoma of the stomach or gastroesophageal junction. N Engl J Med. (2001) 345:725–30. doi: 10.1056/NEJMoa010187
15. National Cancer Institute, Surveillance, Epidemiology, and End Results Program (2022) (Accessed 2 March 2022).
16. Tonello AS, Capelli G, Bao QR, Marchet A, Farinati F, Pawlik TM, et al. A nomogram to predict overall survival and disease-free survival after curative-intent gastrectomy for gastric cancer. Updates Surg. (2021) 73:1879–90. doi: 10.1007/s13304-021-01083-7
17. Deng J, Liang H, Sun D, Pan Y. The prognostic analysis of lymph node-positive gastric cancer patients following curative resection. J Surg Res. (2010) 161:47–53. doi: 10.1016/j.jss.2008.12.019
18. Kattan MW, Karpeh MS, Mazumdar M, Brennan MF. Postoperative nomogram for disease-specific survival after an R0 resection for gastric carcinoma. J Clin Oncol. (2003) 21:3647–50. doi: 10.1200/JCO.2003.01.240
19. Nelen SD, van Steenbergen LN, Dassen AE, van der Wurff AA, Lemmens VE, Bosscha K. The lymph node ratio as a prognostic factor for gastric cancer. Acta Oncol. (2013) 52:1751–9. doi: 10.3109/0284186X.2012.754991
20. Qian J, Qian Y, Wang J, Gu B, Pei D, He S, et al. A clinical prognostic scoring system for resectable gastric cancer to predict survival and benefit from paclitaxel- or oxaliplatin-based adjuvant chemotherapy. Drug Des Devel Ther. (2016) 10:241–58. doi: 10.2147/DDDT.S88743
21. Kulig J, Sierzega M, Kolodziejczyk P, Popiela T, Polish Gastric Cancer Study G. Ratio of metastatic to resected lymph nodes for prediction of survival in patients with inadequately staged gastric cancer. Br J Surg. (2009) 96:910–8. doi: 10.1002/bjs.6653
22. Guo S, Shang M, Dong Z, Zhang J, Wang Y, Zhao Y. The assessment of the optimal number of examined lymph nodes and prognostic models based on lymph nodes for predicting survival outcome in patients with stage N3b gastric cancer. Asia Pac J Clin Oncol. (2021) 17:e117–24. doi: 10.1111/ajco.13358
23. Huang L, Zhang X, Wei Z, Xu A. Importance of examined lymph node number in accurate staging and enhanced survival in resected gastric adenocarcinoma-the more, the better? A cohort study of 8,696 cases from the US and China, 2010-2016. Front Oncol. (2020) 10:539030. doi: 10.3389/fonc.2020.539030
24. Ajani JA. NCCN Clinical Practice Guidelines in Gastric Cancer. Version 2 ed. (2018). Available online at: https://www.nccn.org/guidelines/category_1 (Accessed 2024).
26. Wong J, Rahman S, Saeed N, Lin HY, Almhanna K, Shridhar R, et al. Prognostic impact of lymph node retrieval and ratio in gastric cancer: a U.S. single center experience. J Gastrointest Surg. (2013) 17:2059–66. doi: 10.1007/s11605-013-2380-5
27. Kim W, Song KY, Lee HJ, Han SU, Hyung WJ, Cho GS. The impact of comorbidity on surgical outcomes in laparoscopy-assisted distal gastrectomy: a retrospective analysis of multicenter results. Ann Surg. (2008) 248:793–9. doi: 10.1097/SLA.0b013e3181887516
28. Kutlu OC, Watchell M, Dissanaike S. Metastatic lymph node ratio successfully predicts prognosis in western gastric cancer patients. Surg Oncol. (2015) 24:84–8. doi: 10.1016/j.suronc.2015.03.001
29. Zhu J, Xue Z, Zhang S, Guo X, Zhai L, Shang S, et al. Integrated analysis of the prognostic role of the lymph node ratio in node-positive gastric cancer: A meta-analysis. Int J Surg. (2018) 57:76–83. doi: 10.1016/j.ijsu.2018.08.002
30. Aoyama T, Komori K, Tamagawa A, Nakazano M, Hara K, Hashimoto I, et al. Clinical influence of the lymph node ratio on lymph node metastasis-positive gastric cancer patients who receive curative treatment. In Vivo. (2022) 36:994–1000. doi: 10.21873/invivo.12792
31. Nie SF, Wang CY, Li L, Yang C, Zhu ZM, Fei JD. Tumor recurrence and survival prognosis in patients with advanced gastric cancer after radical resection with radiotherapy and chemotherapy. World J Gastrointest Surg. (2024) 16:1660–9. doi: 10.4240/wjgs.v16.i6.1660
32. Nakamura S, Kanda M, Ito S, Mochizuki Y, Teramoto H, Ishigure K, et al. Accurate risk stratification of patients with node-positive gastric cancer by lymph node ratio. World J Surg. (2020) 44:4184–92. doi: 10.1007/s00268-020-05739-0
33. Ema A, Yamashita K, Sakuramoto S, Wang G, Mieno H, Nemoto M, et al. Lymph node ratio is a critical prognostic predictor in gastric cancer treated with S-1 chemotherapy. Gastric Cancer. (2014) 17:67–75. doi: 10.1007/s10120-013-0253-y
34. Bouliaris K, Rachiotis G, Diamantis A, Christodoulidis G, Polychronopoulou E, Tepetes K. Lymph node ratio as a prognostic factor in gastric cancer patients following D1 resection. Comparison with the current TNM staging system. Eur J Surg Oncol. (2017) 43:1350–6. doi: 10.1016/j.ejso.2017.03.013
35. Hung YS, Chang SC, Liu KH, Hung CY, Kuo YC, Tsai CY, et al. A prognostic model based on lymph node metastatic ratio for predicting survival outcome in gastric cancer patients with N3b subclassification. Asian J Surg. (2019) 42:85–92. doi: 10.1016/j.asjsur.2017.10.001
36. Wu XJ, Miao RL, Li ZY, Bu ZD, Zhang LH, Wu AW, et al. Prognostic value of metastatic lymph node ratio as an additional tool to the TNM stage system in gastric cancer. Eur J Surg Oncol. (2015) 41:927–33. doi: 10.1016/j.ejso.2015.03.225
37. Sun Z, Xu Y, Li de M, Wang ZN, Zhu GL, Huang BJ, et al. Log odds of positive lymph nodes: a novel prognostic indicator superior to the number-based and the ratio-based N category for gastric cancer patients with R0 resection. Cancer. (2010) 116:2571–80. doi: 10.1002/cncr.24989
38. Spolverato G, Ejaz A, Kim Y, Squires MH, Poultsides G, Fields RC, et al. Prognostic performance of different lymph node staging systems after curative intent resection for gastric adenocarcinoma. Ann Surg. (2015) 262:991–8. doi: 10.1097/SLA.0000000000001040
39. Chen S, Ding P, Zhao Q. Comparison of the predictive performance of three lymph node staging systems for late-onset gastric cancer patients after surgery. Front Surg. (2024) 11:1376702. doi: 10.3389/fsurg.2024.1376702
40. Peng CW, Wang LW, Fang M, Yang GF, Li Y, Pang DW. Combined features based on MT1-MMP expression, CD11b + immunocytes density and LNR predict clinical outcomes of gastric cancer. J Transl Med. (2013) 11:153. doi: 10.1186/1479-5876-11-153
41. Rausei S, Dionigi G, Sano T, Sasako M, Biondi A, Morgagni P, et al. Updates on surgical management of advanced gastric cancer: new evidence and trends. Insights from the First International Course on Upper Gastrointestinal Surgery–Varese (Italy), December 2, 2011. Ann Surg Oncol. (2013) 20:3942–7. doi: 10.1245/s10434-013-3082-7
42. Zhou Y, Zhang J, Cao S, Li Y. The evaluation of metastatic lymph node ratio staging system in gastric cancer. Gastric Cancer. (2013) 16:309–17. doi: 10.1007/s10120-012-0190-1
43. Gulmez S, Senger AS, Uzun O, Omeroglu S, Ofluoglu C, Sert ZO, et al. Prognostic significance of the metastatic lymph node ratio compared to the TNM classification in stage III gastric cancer. Niger J Clin Pract. (2021) 24:1602–8. doi: 10.4103/njcp.njcp_345_20
44. Spolverato G, Capelli G, Lorenzoni G, Gregori D, Squires MH, Poultsides GA, et al. Development of a prognostic nomogram and nomogram software application tool to predict overall survival and disease-free survival after curative-intent gastrectomy for gastric cancer. Ann Surg Oncol. (2022) 29:1220–9. doi: 10.1245/s10434-021-10768-7
45. Kano K, Yamada T, Yamamoto K, Komori K, Watanabe H, Takahashi K, et al. Evaluation of lymph node staging systems as independent prognosticators in remnant gastric cancer patients with an insufficient number of harvested lymph nodes. Ann Surg Oncol. (2021) 28:2866–76. doi: 10.1245/s10434-020-09433-2
46. Huang Z, Chen Y, Zhang W, Liu H, Wang Z, Zhang Y. Modified gastric cancer AJCC staging with a classification based on the ratio of regional lymph node involvement: A population-based cohort study. Ann Surg Oncol. (2020) 27:1480–7. doi: 10.1245/s10434-019-08098-w
47. Coimbra FJ, Costa WL Jr., Montagnini AL, Diniz AL, Ribeiro HS, Silva MJ, et al. The interaction between N-category and N-ratio as a new tool to improve lymph node metastasis staging in gastric cancer: results of a single cancer center in Brazil. Eur J Surg Oncol. (2011) 37:47–54. doi: 10.1016/j.ejso.2010.11.002
48. Yamashita K, Hosoda K, Ema A, Watanabe M. Lymph node ratio as a novel and simple prognostic factor in advanced gastric cancer. Eur J Surg Oncol. (2016) 42:1253–60. doi: 10.1016/j.ejso.2016.03.001
Keywords: gastric cancer, competing risk model, lymph node ratio, examined lymph node, positive lymph node, prognosis
Citation: Gu X and Du Y (2025) Prognostic performance of examined lymph nodes, lymph node ratio, and positive lymph nodes in gastric cancer: a competing risk model study. Front. Endocrinol. 16:1434999. doi: 10.3389/fendo.2025.1434999
Received: 19 May 2024; Accepted: 03 February 2025;
Published: 21 February 2025.
Edited by:
Xiaopei Shen, Fujian Medical University, ChinaReviewed by:
Xiang Hong, Southeast University, ChinaMingwei Zhang, First Affiliated Hospital of Fujian Medical University, China
Copyright © 2025 Gu and Du. This is an open-access article distributed under the terms of the Creative Commons Attribution License (CC BY). The use, distribution or reproduction in other forums is permitted, provided the original author(s) and the copyright owner(s) are credited and that the original publication in this journal is cited, in accordance with accepted academic practice. No use, distribution or reproduction is permitted which does not comply with these terms.
*Correspondence: Yaqi Du, eXFkdUBjbXUuZWR1LmNu