 Saisai Jing
 Jiazhao Song
 Yupeng Di
 Jiajia Xiao3
94% of researchers rate our articles as excellent or good
Learn more about the work of our research integrity team to safeguard the quality of each article we publish.
Find out more
ORIGINAL RESEARCH article
Front. Endocrinol. , 07 March 2025
Sec. Cancer Endocrinology
Volume 16 - 2025 | https://doi.org/10.3389/fendo.2025.1411426
Objective: This study aims to assess the long-term prognostic significance of the log odds of positive lymph nodes (LODDS) in patients diagnosed with papillary thyroid cancer (PTC) and to develop a novel nomogram for predicting long-term overall survival (OS).
Methods: The cohort was randomly divided at a ratio of 7:3 from the Surveillance, Epidemiology, and End Results (SEER) database. Additionally, patient data from a medical center in China served as an external validation cohort. Nomograms were constructed using data from the training cohort and subsequently validated using both internal and external validation cohorts to predict 120- and 180-month OS in PTC patients. The predictive performance and clinical utility of the nomogram were assessed using various metrics, including the concordance index (C-index), time-dependent receiver operating characteristic (ROC) curves, calibration curves, decision curve analysis (DCA), Integrated Discriminant Improvement Index (IDI), and Net Reclassification Improvement Index (NRI).
Results: LODDS is an independent prognostic factor for PTC, a nomogram demonstrating high accuracy in predicting long-term OS. The C-index values, and time-dependent area under the curve (AUC) indicated well discriminatory ability of the nomogram. Calibration plots exhibited high concordance, while DCA, NRI, and IDI analyses revealed superior performance of the nomogram compared to AJCC staging system.
Conclusion: The clinical prediction model incorporating LODDS exhibits robust predictive performance, aiding in the assessment of long-term prognosis post-surgery in PTC patients. It serves as a valuable adjunct to the AJCC system, offering a scientific basis for guiding interventions and rehabilitation strategies for PTC patients following surgery.
Papillary thyroid cancer (PTC) is the most common thyroid malignancy, accounting for approximately 85% of cases (1). In the last 30 years, the incidence of PTC has continued to increase globally (2). Generally, the 5-year survival rate of PTC is higher than 95%, which has a better prognosis than other malignant tumors, but it should not be ignored that lymph node metastasis (LNM) still exists in 30%-80% of PTC patients (3), which affects the long-term prognostic situation. Therefore, exploring postoperative lymph nodes (LN) is of practical clinical significance for the long-term prognostic assessment and further treatment of PTC patients. Currently, variables related to the comprehensive assessment of lymph nodes, such as the total number of postoperative LN, the number of positive lymph nodes (PLN), and the area of lymph node metastasis, have been included in other studies related to the prognostic assessment of malignant tumors (4–6). However, N staging in existing the 8th edition of AJCC staging does not include the number of LN in the consideration of assessment (7), which may affect the accuracy of assessing the long-term prognosis of patients with PTC. Therefore, further studies may be needed to explore new lymph node staging and to further optimize the grading system for PTC.
As a class of scientific clinical prognostic assessment tools, nomogram have gradually become a common method to study the prognosis of patients with various types of cancers by visualizing the calculation and combining the prognostic factors to predict the survival rate scientifically (8–10). In recent years, several studies have developed nomograms based on clinical features, pathologic factors, and blood and imaging tests to assess the prognosis of patients with PTC (11–15). The predictive power of the prediction model was assessed by analyzing the receiver operating characteristic (ROC) curves, the area under the curve (AUC), concordance index (C-index), and decision curve analysis (DCA) curves of the nomogram to compare with the existing clinical staging systems. The nomogram constructed based on different prognostic factors demonstrated superior individualized survival prediction efficacy and clinical applicability.
Currently, new LN staging modalities, such as positive LN logarithmic ratio based on the log odds of positive lymph nodes (LODDS) or LN ratio (LNR). There have also received increasing attention, and several studies have demonstrated more accurate predictive ability than the traditional TNM staging system (16–18). However, relevant studies addressing the long-term prognostic value of new LN staging modalities in PTC are still lacking. Our study aimed to clarify whether the LODDS could be utilized to predict long-term overall survival (OS) in patients with PTC as a way to explore the feasibility of establishing a new LN staging system. On this basis, a new LN staging prognostic model based on nomogram was established by analyzing the relevant factors affecting the prognosis of postoperative PTC patients. Different prognostic risk groups were distinguished as a way to predict the long-term prognosis of PTC patients more accurately.
This study was based on a multicenter retrospective cohort from the United States and China following the Transparent Reporting of Individual Prognostic or Diagnostic Multivariate Predictive Models (TRIPOD) (19). The modeled patient clinical data for this study were obtained from the Surveillance, Epidemiology, and End Results (SEER) 17 Registry Research Database in the U.S. Covering approximately 30% of the U.S. population, the SEER database includes many items such as patient demographics, tumor information, and follow-up status, providing a large sample of clinically valuable information for prognostic studies of tumors (20). Patient follow-up data from a medical center in China was used as an external validation cohort to verify the generalizability of the prediction model. Because the SEER database is publicly available and anonymous, the modeling data did not require institutional review board approval and individual patient consent applications. The Chinese dataset for this study was derived from clinical consultation data of PTC patients kept from January 1, 2000, to December 31, 2010, at Cixi Hospital of Wenzhou Medical University, Zhejiang Province, China. The establishment of this dataset was approved by the Ethics Committee of the hospital (No. 2023-LP-LW007), and the follow-up information was obtained by verbal communication confirmed by telephone, and the process of obtaining patient information followed the requirements of the Ethics Committee. This study complies with the Declaration of Helsinki (21).
Patients with thyroid cancer diagnosed and treated between 2004 and 2015 (anatomical code: C73.9) with a follow-up date up to October 31, 2022, were selected according to the International Classification of Diseases in Oncology, version 2023 (ICD-O-3) codes in the SEER database and further screened. Inclusion criteria: 1. papillary cancer were selected as study subjects (histologic codes: 8040/3, 8042/3,8043/3,8044/3); 2. surgical procedure was localized thyroidectomy, thyroid isthmus resection, or more extensive (surgical codes: 20,21,22,23,26,27,30,40,50); and 3. patients who were non-dead or post-mortem post mortem diagnosis. Exclusion criteria: 1. patients younger than 18 years of age; 2. pathological confirmation not performed; 3. first primary site of the tumor was not the thyroid gland; 4. survival time after treatment was less than one month; 5. incomplete or unknown clinical information about the patient. Patients were randomly assigned according to a ratio of 7:3 to construct a training cohort and an internal validation cohort, respectively; the training cohort (n=2303) was used for prediction modeling, and the internal validation cohort (n=986) was used for internal validation of the prediction model. According to the recording criteria of the SEER database, the years 2004-2015 could correspond to the sixth or seventh edition of AJCC staging information. The study team reclassified the TNM classification according to the eighth edition. The external validation cohort (n=215) had a follow-up date up to December 31, 2023. Inclusion criteria for patients: 1. PTC confirmed by postoperative pathology. Exclusion criteria: 1. no pathologically confirmed diagnosis; 2. non-primary thyroid tumor; 3. lost to follow-up; 4. survival time <1 month after diagnosis; 5. unknown tumor TNM stage. Pathologic staging records for the external validation cohort were also based on the 8th edition of AJCC staging system.
Baseline demographic data from the SEER database included age, gender, and race. The baseline of tumor characteristics included tumor differentiation and TNM stage. Additionally, information regarding surgical interventions (local thyroidectomy/thyroidectomy isthmus, subtotal thyroidectomy, total thyroidectomy), radiotherapy, chemotherapy, and LN were extracted. LNR was defined as the ratio of the number of positive lymph nodes (PLN)/total number of removed lymph nodes (RLN). LODDS was defined as lg[(PLN + 0.50)/(negative lymph nodes (NLN) + 0.50)]. To avoid infinite numbers, 0.50 was added to both the numerator and denominator (16). OS in all cohorts was defined as the time interval from the date of diagnosis to death from any cause or the end of the last follow-up.
Lasso-multifactorial Cox regression analyses of all variables with p < 0.05 were further included in the construction of the final model, which was cross-validated 10 times to construct a nomogram composite scoring system for predicting the probability of overall survival. Internal validation was accomplished by taking a bootstrap procedure of 1000 resamples to the internal validation cohort. External validation was performed using the external validation cohort. Nomogram performance was assessed using subject ROC curves and calibration curves with AUC of ROC, ranging from 0.5 (no discrimination) to 1 (full discrimination). DCA was utilized to determine the predicted net benefit threshold. The constructed line plots were compared to the traditional AJCC/TNM staging by calculating the net reclassification improvement (NRI) and the integrated discrimination improvement (IDI), and the Z-test was used to test for differences.
After building the predictive model, the survival status, survival time, and linear predictors of the predictive model from the training cohort were selected separately and imported into the X-tiles software, and the linear predictors were used as markers for the analysis. Statistical analysis by the X-tiles software will result in a score against the linear predictors on the risk stratification for all predicted probability points calculated as a score based on the linear prediction of the patient’s nomogram.
Descriptive analysis was performed for all patients. Categorical variables are expressed as numbers and percentages (%). Continuous variables conforming to normal distribution are expressed as mean ± standard deviation, and continuous variables conforming to skewed distribution are expressed as median and interquartile range. Categorical variables were compared using the χ2 test or Fisher’s exact test, and continuous variables were compared using the t-test. Hazard ratios (HR) and 95% confidence interval (CI) were recorded for the multifactor Cox proportional risk model. Survival curves were plotted using the Kaplan-Meier method and differences in survival between curves were analyzed using the log-rank test. The best cutoff point most relevant to clinical prognosis was determined by X-tile software. Prognostic risk stratification was also performed (22).
SEER patient data were extracted based on SEER * Stat 8.4.3 software. The collected data were fully statistically analyzed using R v.4.4.1 statistical software (http://www.R-project.org, R Foundation, Vienna, Austria) and Free Statistics Software version 1.9 statistical software (23). A two-tailed p < 0.05 for the final results was considered statistically significant.
A total of 3504 patients participated in the analysis, assessing the demographic and clinical characteristics of the different cohorts. Of these, 2303 belonged to the training cohort, 986 to the internal validation cohort, and 215 to the external validation cohort (Figure 1). In terms of age, young and middle-aged people predominated in the training cohort (1,558, 67.7%), while the mean age of the external validation cohort was 47.7 ± 12.8 years, with a predominance of young and middle-aged patients (145, 67.4%). In the distribution of tumor characteristics in the training cohort, highly differentiated tumors were present in 76.0% of patients. The number of patients with stage I was (155, 89.6%) who underwent total thyroidectomy. The distribution of patient tumor characteristics for the external validation cohort was similar to that of the training cohort. In the training cohort, the median RLN was 3.0 (IQR: 1.0-7.0), the median PLN was 0.0 (IQR: 0.0-1.0), the median NLN was 2.0 (IQR: 1.0-6.0), the median LNR was 0.0 (IQR: 0.0-2.0), the median RLN was 3.0 (IQR: 1.0-7.0), and the median LODDS was -0.1 (IQR: -0.2 -0.0). In the external validation cohort, the median LODDS was -0.5. No statistically significant differences were observed between the training cohort and the internal validation cohort (p-value > 0.05). Detailed information about the different cohort can be found in Tables 1, 2 respectively.
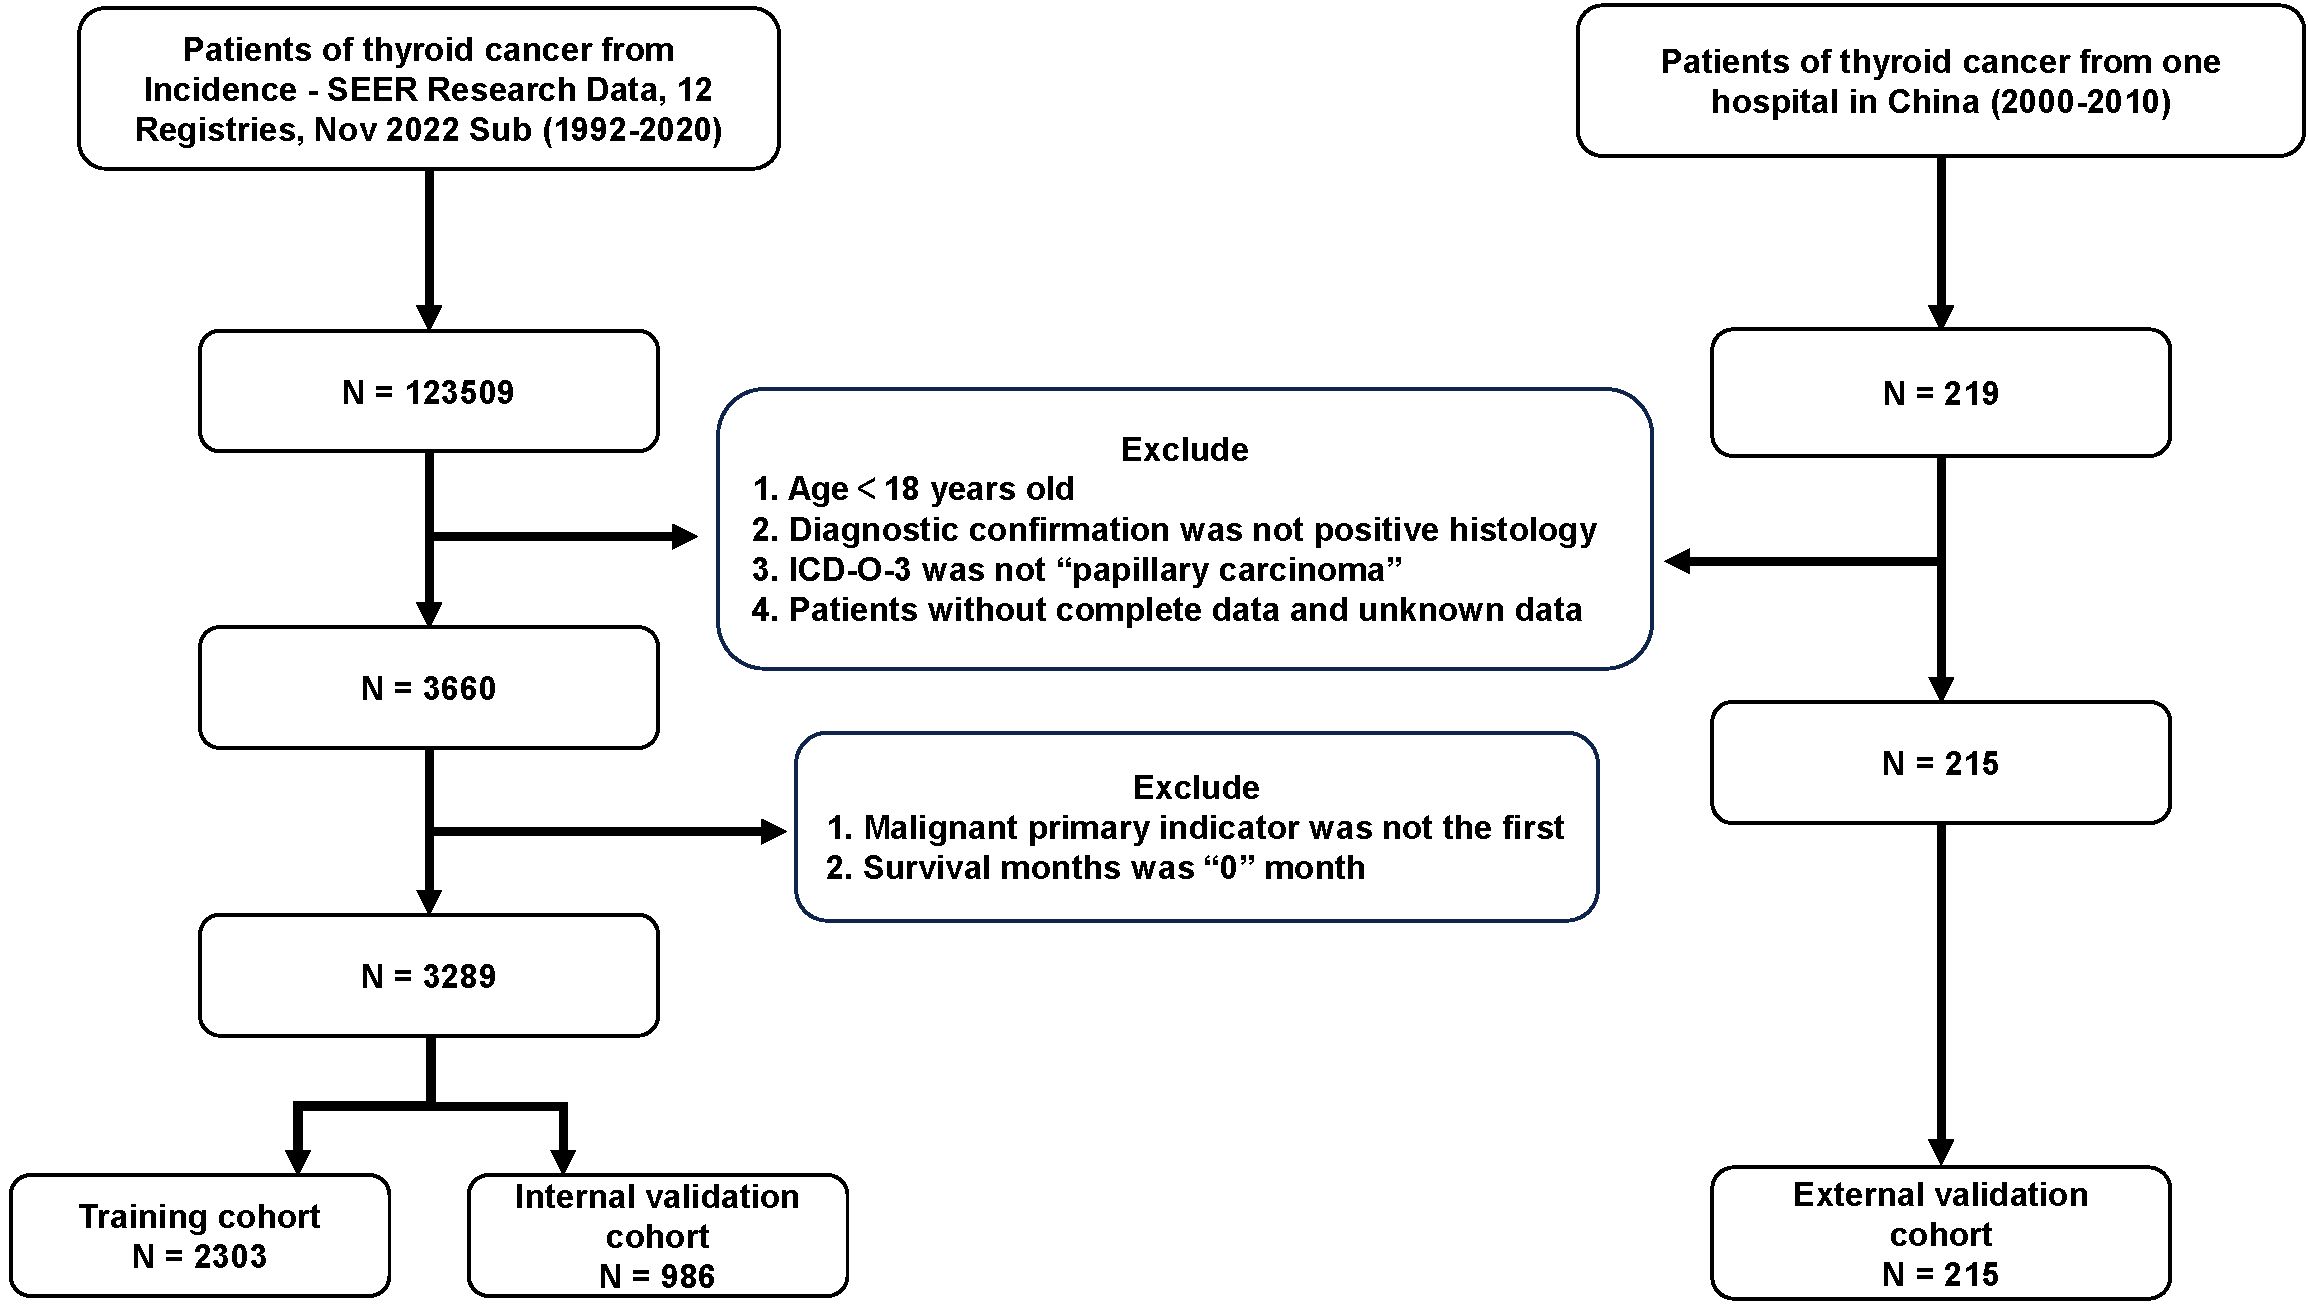
Figure 1. Flow chart for PTC patients. PTC, papillary thyroid cancer; SEER, the Surveillance, Epidemiology, and End Results; Sub, submission; ICD-O-3, International Classification of Diseases for Oncology, 3rd Edition.
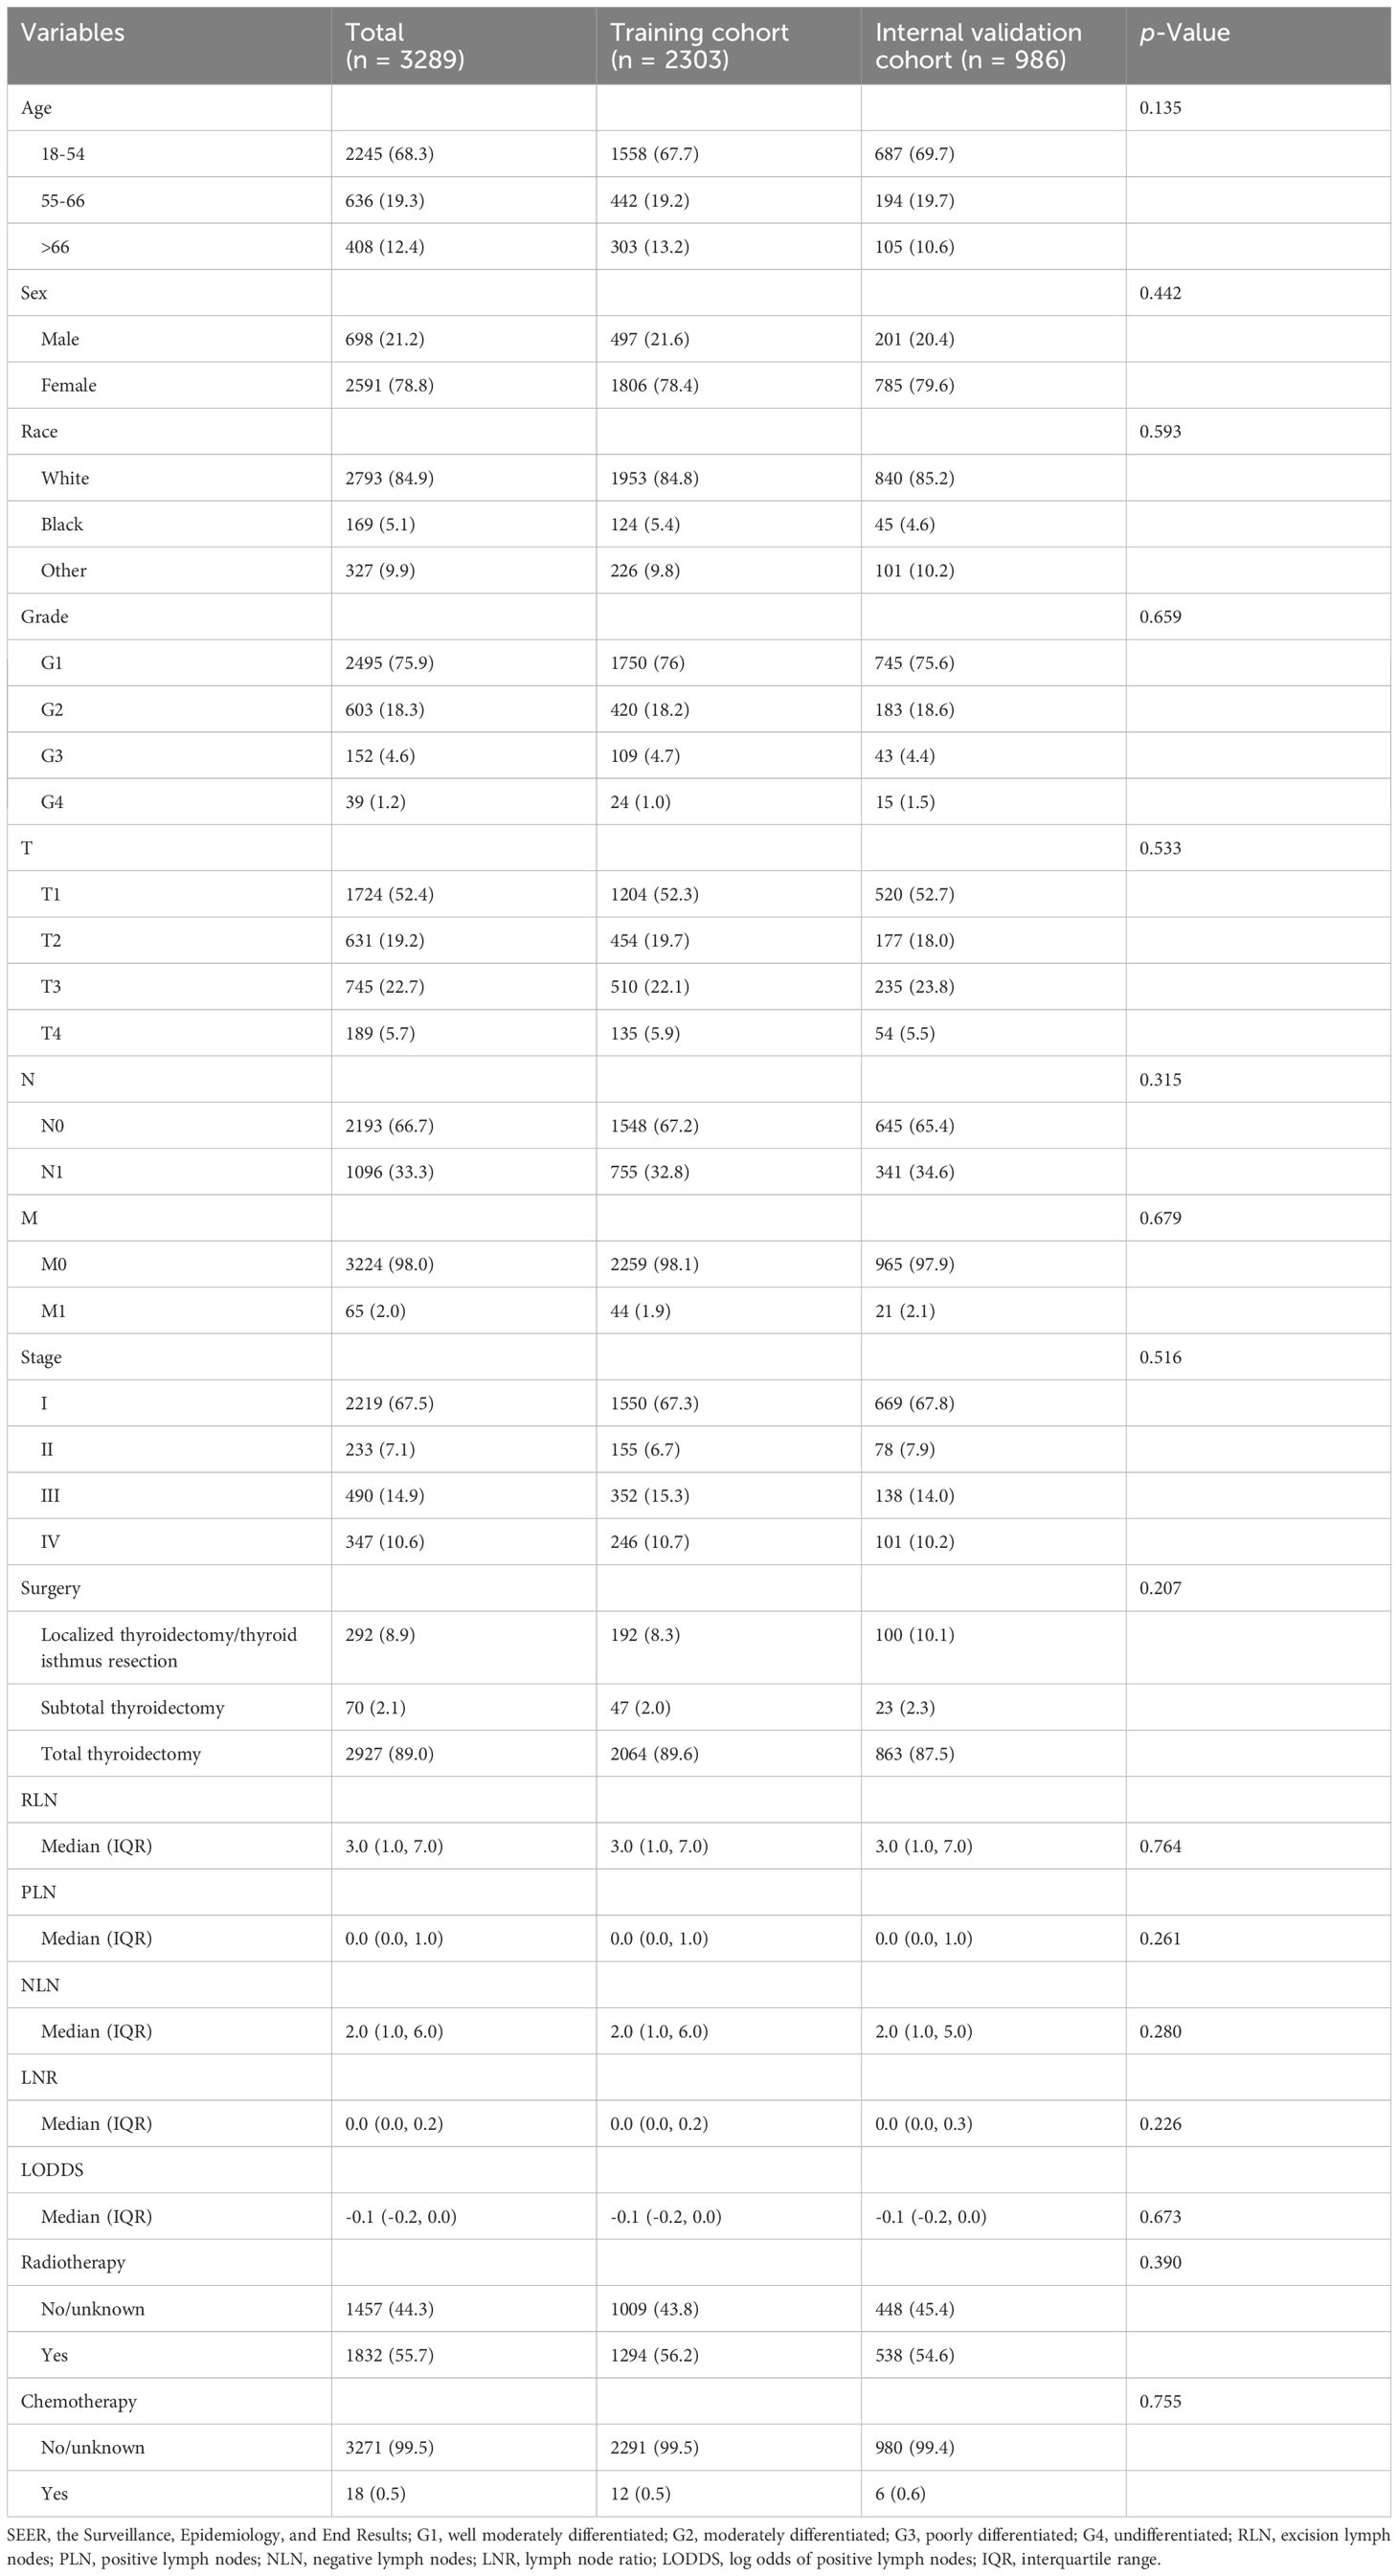
Table 1. Baseline characteristics of patients for training cohort and internal validation cohort from SEER database.
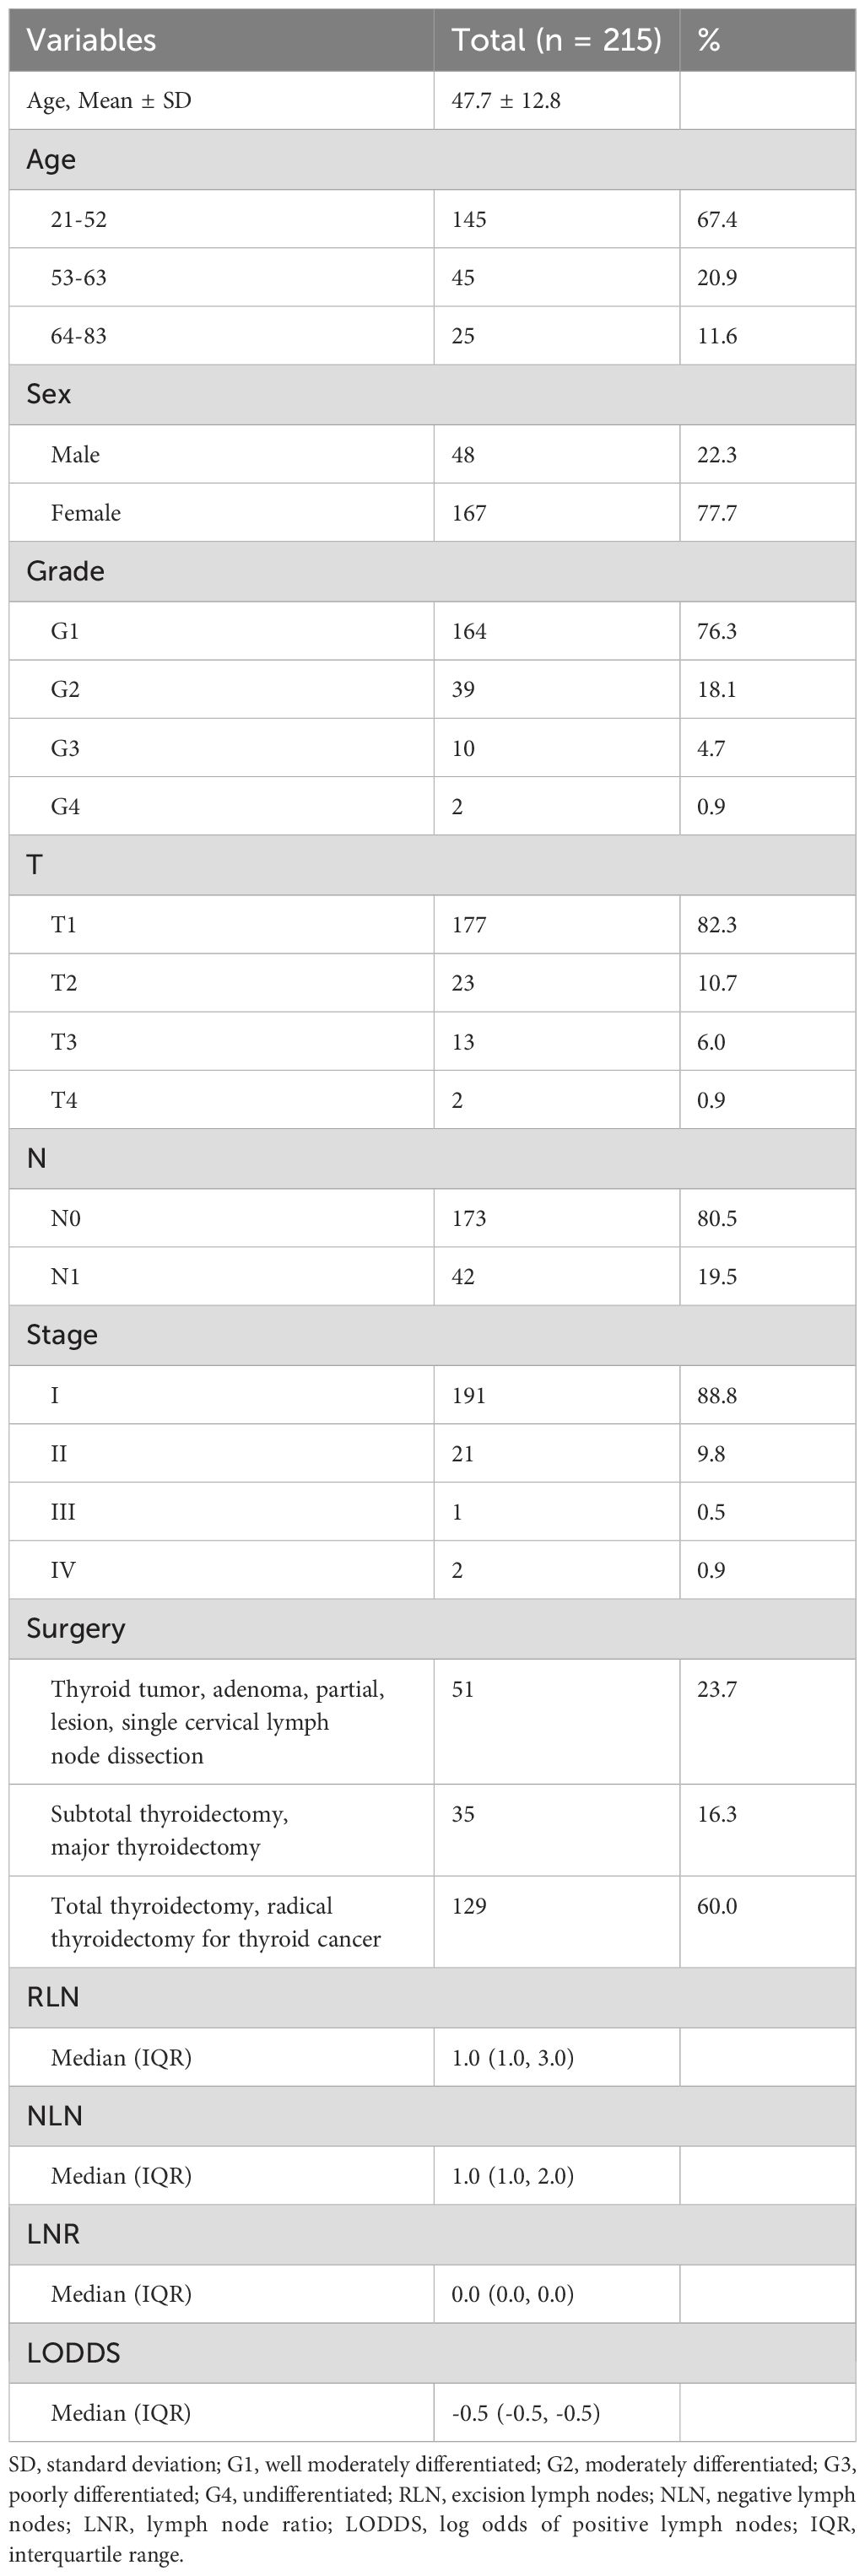
Table 2. Baseline characteristics of patients for external validation cohort from China hospital database.
Lasso-multifactorial regression analysis identified age, gender, grade of differentiation, TNM staging, and LODDS as prognostic correlates of PTC (p < 0.05) (Supplementary Figure S1; Table 3), and nomograms were constructed to assess the probability of survival for different individuals, as detailed in Figure 2. The C-index of the training cohort was 0.858 (0.827-0.888), the C-index of the internal validation cohort was 0.882 (0.836-0.929), and the C-index for the external validation cohort was 0.942 (0.918-0.965). Figure 3 compares the ROC curves of the nomogram with AJCC staging at 120 months and 180 months, respectively, and the corresponding AUC at 120 months (74.7% vs. 85.6%) and 180 months (72.5% vs. 85.6%). The AUC of the nomogram was greater than the AUC of AJCC staging for both the training cohort and validation cohort. The comparative accuracy analyses showed that IDI or NRI of the OS of the training or validation cohorts at 120 and 180 months were greater than 0, both p < 0.05 (Table 4), indicating that the predictive ability of the nomogram was superior to that of the traditional staging of AJCC. Further application of DCA to evaluate its clinical applicability based on the training and validation cohorts, and comparison of DCA of nomogram with AJCC staging showed (Figures 3–5) added more net benefit than AJCC staging for almost all threshold probabilities, which suggests that the use of nomogram for predicting the OS of radiotherapy in post-surgical PTC patients is more applicable to clinical decision-making than AJCC staging.
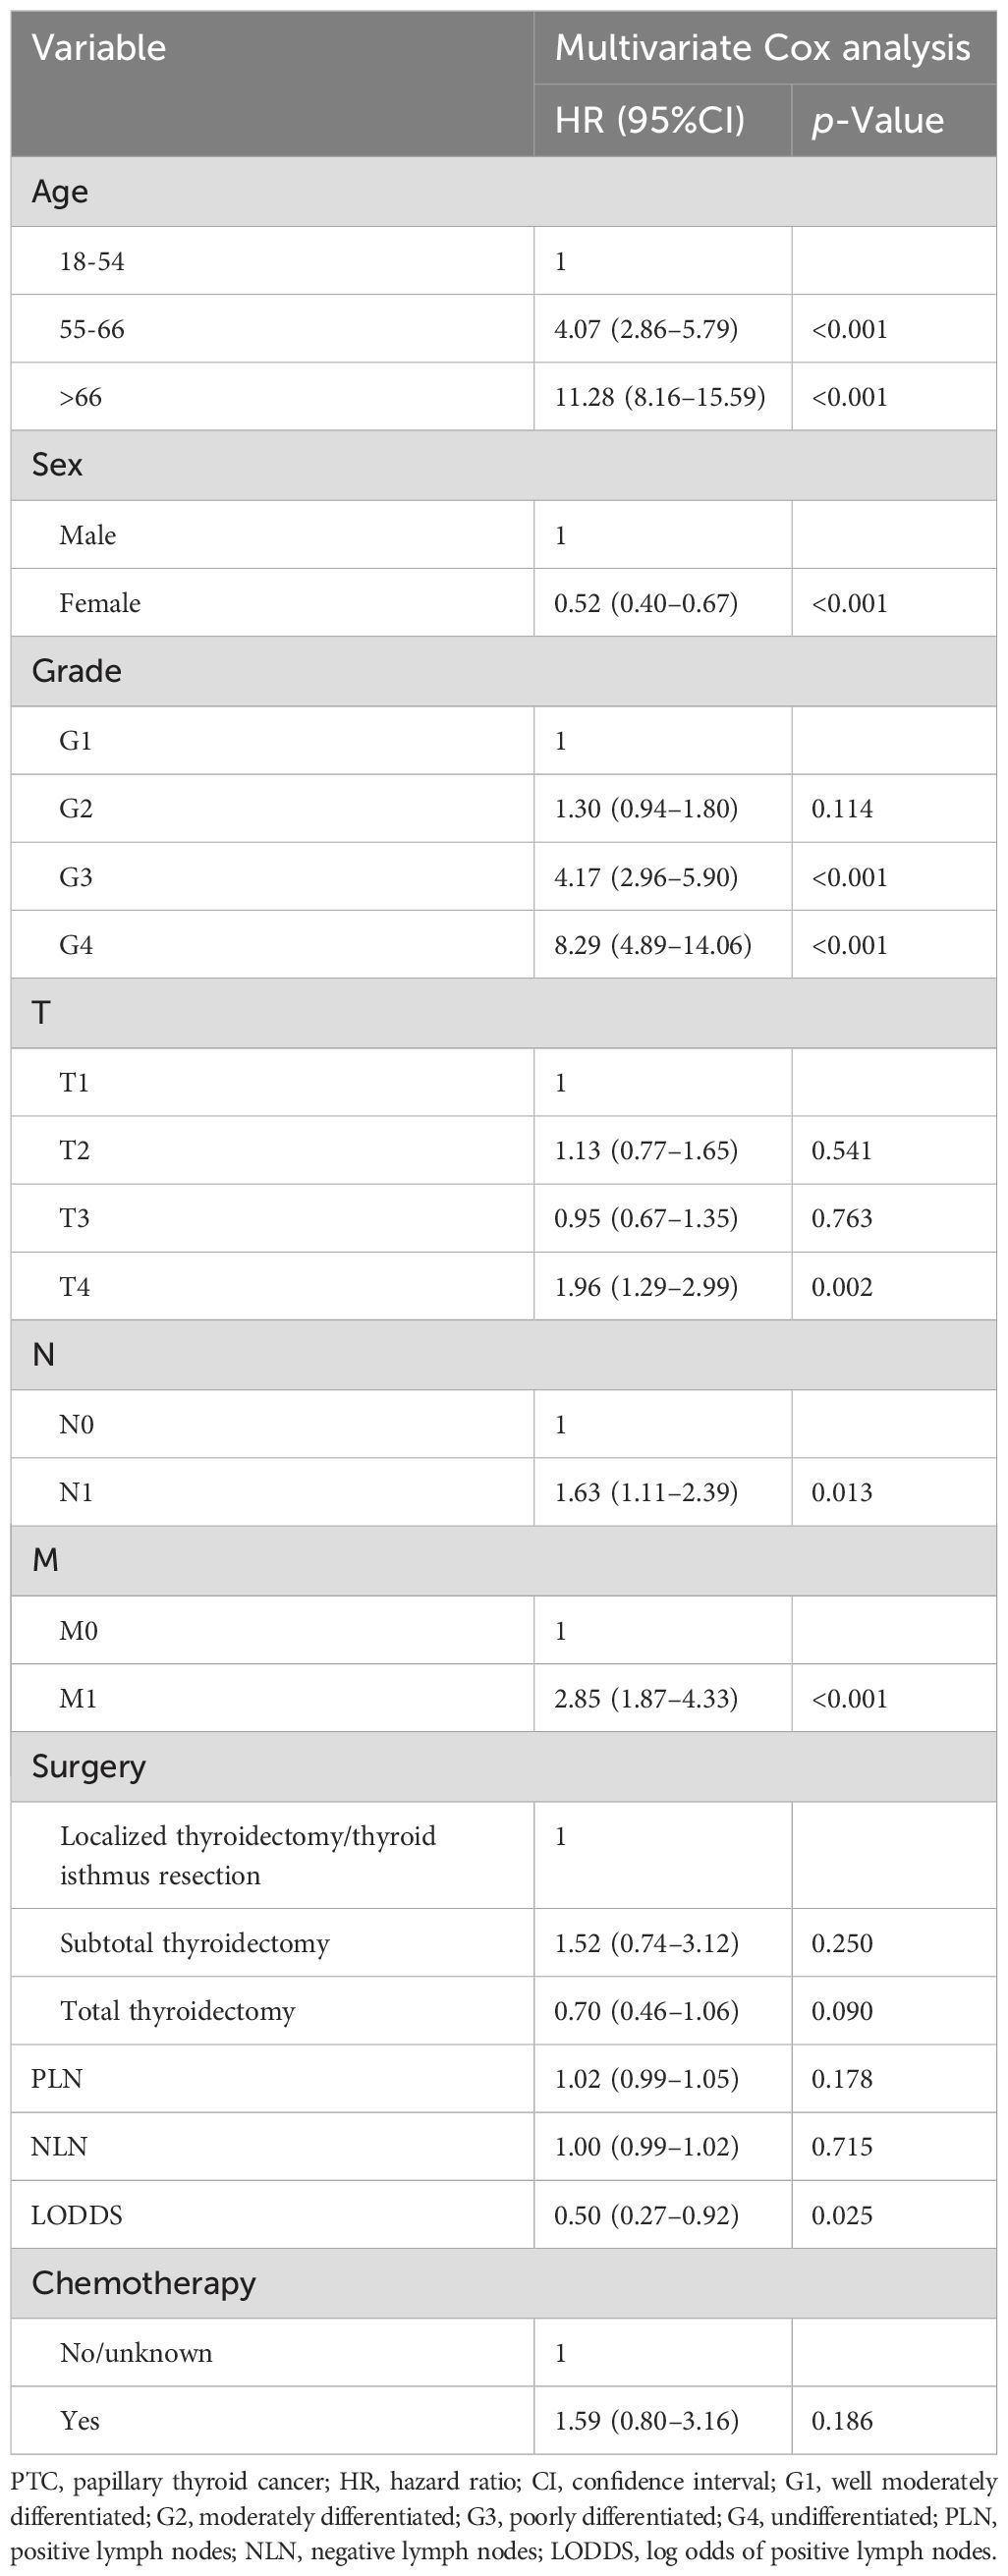
Table 3. Multivariate Cox analysis on variables for the prediction of overall survival of PTC patients.
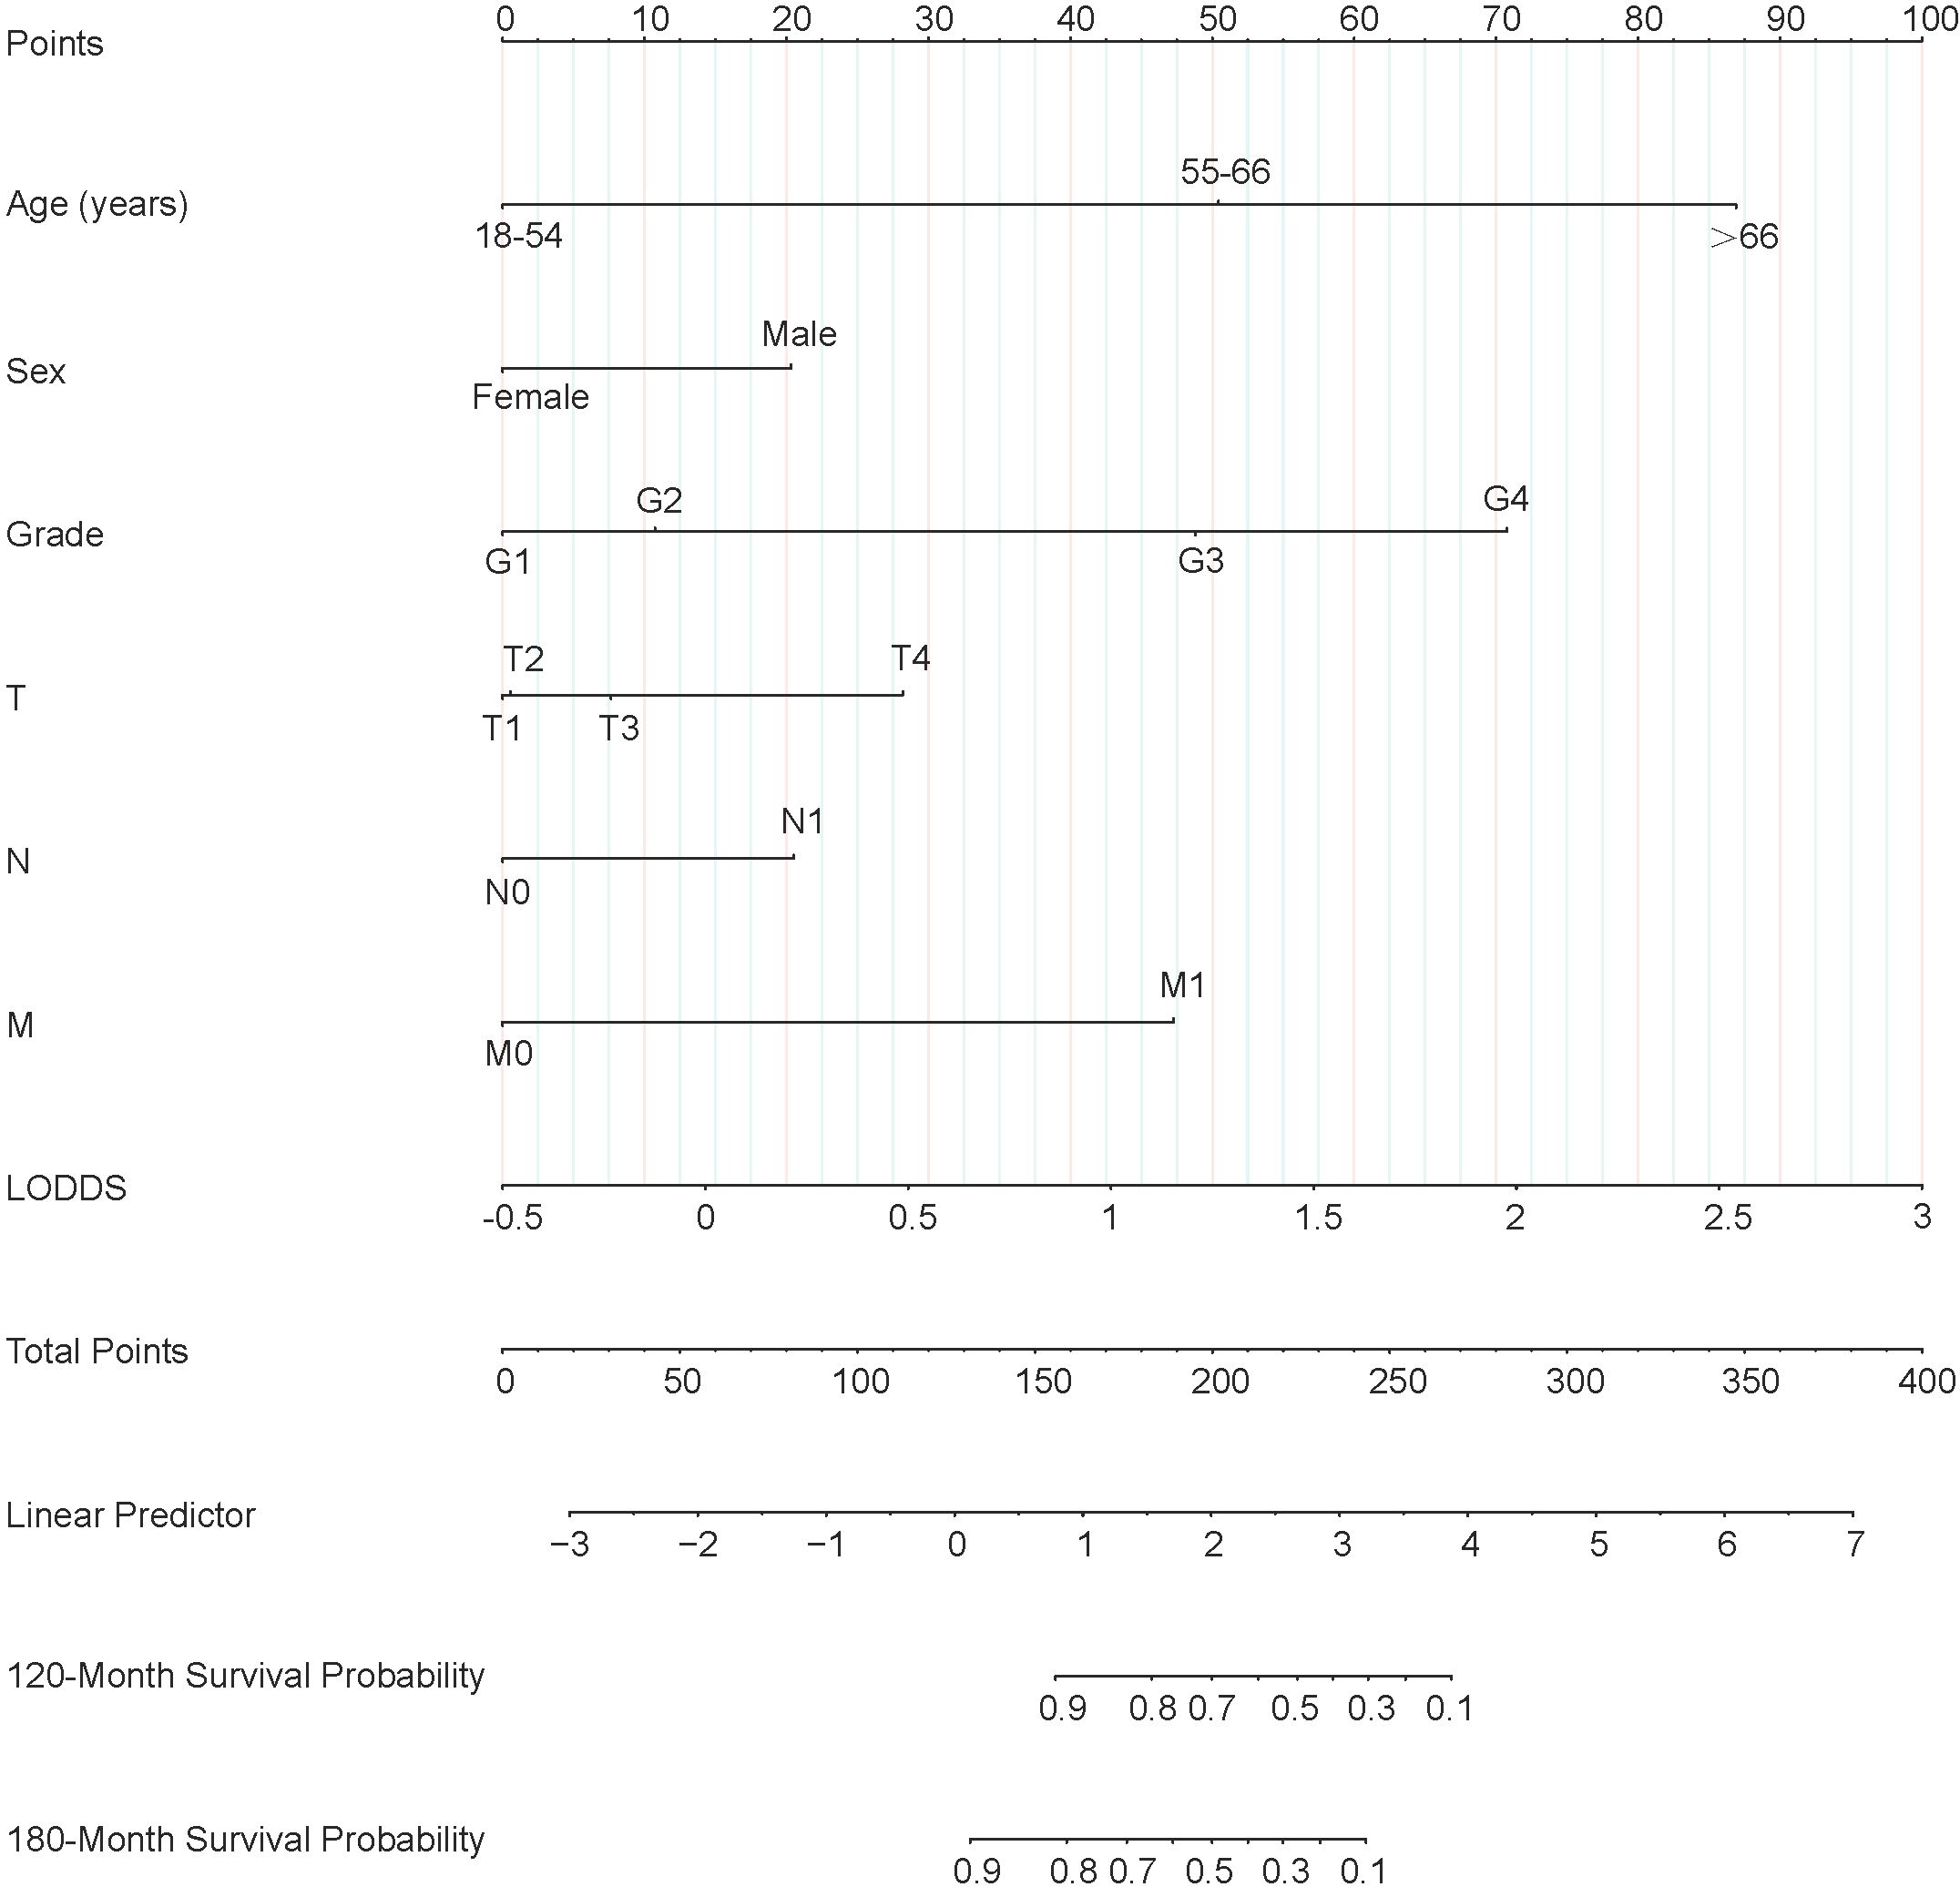
Figure 2. Nomogram predicting 120-month and 180-month OS of patients with PTC. OS, overall survival; PTC, papillary thyroid cancer; LODDS, log odds of positive lymph nodes.
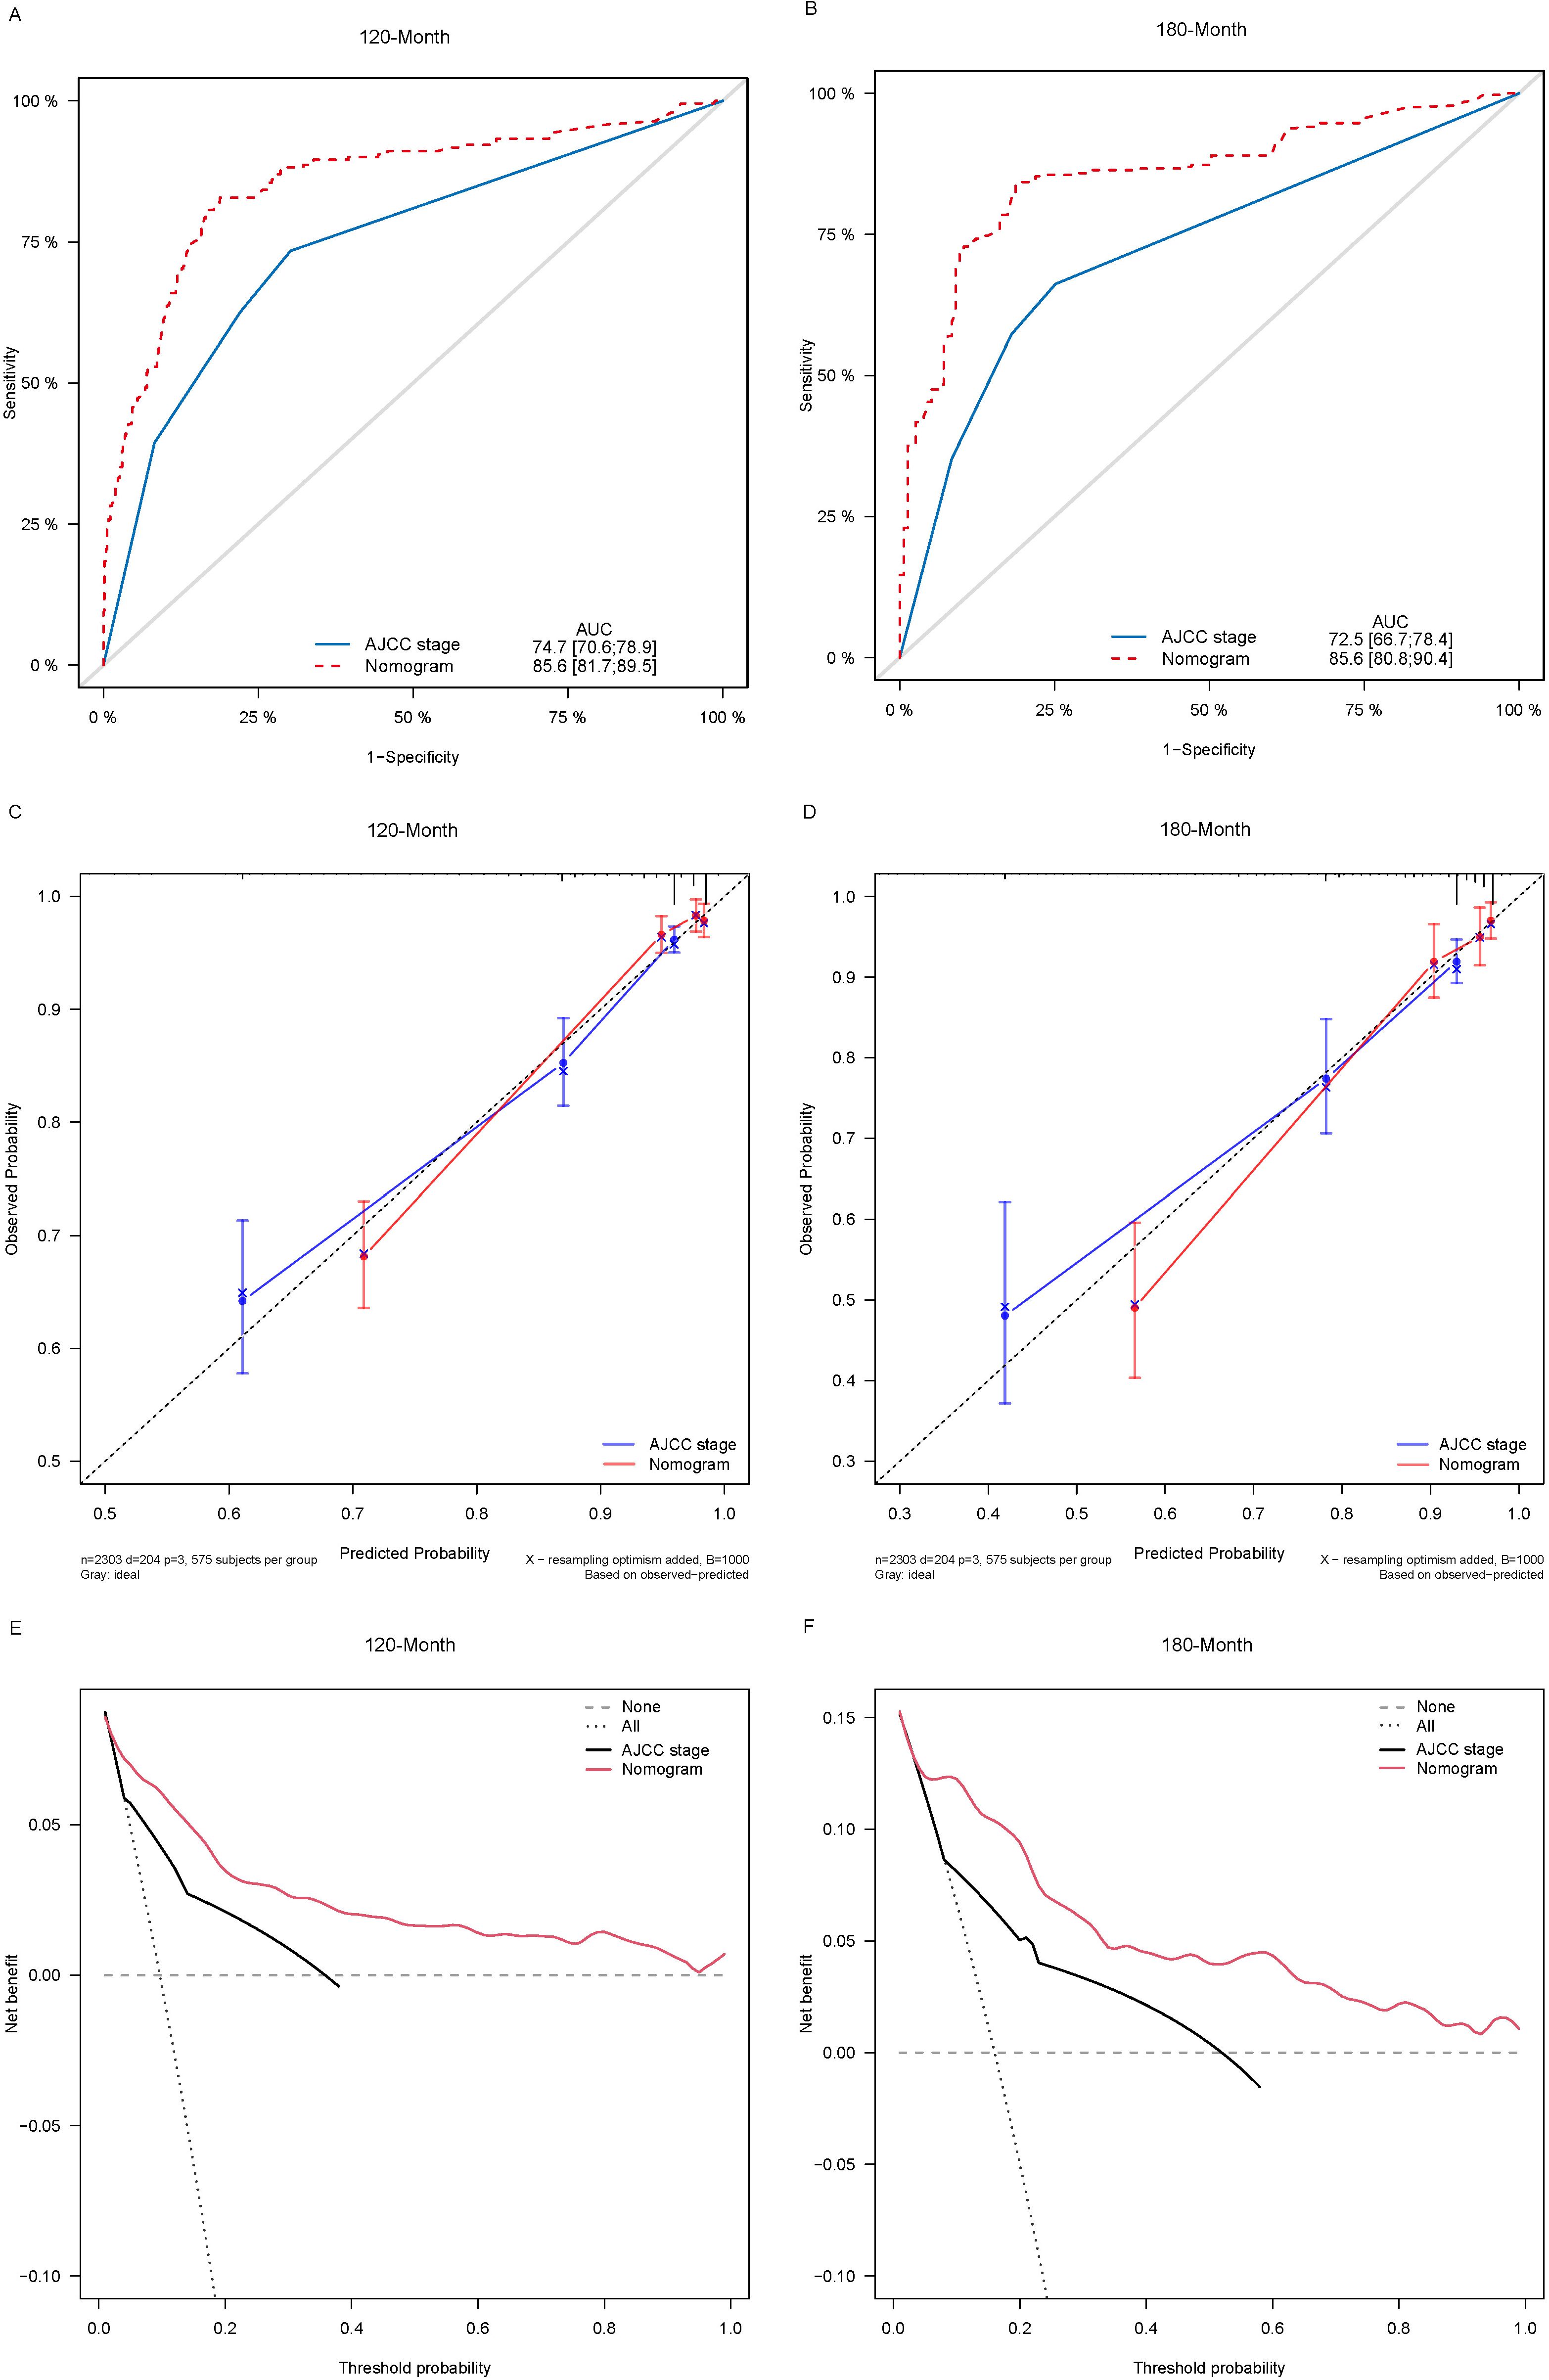
Figure 3. Comparison of the ROC curves (A, B), calibration plots (C, D), and decision curve analysis curves (E, F) of the two candidate models (AJCC stage and Nomogram) for 120- and 180-month OS prediction in the training cohort. ROC, receiver operating characteristic; OS, overall survival; AJCC, American Joint Committee on Cancer.
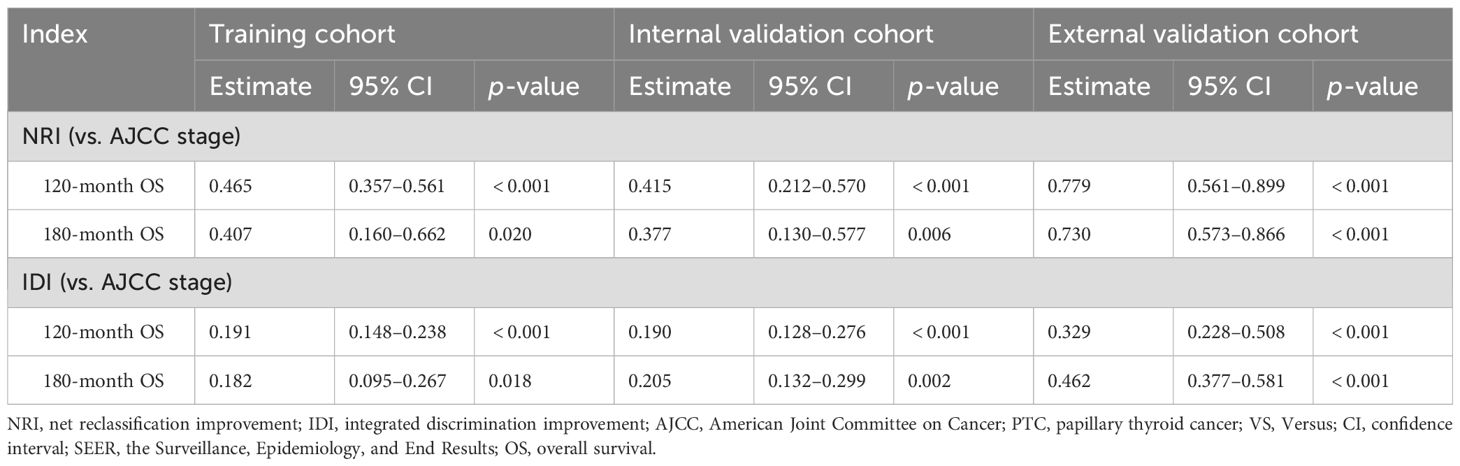
Table 4. NRI and IDI of the nomogram and the AJCC staging system in survival prediction for PTC patients.
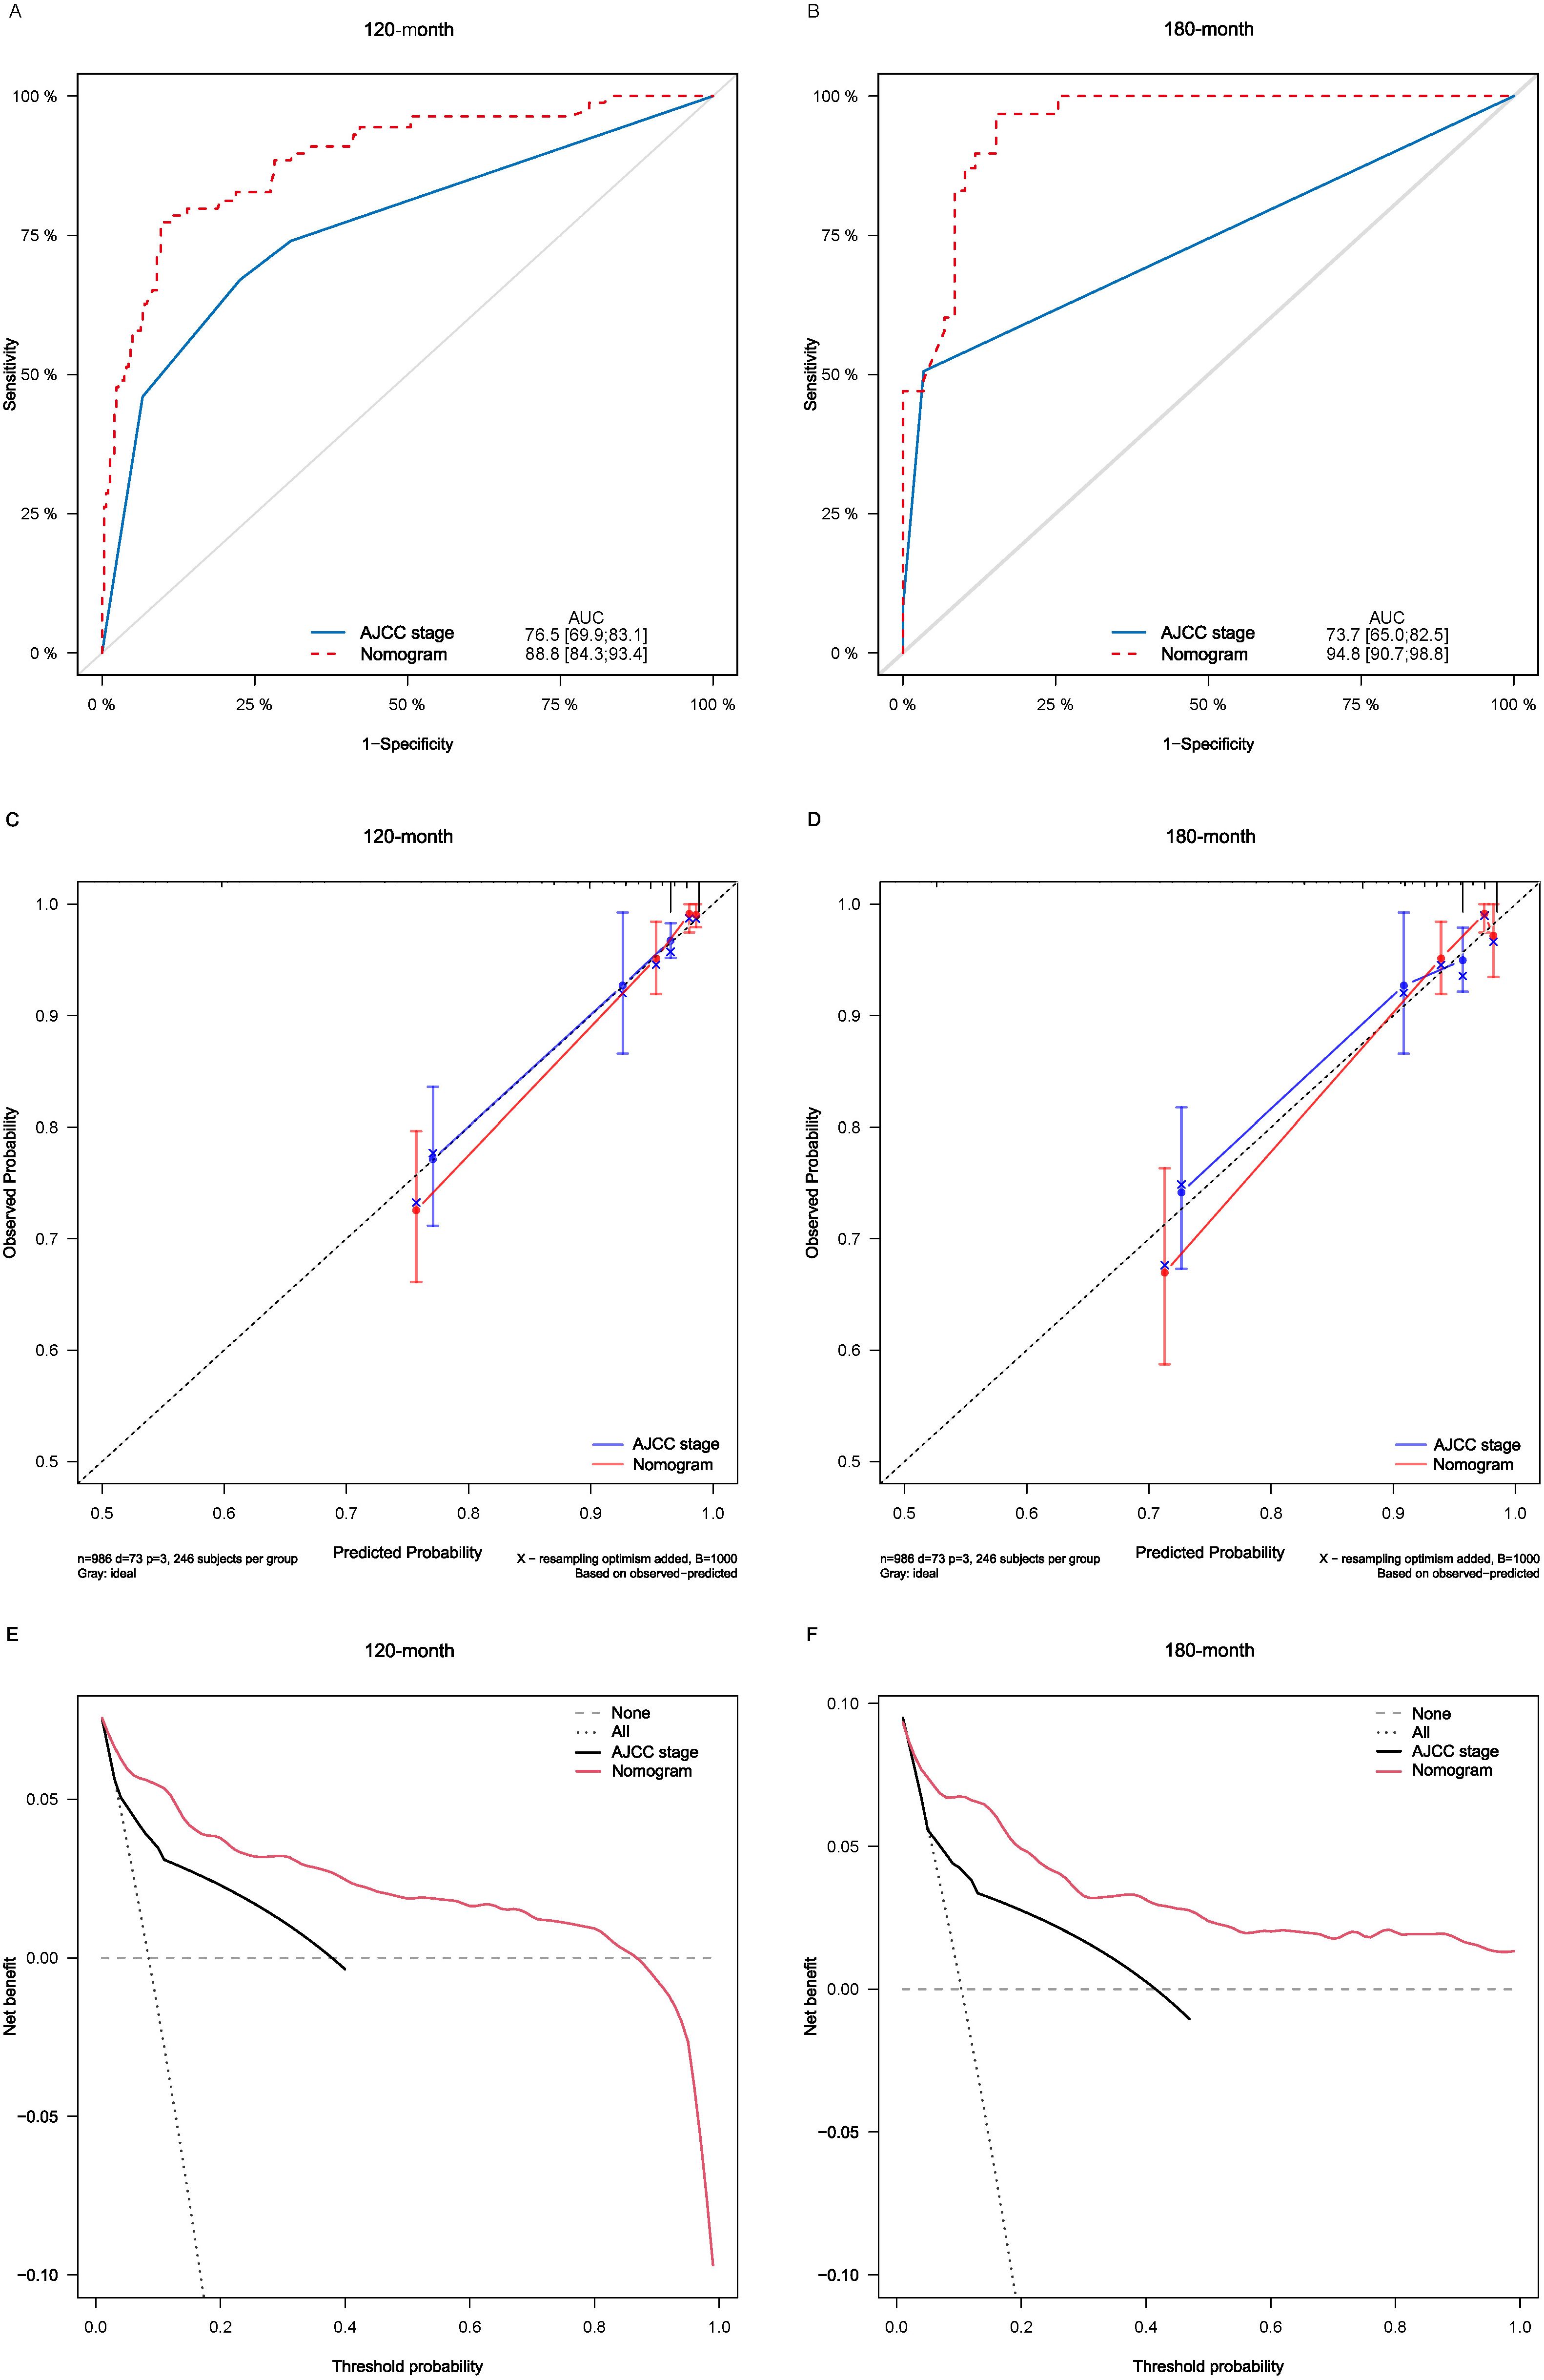
Figure 4. Comparison of the ROC curves (A, B), calibration plots (C, D), and decision curve analysis curves (E, F) of the two candidate models (AJCC stage and Nomogram) for 120- and 180-month OS prediction in the internal validation cohort. ROC, receiver operating characteristic; OS, overall survival; AJCC, American Joint Committee on Cancer.
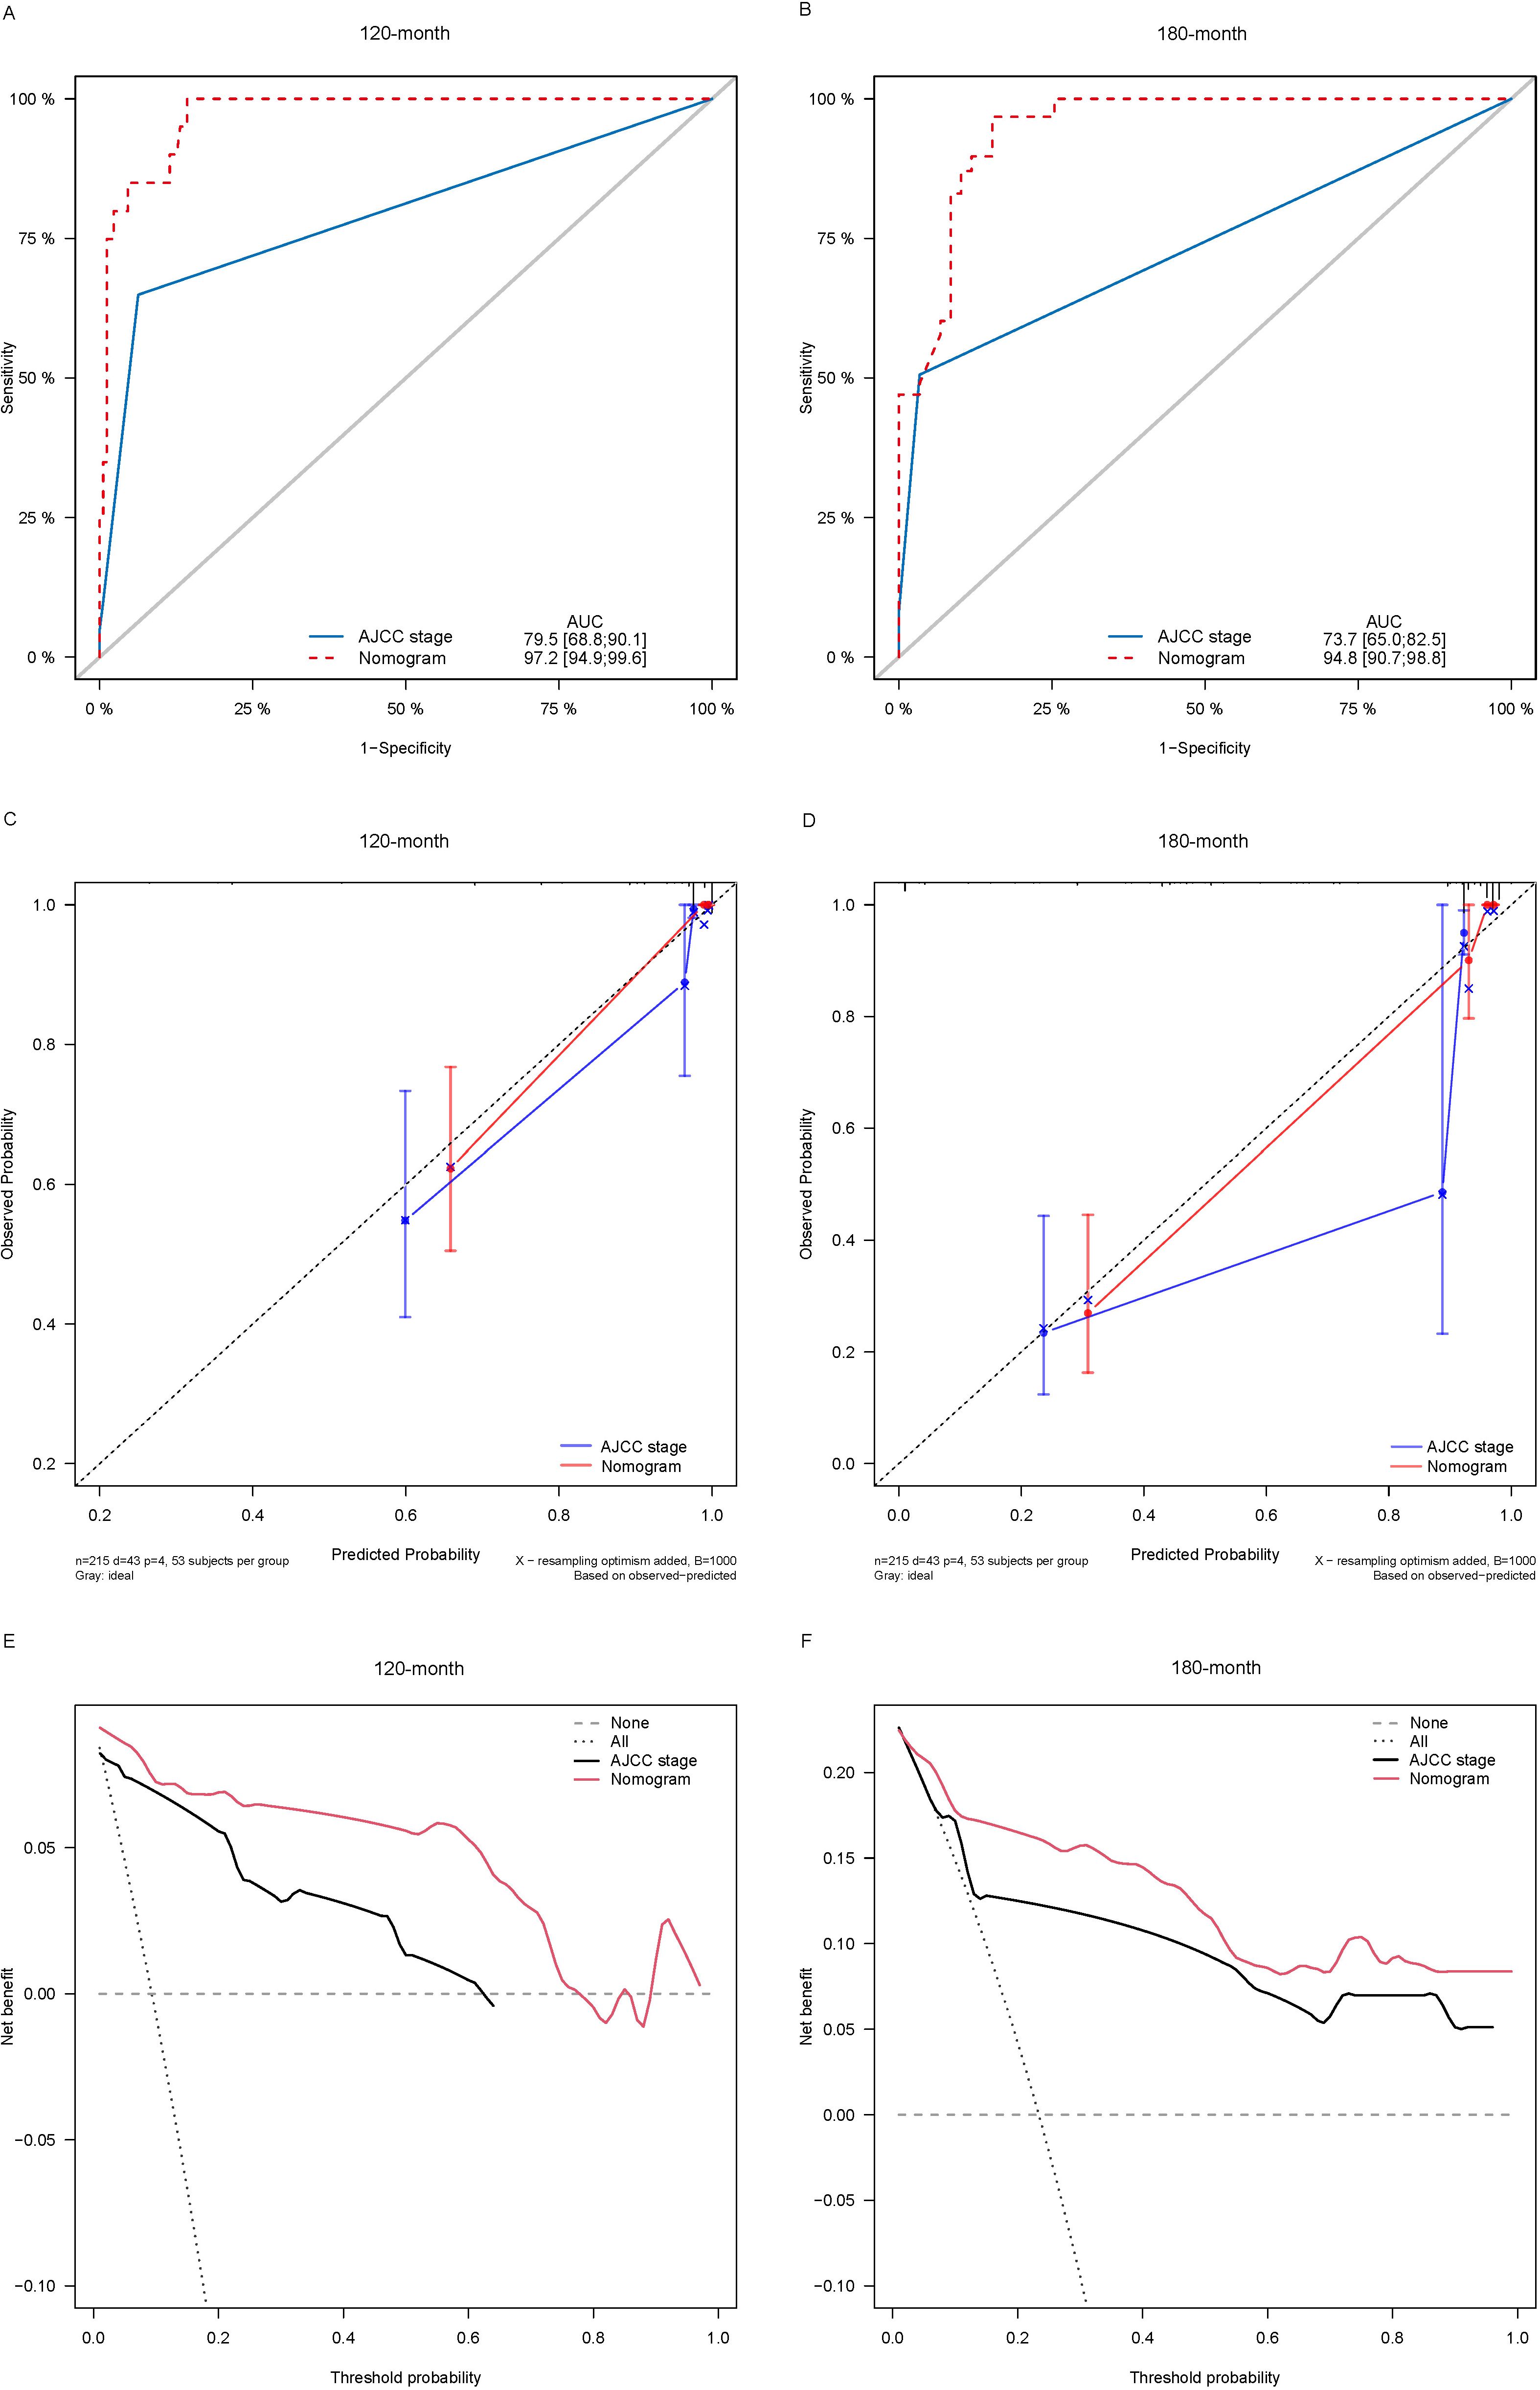
Figure 5. Comparison of the ROC curves (A, B), calibration plots (C, D), and decision curve analysis curves (E, F) of the two candidate models (AJCC stage and Nomogram) for 120- and 180-month OS prediction in the external validation cohort. ROC, receiver operating characteristic; OS, overall survival; AJCC, American Joint Committee on Cancer.
Using X-tiles software, patients were categorized into 3 subgroups based on the score calculated from the linear prediction of nomogram (Supplementary Figure S2): low-risk group (-1.67 ≤ linear score ≤ 0.55, 68 ≤ total score ≤ 107), medium-risk group (0.55 < linear score ≤ 2.19, 107 < total score ≤ 205) and high-risk group (2.19 < linear score ≤ 6.91, 205 < total score ≤ 378), which showed significant differences among the three risk groups by Kaplan-Maier curve analysis (Supplementary Figure S3).
Each variable of the nomogram was divided equally into multiple score points, and each category of these predictor variables corresponded to a score on the counting point. The corresponding scores for each variable are summed to obtain a total score, which is positioned on the total score reference scale, and then a straight line of the survival probability scale is plotted at the bottom to estimate the OS at 120 and 180 months based on the summed total scores of the variables. For example, for a male patient aged 55-66 years, with a postoperative pathological grade of G2, T3, N1, and no distant metastases, the total score would be about 153, which corresponds to an OS of about 90% at 120 months, and an OS of about 83%-85% at 180 months (Figure 6).
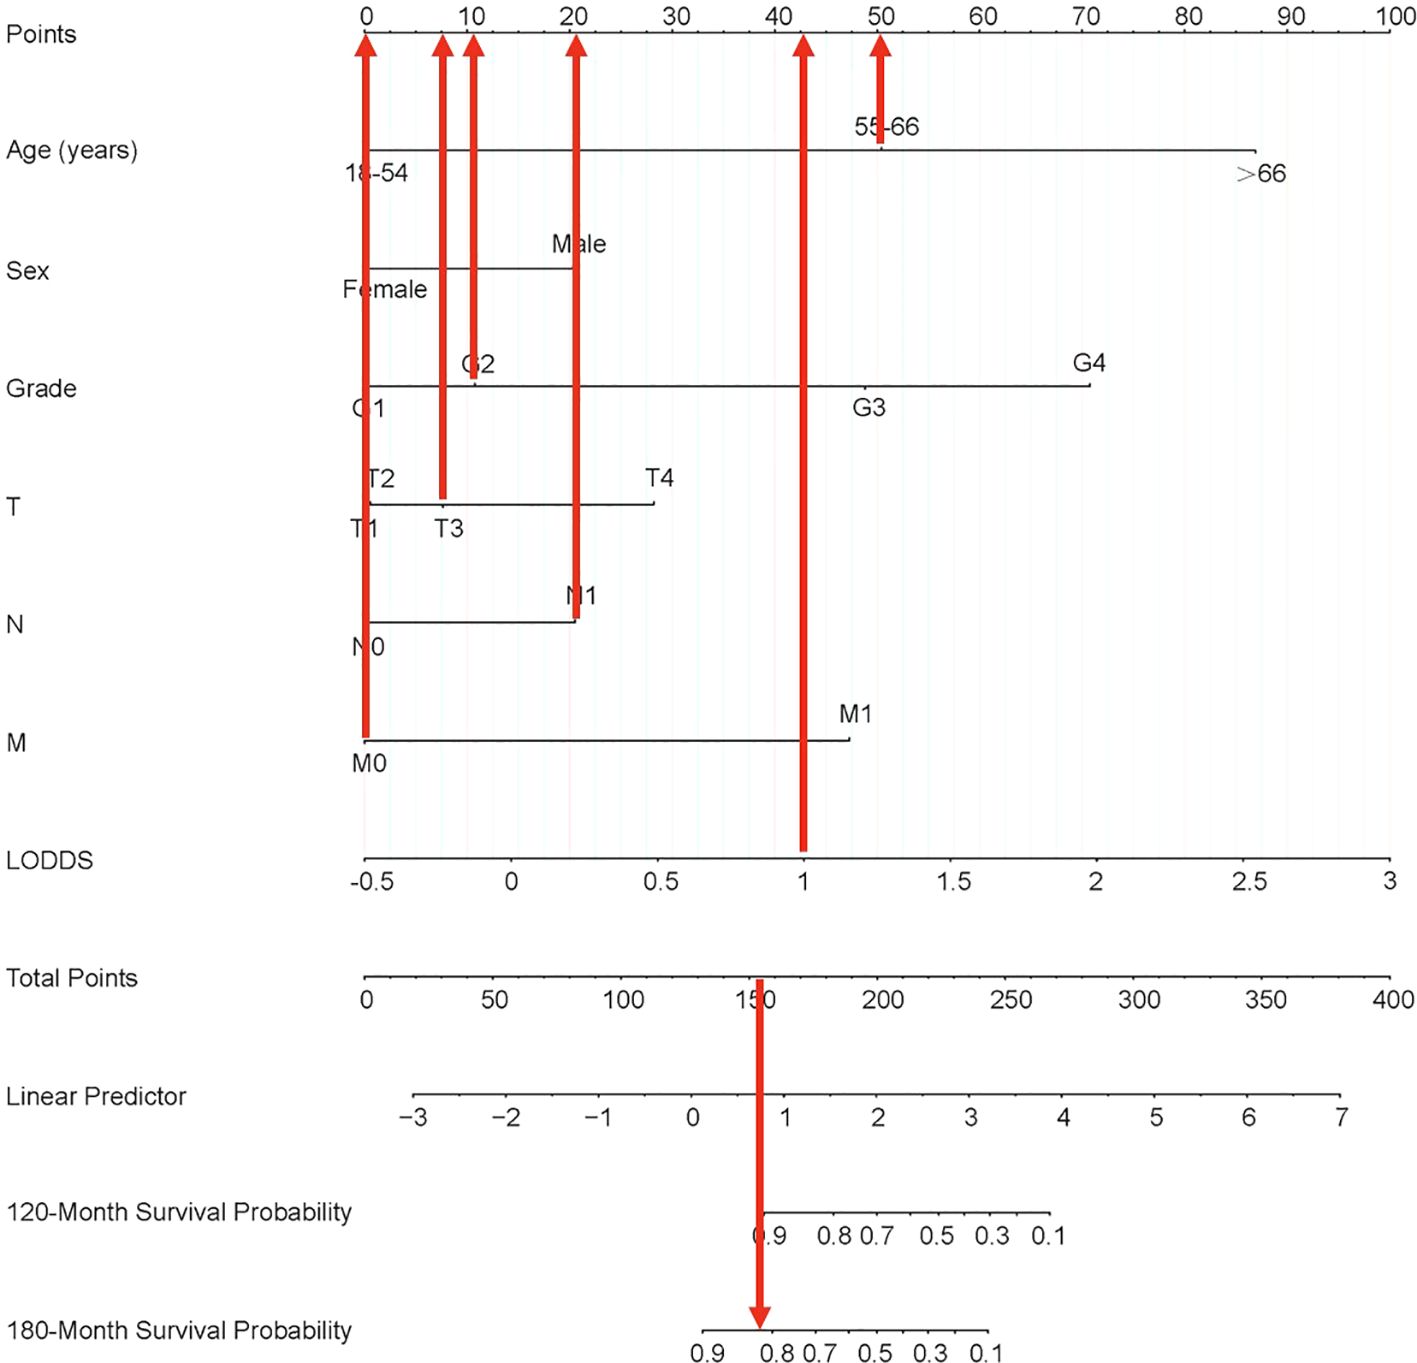
Figure 6. Nomogram clinical applications of nomogram predicting 120-month and 180-month OS of PTC patients. OS, overall survival; PTC, papillary thyroid cancer; LODDS, log odds of positive lymph nodes.
PTC is one of the most common clinical subgroups of primary thyroid tumors. Accurate and rational categorization of LN status is essential for staging and prognostic assessment of patients with PTC. In this study, LODDS was shown to be independently associated with long-term clinical prognosis in postoperative PTC patients. Secondly, we constructed a visualized nomogram combining the LODDS and routinely available clinical information to predict the long-term OS of individual PTC patients. To the best of our knowledge, this study is the first to investigate the postoperative prognostic value of the LODDS for PTC based on a national and international multicenter cohort, with a relatively large sample size and a more comprehensive source of patients. It also found that LODDS is a new prognostic factor that can characterize the relationship between LN metastatic status and prognosis after surgery in PTC patients. Our nomogram using the LODDS in combination with six other variables (age, sex, grade of differentiation, and TNM stage) allowed us to assess the long-term prognosis of patients at 120 months (10 years) and 180 months (15 years). The predictive accuracy was higher than that of the conventional AJCC staging system. Prognostic analysis based on this nomogram can help clinicians to guide the postoperative rehabilitation of PTC patients, and can also more actively promote long-term follow-up.
Regarding prognostic studies in PTC, there have been retrospective studies focusing on risk factors associated with the long-term prognosis of patients. LODDS was not the only prognostic factor in the nomogram. Compared to previous studies, our results were similar to previous results where age, gender, grade of differentiation, and TNM stage were selected as prognostic factors for OS. Aamna et al. had a long-term follow-up study of 538 patients with PTC who underwent surgical intervention in a medical center over 20 years. They found that age was one of the factors associated with the prognosis of PTC (24). Luo et al. developed a nomogram prediction model based on LNM using patient data from a single center and found that LN, age, and other localized LNM in patients with PTC have been identified as the important factors affecting the prognosis of malignant tumors. The 8th edition of AJCC staging for thyroid cancer categorizes lymph node metastasis in the neck overall as N1, further subdividing metastasis to unilateral or bilateral level IV or VII lymph nodes as N1a, and metastasis to unilateral, bilateral, or contralateral levels I-IV or retropharyngeal lymph nodes as N1b, without consideration of the statistical count of metastatic lymph nodes. However, as a new prognostic indicator based on the LN ratio, LODDS can be used as an independent prognostic factor in many cancer types, whether they are common malignant tumors such as gastric cancer (4), colorectal cancer (25), and endometrial cancer (26); or rare malignant tumors such as neuroendocrine cancer of the lungs (16), pancreatic cancer (5), and bile duct cancer (17). This makes our study theoretically grounded and inspired to also explore the role of LODDS in the prognosis of thyroid cancer. Due to the favorable prognosis of thyroid cancer, with a near 100% short-term survival rate, it has prompted contemplation regarding long-term survival in our research endeavors.
In recent years, there have also been studies examining the relationship between the number of LN and thyroid prognosis by combining data from publicly available databases and other medical centers. Wang et al. based on the SEER database and patient information from multiple centers, made improvements to the eighth edition of AJCC’s N staging by analyzing the number of LN in medullary cancer of the thyroid, which was similar to the way this study was conducted (27). However, this was performed only for medullary cancer with LN, and there is still a lack of studies related to LN for papillary cancer.
At this stage, the development of nomograms to assess the prognosis of patients with PTC has been widely studied. Garo et al. conducted a systematic evaluation and analysis of previously established nomogram related to PTC (28) and found only one nomogram model for OS, which had an accuracy value of only 0.77, and it was not validated using an external validation cohort. Our study bridges the gaping problem that existed in previous studies. Currently, there remains a deficiency in the identification of novel prognostic variables associated with prognosis when utilizing the nomogram system to assess the prognosis of patients with PTC. While existing staging categorizes PTC, its application by clinicians to evaluate individual patient cases is overly generalized. The AJCC staging system exhibits relatively lower accuracy in predicting long-term prognosis, necessitating further exploration for more precise prognostic methodologies.
Although the LODDS based nomogram constructed in this study showed high accuracy in predicting the prognosis of patients with PTC, there are still some limitations. First, although the SEER database contains a large volume of data, it lacks detailed patient medical histories and data on diagnostic procedures, such as past medical history, thyroid pathological molecular markers, radiotherapy dosage, and specific drugs and dosages used in chemotherapy. Second, patients’ genetic information is not available in databases. More and more studies have shown that genetic mutations (e.g., BRAF V600E, TERT promoter mutations) (29) and epigenetic alterations (e.g., DNA methylation, noncoding RNA expression) (30) play important roles in the occurrence, development, and prognosis of PTC. For example, BRAF V600E mutation is strongly associated with aggressiveness and poor prognosis of PTC, while the expression levels of certain miRNAs may be associated with the risk of lymph node metastasis and recurrence (15). Our study was mainly based on clinicopathologic factors and did not include genetic and epigenetic factors. In addition, single-center externally validated cases lacked pooling of hematology results and imaging results, and require further expansion and optimization both in terms of population size and source prevalence, which gives us further direction for future research efforts.
With the current study, we found that the LODDS was associated with prognosis in PTC and had a more significant prognostic correlation than other LN staging. The new nomogram also showed better prognostic assessment value in predicting postoperative OS in patients with PTC than the AJCC staging system counted in the SEER database. Patients stratified into low-risk, medium-risk, and high-risk groups based on their LODDS scores display significant differences in long-term OS according to Kaplan-Meier analysis, thereby facilitating better risk stratification for prognosis. In summary, our developed predictive LODDS staging system outperforms traditional staging systems, aiding clinicians in identifying high-risk populations and accurately assessing long-term prognosis.
In conclusion, we identified factors that influence postoperative survival in patients with PTC. For the first time, our population-based and aforementioned factor-based study established nomograms for PTC patients undergoing surgery that predicted patients’ 120-month survival and 180-month survival, as well as possible prognosis in the long-term. The established nomograms objectively showed good accuracy and clinical applicability and provided prognostic information of limited value, providing an individualized, long-term clinical prognostic reference for the treatment of PTC patients.
The raw data supporting the conclusions of this article will be made available by the authors, without undue reservation.
The studies involving humans were approved by The Ethics Committee of Cixi Hospital. The studies were conducted in accordance with the local legislation and institutional requirements. Written informed consent for participation was not required from the participants or the participants’ legal guardians/next of kin because this is a retrospective study.
SJ: Conceptualization, Data curation, Investigation, Validation, Writing – original draft. JS: Conceptualization, Data curation, Software, Validation, Writing – original draft. YD: Data curation, Formal analysis, Software, Validation, Writing – original draft. JX: Data curation, Formal analysis, Validation, Writing – original draft. JM: Conceptualization, Supervision, Validation, Writing – original draft, Writing – review & editing. ZW: Conceptualization, Supervision, Validation, Writing – original draft, Writing – review & editing.
The author(s) declare financial support was received for the research, authorship, and/or publication of this article. This project was supported by the Project of CIXI Leading Medical & Health Discipline (No. 2023-ZD07).
The authors thank the editor and reviewers for their positive and constructive comments and suggestions on our manuscript.
The authors declare that the research was conducted in the absence of any commercial or financial relationships that could be construed as a potential conflict of interest.
All claims expressed in this article are solely those of the authors and do not necessarily represent those of their affiliated organizations, or those of the publisher, the editors and the reviewers. Any product that may be evaluated in this article, or claim that may be made by its manufacturer, is not guaranteed or endorsed by the publisher.
The Supplementary Material for this article can be found online at: https://www.frontiersin.org/articles/10.3389/fendo.2025.1411426/full#supplementary-material
Supplementary Figure 1 | To further narrow the range of variables involved in the regression analysis, the parameters were adjusted by 10-fold cross-validation, and established using the least absolute shrinkage and selection operator (LASSO) in the Cox model in the training cohort (A). Combining the distribution of LASSO coefficients for eleven variables (age, sex, grade, T stage, N stage, M stage, surgery, PLN, NLN, LODDS and chemotherapy) in PTC patients, an optimal lambda filter was used to generate six variables (age, sex, grade, T stage, N stage, M stage, and LODDS) with non-zero coefficients (B). PLN, positive lymph nodes; NLN, negative lymph nodes; LODDS, log odds of positive lymph nodes; PTC, papillary thyroid cancer.
Supplementary Figure 2 | X-tile cutoff analysis.
Supplementary Figure 3 | Risk stratification Kaplan-Meier overall survival curve for patients in the training cohort after completion of cut-off analysis at X-tile.
1. Siegel RL, Miller KD, Wagle NS, Jemal A. Cancer statistics, 2023. CA Cancer J Clin. (2023) 73:17–48. doi: 10.3322/caac.21763
2. Miranda-Filho A, Lortet-Tieulent J, Bray F, Cao B, Franceschi S, Vaccarella S, et al. Thyroid cancer incidence trends by histology in 25 countries: a population-based study. Lancet Diabetes Endocrinol. (2021) 9:225–34. doi: 10.1016/S2213-8587(21)00027-9
3. Luo S, Lai F, Liang R, Li B, He Y, Chen W, et al. Clinical prediction models for cervical lymph node metastasis of papillary thyroid carcinoma. Endocrine. (2024) 84:646–55. doi: 10.1007/s12020-023-03632-z
4. Spolverato G, Ejaz A, Kim Y, Squires MH, Poultsides G, Fields RC, et al. Prognostic performance of different lymph node staging systems after curative intent resection for gastric adenocarcinoma. Ann Surg. (2015) 262:991–8. doi: 10.1097/SLA.0000000000001040
5. Morales-Oyarvide V, Rubinson DA, Dunne RF, Kozak MM, Bui JL, Yuan C, et al. Lymph node metastases in resected pancreatic ductal adenocarcinoma: predictors of disease recurrence and survival. Br J Cancer. (2017) 117:1874–82. doi: 10.1038/bjc.2017.349
6. Dai Z-H, Wang Q-W, Zhang Q-W, Yan X-L, Aparicio T, Zhou Y-Y, et al. Personalized four-category staging for predicting prognosis in patients with small bowel Adenocarcinoma: an international development and validation study. EBioMedicine. (2020) 60:102979. doi: 10.1016/j.ebiom.2020.102979
7. Amin MB, Greene FL, Edge SB, Compton CC, Gershenwald JE, Brookland RK, et al. The Eighth Edition AJCC Cancer Staging Manual: Continuing to build a bridge from a population-based to a more “personalized” approach to cancer staging. CA Cancer J Clin. (2017) 67:93–9. doi: 10.3322/caac.21388
8. Hensley PJ, Labbate C, Zganjar A, Howard J, Huelster H, Durdin T, et al. Development and validation of a multivariable nomogram predictive of post-nephroureterectomy renal function. Eur Urol Oncol. (2024) 7(6):1313–9. doi: 10.1016/j.euo.2024.01.005
9. McEvoy AM, Hippe DS, Lachance K, Park S, Cahill K, Redman M, et al. Merkel cell carcinoma recurrence risk estimation is improved by integrating factors beyond cancer stage: A multivariable model and web-based calculator. J Am Acad Dermatol. (2024) 90:569–76. doi: 10.1016/j.jaad.2023.11.020
10. Song J, Di Y, Kang X, Ren G, Wang Y. Development and validation of a nomogram to predict cancer-specific survival with unresected cholangiocarcinoma undergoing external radiotherapy. Front Public Health. (2023) 11:1012069. doi: 10.3389/fpubh.2023.1012069
11. Pathak KA, Mazurat A, Lambert P, Klonisch T, Nason RW. Prognostic nomograms to predict oncological outcome of thyroid cancers. J Clin Endocrinol Metab. (2013) 98:4768–75. doi: 10.1210/jc.2013-2318
12. Guo P, Wang X, Xia L, Shawureding N, Hu Z. Analysis of factors associated with the prognosis of papillary thyroid cancer and the construction of a survival model. Cancer Med. (2023) 12:7868–76. doi: 10.1002/cam4.5555
13. Wu SS, Joshi N, Sharrett J, Rao S, Shah A, Scharpf J, et al. Risk factors associated with recurrence and death in patients with tall cell papillary thyroid cancer: A single-institution cohort study with predictive nomogram. JAMA Otolaryngol– Head Neck Surg. (2023) 149:79–86. doi: 10.1001/jamaoto.2022.3781
14. Chang L, Zhang Y, Zhu J, Hu L, Wang X, Zhang H, et al. An integrated nomogram combining deep learning, clinical characteristics and ultrasound features for predicting central lymph node metastasis in papillary thyroid cancer: A multicenter study. Front Endocrinol. (2023) 14:964074. doi: 10.3389/fendo.2023.964074
15. Xia Y, Jiang X, Huang Y, Liu Q, Huang Y, Zhang B, et al. Construction of a tumor immune microenvironment-related prognostic model in BRAF-mutated papillary thyroid cancer. Front Endocrinol. (2022) 13:895428. doi: 10.3389/fendo.2022.895428
16. Wang S, Wei J, Guo Y, Xu Q, Lv X, Yu Y, et al. Construction and validation of nomograms based on the log odds of positive lymph nodes to predict the prognosis of lung neuroendocrine tumors. Front Immunol. (2022) 13:987881. doi: 10.3389/fimmu.2022.987881
17. Jiang S, Yang F, Zhang L, Sang X, Lu X, Zheng Y, et al. A prognostic nomogram based on log odds of positive lymph nodes to predict the overall survival in biliary neuroendocrine neoplasms (NENs) patients after surgery. J Endocrinol Invest. (2022) 45:2341–51. doi: 10.1007/s40618-022-01874-8
18. Che K, Wang Y, Wu N, Liu Q, Yang J, Liu B, et al. Prognostic nomograms based on three lymph node classification systems for resected gastric adenocarcinoma: A large population-based cohort study and external validation. Ann Surg Oncol. (2021) 28:8937–49. doi: 10.1245/s10434-021-10299-1
19. Collins GS, Reitsma JB, Altman DG, Moons KGM. Transparent reporting of a multivariable prediction model for individual prognosis or diagnosis (TRIPOD). Circulation. (2015) 131:211–9. doi: 10.1161/CIRCULATIONAHA.114.014508
20. Cronin KA, Ries LAG, Edwards BK. The surveillance, epidemiology, and end results (SEER) program of the national cancer institute. Cancer. (2014) 120 Suppl 23:3755–7. doi: 10.1002/cncr.29049
21. Goodyear MDE, Krleza-Jeric K, Lemmens T. The declaration of Helsinki. BMJ. (2007) 335:624–5. doi: 10.1136/bmj.39339.610000.BE
22. Camp RL, Dolled-Filhart M, Rimm DL. X-tile: a new bio-informatics tool for biomarker assessment and outcome-based cut-point optimization. Clin Cancer Res Off J Am Assoc Cancer Res. (2004) 10:7252–9. doi: 10.1158/1078-0432.CCR-04-0713
23. Song J, Kang X, Di Y, Ren G, Wang Y. Associations between external beam radiotherapy and overall survival in patients with gallbladder cancer: A population-based study. Front Public Health. (2022) 10:1012142. doi: 10.3389/fpubh.2022.1012142
24. Hassan A, Razi M, Riaz S, Khalid M, Nawaz MK, Syed AA, et al. Survival analysis of papillary thyroid carcinoma in relation to stage and recurrence risk: A 20-year experience in Pakistan. Clin Nucl Med. (2016) 41:606. doi: 10.1097/RLU.0000000000001237
25. Zhou Y-Y, Du X-J, Zhang C-H, Aparicio T, Zaanan A, Afchain P, et al. Comparison of three lymph node staging schemes for predicting the outcome in patients with small bowel adenocarcinoma: A population-based cohort and international multicentre cohort study. EBioMedicine. (2019) 41:276–85. doi: 10.1016/j.ebiom.2019.02.043
26. Yang X-L, Huang H, Kou L-N, Lai H, Chen X-P, Wu D-J. Construction and validation of a prognostic model for stage IIIC endometrial cancer patients after surgery. Eur J Surg Oncol J Eur Soc Surg Oncol Br Assoc Surg Oncol. (2022) 48:1173–80. doi: 10.1016/j.ejso.2021.12.462
27. Wang Z, Fan X, Zha X, Xu Y, Yin Z, Rixiati Y, et al. A proposed modified staging system for medullary thyroid cancer: A SEER analysis with multicenter validation. Oncol. (2023) 29:e59–67. doi: 10.1093/oncolo/oyad165
28. Luisa Garo M, Deandreis D, Campennì A, Vrachimis A, Petranovic Ovcaricek P, Giovanella L. Accuracy of papillary thyroid cancer prognostic nomograms: a systematic review. Endocr Connect. (2023) 12:e220457. doi: 10.1530/EC-22-0457
29. Xing M, Alzahrani AS, Carson KA, Viola D, Elisei R, Bendlova B, et al. Association between BRAF V600E mutation and mortality in patients with papillary thyroid cancer. JAMA. (2013) 309:1493–501. doi: 10.1001/jama.2013.3190
Keywords: papillary thyroid cancer, nomogram, SEER, post-operative, long-term overall survival
Citation: Jing S, Song J, Di Y, Xiao J, Ma J and Wu Z (2025) Construction and validation of novel nomograms based on the log odds of positive lymph nodes to predict the prognosis of papillary thyroid cancer: a retrospective cohort study. Front. Endocrinol. 16:1411426. doi: 10.3389/fendo.2025.1411426
Received: 20 June 2024; Accepted: 14 February 2025;
Published: 07 March 2025.
Edited by:
Shigao Huang, Air Force Medical University, ChinaReviewed by:
Savvas Lampridis, Imperial College London, United KingdomCopyright © 2025 Jing, Song, Di, Xiao, Ma and Wu. This is an open-access article distributed under the terms of the Creative Commons Attribution License (CC BY). The use, distribution or reproduction in other forums is permitted, provided the original author(s) and the copyright owner(s) are credited and that the original publication in this journal is cited, in accordance with accepted academic practice. No use, distribution or reproduction is permitted which does not comply with these terms.
*Correspondence: Jiazhao Song, anpzb25nMTEyNEBob3RtYWlsLmNvbQ==; Jianke Ma, aHVnb21hamlhbmtlQDEyNi5jb20=; Zimiao Wu, MTM4NTgyOTc1NjhAMTYzLmNvbQ==
†These authors have contributed equally to this work
‡ORCID: Saisai Jing, orcid.org/0009-0006-1702-2881
Jiazhao Song, orcid.org/0000-0001-5272-448X
Yupeng Di, orcid.org/0000-0002-1635-8918
Jianke Ma, orcid.org/0009-0007-7504-8358
Disclaimer: All claims expressed in this article are solely those of the authors and do not necessarily represent those of their affiliated organizations, or those of the publisher, the editors and the reviewers. Any product that may be evaluated in this article or claim that may be made by its manufacturer is not guaranteed or endorsed by the publisher.
Research integrity at Frontiers
Learn more about the work of our research integrity team to safeguard the quality of each article we publish.