- 1Department of Neurosurgery, National Regional Medical Center, Binhai Campus of the First Affiliated Hospital, Fujian Medical University, Fuzhou, Fujian, China
- 2Department of Neurosurgery, Neurosurgery Research Institute, The First Affiliated Hospital, Fujian Medical University, Fuzhou, Fujian, China
- 3Department of Neurosurgery, Xuanwu Hospital, Capital Medical University, China International Neuroscience Institute, Beijing, China
- 4Fujian Provincial Institutes of Brain Disorders and Brain Sciences, First Affiliated Hospital, Fujian Medical University, Fuzhou, Fujian, China
Objective: Preoperative prediction of visual recovery after pituitary adenoma resection surgery remains challenging. This study aimed to investigate the value of clinical and radiological features in preoperatively predicting visual outcomes after surgery.
Methods: Patients undergoing endoscopic transsphenoidal surgery (ETS) for pituitary adenoma were included in this retrospective and prospective study. Preoperative MRI, visual acuity, visual field, and postoperative visual recovery data were collected. Logistic regression analysis was used to assess the importance of clinical and MRI features, and a prediction model was developed.
Results: The cohort included 198 patients (150 retrospective, 48 prospective). In the retrospective data, visual recovery was observed in 111 patients (74.0%), while non-recovery was observed in 39 patients (26.0%). In the prospective data, visual recovery was observed in 27 patients (56.25%) and non-recovery in 21 patients (43.75%). Blindness, headache, adenoma area, and adenoma upward growth distance were negatively correlated with visual recovery (p < 0.05), while the pituitary gland area was positively correlated (p = 0.001). Logistic regression selected three clinical features: blindness, headache, and visual impairment course. Two additional imaging features, pituitary gland maximum area, and adenoma maximum area, were incorporated into the prediction model. The area under the curve of the prediction model was 0.944 in the retrospective cohort and 0.857 in the prospective cohort. Accuracy was 88% and 81.25%, respectively.
Conclusion: This study successfully developed a clinical practical model combining clinical and radiological features to preoperatively predict visual recovery for patients with pituitary adenoma. The model has the potential to provide personalized counseling for individual patients.
1 Introduction
Pituitary adenoma constitutes the most prevalent types of central nervous system adenoma, comprising 12-15% of intracranial adenoma (1). These adenomas can manifest as endocrine abnormalities, visual impairment, headache, and cognitive dysfunction. Visual impairment, arising from the adenoma’s characteristic upward growth and compression of the optic chiasma, stands out as the predominant symptom, reported by 32% to 70% of patients (2). The primary manifestations of visual impairment encompass reduced visual acuity (VA) and defects in the visual field (VF) (3).
Endoscopic transsphenoidal surgery (ETS) represents the principal method for alleviating symptoms resulting from adenoma compression, facilitating visual recovery in patients with secondary visual impairment due to pituitary adenoma. Existing studies have indicated that factors such as patient age, adenoma size, symptom course, and preoperative visual field defects significantly impact the postoperative recovery of visual impairment (4–8). Despite these findings, a preoperative clinical solution capable of predicting postoperative visual acuity recovery and quantifying the extent of postoperative recovery remains a challenge.
Prior research has proposed that evaluating the extent of upward extension of pituitary adenoma through magnetic resonance imaging (MRI) could serve as a predictor for the degree of visual impairment in individuals with non-functioning pituitary adenoma (NFPA) featuring optic chiasm compression (9). Additionally, Optical coherence tomography (OCT) was used to measure the thickness of the retinal nerve fiber layer (RNFL), offering a method to forecast the extent of postoperative visual recovery in patients (10). Subsequently, Li et al. employed OCT to measure macular ganglion cell-inner plexiform layer thickness (mGCIPL), a direct indicator of ganglion cell injury severity, aiming to predict postoperative visual recovery (11, 12). Furthermore, there has been exploration into the use of optic chiasma analysis on conventional MR imaging for preoperative prediction of visual recovery following surgical decompression. It is worth noting, however, that the model exhibited limitations in predicting outcomes for patients with severe compression of the optic chiasm, especially for patients with invisible optic chiasm on preoperative MRI (13).
Previous studies have indicated that the recovery of patients’ visual acuity after surgery is intricately linked to multiple factors (14). Consequently, relying on a single factor alone may not provide a comprehensive explanation of patient prognosis. Presently, model construction based on the assignment of weights to multiple factors offers the potential for achieving more accurate clinical outcomes in a convenient and expeditious manner. Earlier investigations have demonstrated that integrating imaging data with clinical features can enhance the preoperative diagnosis and prognosis of pituitary adenoma (15).
In this study, we retrospectively included 150 patients and conducted an analysis of the correlation between preoperative clinical features and imaging characteristics and the recovery of postoperative visual acuity. We developed a model based on preoperative clinical features and imaging characteristics. To validate the preoperative predictive capability of the model for visual prognosis, we prospectively included 48 patients.
2 Methods
2.1 patients
In this study, we conducted a retrospective review of 150 patients presenting with visual impairment due to PAs who were treated at the First Affiliated Hospital of Fujian Medical University between January 2018 and December 2022. Additionally, we prospectively analyzed 48 patients with pituitary adenoma-related visual impairment treated at the same hospital from January 2023 to June 2023. Comprehensive medical records were available for all cases before surgery, encompassing details such as age, gender, initial symptoms, symptom course, ophthalmic evaluation, pituitary gland MRI, and postoperative pathology reports.
The inclusion criteria included: 1) Patients diagnosed with PAs who underwent endoscopic transsphenoidal surgery (ETS). 2) Absence of other causes of vision loss, as confirmed by ophthalmological assessment. 3) MRI evidence indicating optic nerve compression. 4) Availability of complete postoperative follow-up data.
Exclusion criteria included: 1) Prior history of anterior, posterior, or optic nerve diseases (excluding compressive optic neuropathy), such as glaucoma, local incision, or optic nerve hemorrhage. 2) Exclusion of patients with unreliable preoperative visual field testing.
2.2 Image data
Sellar region MR images were conducted on all patients through pituitary gland scanning utilizing 1.5T and 3.0T MRI scanners. The scanning protocol comprised T1-weighted images (T1WI), T2-weighted images (T2WI), and T1-enhanced sequences, each with a thickness of 3 mm. The obtained images were subjected to automatic segmentation using deep learning on coronal images, classifying them into eight categories: background, pituitary adenoma (PA), normal pituitary gland, right internal carotid artery (ICA), right cavernous sinus (CS), left ICA, left CS, and optic chiasm (OC) (Figure 1) (16). Subsequently, the segmentation results were manually reviewed and modified by two senior neurosurgeons with 10 years of experience.
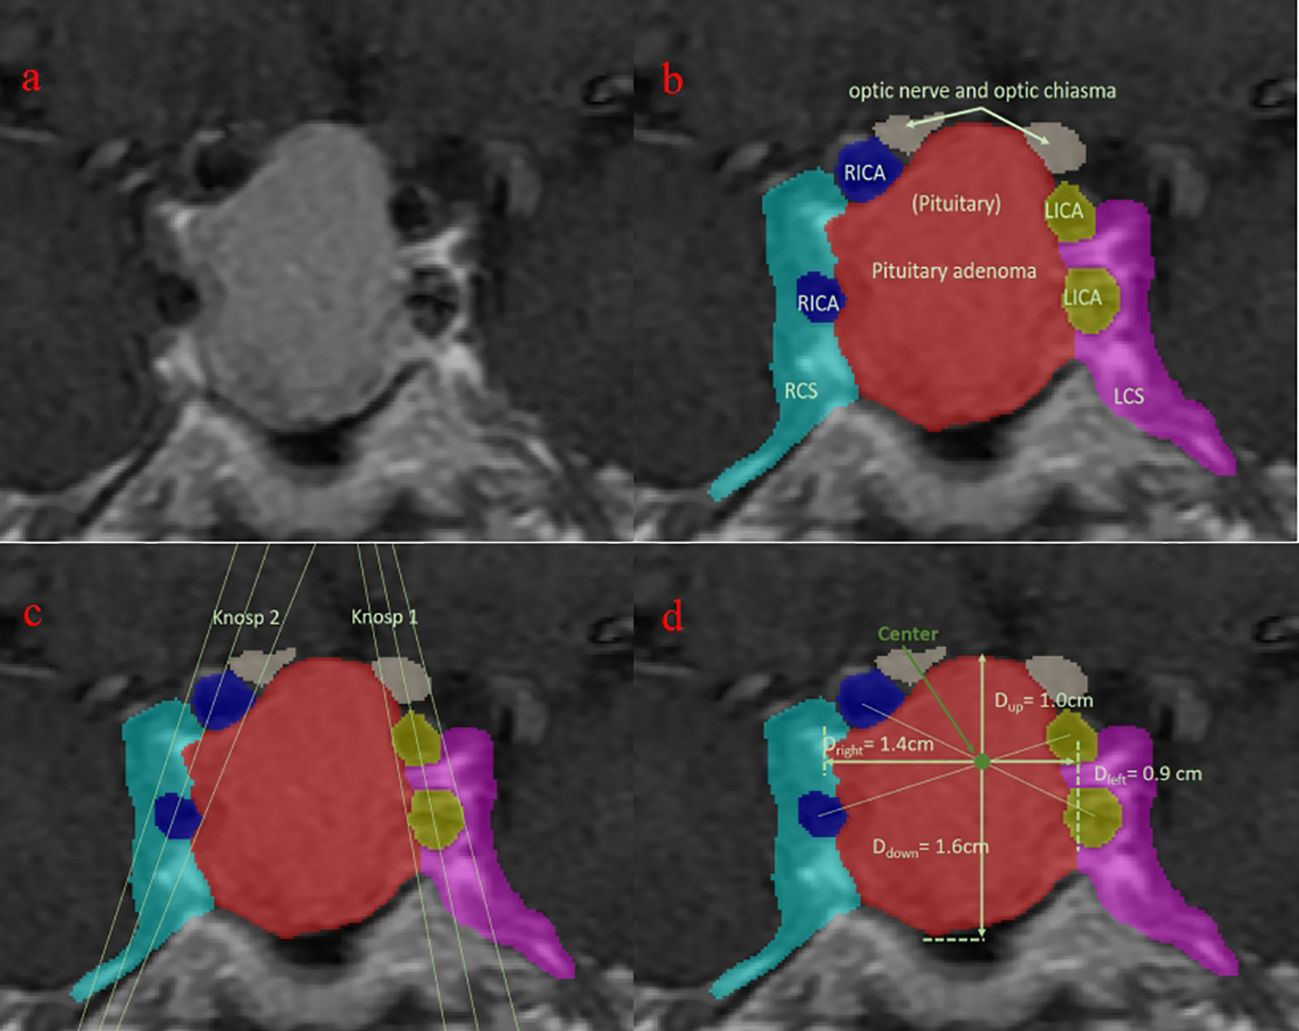
Figure 1. Visualization of the segmentation. Blue, right internal carotid artery; green: normal pituitary (not seen); light blue: right cavernous sinus; purple, left cavernous sinus; red: pituitary adenoma; white, optic nerve and optic chiasm; yellow, left internal carotid artery. (A) original MRI slice with the largest tumor area; (B) segmentation of different tissues; (C) Knosp grade based on the segmentation; (D) upward growth distance of pituitary adenoma.
2.3 Ophthalmic evaluation
A comprehensive review of clinical data for all patients included an in-depth analysis of the disease course and the visual impairment course. Patients underwent a thorough assessment of visual function, utilizing LogMAR visual acuity charts and automated perimetry. Postoperatively, patients were closely monitored for improvements in visual function, assessing whether there was improvement, complete improvement, and the time intervals for such improvements.
2.4 Feature collection
2.4.1 Clinical characteristics
Recording the presence of symptoms such as headache, blindness, gender, age, BMI, visual impairment course, and disease course.
2.4.2 Image characteristics
Including the maximum adenoma area and pituitary gland area across all slices, upward growth distance of pituitary adenoma, the optic chiasm (or optic nerve) area in the largest adenoma area slice, and Knosp grade.
2.5 Follow-up details
A telephone-based follow-up survey was conducted for each patient, addressing the following questions:
a. Whether there was preoperative visual impairment (visual field defect, decreased visual acuity).
b. Postoperative recovery of visual impairment.
c. The degree of recovery, categorized as complete recovery or recovery with residual visual impairment.
d. Time to improvement, specifying whether improvement was immediate or occurred after a certain period.
Based on the responses to the follow-up questions, patients were categorized into two groups:
1. Non-recovery Group: Patients whose visual impairment either persisted or worsened before or after surgery.
2. recovery Group: Patients whose visual impairment partially recovered or returned to normal after surgery.
In addition, before ETS and approximately 1week and 1 week after surgery, all patients were completed VF-14 (details for Supplementary Materials).
2.6 The construction of the clinical model
We initially calculate the cutoff value based on the distribution of each dataset and discretize each variable accordingly. Subsequently, univariate and multivariate analyses are employed to identify the relevant variables to be included in the model construction. The model framework is then established by integrating clinical prior knowledge. Finally, logistic regression is applied to calculate the weight assigned to each variable, completing the construction of the clinical prognostic model.
2.7 Statistics
Analyses were conducted using SPSS 26.0 and Graphpad Prism statistical software. Normally distributed measurement data are presented as , skewed distribution measurement data as M (range), and enumeration data as absolute numbers. Depending on the distribution pattern, continuous normally distributed variables were compared using t-tests while continuous non-normally distributed variables were compared using non-parametric tests. Multiple linear regression analysis was employed to identify potential risk factors (MD values) for visual impairment, with the significance level set at P < 0.05.
3 Results
3.1 Patient clinical characteristics
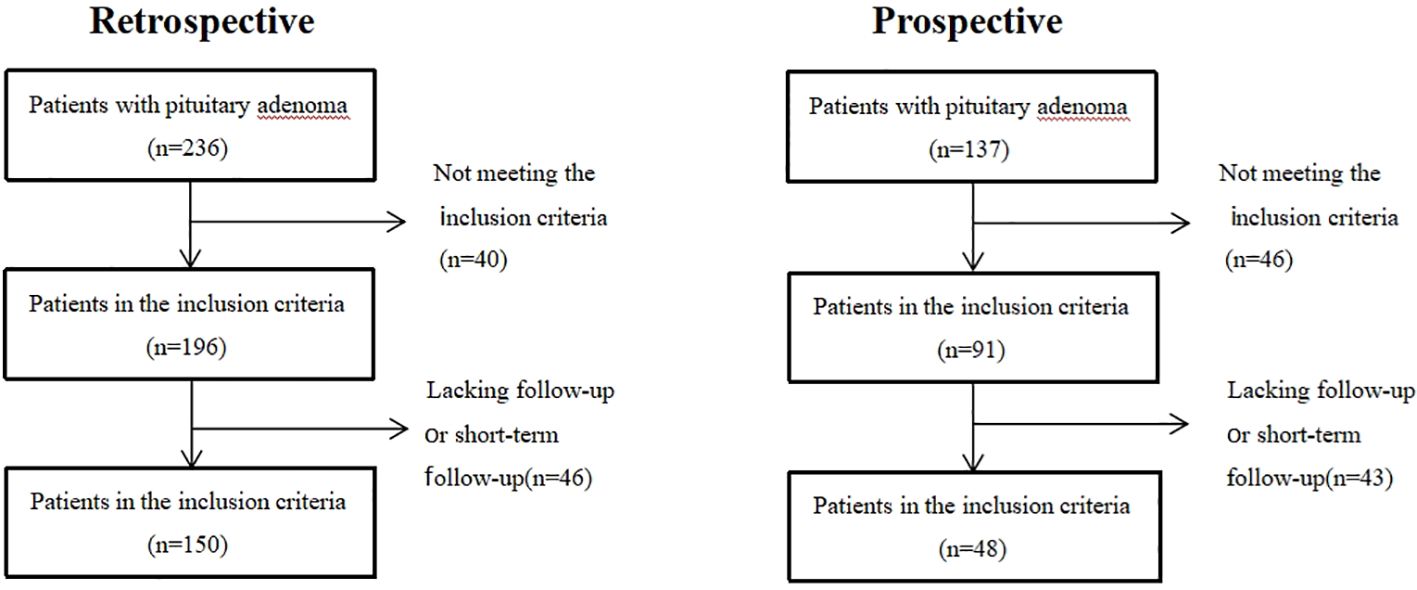
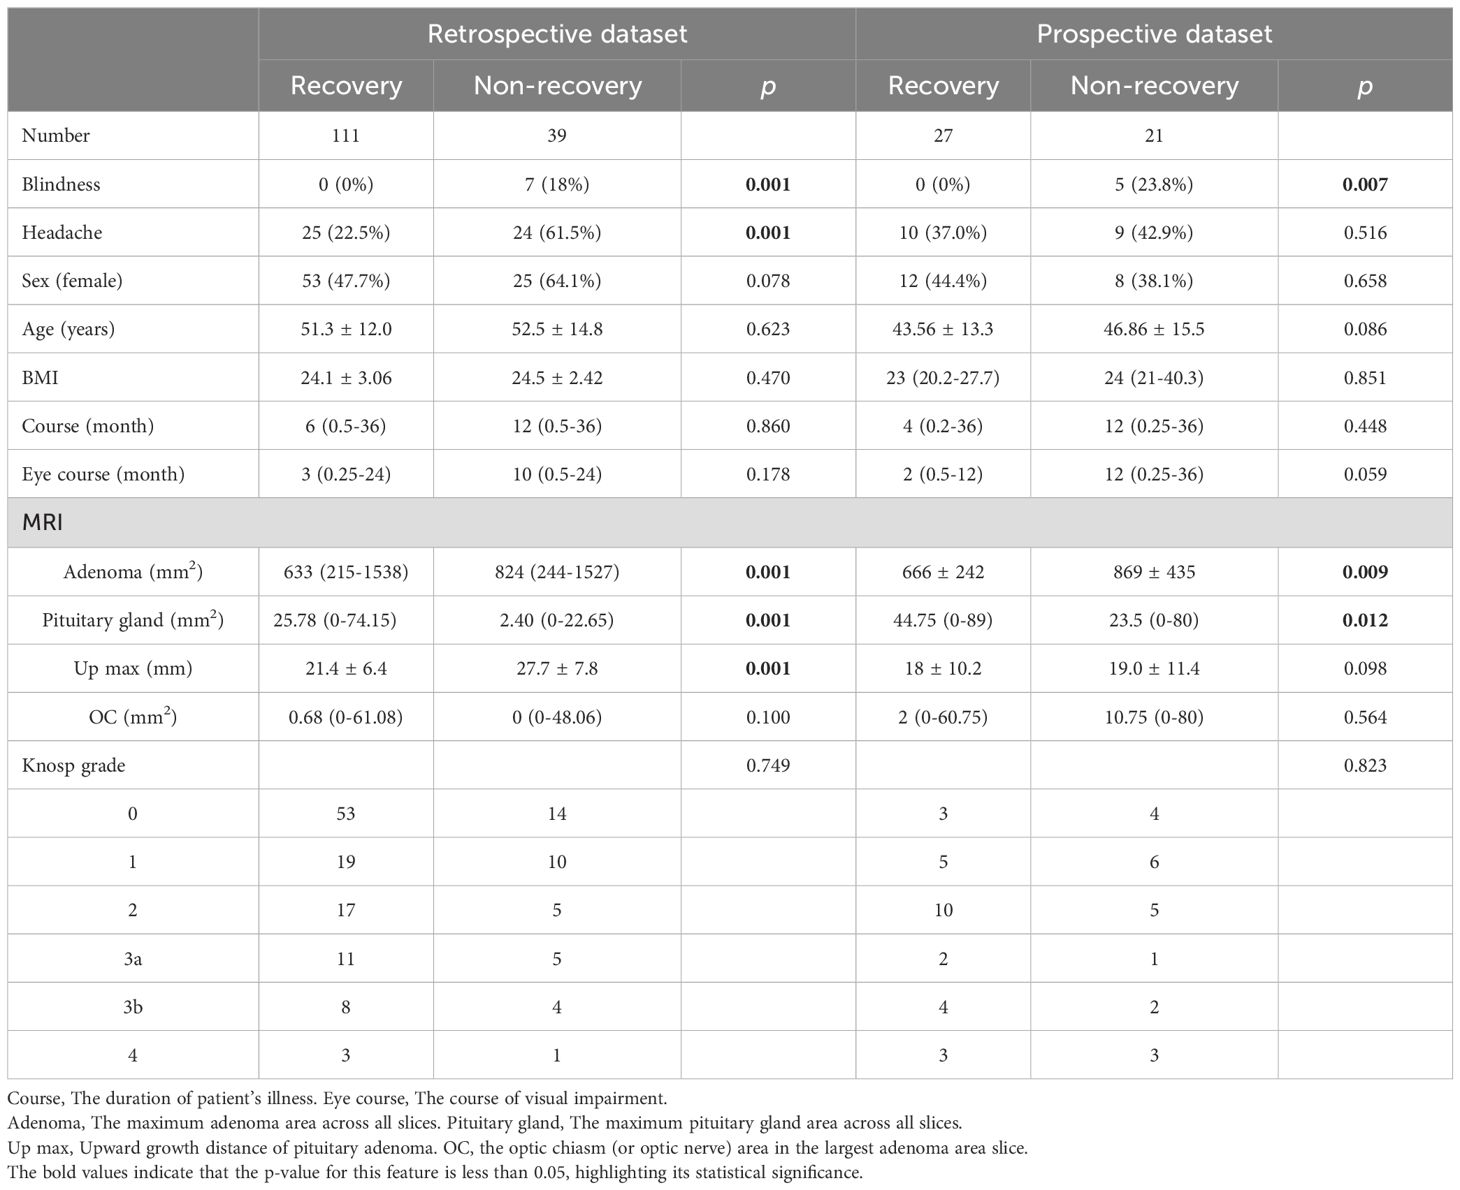
A total of 198 patients with PAs (including 150 retrospective patients and 48 prospective patients) were enrolled in this study (Figure 2). Among the retrospective patients, 111 (74%) experienced visual recovery following pituitary adenoma surgery and were classified as the recovery group, while 39 (26%) remained visually impaired after surgery and were classified as the non-recovery group. Patients who were blind will not be restored after operation(p = 0.001). Preoperative headache (p = 0.001), adenoma area (p = 0.001), and upward growth distance of pituitary adenoma (p = 0.001) were negatively correlated with postoperative visual recovery, while patients’ pituitary gland area (p = 0.001) was positively correlated with postoperative visual recovery. Among prospective patients, 27(56.25%) were classified as the recovery group, while 21(43.75%) were classified as the non-recovery group (Table 1).
3.2 Cutoffs of contributing factors
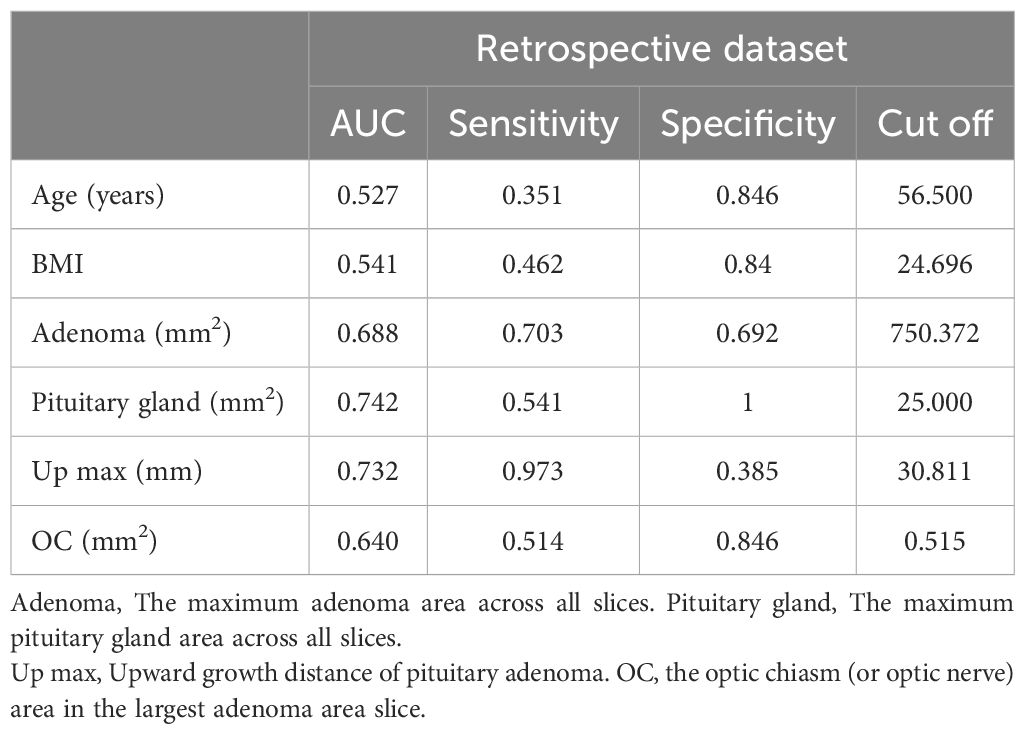
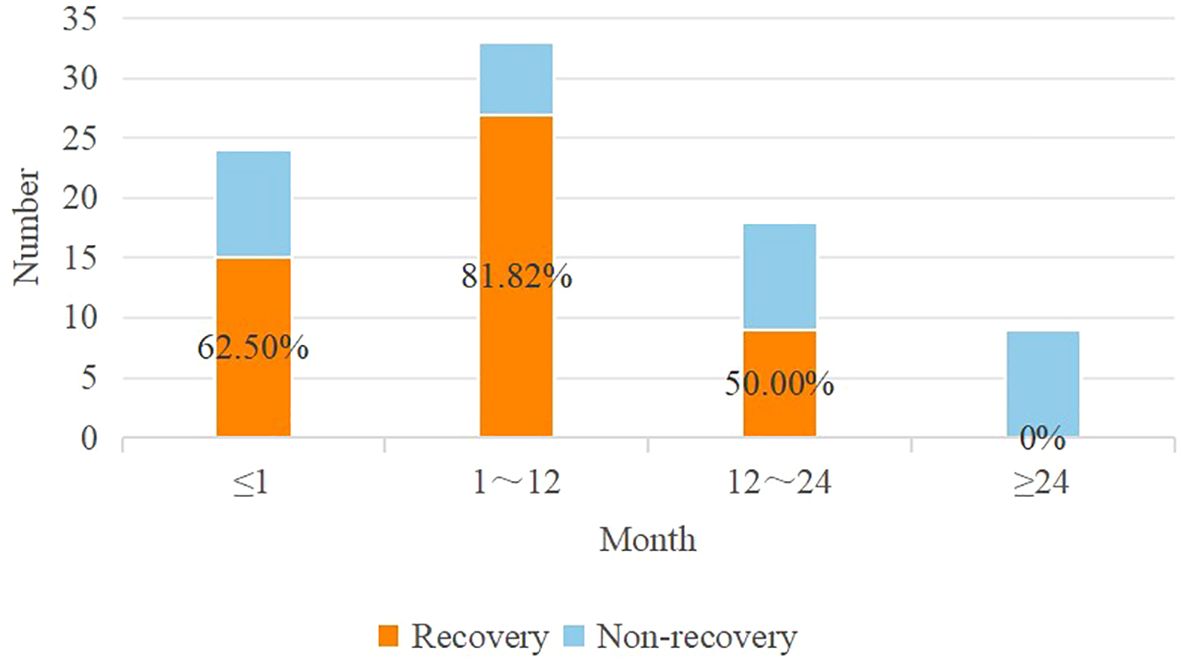
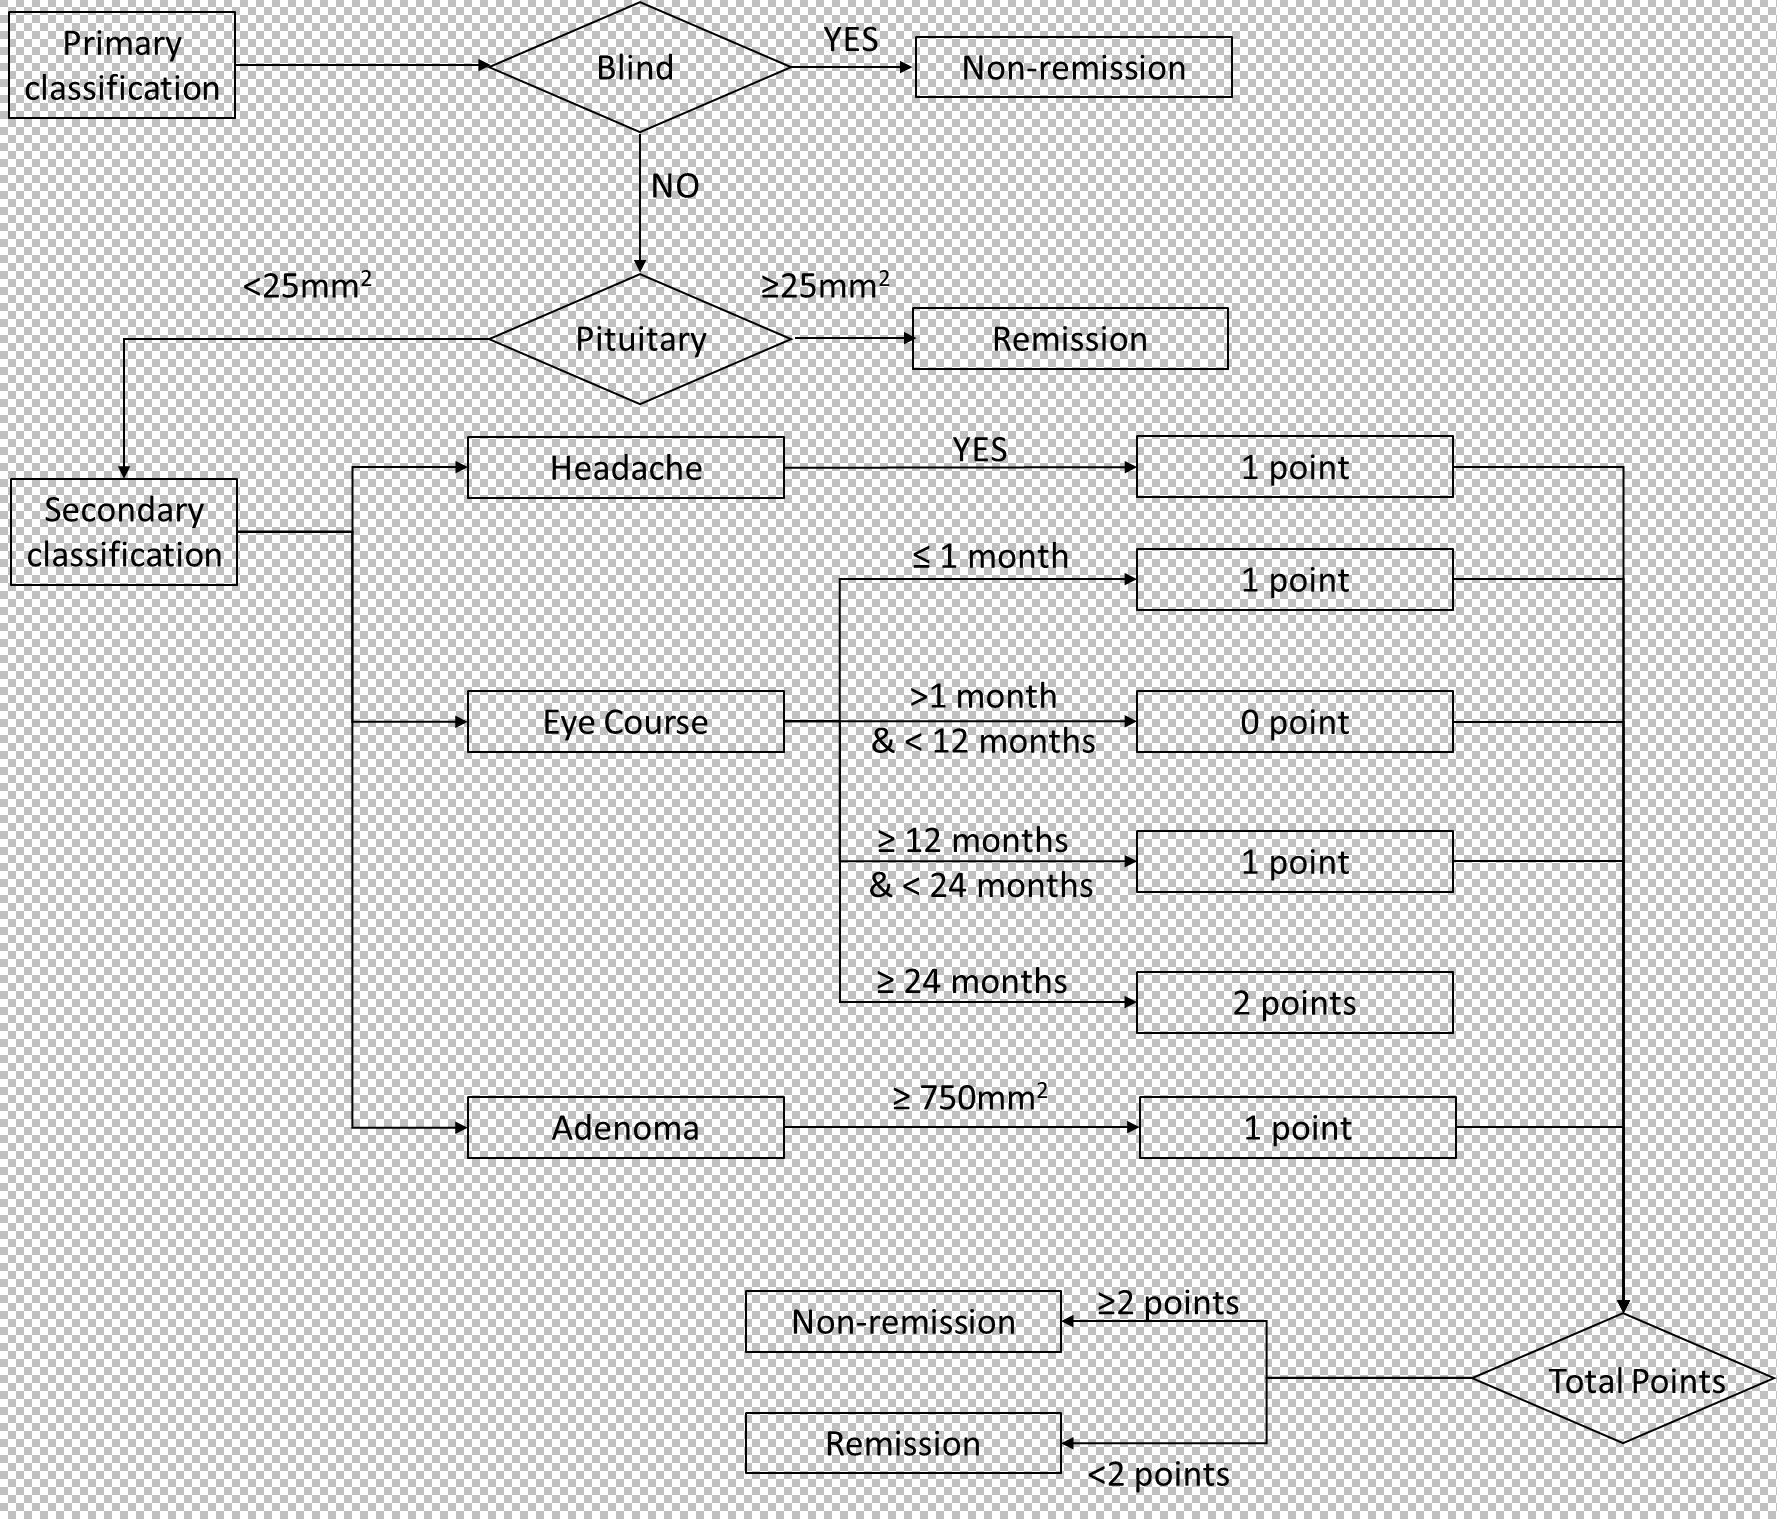
Cutoff values were identified using AUC curves in the retrospective cohort (Table 2). Based on these cutoff values, continuous variables in the table were discretized. When examining the AUC curve for the visual impairment course, it was found that a single cutoff value could not be applied. Therefore, patients were divided into the following groups (0 ~ 1 month, 1 ~ 12 months, 12 ~ 24 months, and more than 24 months), shown in Figure 3. Simultaneously, it was observed that visual acuity was recovery after surgery when the patient’s pituitary gland maximum area was greater than 25 mm2.
3.3 Factors affecting postoperative mean deviation
Logistic multivariate analysis indicated that upward adenoma growth (OR, 0.902; 95% CI, 0.116-7.021; p = 0.921) was not significantly associated with postoperative visual acuity recovery. Multivariate analysis revealed that preoperative headache (OR, 6.754; 95% CI, 2.006-22.738; p = 0.002), longer duration of preoperative visual impairment (OR, 0.095; 95% CI, 0.019-0.473; p = 0.004), and larger adenoma area (OR, 0.101, 95% CI, 0.012-0.885; p = 0.038) were associated with poorer postoperative visual recovery (Table 3).

Table 3. Univariate and multivariate analyses measure the correlation between the clinical features and visual remission.
3.4 Construction of predictive model
We observed that postoperative visual acuity did not recover in blind patients (Table 1). And according to data from follow-up, we founded when the patient’s pituitary gland maximum area exceeded 25 mm2, postoperative visual acuity was recovered. Then, based on multivariate logistic regression, three factors (headache, eye course, and adenoma area) were identified as key factors. Patients who with headaches and a adenoma area greater than 750 mm2, recovered worse postoperatively, so a score of 1 was assigned for these patients. Poor postoperative visual recovery was noted when the course of visual impairment was less than 1 month or exceeded 12 months, and recovery was worse when the course exceeded 24 months. Therefore, a score of 1 was assigned for patients with a course of visual impairment less than 1 month (including 1 month) or more than 12 months (including 12 months) and less than 24 months, and a score of 2 for those with a course exceeding 24 months (including 24 months). Postoperative visual acuity recovery was observed when the total score was less than 2. Subsequently, we constructed a predictive model (Figure 4).
3.5 Performance of the model in prospective patients
The model, including its assignments, was established based on a retrospective cohort and then validated in a prospective cohort. As depicted in Figure 5, the AUC was 0.944 for the retrospective cohort and 0.857 for the prospective set cohort. The AUC values exceeding 0.85 indicate that the model can predict visual function recovery preoperatively. The confusion matrix in the retrospective and prospective validation cohorts is illustrated in Figure 5. The accuracy was 88% in the retrospective cohort and 81.25% in the prospective cohort, with most cases correctly classified.
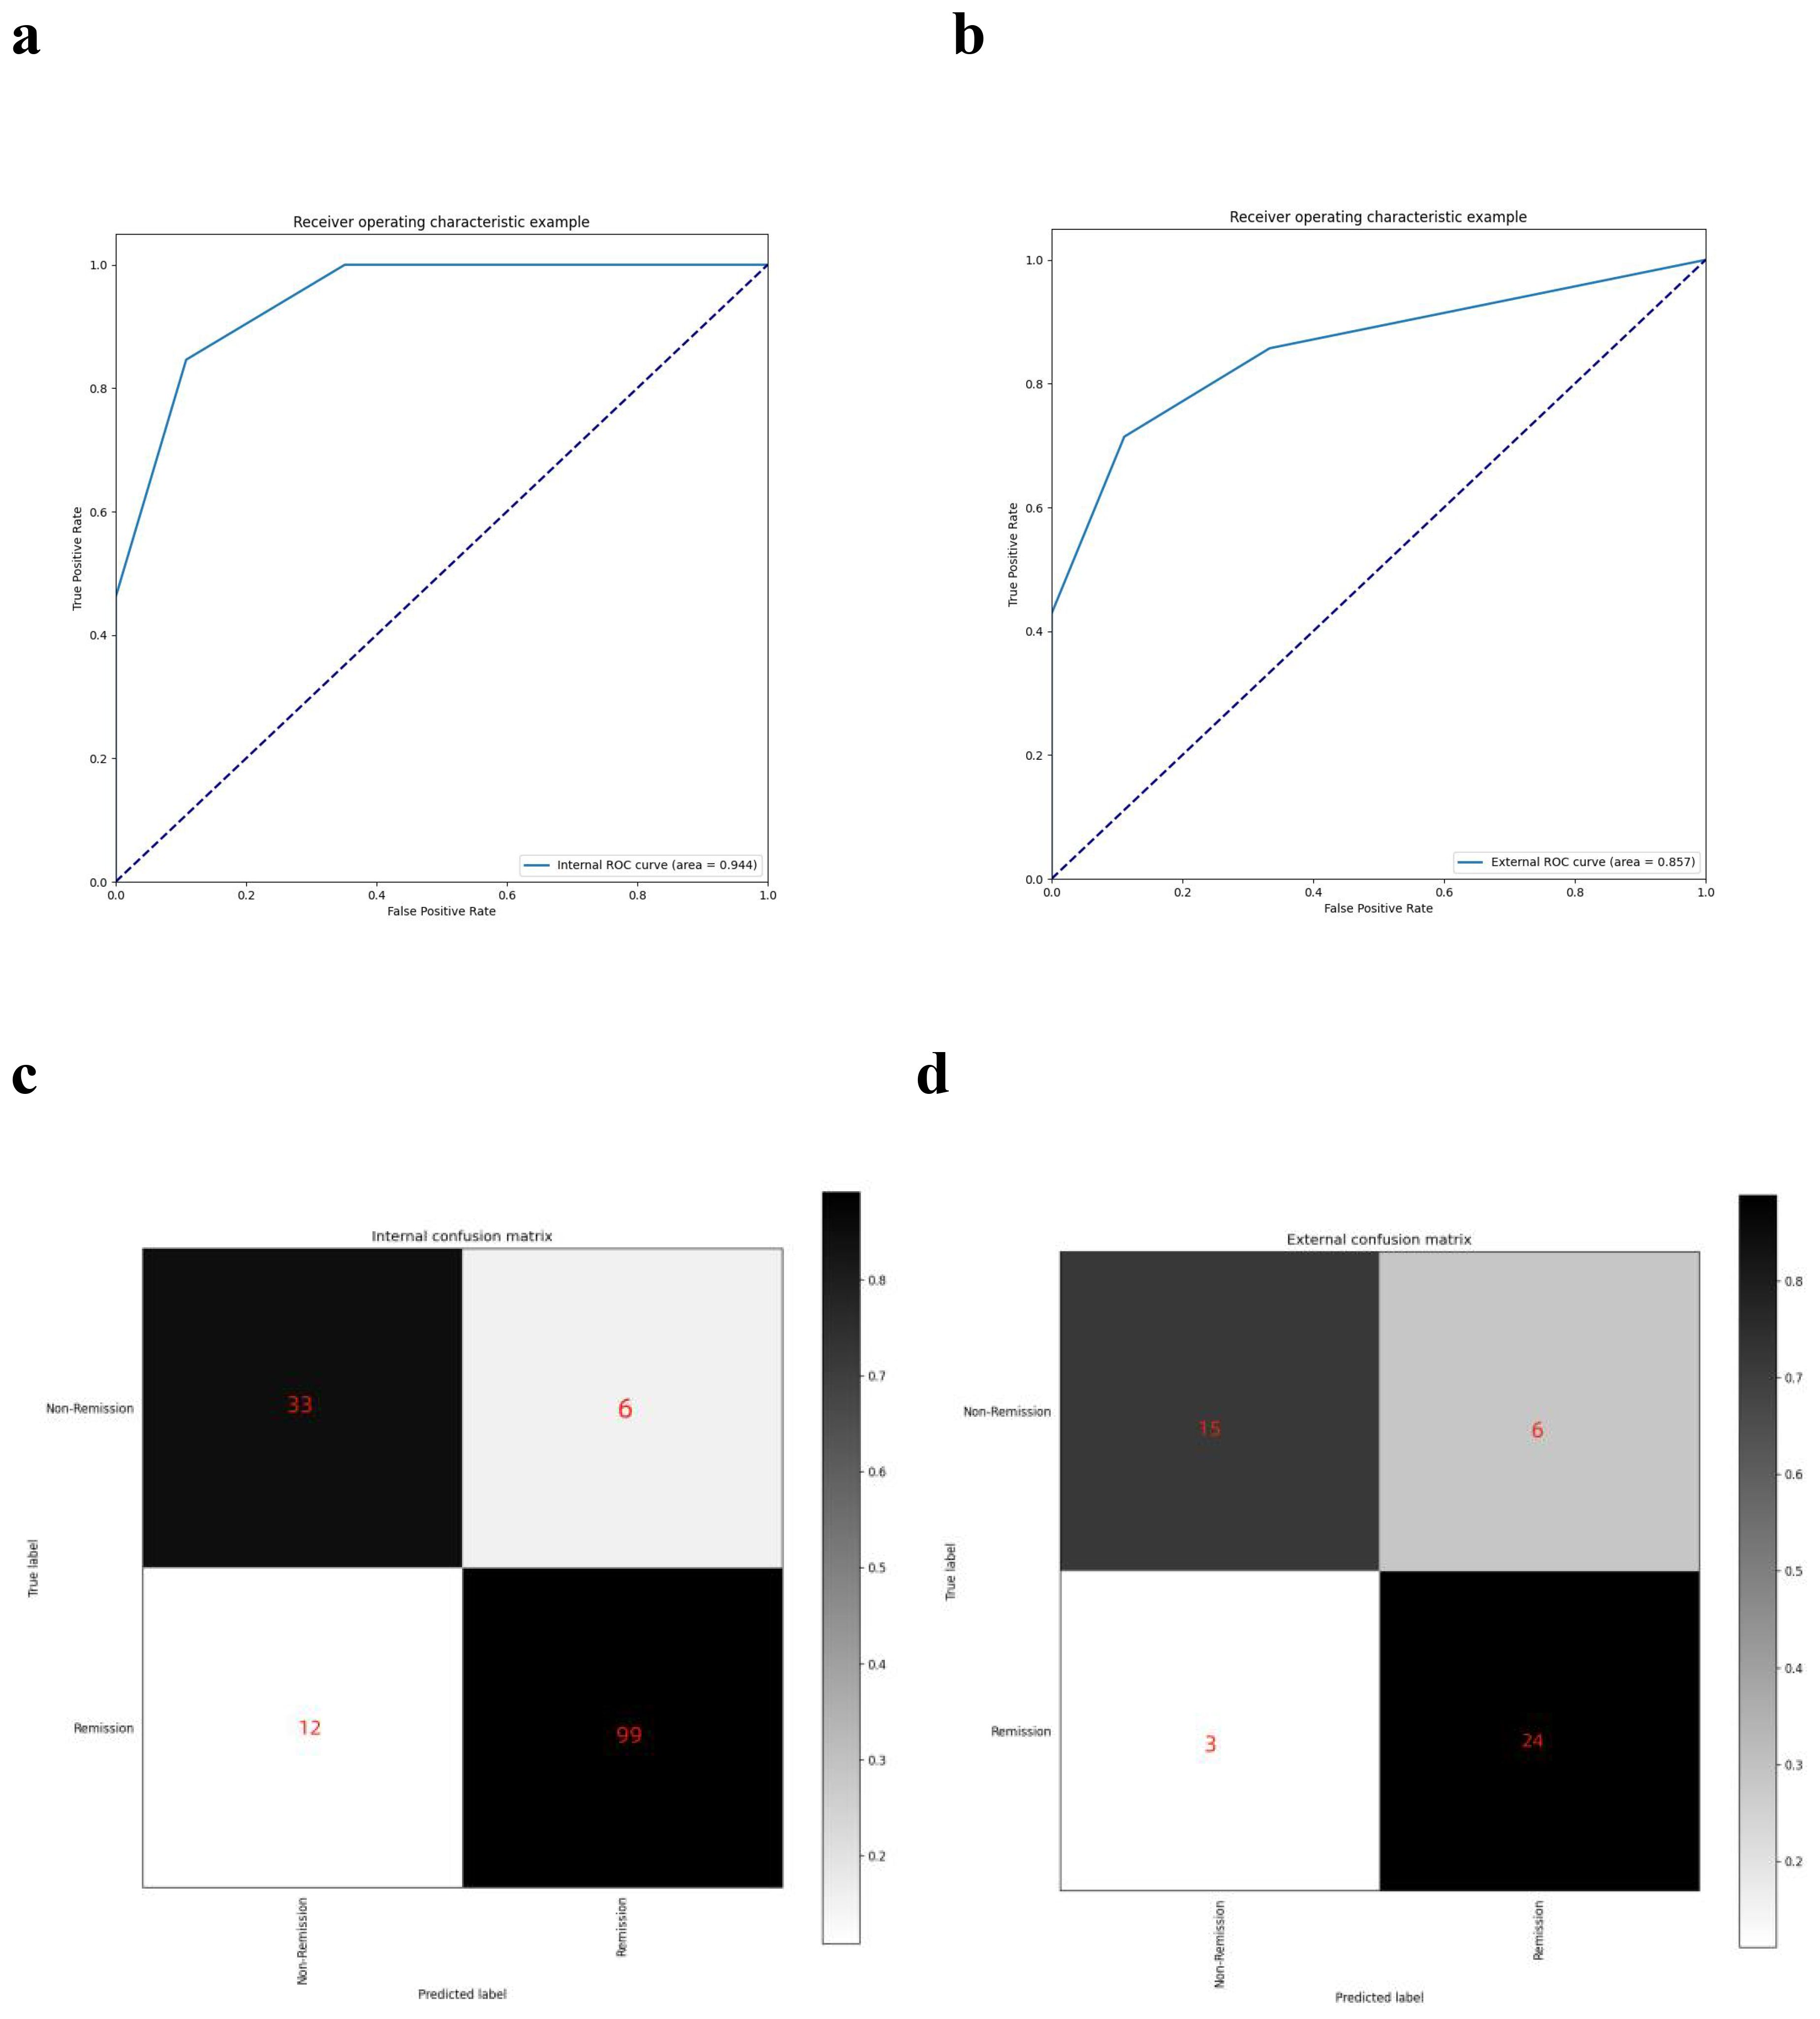
Figure 5. AUC curves and confusion matrixes. (A) the AUC curve of the model in the retrospective dataset; (B) the AUC curve of the model in the prospective dataset; (C) the confusion matrix of the model in the retrospective dataset; (D) the confusion matrix of the model in the prospective dataset.
4 Discussion
The pituitary adenoma, a common primary central nervous system adenoma, often presents with visual dysfunction in 32% to 70% of patients, making it a crucial surgical indication (5). The restoration of visual function is vital for surgical decision-making and doctor-patient communication. Previous studies have predominantly focused on factors associated with the occurrence of preoperative visual impairment, such as patient age, adenoma area, visual impairment course, and specific preoperative visual field defects (4–8). However, limited attention has been given to factors influencing visual recovery after surgery. This study extensively explored factors related to postoperative visual disturbance recovery, including pituitary gland area and the distance of upward growth of pituitary adenoma.
Qiao built a model for predicting visual recovery based on machine learning, achieving an AUC of 0.843 and an accuracy of 0.850. However, the construction of this model involved blood tests, OCT, MRI and relied heavily on machine learning algorithms, which significantly impacted its clinical practicality. The study constructed a clinically practical predictive model for visual recovery by incorporating clinical and imaging features, without the facilitating of computer programming and OCT examination. Key factors considered in the model were preoperative blindness, headache, vision impairment course, pituitary gland maximum size, and adenoma maximum size. The model demonstrated reasonable accuracy in both the retrospective (AUC = 0.944, ACC = 0.88) and prospective (AUC = 0.857, ACC = 0.8125) cohorts, which was comparable to the previous research but with rapid prognosis prediction and more clinical practical situations. Notably, preoperative blindness and small pituitary gland areas were identified as crucial determinants for postoperative unrecovered visual disturbances. Moreover, the visual impairment course is more important than the disease course. The scoring system derived from the model suggested that patients with a total score greater than or equal to 2 were unlikely to experience postoperative visual recovery.
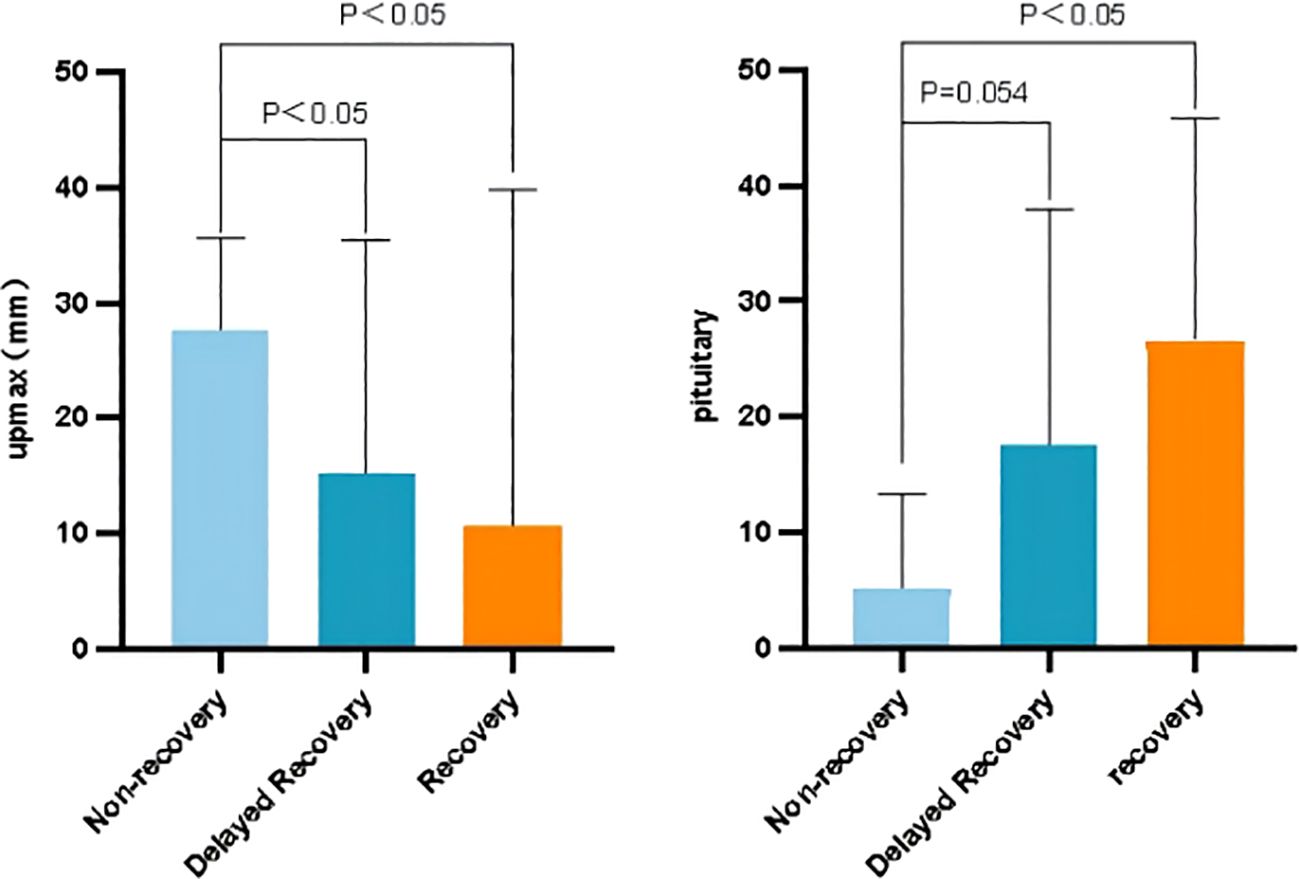
To further explore factors related to the visual recovery, we introduced sub-population classifications, distinguishing patients into non-recovery, delayed recovery, and immediate recovery groups. We defined the delayed recovery group as postoperative visual impairment recovered after more than one week, and defined the immediate recovery group as visual impairment returned to normal within one week after surgery. As Figure 6 showed, we found patients with a shorter distance of upward adenoma growth recovered better postoperatively, and patients who with larger pituitary gland areas recovered better postoperatively.
While previous studies have noted the impact of pituitary macroadenoma on visual impairment and hypopituitarism, few have explored whether pituitary gland function, particularly hormone secretion, influences vision recovery (17–19). The current study revealed that the pituitary gland area is a significant influencing factor, with visual disturbances more likely to recover when the pituitary gland size exceeds 25 mm2, indicating the pituitary gland function is important for the recovery of the visual impairment. Interestingly, previous study has shown that pituitary-related hormone, such as total thyroxine, has a strong relation with visual impairment recovery, emphasizing the vital place of endocrinal function in prognosis (15). Moreover, our study highlighted the impact of clinical symptoms rather than findings in imaging results.
Several limitations were acknowledged. The study is a single-center study, resulting in potential selection bias and the small cohort size in the prospective study, hindering the construction of predictive models for sub-classification. Exclusion from loss to follow-up is somewhat large amount, which can lead to bias in developing a prognostic model. Future endeavors will involve multicenter studies, expanded sample collections for prospective analysis, refined sub-population classification predictions, and further exploration of the correlation between pituitary gland function and postoperative visual acuity recovery.
5 Conclusion
In summary, our study identified correlations between preoperative blindness, headache, adenoma maximum area, pituitary gland maximum area, and the distance of adenoma upward growth with postoperative visual recovery. In addition to, notably, patients with a shorter visual impairment course, shorter distance of tumor upward growth, and larger pituitary gland areas demonstrated better postoperative recovery. Furthermore, we developed a clinical practical model incorporating both clinical and radiological features that successfully predicts the likelihood of postoperative visual impairment recovery in pituitary adenoma patients. The model exhibited an accuracy of 0.88 and AUC of 0.944 in the retrospective study and an accuracy of 0.8125 and AUC of 0. 857 in the prospective study, offering a valuable tool for personalized counseling and treatment decisions for individual patients.
Data availability statement
The raw data supporting the conclusions of this article will be made available by the authors, without undue reservation.
Ethics statement
The studies involving humans were approved by Branch for Medical Research and Clinical Technology Application, Ethics Committee of First Affiliated Hospital of Fujian Medical University. The First Affiliated Hospital of Fujian Medical University. The studies were conducted in accordance with the local legislation and institutional requirements. The participants provided their written informed consent to participate in this study.
Author contributions
ZZ: Conceptualization, Data curation, Formal analysis, Investigation, Methodology, Software, Validation, Visualization, Writing – original draft, Writing – review & editing. HW: Conceptualization, Data curation, Formal analysis, Investigation, Methodology, Software, Supervision, Validation, Visualization, Writing – original draft, Writing – review & editing. QC: Conceptualization, Data curation, Formal analysis, Investigation, Methodology, Software, Validation, Visualization, Writing – original draft, Writing – review & editing. ZW: Data curation, Formal analysis, Investigation, Methodology, Writing – review & editing. JF: Data curation, Formal analysis, Investigation, Methodology, Writing – review & editing. WF: Data curation, Formal analysis, Investigation, Methodology, Writing – review & editing. YL: Conceptualization, Formal analysis, Project administration, Resources, Supervision, Writing – review & editing. DK: Conceptualization, Formal analysis, Project administration, Resources, Supervision, Writing – review & editing. CJ: Conceptualization, Formal analysis, Project administration, Resources, Supervision, Writing – review & editing. ZL: Conceptualization, Formal analysis, Methodology, Project administration, Resources, Supervision, Writing – review & editing. XY: Conceptualization, Formal analysis, Funding acquisition, Investigation, Methodology, Project administration, Resources, Supervision, Writing – review & editing.
Funding
The author(s) declare financial support was received for the research, authorship, and/or publication of this article. This work was sponsored by Joint Funds for Innovation of Science and Technology, Fujian Province (No. 2021Y9089), University-Industry Research Joint Innovation Project of Science, Technology, Fujian Province (No. 2023Y4018), Fujian Province Finance Project (No. BPB-2022YXR) and KCXFZ20201221173202007.
Conflict of interest
The authors declare that the research was conducted in the absence of any commercial or financial relationships that could be construed as a potential conflict of interest.
The handling editor XS declared a shared parent affiliation with the author HW at the time of review.
Publisher’s note
All claims expressed in this article are solely those of the authors and do not necessarily represent those of their affiliated organizations, or those of the publisher, the editors and the reviewers. Any product that may be evaluated in this article, or claim that may be made by its manufacturer, is not guaranteed or endorsed by the publisher.
Supplementary material
The Supplementary Material for this article can be found online at: https://www.frontiersin.org/articles/10.3389/fendo.2024.1479442/full#supplementary-material
References
1. Anderson D, Faber P, Marcovitz S, Hardy J, Lorenzetti D. Pituitary tumors and the ophthalmologist. Ophthalmology. (1983) 90:1265–70. doi: 10.1016/s0161-6420(83)34393-1
2. Xia L, Wenhui J, Xiaowen Y, Wenfang X, Wei Z, Yanjun H, et al. Predictive value of macular ganglion cell-inner plexiform layer thickness in visual field defect of pituitary adenoma patients: a case-control study. Pituitary. (2022) 25:667–72. doi: 10.1007/s11102-022-01248-6
3. Lee JP, Park IW, Chung YS. The volume of tumor mass and visual field defect in patients with pituitary macroadenoma. Korean J Ophthalmol. (2011) 25:37–41. doi: 10.3341/kjo.2011.25.1.37
4. Yu FF, Chen LL, Su YH, Huo LH, Lin XX, Liao RD. Factors influencing improvement of visual field after trans-sphenoidal resection of pituitary macroadenomas: a retrospective cohort study. Int J Ophthalmol. (2015) 8:1224–8. doi: 10.3980/j.issn.2222-3959.2015.06.27
5. Barzaghi LR, Medone M, Losa M, Bianchi S, Giovanelli M, Mortini P. Prognostic factors of visual field improvement after trans-sphenoidal approach for pituitary macroadenomas: review of the literature and analysis by quantitative method. Neurosurg Rev. (2012) 35:369–78; discussion 378-9. doi: 10.1007/s10143-011-0365-y
6. Gnanalingham KK, Bhattacharjee S, Pennington R, Ng J, Mendoza N. The time course of visual field recovery following transphenoidal surgery for pituitary adenomas: predictive factors for a good outcome. J Neurol Neurosurg Psychiatry. (2005) 76:415–9. doi: 10.1136/jnnp.2004.035576
7. Ho RW, Huang HM, Ho JT. The influence of pituitary adenoma size on vision and visual outcomes after trans-sphenoidal adenectomy: a report of 78 cases. J Korean Neurosurg Soc. (2015) 57:23–31. doi: 10.3340/jkns.2015.57.1.23
8. Jahangiri A, Lamborn KR, Blevins L, Kunwar S, Aghi MK. Factors associated with delay to pituitary adenoma diagnosis in patients with visual loss. J Neurosurg. (2012) 116:283–9. doi: 10.3171/2011.6.JNS101663
9. Gan L, Ma J, Feng F, Wang Y, Cui J, Guo X, et al. The predictive value of suprasellar extension for visual function evaluation in Chinese patients with nonfunctioning pituitary adenoma with optic chiasm compression. World Neurosurg. (2018) 116:e960–7. doi: 10.1016/j.wneu.2018.05.141
10. Wang MTM, King J, Symons RCA, Stylli SS, Meyer J, Daniell MD, et al. Prognostic utility of optical coherence tomography for long-term visual recovery following pituitary tumor surgery. Am J Ophthalmol. (2020) 218:247–54. doi: 10.1016/j.ajo.2020.06.004
11. Bhende M, Shetty S, Parthasarathy MK, Ramya S. Optical coherence tomography: A guide to interpretation of common macular diseases. Indian J Ophthalmol. (2018) 66:20–35. doi: 10.4103/ijo.IJO_902_17
12. Fujii K, Kubo T, Otake H, Nakazawa G, Sonoda S, Hibi K, et al. Expert consensus statement for quantitative measurement and morphological assessment of optical coherence tomography: update 2022. Cardiovasc Interv Ther. (2022) 37:248–54. doi: 10.1007/s12928-022-00845-3
13. Zhang Y, Chen C, Huang W, Cheng Y, Teng Y, Zhang L, et al. Machine learning-based radiomics of the optic chiasm predict visual outcome following pituitary adenoma surgery. J Pers Med. (2021) 11:991. doi: 10.3390/jpm11100991
14. Uy B, Wilson B, Kim WJ, Prashant G, Bergsneider M. Visual outcomes after pituitary surgery. Neurosurg Clin N Am. (2019) 30:483–9. doi: 10.1016/j.nec.2019.06.002
15. Qiao N, Ma Y, Chen X, Ye Z, Ye H, Zhang Z, et al. Machine learning prediction of visual outcome after surgical decompression of sellar region tumors. J Pers Med. (2022) 12:152. doi: 10.3390/jpm12020152
16. Wang H, Zhang W, Li S, Fan Y, Feng M, Wang R. Development and evaluation of deep learning-based automated segmentation of pituitary adenoma in clinical task. J Clin Endocrinol Metab. (2021) 106:2535–46. doi: 10.1210/clinem/dgab371
17. Shibue K, Yamakawa M, Nishida N, Hamasaki A. Resolution of visual field defect in macroprolactinoma after treatment with cabergoline. Cureus. (2022) 14:e25548. doi: 10.7759/cureus.25548
18. Chen Y, Liu Z, Lin Z, Shi X. Eye signs in pituitary disorders. Neurol India. (2019) 67:979–82. doi: 10.4103/0028-3886.266265
19. Uche NJ, Uche EO, Eze BI, Amuta DS, Guga DA, Okpara S. Neurophthalmic manifestations of giant sellar tumors in adults: Relationship between endocrine status and visual acuity profile pre and postsurgical treatment: A prospective cohort study. Niger J Clin Pract. (2020) 23:1500–6. doi: 10.4103/njcp.njcp_340_19
Keywords: pituitary adenoma, clinical practical model, visual outcome, graphic segmentation, machine learning (ML)
Citation: Zheng Z, Wang H, Chen Q, Wang Z, Fu J, Fan W, Lin Y, Kang D, Jiang C, Lin Z and Yan X (2024) A clinical practical model for preoperative prediction of visual outcome for pituitary adenoma patients in a retrospective and prospective study. Front. Endocrinol. 15:1479442. doi: 10.3389/fendo.2024.1479442
Received: 12 August 2024; Accepted: 20 November 2024;
Published: 13 December 2024.
Edited by:
Xiang’En Shi, Capital Medical University, ChinaReviewed by:
Nidan Qiao, Fudan University, ChinaKanwaljeet Garg, All India Institute of Medical Sciences, India
Copyright © 2024 Zheng, Wang, Chen, Wang, Fu, Fan, Lin, Kang, Jiang, Lin and Yan. This is an open-access article distributed under the terms of the Creative Commons Attribution License (CC BY). The use, distribution or reproduction in other forums is permitted, provided the original author(s) and the copyright owner(s) are credited and that the original publication in this journal is cited, in accordance with accepted academic practice. No use, distribution or reproduction is permitted which does not comply with these terms.
*Correspondence: Changzhen Jiang, ODkzNDE2ODgwQHFxLmNvbQ==; Zhangya Lin, MTM3OTkzMjE3NDVAMTM5LmNvbQ==; Xiaorong Yan, cHBwcDA4MEAxMjYuY29t
†These authors have contributed equally to this work
 Zijian Zheng
 He Wang
 Qianxi Chen
 Zhicheng Wang1,2
 Dezhi Kang
 Changzhen Jiang
 Zhangya Lin