 Dongze Zheng
 Jiamiao Cai
 Sifan Xu
 Shiyan Jiang
 Chenlin Li
 Bin Wang
- 1Department of Cardiology, The First Affiliated Hospital of Shantou University Medical College, Shantou, China
- 2Human Phenome Institute, Shantou University Medical College, Shantou, Guangdong, China
- 3Department of Nephrology, Jieyang People’s Hospital, Jieyang, Guangdong, China
- 4Department of Cardiology, Jieyang People’s Hospital, Jieyang, Guangdong, China
Aim: To investigate the correlation of the triglyceride-glucose (TyG) index and its combined obesity indicators with chest pain and cardiovascular disease (CVD) in the pre-diabetes and diabetes population.
Methods: This cross-sectional investigation encompassed 6488 participants with diabetes and pre-diabetes who participated in the National Health and Nutrition Examination Survey (NHANES) between 2007 and 2016. The association of the TyG and combined obesity index with chest pain and CVD was investigated using weighted logistic regression models and restricted cubic spline (RCS) analysis. The receiver operating characteristic (ROC) curve analysis was performed to compare different indicators.
Results: In multivariate logistic regression fully adjusted for confounding variables, our analyses revealed significant associations between TyG, TyG-BMI, TyG-WC, and TyG-WHtR and chest pain, with adjusted ORs (95% CI) of 1.21 (1.05, 1.39), 1.06 (1.01, 1.11), 1.08 (1.04, 1.14), and 1.27 (1.08, 1.48), respectively. For total-CVD, the adjusted ORs (95% CI) were 1.32 (1.08, 1.61), 1.10 (1.03, 1.17), 1.13 (1.06, 1.19), and 1.63 (1.35, 1.97), respectively, among which TyG, TyG-WC, and TyG-WHtR present curvilinear associations in RCS analysis (all P-nonlinear < 0.05). Furthermore, the ROC curve showed that TyG-WC had the most robust predictive efficacy for total-CVD, coronary heart disease (CHD), and myocardial infarction (MI), while TyG-WHtR had the best predictive ability for angina and heart failure.
Conclusion: There are significant associations of TyG and its related indicators with chest pain and total-CVD among the pathoglycemia population. TyG-WC and TyG-WHtR demonstrated superior predictive capability for the incidence of cardiovascular events.
1 Introduction
The prevalence of cardiovascular diseases (CVD) has been steadily increasing in recent years, emerging as a significant global public health concern. According to data from the NHANES dataset spanning 2017 to March 2020, the overall prevalence of CVD was approximately 48.6%, affecting an estimated 127.9 million individuals in 2020. In the American Heart Association’s 2023 update on heart disease and stroke statistics, CVD was attributed to approximately 19.05 million deaths globally in 2020 (1–3). Additionally, chest pain, a marker of cardiovascular risk, has been understudied for an extended period. In the United States, the cumulative incidence of chest pain ranges from 20% to 40% (4). Compared to pain-free populations, patients in the general population who report chest pain have a higher future incidence of fatal and non-fatal CVD (5). Therefore, it is crucial to discover dependable indicators that can forecast and detect individuals with a high risk of chest pain and CVD at an early stage. Additionally, it is essential to promptly implement interventions to address risk factors in order to decrease the occurrence of cardiovascular events and alleviate the imminent danger to human life.
Recently, insulin resistance (IR), which is the dysfunction to utilize insulin of tissue cells and always accompany hyperinsulinemia, has been proven to be associated with lots of metabolic diseases, including CVD, dyslipidemia, obesity, and type 2 diabetes (6–9). However, the gold standard of IR is complex and expensive, which limited its application clinically (10). The triglyceride-glucose (TyG) index, which was a parameter calculated from the fasting triglyceride and fasting blood glucose levels, has been recently regarded as one of the biomarkers for IR (11–13). Growing studies have shown that TyG was associated with the prevalence of cardiovascular events such as coronary heart disease (CHD), heart failure (HF), myocardial infarction (MI), and so on (14–18). However, current research focuses on the whole population, and the participants specifically focused on dysglycemia were scattered. Obesity is a prevalent metabolic disorder that is globally recognized as a significant health concern, which is often accompanied by hypertension and abnormal lipid metabolism. Central obesity serves as a crucial indicator for evaluating the risk of various chronic disorders associated with obesity (19, 20). The indicators of central obesity included body mass index (BMI), waist circumference (WC) and waist-to-height ratio (WHtR). Recently, the combination of TyG with BMI, WC, and WHtR has been proposed as a novel indicator for IR. This combination has been found to be linked to many metabolic disorders, such as diabetes, metabolic syndrome, and non-alcoholic fatty liver disease (21–23).
Diabetes mellitus is widely recognized as a risk factor for CVD, and as high as 32% of patients with type 2 diabetes mellitus have cardiovascular disease (24). Recent epidemiological research has demonstrated a strong association between these TyG-related indicators and ASCVD (25, 26). In fact, several of these parameters have shown superior predictive ability compared to TyG. However, the link between TyG-related indicators and CVD in patients with dysglycemia has not been thoroughly investigated. Therefore, our research aimed to explore the potential correlation between TyG and its combined obesity indicators and chest pain and CVD within the diabetes and pre-diabetes population.
2 Method
2.1 Study design
The National Health and Nutrition Examination Survey (NHANES) is a nationwide representative survey that has been conducted in the United States since 1999 and continues to the present. In order to assess nutritional and physiological status, complex, multistage, stratified sampling is implemented from a nationally representative, non-institutionalized US civilian population. The study was conducted in accordance with the principles of the Declaration of Helsinki. The National Center for Health Statistics Research Ethics Review Board granted its approval. All individuals signed written informed consent.
2.2 Study population
The data collected included structured interviews conducted in participants’ homes, health examinations conducted in mobile examination centers, and laboratory analyses of specimens. The study data can be accessed at https://www.cdc.gov/nchs/nhanes. Diabetes is defined as a self-reported diagnosis, the use of insulin or glycemic medication, hemoglobin A1c (HbA1c) ≥ 6.5%, fasting plasma glucose (FPG) ≥ 126 mg/dL, or 2-h blood glucose ≥ 200 mg/dL. Pre-diabetes is indicated by FPG levels between 100 mg/dL and 125 mg/dL, 2-h blood glucose between 140 mg/dL and 199 mg/dL, or HbA1c levels between 5.7% and 6.4% (27). This study included patients diagnosed with diabetes or prediabetes between 2007 and 2016. The following patients were excluded from the study (1): Participants under the age of 20 (2). Participants without data on chest pain diagnosis and cardiovascular diseases (3). Participants with missing baseline records on fasting blood triglyceride, fasting blood glucose, body weight, body height, or WC. Ultimately, 6,488 individuals with diabetes or pre-diabetes were enrolled following the screening process (Figure 1).
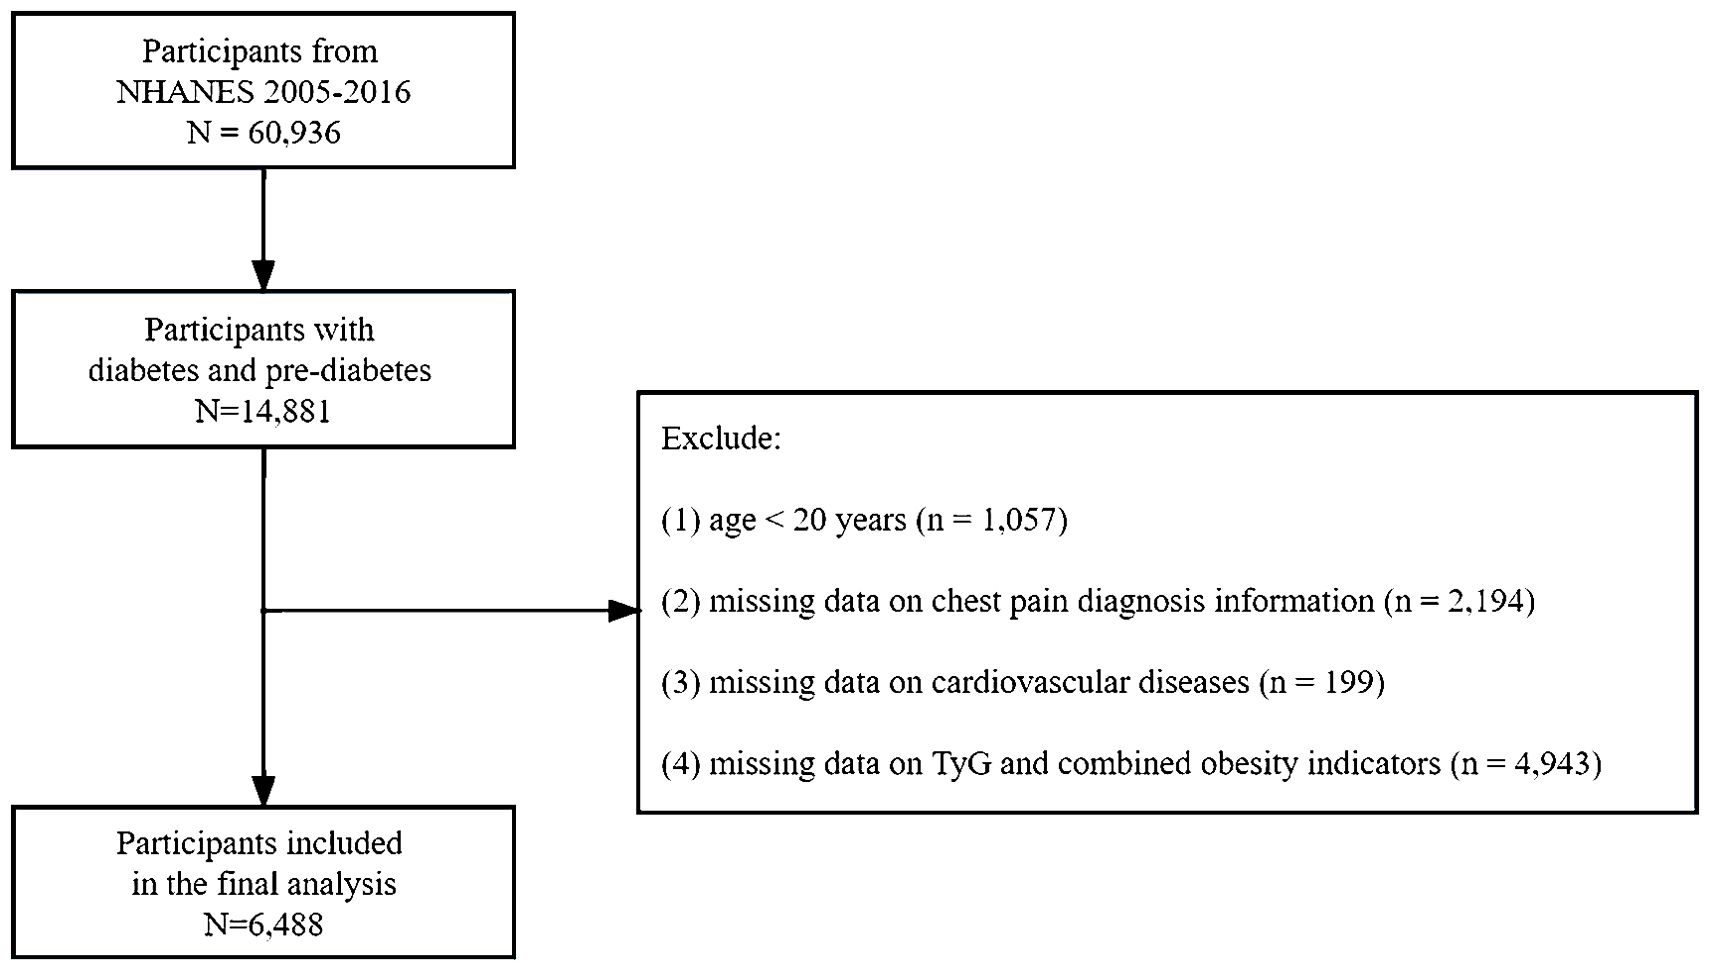
Figure 1. Flow chart of the study participants.
2.3 Calculation of TyG index and related parameters
Fasting blood triglycerides were measured using three different analyzers (Roche Hitachi 717/912, Roche modular P chemistry, and Roche/Hitachi Cobas 6000). Fasting blood glucose (FBG) measurement utilized two instruments (Roche C501 from 2007 to 2015 and Roche C311 in 2016). Considering different instruments for these indicators was not necessary under NHANES analysis guidelines. Body weight, height, WC and blood pressure were collected by trained health technicians when participants attended the health examinations. The health technician was assisted by a recorder during the body measurement examination. TyG index = ln [TG (mg/dL) × FBG (mg/dL)/2], TyG-WC index = TyG × WC (cm), TyG-BMI index = TyG × BMI (kg/m2), TyG-WHtR index = TyG × WC (cm)/height (cm) (28).
2.4 Outcome variables
Chest pain status and CVD were the primary outcomes. Chest pain was diagnosed when the participant responded “yes” to the question “{Have you/Has SP} ever had any pain or discomfort in {your/her/his} chest?” The diagnosis of CVD is determined by trained assessors, who obtain self-reported medical diagnoses during individual interview. Participants were inquired “ Has a doctor or other health professional ever told you that you have congestive heart failure, coronary heart disease, angina, myocardial infarction, or stroke?” Individuals who responded “yes” to any of these inquiries were diagnosed with CVD.
2.5 Assessment of covariates
We incorporated a diverse array of covariates that could have potentially impacted the results. All the participants provided information on age, sex, race (Mexican American, non-Hispanic white, non-Hispanic black, and other races), educational level (below high school, high school graduate or GED, and above high school), marital status (married/cohabiting, widowed/divorced/separated, and unmarried), poverty-income ratio (PIR), tobacco exposure (never, previous, and current), alcohol use (29) (non-drinking, moderate, heavy, or binge drinking), physical activity (30) (inactive, less active, active), chest pain status, and CVD through the survey questionnaires. We obtained SBP, DBP, and BMI through a physical examination. Laboratory results included LDL, TC, TBIL, SUA, and eGFR. The eGFR was calculated using the Chronic Kidney Disease Epidemiology Collaboration (CKD-EPI) equation (31).
2.6 Statistical analyses
This study used recommended NHANES weights to account for the disparities in sampling probabilities and nonresponse. Since data from five cycles from 2007 to 2016 were included in this study, the new weight index was constructed to be one-fifth of the original weight. Detailed information about the calculating weights can be found in https://wwwn.cdc.gov/nchs/nhanes/tutorials/Weighting.asp. Missing covariate values in survey data were addressed using a multilevel imputation approach (32). A Gibbs sampling procedure was used to generate 5 imputed data sets after a burn-in of 500 iterations and 100 updates to ensure stochastic independence between imputed data sets. Baseline characteristics were grouped based on the presence or absence of chest pain. Continuous variables are presented as mean (interquartile range, IQR) and were compared using the Wilcoxon rank-sum test. Categorical variables are expressed as frequency (percentages) and were compared by the Chi-square tests. The primary outcomes (chest pain and CVD) were examined in relation to TyG and its derivatives using multivariable logistic regression models. Additionally, in order to investigate the correlation between the occurrence of primary outcomes and TyG and its derivatives, smooth curve-fitting logistic regression models and restricted cubic splines (RCS) were implemented for exploratory analysis. In instances where the relationship was determined to be non-linear, logistic regression models were conducted separately on either side of the inflection point to investigate the correlation between TyG and its derivatives and the occurrence of various outcomes. Finally, receiver operating characteristic (ROC) curves were plotted to assess their efficacy in the prediction of CVD. We also conducted an analysis of five CVD. A two-tailed P value of < 0.05 was established as the threshold for statistical significance. All the statistical analyses were performed using R software version 4.3.1.
3 Results
3.1 Baseline characteristics
This study enrolled 6488 participants, of whom 1728 (26%) experienced chest pain at least once (Table 1). Those participants with chest pain tended to be male, older, white, people, smoke more, drink more, had higher educational statements, and had lower PIR. Furthermore, a higher proportion of participants with chest pain also reported a history of CVD, CHD, MI, HF, and stroke. In addition, participants with chest pain were more likely to have higher blood pressure and a higher BMI. TyG, TyG-BMI, TyG-WC, and TyG-WHtR were significantly higher in the chest pain group.
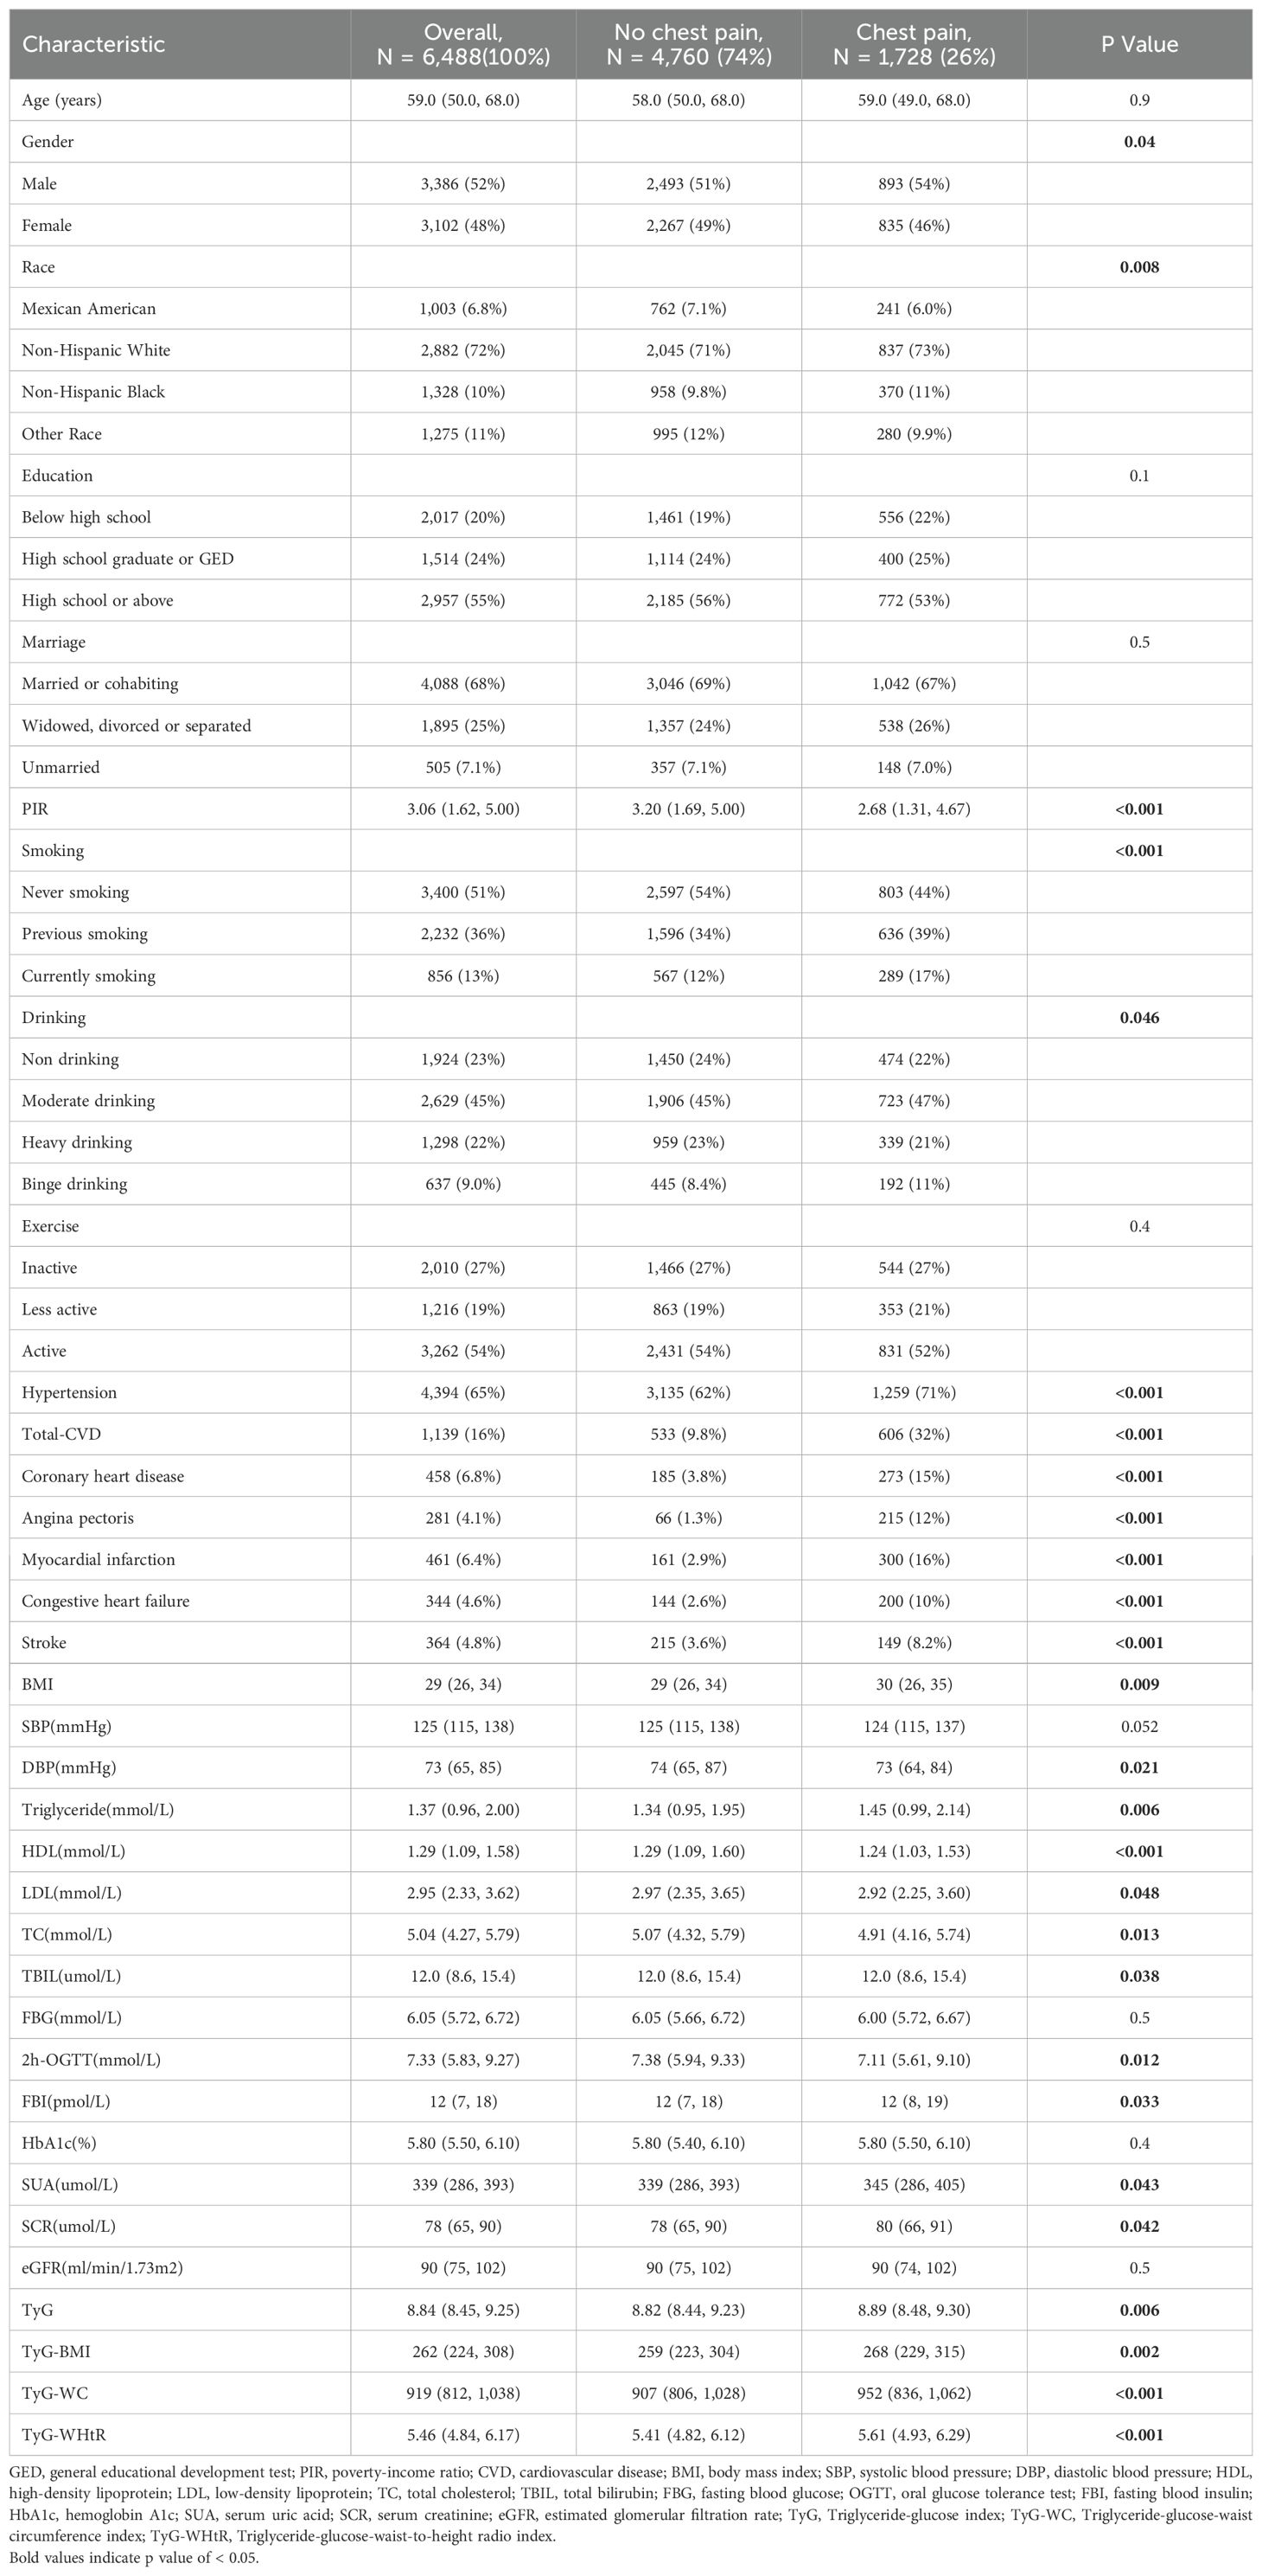
Table 1. Baseline characteristics of study participants.
3.2 Association between TyG and related parameters and outcomes
Table 2 shows the association between the study variable and chest pain. After adjusting for covariates, TyG (OR 1.21, 95% CI: 1.05-1.39, P = 0.01), TyG-BMI (OR 1.06, 95% CI: 1.01-1.11, P = 0.02), TyG-WC (OR 1.09, 95% CI: 1.04-1.14, P < 0.001) and TyG-WHtR (OR 1.27, 95% CI: 1.08-1.48, P = 0.004) as continuous variables were significantly and positively associated with chest pain. When analyzing these parameters as categorical variates, there was no statistically significant relationship between TyG and chest pain, while the combined predictors were all proven to increase the risk of chest pain in model 3. For participants in the fourth quartile of TyG-BMI, TyG-WC, and TyG-WHtR, the risk of chest pain increased by respectively 65%, 71%, and 70% (TyG-BMI: OR 1.65, 95% CI: 1.07-2.55, P = 0.02; TyG-WC: OR 1.71, 95% CI: 1.19-2.46), P = 0.004; TyG-WHtR: OR 1.70, 95% CI: 1.19-2.44, P = 0.004). The RCS analysis presents the association between TyG, TyG-BMI, TyG-WC, and TyG-WHtR and chest pain more visually. Significant linear correlations were found between four parameters and chest pain (all P-nonlinear > 0.05) (Figure 2).
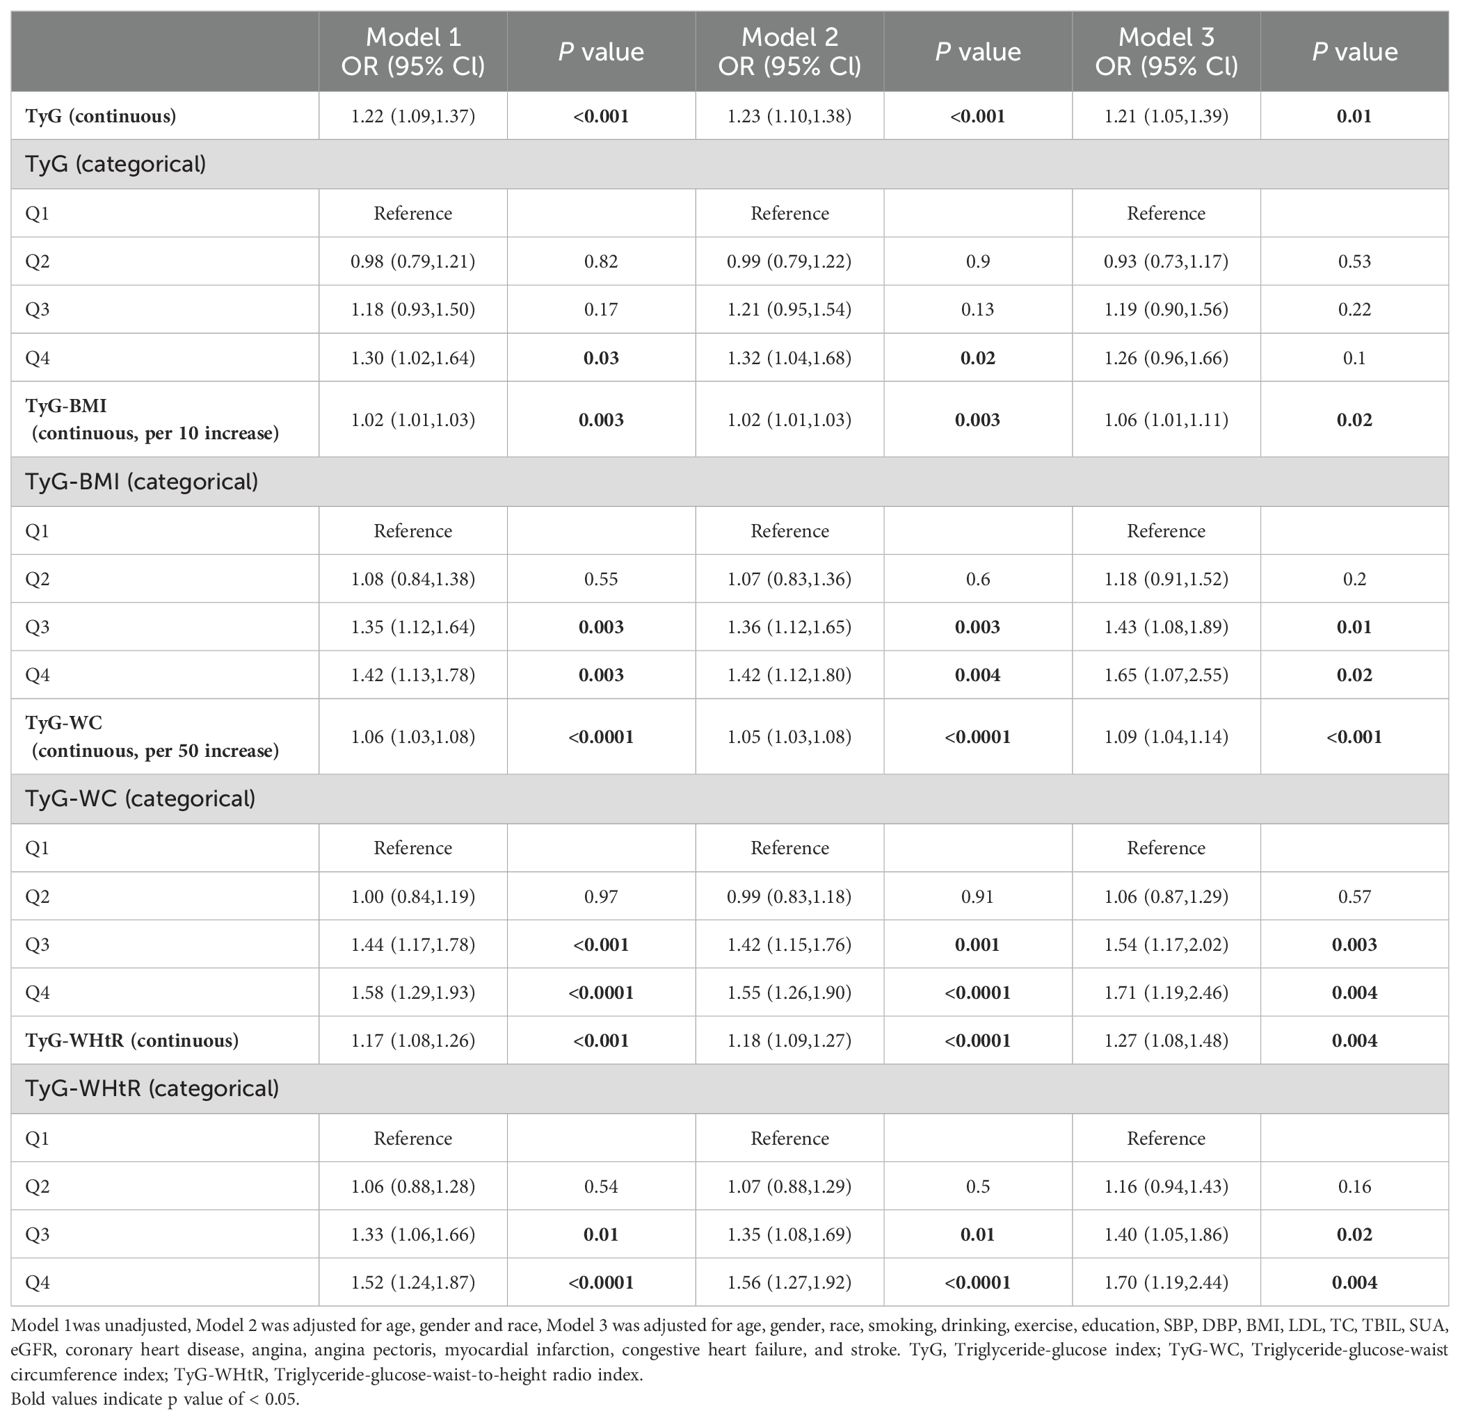
Table 2. ORs (95% CIs) for chest pain according to TyG, TyG-BMI, TyG-WC and TyG-WHtR.
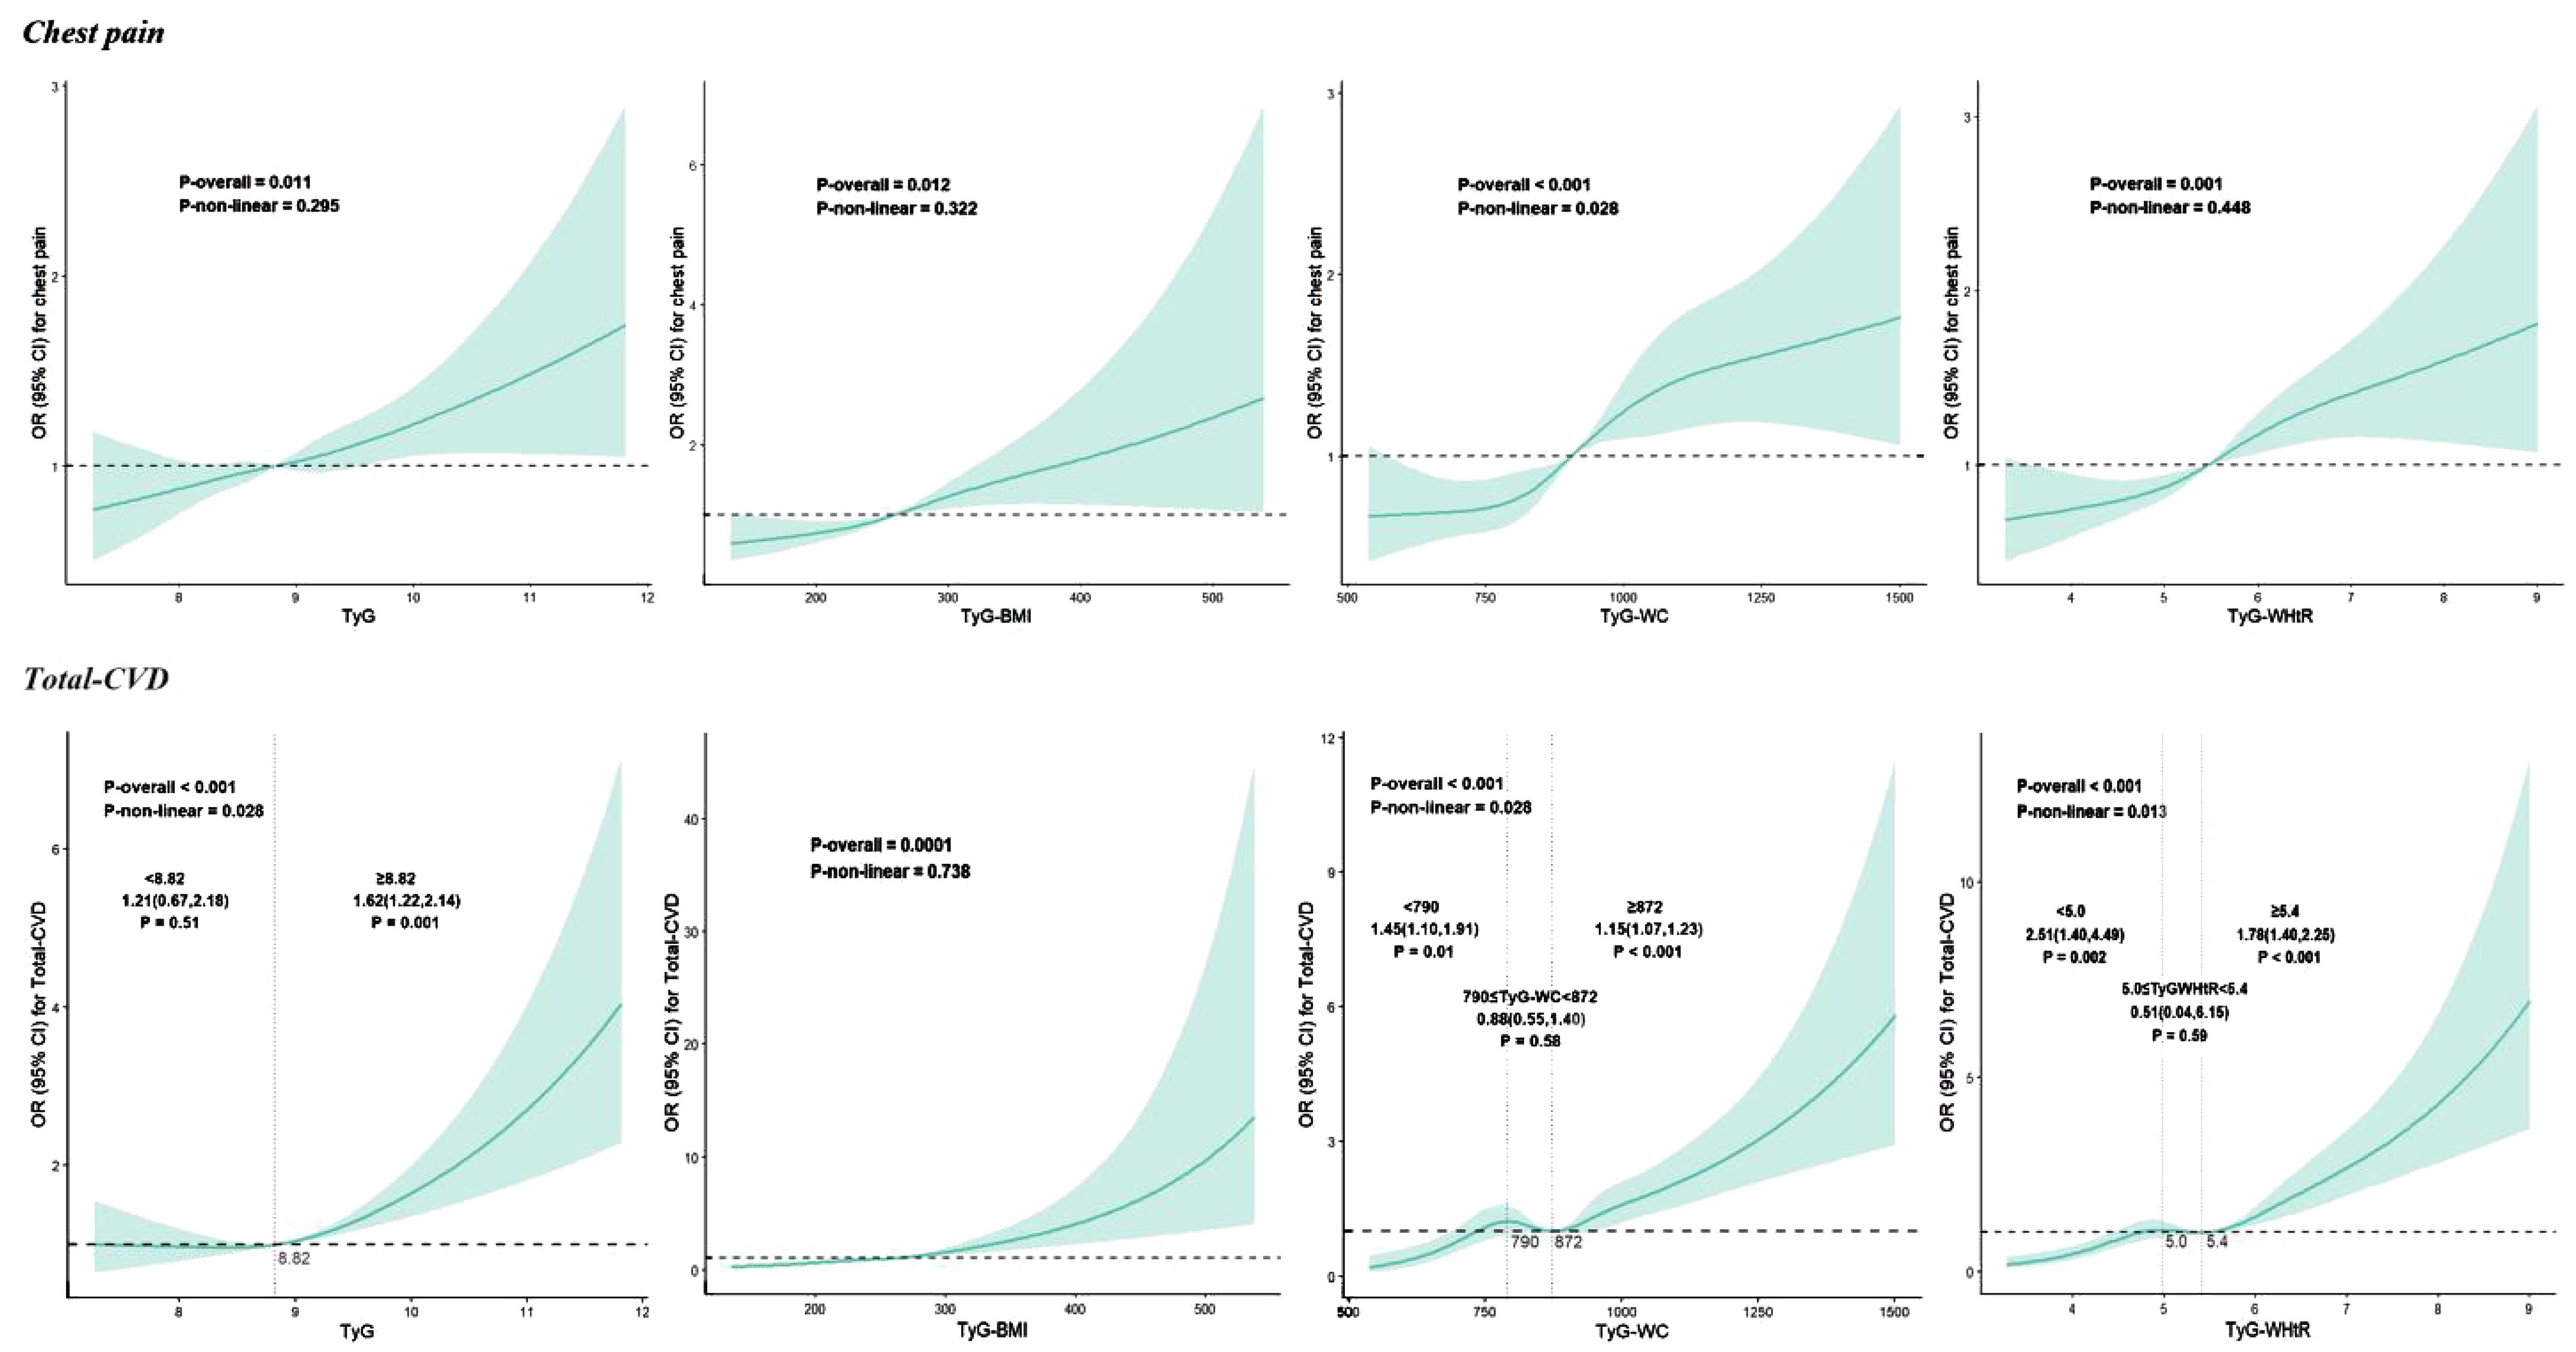
Figure 2. Restricted cubic spline curves for TyG, TyG-BMI, TyG-WC and TyG-WHtR associated with chest pain and total-CVD. CVD, cardiovascular diseases; TyG, Triglyceride-glucose index; TyG-WC, Triglyceride-glucose-waist circumference index; TyG-WHtR, Triglyceride-glucose-waist-to-height radio index.
Table 3 illustrates the relationship between TyG and related parameters and total-CVD. TyG (OR 1.32, 95% CI: 1.08-1.61, P = 0.01), TyG-BMI (OR 1.10, 95% CI: 1.03-1.17, P = 0.01), TyG-WC (OR 1.13, 95% CI: 1.06-1.19, P < 0.0001), and TyG-WHtR (OR 1.63, 95% CI: 1.35-1.97, P < 0.0001) were all significantly and positively associated with total-CVD after adjusting for covariates. When these parameters were analyzed as categorical variates, TyG, TyG-WC, and TyG-WHtR were all demonstrated to increase the risk of total-CVD, whereas there was no statistically significant relationship between TyG-BMI and total-CVD in model 3. The risk of chest pain increased by 42%, 76%, and 109% for participants in the fourth quartile of TyG, TyG-WC, and TyG-WHtR, respectively (TyG: OR 1.65, 95% CI: 1.07-2.55, P = 0.04; TyG-WC: OR 1.71, 95% CI: 1.19-2.46), P = 0.01; TyG-WHtR: OR 1.70, 95% CI: 1.19-2.44, P = 0.001). As shown in Figure 2, only TyG-BMI was observed to have a linear relationship (P-nonlinear > 0.05) after adjustments. TyG, TyG-WC, and TyG-WHtR exhibited non-linear associations (all P-nonlinear <0.05) with total-CVD. Interestingly, a J-shaped relationship was observed between TyG and total total-CVD, while TyG-WC and TyG-WHtR show a temporary plateau type curve with total-CVD.
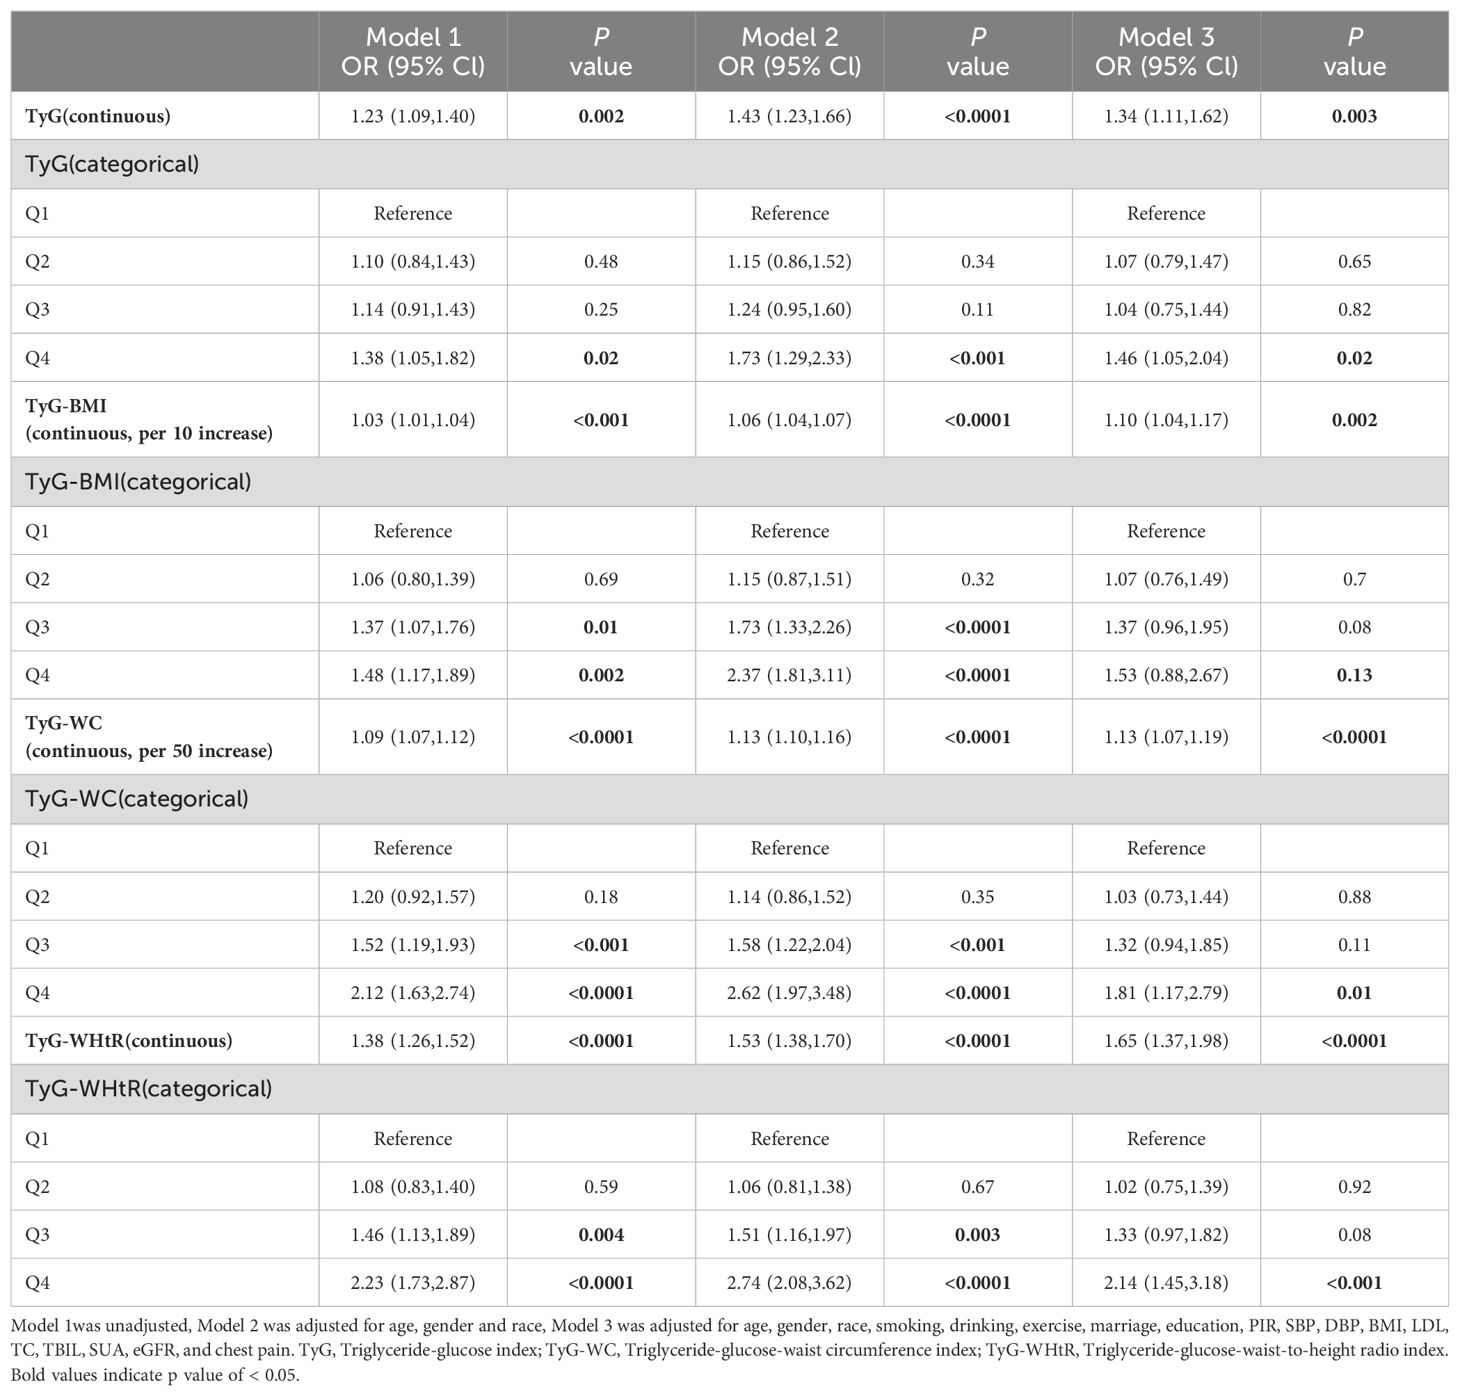
Table 3. ORs (95% CIs) for cardiovascular diseases according to TyG, TyG-BMI, TyG-WC and TyG-WHtR.
We also investigate CHD, angina, MI, HF, and stroke. When treated as a continuous variable, TyG (CHD: OR 1.49 95%CI 1.18-1.89, P = 0.001; HF: OR 1.38 95%CI 1.06-1.80, P = 0.02) and TyG-BMI (per 10 increases; CHD: OR 1.15 95%CI 1.07-1.24, P = 0.001; HF: OR 1.11 95%CI 1.02-1.20, P = 0.01) demonstrated a significantly positive correlation with CHD and HF, while having no statistically significant associations with angina and MI. Participants in the fourth quartile of TyG-WC experienced a 124%, 114%, and 81% increase in the likelihood of experiencing CHD, MI, and HF, respectively (CHD: OR 2.24 95%CI 1.22-4.11, P = 0.01; MI: OR 2.14 95%CI 1.20-3.83, P = 0.01; HF: OR 1.81 95%CI 1.13-2.91, P = 0.02). TyG-WHtR had the highest correlation with HF, with an OR of 2.72 in the fourth quartile (95% CI 1.46-5.09, P = 0.002). No significant relationships were found between the indicators and stroke. Further details are presented in Supplementary Table 1. In correlation with coronary disease, TyG demonstrated a J-shaped relationship. For HF, a U-shaped relationship was observed with TyG-WC. In the association between TyG-BMI, TyG-WHtR, and TyG and HF, linear relationships were observed (all P-nonlinear >0.05). Additionally, it showed linear associations between TyG-WC and MI (P-nonlinear > 0.05) and nonlinear associations between other indices and MI (all P-nonlinear < 0.05). Supplementary Figures S1-S4 illustrated further details.
3.3 Threshold effect analysis
Additionally, for RCS curves that exhibited curvilinear relationships previously mentioned, segmented logistic regression models were utilized to investigate the specific effects before and after the inflection points. We discovered that the cardiovascular risk increased as the TyG index increased when it exceeded 8.82. In contrast, this trend was absent when the TyG index was less than 8.82. We also observed a consistent trend between the TyG index and the risk of coronary artery disease (<8.82: OR = 1.46, 95% CI 0.73–2.90, P = 0.28; >8.82: OR = 1.96, 95% CI 1.43–2.6, P < 0.001), as well as between the TyG-WC and the risk of HF (per 50 unit increase; 814: OR = 1.06, 95% CI 0.76–1.47, P = 0.75; >814: OR = 1.21, 95% CI 1.11–1.31, P < 0.001). The risk of total-CVD increases by 46% (OR = 1.46, 95% CI 1.11–1.92, P = 0.01) and 15% (OR = 1.15, 95% CI 1.07–1.24, P = 0.001) when the TyG-WC is less than 790 and higher than 872, respectively, for per 50 unit increase in TyG-WC, while there is a plateau between 790 and 872 (OR = 0.87, 95% CI 0.54–1.39, P = 0.55). When the TyG-WHtR<5.0 or ≥ 5.4, increased TyG-WHtR was significantly associated with increased risk of total-CVD, but there was no significant association when TyG-WHtR between 5.0 and 5.4. Similarly, TyG-WHtR also demonstrated this trend in MI, with inflection points at 4.7 and 5.2, respectively. More details are available in Supplementary Tables S2-S5.
3.4 Performance and predictive ability of TyG and related parameters
The ROC curve showed that TyG-WC exhibited the highest diagnostic accuracy for total-CVD (AUC: 0.591), followed by TyG-WHtR (AUC: 0.590). TyG-WC also demonstrated superior diagnostic efficiency for CHD and MI, with AUCs of 0.588 and 0.581, respectively. TyG-WHtR followed with AUCs of 0.568 for CHD and 0.564 for MI, outperforming TyG-BMI and TyG in both cases. For HF, TyG-WHtR had the highest diagnostic efficacy (AUC 0.614), while TyG-WC was slightly inferior to TyG-WHtR (AUC 0.610). Moreover, TyG demonstrated superior diagnostic efficacy for angina (AUC 0.599) (Table 4; Supplementary Figure S5).
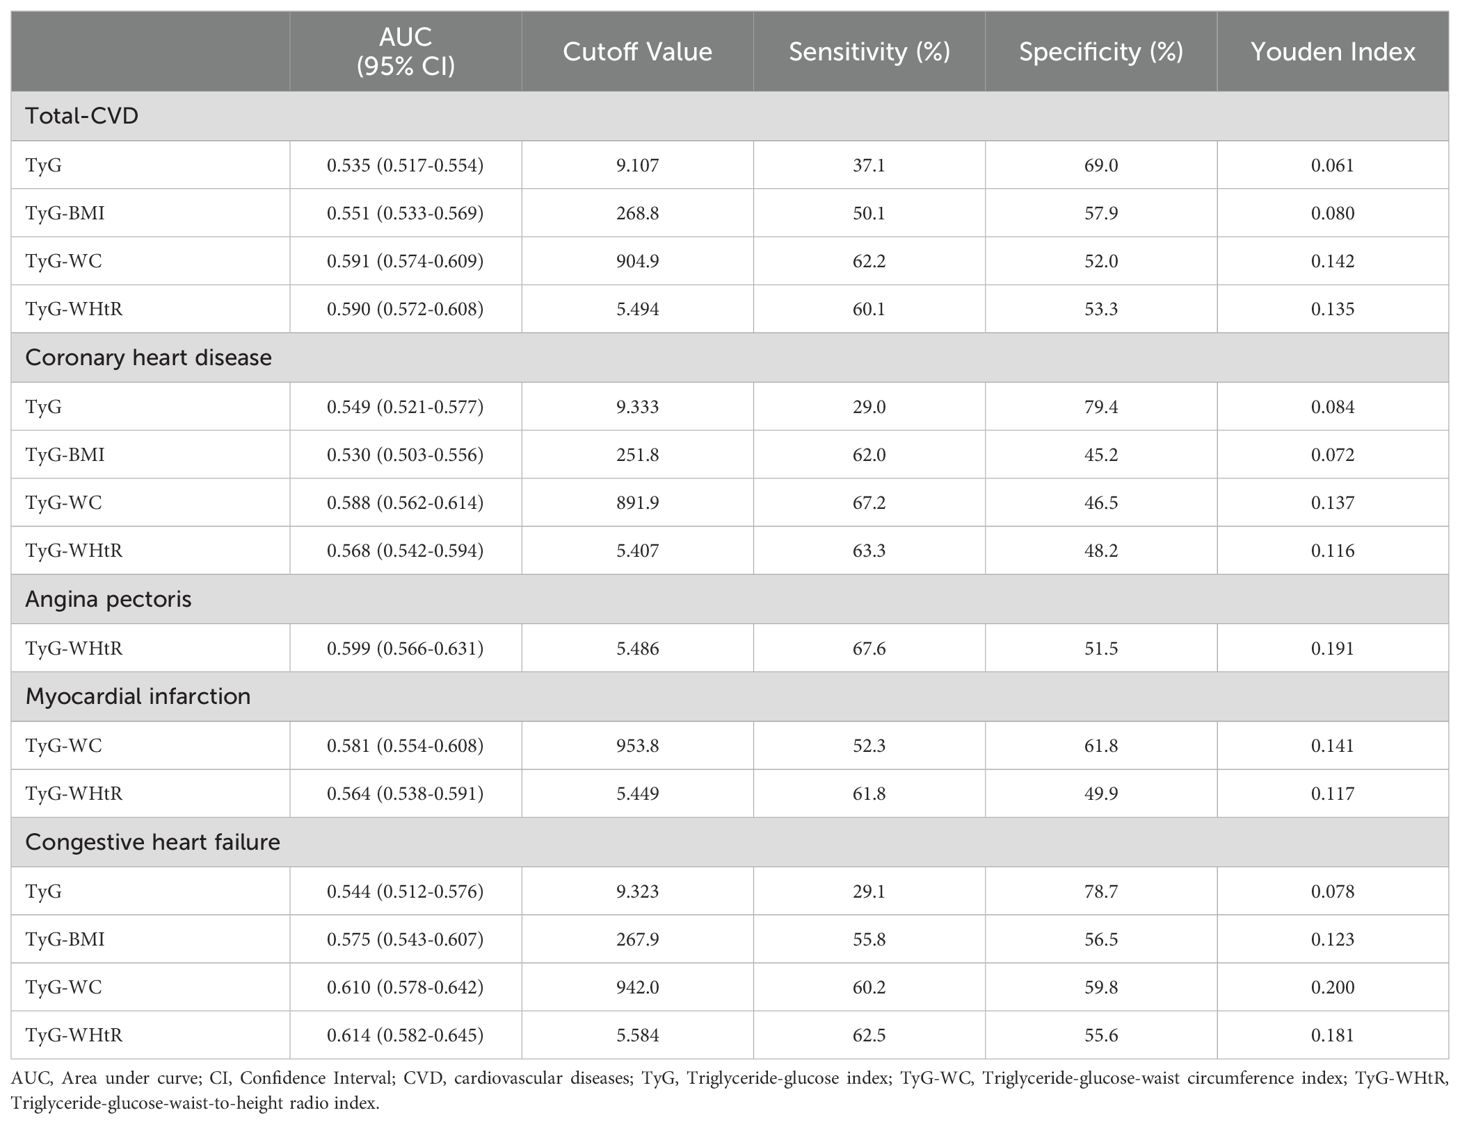
Table 4. Results of ROC analysis.
4 Discussion
To our knowledge, this study represents the first investigation into the associations of TyG and combined obesity indices with both chest pain and CVD among individuals with diabetes and pre-diabetes. Our study revealed that TyG and combined obesity indices were significantly associated with chest pain and total-CVD, among which TyG, TyG-WC, and TyG-WHtR present curvilinear associations for total-CVD. Furthermore, different associations of TyG and its related parameters with the occurrence of different CVD in individuals with dysglycemia were observed. Among the above indicators, TyG-WC had the most robust predictive efficacy for total-CVD, CHD, and MI, while TyG-WHtR had the best predictive ability for angina pectoris and HF.
The TyG index, a measure of insulin sensitivity (33, 34), has emerged as a significant risk factor for various metabolic disorders, including diabetes, pre-diabetes, obesity, CVD and renal insufficiency (35–39). Recent studies have suggested that a higher TyG index was associated with an increased risk of varying cardiovascular events, including CHD, MI, carotid plaque, and so on (40–42). A meta-analysis further underscored that higher TyG was significantly associated with an increased risk of ASCVD (43). Another retrospective cohort study demonstrated that higher TyG was associated with a poorer prognosis for MI patients with diabetes (44). However, conflicting findings emerged from another study. Schmiegelow et al. found that IR was associated with CVD risk after adjustment for age and race, but this association was no longer significant after adjustment for HDL-C. There are two potential explanations for this. On the one hand, the study was limited to postmenopausal women and may not be generalizable to younger women or men. On the other hand, strokes that could not be classified as ischemic or hemorrhagic strokes were excluded, and some data may have been missed. In addition, the relationship between TyG and HF was also confirmed previously (45, 46). Our study indicated that TyG may serve as a predictive marker for total-CVD, CHD, MI, and HF, consistent with prior research findings. Yao et al. demonstrated a positive linear relationship between TyG and chest pain (47). Similarly, the correlation between TyG and chest pain was confirmed among the pathoglycemia population after adjustment in Model 3.
Obesity is well-established as a risk factor for CVD, and previous research has also linked obesity to IR and diabetes (48, 49). Therefore, TyG combined obesity indicators were brought into study in the recent year. Notably, our study focused on the correlation between TyG combined with obesity indicators and cardiovascular events in the pathoglycemia population. Overall, the result demonstrated that individuals with higher TyG-BMI, TyG-WC, and TyG-WHtR were more likely to have an increased risk of total-CVD, CHD, MI, and HF. In our research, TyG-WC and TyG-WHtR showed the best correlation with CHD and HF, while TyG-BMI had the best correlation with CHD. Dang et al. revealed that TyG-WC, TyG-WHtR, and TyG-BMI were positively associated with cardiovascular events mentioned above, and both TyG-WC and TyG-WHtR had more robust predictive efficacy than TyG in the American population, which was in line with our research (50). ROC analysis showed that TyG-WC may be a better predictor for total-CVD, MI, and coronary disease than other indicators, while TyG-WHtR may be better at predicting HF than other indicators. Indeed, most of the current studies have focused on the effects of the current most popular TyG, while studies on these TyG-related parameters are still relatively scattered. Prior studies demonstrated the superiority of the TyG-related index as a risk factor for metabolic diseases, which are always cooccurrences with cardiovascular events (51). Another cross-sectional study conducted in Tawan suggested that higher TyG, TyG-BMI, and TyG-WC were accompanied by a higher risk of CVD as well (52). In accordance, a 15-year follow-up prospective cohort study enrolled 98191 participants and demonstrated that TyG-WC and TyG-WHtR showed better capacity in predicting ASCVD compared with TyG (AUC: TyG: 0.583; TyG-WC: 0.612; TyG-WHtR: 0.613) (28). Nevertheless, it’s worth noting that some of the previous studies demonstrated contrasting results. A prospective cohort study confirmed significantly and positively correlation between TyG-related index and cardiovascular diseases (TyG-WC: HR: 1.256 95%CI 1.090-1.447; TyG-BMI: HR: 1.343 95%CI 1.183-1.525; TyG-WHtR: HR: 1.252 95%CI 1.088-1.441) (53). However, this study pointed out non-significant correlation of TyG-related indicators in diabetes population, which is quite distinct with us. Considering that pathoglycemia individuals generally have higher surrogate values of IR, the association with CVD is more complex relative to normal group. Moreover, a retrospective observational cohort study suggested TyG perform better in predicting individuals at risk of incident cardiovascular events than TyG-related indicators, including TyG-WC and TyG-WHtR (54). This study found a different conclusion, whose primary outcome was incident ASCVD, including MI and ischemic stroke, and the fact that the study population was composed of individuals from various ethnic backgrounds may have contributed to the discrepancies. The mechanisms underlying the different predictive performance have not been fully elucidated, and the combined effects of IR and excess abdominal fat on CVD risk are a possible explanation. Insulin sensitivity, represented by TyG, and excessive accumulation of visceral adiposity, indicated by central adiposity measures, are both strongly associated with chronic inflammation, endothelial dysfunction, and atherosclerosis, all of which increase CVD risk. Those controversy results inspire more research to further explore the association of surrogate IR indexes with cardiovascular events. Furthermore, the majority of previous research concentrated on the overall population, with very few studies focusing on the pathoglycemia population or other specific individuals. Notably, our study found no significant link of the TyG and its related index with stroke in pathoglycemia individuals. However, a cohort study among rural Chinese people found a significant correlation between the TyG and combined obesity index and stroke (55). Given the strong association between diabetes, pre-diabetes, and CVD, excellent predictors seem to be crucial for earlier diagnosis and better prognosis, so that more research to further explore the potential relationship between TyG and related index with cerebrovascular disease makes great sense, particularly among pathoglycemia groups. Overall, more research on those indexes is critical for predicting cardiovascular events.
The TyG index is a measurement of insulin sensitivity in humans. Recently, IR can be defined as an impaired response to insulin stimulation of tissue cells so that hyperinsulinemia takes place consequently. IR was associated with kinds of metabolic syndromes, including type 2 diabetes, obesity, and CVD (56, 57). Obesity has been recognized as one of the most crucial factors for cardiovascular events for a long time, including dyslipidemia, IR, type 2 diabetes, hypertension, and so on (58, 59). Recently, with the interaction between IR and obesity, combined indexes have emerged to enhance predictive capability and facilitate earlier diagnosis. Although the underlying mechanism between TyG with TyG-related index and cardiovascular events still remains unclear, several potential pathophysiological pathways have been discussed in previous studies. Physiological concentrations of insulin will contribute to vascular relaxation and promote the production of nitric oxide in endothelial cells for tissue artery recruitment. Insulin-resistant states may hinder these physical processes, and consequently, hyperinsulinemia may encourage vascular constriction, potentially leading to vascular stiffening and even hypertension (60, 61). According to a study, insulin plays a role in mediating Na+ channels, and consequently, hyperinsulinemia leads to Na+ channel dysfunction, which further remodels the vasculature (62). Moreover, previous studies have shown that the dysfunction of EnNaC contributes to cardiac fibrosis, which is likely a crucial factor in the remodeling of cardiac diastolic dysfunction (63, 64). In addition, IR can cause downregulation of SGK-1 expression, which promotes adipocyte and immune cell dysfunction, resulting in dyslipidemia and abnormal systemic inflammation, and finally accelerate atherosclerosis (65–67). Finally, IR can contribute to plate adhesion, activation, and aggregation, leading to cardiac dysfunction and myocardial injury (68, 69). Overall, our research demonstrated that the TyG combined obesity index had a higher correlation with chest pain and cardiovascular events. We also revealed their superiority in predicting total-CVD, MI, angina, and coronary diseases simultaneously, with WC and WHtR demonstrating the most robust potential diagnosis efficacy for cardiovascular events in individuals with diabetes and pre-diabetes. The superiority of these combined indicators may stem from the fact that individuals with pathoglycemia are always associated with a higher risk of abdominal obesity or dyslipidemia. Numerous related studies have emphasized the potential of these emerging indexes, despite some differences with prior studies. There are reasons to believe that it makes sense to apply those indices to the clinic for earlier diagnosis and more timely interventions among the pathoglycemia population.
The study adds to existing knowledge by providing new evidence on how TyG and combined TyG-obesity indicators are linked to chest pain and cardiovascular events in both diabetic and pre-diabetic people. Furthermore, the research data comes from NHANES, which guarantees a large and representative sample for the study. Nevertheless, there still remain some limitations. Firstly, the samples included in this database only come from the United States, which may limit the generalizability of the findings. Populations in different regions may have different risk factors and prevalence of disease because of differences in genetics, environment, lifestyle, and health care systems. Future studies should replicate these findings in different countries and ethnic groups to assess whether the associations of TyG and TyG combined obesity indicators with chest pain and cardiovascular events are generalizable. Secondly, despite adjusting for numerous confounding factors, there is inevitably the influence of unmeasured or residual confounders affecting the results. For example, dietary patterns, genetic factors, and psychosocial factors, among others, may all be associated with the primary outcome variables studied but may not have been fully considered in this study. Future studies should consider including these factors to more accurately estimate the impact of TyG-related metrics. Thirdly, even though the NHANES questionnaire adheres to strict quality control, the validity of the study may still be impacted by the limitations of self-reported measurement and potential misclassification of results. If participants tended to underestimate or not report their chest pain and CVD status, this may have led to studies underestimating the true prevalence of these conditions. This underestimation may attenuate the actual strength of the association of TyG related measures with chest pain and CVD. Future studies should use more objective measures to reduce bias validation and strengthen the findings of the current study. Fourthly, due to the inherent limitations of the NHANES database, it is difficult for us to establish a causal relationship between chest pain and the survey variable and to further study the etiology of chest pain. Future studies should employ prospective cohort studies or randomized controlled trials to better understand the temporal order and potential causal pathways between these variables. Finally, the study did not discuss the inter-group differences between diabetes and pre-diabetes.
5 Conclusion
In our research, TyG and combined obesity indices were significantly associated with chest pain and total-CVD among the pathoglycemia population. Specifically, TyG-WC had the most robust predictive efficacy for total-CVD, CHD and MI, while TyG-WHtR had the best predictive ability for angina pectoris and HF. In the context of a growing disease burden and limited medical resources, this study identified predictive surrogate indexes for IR that are both convenient, cost-effective and well-predictive. It is expected to offer valuable references for the screening and prediction of potential cardiovascular disease risk in primary hospitals and communities with abnormal blood glucose.
Data availability statement
Publicly available datasets were analyzed in this study. This data can be found here: https://www.cdc.gov/nchs/nhanes/index.htm.
Ethics statement
The studies involving humans were approved by The National Center for Health Statistics Research Ethics Review Board. The studies were conducted in accordance with the local legislation and institutional requirements. Written informed consent for participation was not required from the participants or the participants’ legal guardians/next of kin in accordance with the national legislation and institutional requirements.
Author contributions
DZ: Conceptualization, Data curation, Formal analysis, Investigation, Methodology, Software, Visualization, Writing – original draft, Writing – review & editing. JC: Data curation, Formal analysis, Investigation, Software, Supervision, Validation, Writing – original draft, Writing – review & editing. SX: Methodology, Software, Writing – original draft, Writing – review & editing. SJ: Visualization, Writing – original draft. CL: Writing – original draft, Writing – review & editing. BW: Conceptualization, Data curation, Formal analysis, Investigation, Project administration, Supervision, Writing – original draft, Writing – review & editing.
Funding
The author(s) declare financial support was received for the research, authorship, and/or publication of this article. This work was supported by the 2020 Li Ka Shing Foundation Cross-Disciplinary Research Grant (No. L1111 2004).
Acknowledgments
The authors thank the National Health Insurance Service for providing data and support.
Conflict of interest
The authors declare that the research was conducted in the absence of any commercial or financial relationships that could be construed as a potential conflict of interest.
Publisher’s note
All claims expressed in this article are solely those of the authors and do not necessarily represent those of their affiliated organizations, or those of the publisher, the editors and the reviewers. Any product that may be evaluated in this article, or claim that may be made by its manufacturer, is not guaranteed or endorsed by the publisher.
Supplementary material
The Supplementary Material for this article can be found online at: https://www.frontiersin.org/articles/10.3389/fendo.2024.1471535/full#supplementary-material
References
1. Vaduganathan M, Mensah GA, Turco JV, Fuster V, Roth GA. The global burden of cardiovascular diseases and risk: A compass for future health. J Am Coll Cardiol. (2022) 80:2361–71. doi: 10.1016/j.jacc.2022.11.005
2. Tsao CW, Aday AW, Almarzooq ZI, Anderson CAM, Arora P, Avery CL, et al. Heart disease and stroke statistics-2023 update: A report from the american heart association. Circulation. (2023) 147:e93–e621. doi: 10.1161/CIR.0000000000001123
3. 2024-statistics-at-A-glance-final_2024.pdf . Available online at: https://www.heart.org/-/media/PHD-Files-2/Science-News/2/2024-Heart-and-Stroke-Stat-Update/2024-Statistics-At-A-Glance-final_2024.pdf?sc_lang=en&hash=D0A208F50F8591AEED0E31BE77265505 (Accessed July 12, 2024).
4. Ruigómez A, Rodríguez LAG, Wallander M-A, Johansson S, Jones R. Chest pain in general practice: incidence, comorbidity and mortality. Fam Pract. (2006) 23:167–74. doi: 10.1093/fampra/cmi124
5. Jordan KP, Timmis A, Croft P, van der Windt DA, Denaxas S, González-Izquierdo A, et al. Prognosis of undiagnosed chest pain: linked electronic health record cohort study. BMJ. (2017) 357:j1194. doi: 10.1136/bmj.j1194
6. Di Pino A, DeFronzo RA. Insulin resistance and atherosclerosis: implications for insulin-sensitizing agents. Endocr Rev. (2019) 40:1447–67. doi: 10.1210/er.2018-00141
7. Cai X, Hu J, Zhu Q, Wang M, Liu S, Dang Y, et al. Relationship of the metabolic score for insulin resistance and the risk of stroke in patients with hypertension: A cohort study. Front Endocrinol (Lausanne). (2022) 13:1049211. doi: 10.3389/fendo.2022.1049211
8. Yang W, Cai X, Hu J, Wen W, Mulalibieke H, Yao X, et al. The metabolic score for insulin resistance (METS-IR) predicts cardiovascular disease and its subtypes in patients with hypertension and obstructive sleep apnea. Clin Epidemiol. (2023) 15:177–89. doi: 10.2147/CLEP.S395938
9. Beverly JK, Budoff MJ. Atherosclerosis: Pathophysiology of insulin resistance, hyperglycemia, hyperlipidemia, and inflammation. J Diabetes. (2020) 12:102–4. doi: 10.1111/1753-0407.12970
10. Cersosimo E, Solis-Herrera C, Trautmann ME, Malloy J, Triplitt CL. Assessment of pancreatic β-cell function: review of methods and clinical applications. Curr Diabetes Rev. (2014) 10:2–42. doi: 10.2174/1573399810666140214093600
11. Gastaldelli A. Measuring and estimating insulin resistance in clinical and research settings. Obes (Silver Spring). (2022) 30:1549–63. doi: 10.1002/oby.23503
12. Wan H, Cao H, Ning P. Superiority of the triglyceride glucose index over the homeostasis model in predicting metabolic syndrome based on NHANES data analysis. Sci Rep. (2024) 14:15499. doi: 10.1038/s41598-024-66692-9
13. Santulli G, Visco V, Varzideh F, Guerra G, Kansakar U, Gasperi M, et al. Prediabetes increases the risk of frailty in prefrail older adults with hypertension: beneficial effects of metformin. Hypertension. (2024) 81:1637–43. doi: 10.1161/HYPERTENSIONAHA.124.23087
14. Barzegar N, Tohidi M, Hasheminia M, Azizi F, Hadaegh F. The impact of triglyceride-glucose index on incident cardiovascular events during 16 years of follow-up: Tehran Lipid and Glucose Study. Cardiovasc Diabetol. (2020) 19:155. doi: 10.1186/s12933-020-01121-5
15. Liu X, Tan Z, Huang Y, Zhao H, Liu M, Yu P, et al. Relationship between the triglyceride-glucose index and risk of cardiovascular diseases and mortality in the general population: a systematic review and meta-analysis. Cardiovasc Diabetol. (2022) 21:124. doi: 10.1186/s12933-022-01546-0
16. Jia Y, Zhang Y, Bai S, Liu J, Chen T, Liu X, et al. Triglyceride glucose index is a risk factor for heart failure: A prospective cohort study. ESC Heart Fail. (2024). doi: 10.1002/ehf2.14963
17. Hu J, Cai X, Li N, Zhu Q, Wen W, Hong J, et al. Association between triglyceride glucose index-waist circumference and risk of first myocardial infarction in chinese hypertensive patients with obstructive sleep apnoea: an observational cohort study. Nat Sci Sleep. (2022) 14:969–80. doi: 10.2147/NSS.S362101
18. Zhao W, Wang J, Chen D, Ding W, Hou J, Gui Y, et al. Triglyceride-glucose index as a potential predictor of major adverse cardiovascular and cerebrovascular events in patients with coronary heart disease complicated with depression. Front Endocrinol (Lausanne). (2024) 15:1416530. doi: 10.3389/fendo.2024.1416530
19. Emerging Risk Factors Collaboration, Wormser D, Kaptoge S, Di Angelantonio E, Wood AM, Pennells L, et al. Separate and combined associations of body-mass index and abdominal adiposity with cardiovascular disease: collaborative analysis of 58 prospective studies. Lancet. (2011) 377:1085–95. doi: 10.1016/S0140-6736(11)60105-0
20. Gonçalves FB, Koek M, Verhagen HJM, Niessen WJ, Poldermans D. Body-mass index, abdominal adiposity, and cardiovascular risk. Lancet. (2011) 378:227. doi: 10.1016/S0140-6736(11)61121-5
21. Wang X, Liu J, Cheng Z, Zhong Y, Chen X, Song W. Triglyceride glucose-body mass index and the risk of diabetes: a general population-based cohort study. Lipids Health Dis. (2021) 20:99. doi: 10.1186/s12944-021-01532-7
22. Zhang X, Zhang T, He S, Jia S, Zhang Z, Ye R, et al. Retraction Note to: Association of metabolic syndrome with TyG index and TyG-related parameters in an urban Chinese population: a 15-year prospective study. Diabetol Metab Syndr. (2022) 14:118. doi: 10.1186/s13098-022-00889-8
23. Zhang Y, Wang F, Tang J, Shen L, He J, Chen Y. Association of triglyceride glucose-related parameters with all-cause mortality and cardiovascular disease in NAFLD patients: NHANES 1999-2018. Cardiovasc Diabetol. (2024) 23:262. doi: 10.1186/s12933-024-02354-4
24. Einarson TR, Acs A, Ludwig C, Panton UH. Prevalence of cardiovascular disease in type 2 diabetes: a systematic literature review of scientific evidence from across the world in 2007-2017. Cardiovasc Diabetol. (2018) 17:83. doi: 10.1186/s12933-018-0728-6
25. Zhang X, Du Y, Zhang T, Zhao Z, Guo Q, Ma X, et al. Prognostic significance of triglyceride-glucose index in acute coronary syndrome patients without standard modifiable cardiovascular risk factors. Cardiovasc Diabetol. (2024) 23:270. doi: 10.1186/s12933-024-02345-5
26. Jihong S, Xiaojie C, He L, Yifan Z. Association between the triglyceride glucose index and atherosclerotic cardiovascular disease in the general population: analysis of the national health and nutrition examination survey 1999-2004. Front Endocrinol (Lausanne). (2024) 15:1376357. doi: 10.3389/fendo.2024.1376357
27. American Diabetes Association. Classification and diagnosis of diabetes: standards of medical care in diabetes-2021. Diabetes Care. (2021) 44:S15–33. doi: 10.2337/dc21-S002
28. Xia X, Chen S, Tian X, Xu Q, Zhang Y, Zhang X, et al. Association of triglyceride-glucose index and its related parameters with atherosclerotic cardiovascular disease: evidence from a 15-year follow-up of Kailuan cohort. Cardiovasc Diabetol. (2024) 23:208. doi: 10.1186/s12933-024-02290-3
29. Drinking levels defined | National institute on alcohol abuse and alcoholism (NIAAA). Available online at: https://www.niaaa.nih.gov/alcohol-health/overview-alcohol-consumption/moderate-binge-drinking (Accessed July 12, 2024).
30. Piercy KL, Troiano RP, Ballard RM, Carlson SA, Fulton JE, Galuska DA, et al. The physical activity guidelines for americans. JAMA. (2018) 320:2020–8. doi: 10.1001/jama.2018.14854
31. Liu Q, Bai B, Liu F, Chen Y, Wang Y, Wang H, et al. Long-term trends in risk factor management in respondents with chronic kidney disease in the USA. Am J Nephrol. (2022) 53:614–23. doi: 10.1159/000525733
32. Muntner P, Hardy ST, Fine LJ, Jaeger BC, Wozniak G, Levitan EB, et al. Trends in blood pressure control among US adults with hypertension, 1999-2000 to 2017-2018. JAMA. (2020) 324:1190. doi: 10.1001/jama.2020.14545
33. Gastaldelli A. Measuring and estimating insulin resistance in clinical and research settings. Obes (Silver Spring). (2022) 30:1549–63. doi: 10.1002/oby.23503
34. Wang H, Chen G, Sun D, Ma Y. The threshold effect of triglyceride glucose index on diabetic kidney disease risk in patients with type 2 diabetes: unveiling a non-linear association. Front Endocrinol (Lausanne). (2024) 15:1411486. doi: 10.3389/fendo.2024.1411486
35. Zhang W, Yang Z. Association between the triglyceride glucose index and the risk of acute kidney injury in critically ill patients with hypertension: analysis of the MIMIC-IV database. Front Endocrinol (Lausanne). (2024) 15:1437709. doi: 10.3389/fendo.2024.1437709
36. Hou Q, Zhang H, Zhang R, Li B, Li L, Li D, et al. Relationship between the longitudinal trajectory of the triglyceride-glucose index and the development of CKD: an 8-year retrospective longitudinal cohort study. Front Endocrinol (Lausanne). (2024) 15:1376166. doi: 10.3389/fendo.2024.1376166
37. Chamroonkiadtikun P, Ananchaisarp T, Wanichanon W. The triglyceride-glucose index, a predictor of type 2 diabetes development: A retrospective cohort study. Prim Care Diabetes. (2020) 14:161–7. doi: 10.1016/j.pcd.2019.08.004
38. Moon S, Park JS, Ahn Y. The cut-off values of triglycerides and glucose index for metabolic syndrome in american and korean adolescents. J Korean Med Sci. (2017) 32:427–33. doi: 10.3346/jkms.2017.32.3.427
39. Tao L-C, Xu J-N, Wang T-T, Hua F, Li J-J. Triglyceride-glucose index as a marker in cardiovascular diseases: landscape and limitations. Cardiovasc Diabetol. (2022) 21:68. doi: 10.1186/s12933-022-01511-x
40. Jin J-L, Cao Y-X, Wu L-G, You X-D, Guo Y-L, Wu N-Q, et al. Triglyceride glucose index for predicting cardiovascular outcomes in patients with coronary artery disease. J Thorac Dis. (2018) 10:6137–46. doi: 10.21037/jtd.2018.10.79
41. Won K-B, Park EJ, Han D, Lee JH, Choi S-Y, Chun EJ, et al. Triglyceride glucose index is an independent predictor for the progression of coronary artery calcification in the absence of heavy coronary artery calcification at baseline. Cardiovasc Diabetol. (2020) 19:34. doi: 10.1186/s12933-020-01008-5
42. Wu Z, Wang J, Li Z, Han Z, Miao X, Liu X, et al. Triglyceride glucose index and carotid atherosclerosis incidence in the Chinese population: A prospective cohort study. Nutr Metab Cardiovasc Dis. (2021) 31:2042–50. doi: 10.1016/j.numecd.2021.03.027
43. Ding X, Wang X, Wu J, Zhang M, Cui M. Triglyceride-glucose index and the incidence of atherosclerotic cardiovascular diseases: a meta-analysis of cohort studies. Cardiovasc Diabetol. (2021) 20:76. doi: 10.1186/s12933-021-01268-9
44. Wang L, Cong H-L, Zhang J-X, Hu Y-C, Wei A, Zhang Y-Y, et al. Triglyceride-glucose index predicts adverse cardiovascular events in patients with diabetes and acute coronary syndrome. Cardiovasc Diabetol. (2020) 19:80. doi: 10.1186/s12933-020-01054-z
45. Xu L, Wu M, Chen S, Yang Y, Wang Y, Wu S, et al. Triglyceride-glucose index associates with incident heart failure: A cohort study. Diabetes Metab. (2022) 48:101365. doi: 10.1016/j.diabet.2022.101365
46. Li X, Chan JSK, Guan B, Peng S, Wu X, Lu X, et al. Triglyceride-glucose index and the risk of heart failure: Evidence from two large cohorts and a mendelian randomization analysis. Cardiovasc Diabetol. (2022) 21:229. doi: 10.1186/s12933-022-01658-7
47. Zhao Y, Gu Y, Zhang B. Associations of triglyceride-glucose (TyG) index with chest pain incidence and mortality among the U.S. population. Cardiovasc Diabetol. (2024) 23:111. doi: 10.1186/s12933-024-02209-y
48. Kullmann S, Valenta V, Wagner R, Tschritter O, Machann J, Häring H-U, et al. Brain insulin sensitivity is linked to adiposity and body fat distribution. Nat Commun. (2020) 11:1841. doi: 10.1038/s41467-020-15686-y
49. Lionetti L, Mollica MP, Lombardi A, Cavaliere G, Gifuni G, Barletta A. From chronic overnutrition to insulin resistance: the role of fat-storing capacity and inflammation. Nutr Metab Cardiovasc Dis. (2009) 19:146–52. doi: 10.1016/j.numecd.2008.10.010
50. Dang K, Wang X, Hu J, Zhang Y, Cheng L, Qi X, et al. The association between triglyceride-glucose index and its combination with obesity indicators and cardiovascular disease: NHANES 2003-2018. Cardiovasc Diabetol. (2024) 23:8. doi: 10.1186/s12933-023-02115-9
51. Xuan W, Liu D, Zhong J, Luo H, Zhang X. Impacts of triglyceride glucose-waist to height ratio on diabetes incidence: A secondary analysis of A population-based longitudinal data. Front Endocrinol (Lausanne). (2022) 13:949831. doi: 10.3389/fendo.2022.949831
52. Huang Y-C, Huang J-C, Lin C-I, Chien H-H, Lin Y-Y, Wang C-L, et al. Comparison of innovative and traditional cardiometabolic indices in estimating atherosclerotic cardiovascular disease risk in adults. Diagnostics (Basel). (2021) 11:603. doi: 10.3390/diagnostics11040603
53. Liu L, Peng J, Wang N, Wu Z, Zhang Y, Cui H, et al. Comparison of seven surrogate insulin resistance indexes for prediction of incident coronary heart disease risk: a 10-year prospective cohort study. Front Endocrinol (Lausanne). (2024) 15:1290226. doi: 10.3389/fendo.2024.1290226
54. Cui C, Qi Y, Song J, Shang X, Han T, Han N, et al. Comparison of triglyceride glucose index and modified triglyceride glucose indices in prediction of cardiovascular diseases in middle aged and older Chinese adults. Cardiovasc Diabetol. (2024) 23:185. doi: 10.1186/s12933-024-02278-z
55. Zhao Y, Zhang J, Chen C, Qin P, Zhang M, Shi X, et al. Comparison of six surrogate insulin resistance indexes for predicting the risk of incident stroke: The Rural Chinese Cohort Study. Diabetes Metab Res Rev. (2022) 38:e3567. doi: 10.1002/dmrr.3567
56. Powell-Wiley TM, Poirier P, Burke LE, Després J-P, Gordon-Larsen P, Lavie CJ, et al. Obesity and cardiovascular disease: A scientific statement from the american heart association. Circulation. (2021) 143:e984–e1010. doi: 10.1161/CIR.0000000000000973
57. Tahapary DL, Pratisthita LB, Fitri NA, Marcella C, Wafa S, Kurniawan F, et al. Challenges in the diagnosis of insulin resistance: Focusing on the role of HOMA-IR and Tryglyceride/glucose index. Diabetes Metab Syndr. (2022) 16:102581. doi: 10.1016/j.dsx.2022.102581
58. Heit JA, Spencer FA, White RH. The epidemiology of venous thromboembolism. J Thromb Thrombolysis. (2016) 41:3–14. doi: 10.1007/s11239-015-1311-6
59. Rahmani J, Haghighian Roudsari A, Bawadi H, Thompson J, Khalooei Fard R, Clark C, et al. Relationship between body mass index, risk of venous thromboembolism and pulmonary embolism: A systematic review and dose-response meta-analysis of cohort studies among four million participants. Thromb Res. (2020) 192:64–72. doi: 10.1016/j.thromres.2020.05.014
60. Muniyappa R, Sowers JR. Endothelial insulin and IGF-1 receptors: when yes means NO. Diabetes. (2012) 61:2225–7. doi: 10.2337/db12-0654
61. Hill MA, Jaisser F, Sowers JR. Role of the vascular endothelial sodium channel activation in the genesis of pathologically increased cardiovascular stiffness. Cardiovasc Res. (2022) 118:130–40. doi: 10.1093/cvr/cvaa326
62. Muniyappa R, Chen H, Montagnani M, Sherman A, Quon MJ. Endothelial dysfunction due to selective insulin resistance in vascular endothelium: insights from mechanistic modeling. Am J Physiol Endocrinol Metab. (2020) 319:E629–46. doi: 10.1152/ajpendo.00247.2020
63. Sowers JR, Habibi J, Jia G, Bostick B, Manrique-Acevedo C, Lastra G, et al. Endothelial sodium channel activation promotes cardiac stiffness and diastolic dysfunction in Western diet fed female mice. Metabolism. (2020) 109:154223. doi: 10.1016/j.metabol.2020.154223
64. Hill MA, Yang Y, Zhang L, Sun Z, Jia G, Parrish AR, et al. Insulin resistance, cardiovascular stiffening and cardiovascular disease. Metabolism. (2021) 119:154766. doi: 10.1016/j.metabol.2021.154766
65. Li P, Pan F, Hao Y, Feng W, Song H, Zhu D. SGK1 is regulated by metabolic-related factors in 3T3-L1 adipocytes and overexpressed in the adipose tissue of subjects with obesity and diabetes. Diabetes Res Clin Pract. (2013) 102:35–42. doi: 10.1016/j.diabres.2013.08.009
66. Norlander AE, Saleh MA, Pandey AK, Itani HA, Wu J, Xiao L, et al. A salt-sensing kinase in T lymphocytes, SGK1, drives hypertension and hypertensive end-organ damage. JCI Insight. (2017) 2:e92801. doi: 10.1172/jci.insight.92801
67. Rohm TV, Meier DT, Olefsky JM, Donath MY. Inflammation in obesity, diabetes, and related disorders. Immunity. (2022) 55:31–55. doi: 10.1016/j.immuni.2021.12.013
68. Du T, Yuan G, Zhang M, Zhou X, Sun X, Yu X. Clinical usefulness of lipid ratios, visceral adiposity indicators, and the triglycerides and glucose index as risk markers of insulin resistance. Cardiovasc Diabetol. (2014) 13:146. doi: 10.1186/s12933-014-0146-3
Keywords: triglyceride-glucose index, obesity, pre-diabetes, diabetes, chest pain, cardiovascular disease
Citation: Zheng D, Cai J, Xu S, Jiang S, Li C and Wang B (2024) The association of triglyceride-glucose index and combined obesity indicators with chest pain and risk of cardiovascular disease in American population with pre-diabetes or diabetes. Front. Endocrinol. 15:1471535. doi: 10.3389/fendo.2024.1471535
Received: 27 July 2024; Accepted: 19 August 2024;
Published: 06 September 2024.
Edited by:
Gaetano Santulli, Albert Einstein College of Medicine, United StatesReviewed by:
Xintian Cai, People’s Hospital of Xinjiang Uygur Autonomous Region, ChinaFrancesco Di Giacomo Barbagallo, University of Catania, Italy
Copyright © 2024 Zheng, Cai, Xu, Jiang, Li and Wang. This is an open-access article distributed under the terms of the Creative Commons Attribution License (CC BY). The use, distribution or reproduction in other forums is permitted, provided the original author(s) and the copyright owner(s) are credited and that the original publication in this journal is cited, in accordance with accepted academic practice. No use, distribution or reproduction is permitted which does not comply with these terms.
*Correspondence: Bin Wang, YXNjaDM2OUAxMjYuY29t