 Aditya Saxena1
 Pradeep Tiwari2Shalu Gupta3Rajendra Mandia3Ramesh C. Banshiwal4Ravinder Kumar Lamoria4
 Ranjit Mohan Anjana5Venkatesan Radha5
 Viswanathan Mohan5
 Sandeep Kumar Mathur6*†
- 1Department of Computer Engineering & Applications, GLA University, Mathura, India
- 2Department of Biotechnology and Bioinformatics, Birla Institute of Scientific Research, Jaipur, India
- 3Department of General Surgery, Sawai Man Singh (SMS) Medical College and Attached Hospital, Jaipur, India
- 4Department of Orthopedics, Sawai Man Singh (SMS) Medical College and Attached Hospital, Jaipur, India
- 5Department of Diabetology, Madras Diabetes Research Foundation, Chennai, Tamil Nadu, India
- 6Department of Endocrinology, Sawai Man Singh (SMS) Medical College, Jaipur, India
Background: Studying the molecular mechanisms of lipodystrophy can provide valuable insights into the pathophysiology of insulin resistance (IR), type 2 diabetes (T2D), and other clustering diseases [metabolic syndrome (MetS)] and its underlying adipocentric disease (MetS disease).
Methods: A high-confidence lipodystrophy gene panel comprising 50 genes was created, and their expressions were measured in the visceral and subcutaneous (both peripheral and abdominal) adipose depots of MetS and non-MetS individuals at a tertiary care medical facility.
Results: Most lipodystrophy genes showed significant downregulation in MetS individuals compared to non-MetS individuals in both subcutaneous and visceral depots. In the abdominal compartment, all the genes showed relatively higher expression in visceral depot as compared to their subcutaneous counterpart, and this difference narrowed with increasing severity of MetS. Their expression level shows an inverse correlation with T2D, MetS, and HOMA-IR and with other T2D-related intermediate traits. Results also demonstrated that individualization of MetS patients could be done based on adipose tissue expression of just 12 genes.
Conclusion: Adipose tissue expression of lipodystrophy genes shows an association with MetS and its intermediate phenotypic traits. Mutations of these genes are known to cause congenital lipodystrophy syndromes, whereas their altered expression in adipose tissue contributes to the pathogenesis of IR, T2D, and MetS.
Introduction
Metabolic syndrome (MetS) has long been debated as a predictor of atherosclerotic cardiovascular (CV) risk, but it has not been universally accepted as a clinical entity. It potentially offers no additional CV risk beyond its individual components, and its unifying pathophysiological mechanisms remain largely unexplored (1–3). Nevertheless, MetS is recognized as a complex condition characterized by metabolic dysregulation, including insulin resistance (IR), hyperinsulinemia, and increased susceptibility to type 2 diabetes (T2D), cardiovascular disease (CVD), hypertension, Alzheimer’s disease, certain cancers, and other disorders (4, 5). Individuals with MetS may also exhibit low-grade inflammation, oxidative and endoplasmic reticulum (ER) stress, mitochondrial dysfunction, and impaired exercise capacity (6–8). It is commonly associated with obesity, particularly central obesity, but it can also involve subtle manifestations of excess adiposity, such as ectopic fat deposits in the liver, muscle, pancreas, etc. (9–11). Therefore, these insights into its pathophysiology point toward an adipocentric metabolic disorder that is clinically expressed as IR and other clustering diseases. In this article, we propose to coin the term “MetS disease or adiposopathy” to describe this adipocentric metabolic disorder underlying a cluster of diseases, the so-called “clinical MetS”.
Phenotypically, MetS bears a resemblance to a rare genetic disease, i.e., congenital lipodystrophy syndrome, although it has less severe clinical manifestations (12–16). They depict a U-shaped relationship between adiposity and consequent morbidity and mortality (“obesity-paradox”) (3–6). Interestingly, many South Asians with T2D and MetS illustrate this obesity paradox because dysmetabolism in them is associated with a relatively low body mass index (BMI) (7–11). Although traditionally IR and T2D in them is attributed to increased visceral fat accumulation, recent observations suggest that it is associated with less peripheral fat and more ectopic liver fat. IR in them shows a trend toward stronger positive and negative correlation with ectopic liver and subcutaneous fat mass respectively in its higher quartiles (17). This fat distribution pattern mimics that of congenital partial lipodystrophy syndromes (18–20).
Congenital lipodystrophies are monogenic genetic diseases in which the underlying genetic mutations, the consequent molecular mechanisms leading to adipose tissue deficiency or severe dysfunction, and the pathophysiology of metabolic dysfunction are well-deciphered (14, 21, 22). In contrast, T2D and MetS are genetically complex traits in which genome-to-phenome pathways remain poorly understood despite numerous genome-wide association studies (GWAS) (23–31). Interestingly, genetic risk scores for IR and associated loci are linked to lower BMI and lesser gluteal–femoral and peripheral fat mass (32–35). Therefore, these findings suggest a role for genetically determined relative adipose deficiency in the pathogenesis of dysmetabolism, which is similar to that of congenital lipodystrophy syndromes. The role of genetically determined adipose dysfunction in the pathogenesis of IR, T2D, and MetS in South Asians is suggested by the findings of adipose tissue transcriptomic studies, in which modules of co-expressed genes of differentially expressed genes converge on the pathways of adipogenesis and inflammation (7, 11, 36–46). Additionally, these modules of co-expressed genes show an association with T2D and its intermediate phenotypic traits (47, 48). This adipocentric molecular pathophysiology is similar to that of various congenital lipodystrophy syndromes.
Given these parallels in clinical phenotype, adipose tissue dysfunction, and the partly understood genetic predisposition and pathways, insights gained from studying lipodystrophy mechanisms could aid in decoding the complex genetic traits of IR, T2D, and MetS disease (18, 19, 36). We previously observed altered expression of lipodystrophy genes in the peripheral subcutaneous adipose tissue of individuals with T2D (49). These findings suggest a potential role for the functional defects of these genes in the pathogenesis of IR, T2D, and possibly MetS. However, the role of altered expression of lipodystrophy genes in different adipose tissue depots in the pathogenesis of IR, T2D, and MetS remains largely unexplored. Therefore, this study investigated whether “clinical MetS” and T2D are associated with altered expression of lipodystrophy genes in various adipose tissue depots. Second, do their expression levels correlate with T2D- and MetS-related intermediate phenotypic traits such as β-cell function and IR? This approach may provide insights into the functional roles of these genes in the pathogenesis of T2D and MetS, potentially offering new predictive and therapeutic strategies.
We therefore conducted the present study to decipher the probable link between a selected set of 50 lipodystrophy genes with T2D and MetS pathophysiology by measuring their expression in abdominal and femoral adipose tissue using qPCR. Additionally, we attempted to classify the clinical severity of “clinical MetS” based on lipodystrophy gene expression using a machine learning technique—decision tree—to personalize patient care. In recent years, there has been a noticeable rise in the application of machine learning and deep learning in biomedical fields (50, 51). However, the use of decision tree models to stratify patients according to disease-specific gene expression remains underutilized and could therefore be considered a promising approach for future patient care.
Materials and methods
Study population
The study was conducted at Sawai Man Singh Medical College, Jaipur, India. Based on the anatomical site for the collection of adipose tissue biopsies, subjects were divided into two cohorts: abdominal–visceral fat and subcutaneous fat. A total of 78 individuals, comprising 43 non-MetS controls and 35 MetS patients undergoing abdominal surgery, were recruited, with paired samples taken from each subject—one from the subcutaneous compartment and one from the visceral adipose depot. Additionally, 69 individuals, comprising 50 non-MetS controls and 19 MetS patients undergoing femur bone surgery for traumatic fractures, were recruited, and adipose tissue biopsies were collected. The visceral cohort contained 78 biopsies, while the subcutaneous cohort contained 147 biopsies (78 from the abdominal surgery group and 69 from the femur bone surgery group).
All methods were performed as per the relevant guidelines and regulations. The inclusion criteria for MetS participants were as per NCEP ATP III standards. The exclusion criteria were the presence of infection, malignancy, and drugs acting on body fat/IR or adipocytokine expression such as thiazolidinediones, metformin, and glucocorticoids. Our study examined male and female individuals, and similar findings are reported for both genders. Institutional ethics committee approval of the study was obtained and all the participants provided written consent.
Clinical and biochemical assessment
The anthropometric measurements, including body weight, height, waist-to-hip (W: H) ratio, and BMI, were obtained using standard methods on all samples. Supine blood pressure was measured using a mercury sphygmomanometer (BPMR-120 Diamond deluxe, Industrial electronic and allied products, Maharashtra, India) after 10 min of rest. Blood samples were obtained at 8:00 a.m. after an overnight fast of at least 8 h. Various biochemical parameters [e.g., serum glucose, lipid profile, triglycerides, low-density lipoprotein cholesterol (LDL-C), high-density lipoprotein cholesterols (HDL-C), and very-low-density lipoprotein cholesterol (VLDL-C)] were measured on a Kopran AU/400 (Olympus Corporation, Shinjuku, Tokyo, Japan) fully automated analyzer. Serum insulin was measured using a chemiluminescent immunometric assay (Immulite 2000 machine, Siemens Healthineers AG, Erlangen, Germany). HbA1c was measured by a turbidimetry method using BioSystems (BioSystems, SA Barcelona, Spain) kits.
HOMA-β was calculated using the following formula:
HOMA-IR is a measure of insulin resistance, and was calculated using the following formula:
Radiological investigations
Total body and regional fat content and distribution of participants were estimated by dual-energy x-ray absorptiometry (DEXA) using the Hologic Explorer model (S/N91395 make, Hologic Canada ULC, Mississauga, Ontario, Canada). Abdominal fat content and distribution among viscera, subcutaneous, and ectopic hepatic compartments was estimated by MRI.
MRI scan procedure: The MRI scans were done at the Department of Radiology of the SMS Hospital, using Philips Ingenia Machine of 3 T. The observer and the radiologist who interpreted the scans were unaware of the clinical status of the study subjects. A single scan (10 mm) of the abdomen was done at the level of L4–L5 vertebrae and analyzed for a cross-sectional area of adipose tissue, which was expressed in centimeters squared. Areas were calculated by multiplying the number of pixels of a given tissue type by the pixel number (pixel density). The parameters studied included visceral and subcutaneous fat. Visceral fat was distinguished from subcutaneous abdominal fat by tracing along the fascial plane defining the internal abdominal wall. Liver fat intensity was also measured using liver intensity.
Adipose tissue cell size measurement
All the biopsies taken in formalin solution were processed for making tissue blocks and slides for determining the area of adipocytes using standard protocols. Imaging of adipocytes was done at 10× magnification using a Motic Panthera Moticam 5 trinocular microscope (BA210LED) (Motic Incorporation Ltd., Hong Kong, China). The area of adipocytes was measured using ImageJ (http://imagej.nih.gov/ij) image analysis tool in µm2.
Selection of lipodystrophy genes for qPCR investigation
A total of 267 genes were implicated in lipodystrophy along with its 26 variants (such as acquired, partial, generalized, familial, genetic, congenital, and HIV-associated) in the DisGeNET database (52). These genes constituted our lipodystrophy gene population for subsequent gene selection for qPCR analysis.
We used a four-metric approach devised by DisGeNET for the quantification of disease–gene association by computing a combined rank for each gene across its values of Disease Specificity Index (DSI), Disease Pleiotropy Index (DPI), pLI (probability of being loss-of-function intolerant), and the number of lipodystrophy disease variants associated with it.
The DSI reflects if a gene is associated to several or fewer diseases and is computed according to:
where Nd is the number of diseases associated to the gene/variant and NT is the total number of diseases in DisGeNET.
DPI considers if the multiple diseases associated to the gene are similar among them (belong to the same MeSH disease class, e.g., CVDs) or are completely different diseases and belong to different disease classes. DPI is computed according to:
where Ndc is the number of the different MeSH disease classes of the diseases associated to the gene/variant and NTC is the total number of MeSH diseases classes in DisGeNET.
The pLI score is a probability metric that reflects the observed versus expected number of loss-of-function (LoF) variants in a gene. If a gene associated with a particular disease has a high pLI score, it suggests that the gene is less likely to tolerate loss-of-function variants, and mutations in this gene may contribute to the development of the associated disease.
Based on this approach, we selected 49 genes; the average DSI, DPI, and pLI for selected genes were 0.5, 0.7, and 0.3, respectively, which were comparable with our total lipodystrophy gene population. However, the average of number of lipodystrophy disease variants for selected genes was 3.4, which was higher than the gene population (~1.6).
This panel of 49 genes also included 19 genes from the lipodystrophy panel, which was recommended by the Genetic Testing Registry for the screening, diagnosis, mutation confirmation, pre-symptomatic, monitoring, and risk assessment of congenital generalized lipodystrophy type 1 (https://www.ncbi.nlm.nih.gov/gtr/tests/501102/). A 50th gene, TBC1D4, was therefore included to cover the entire panel, and the list of selected genes is presented in Table 1.
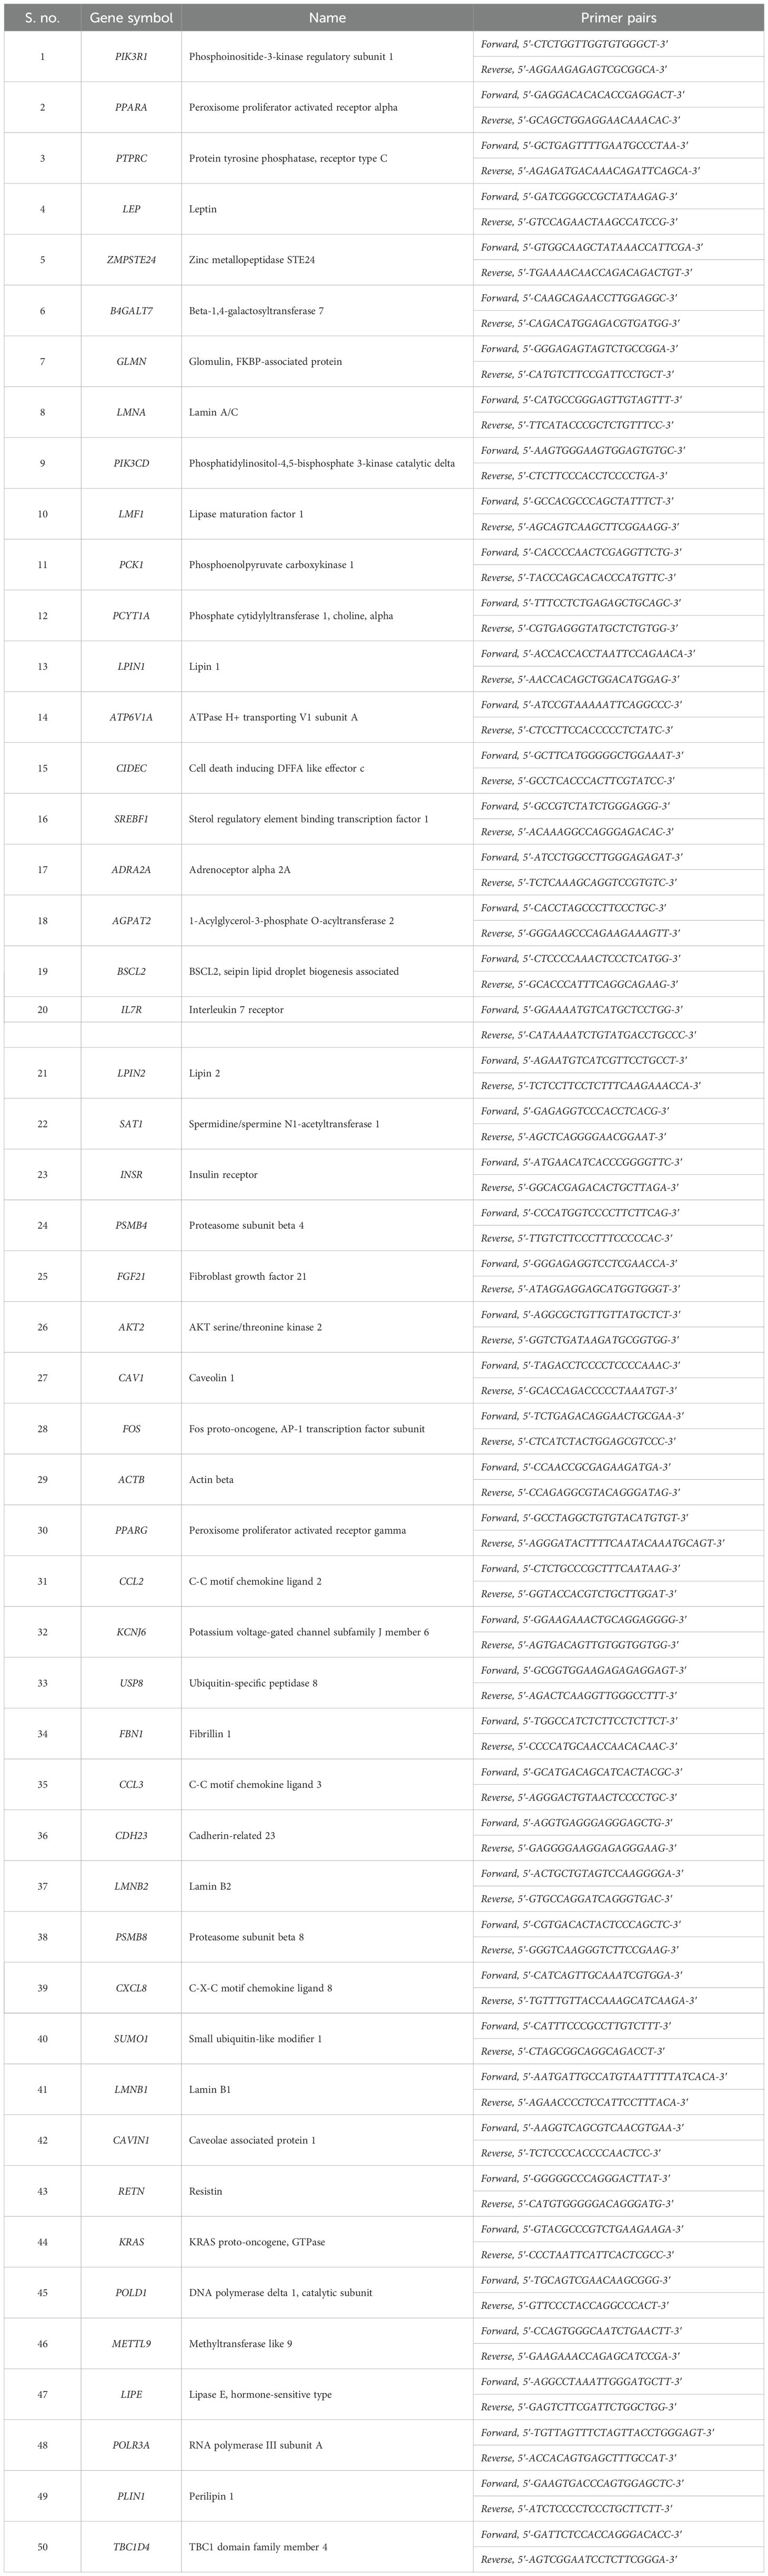
Table 1. List of selected lipodystrophy genes and their primer sequences for qPCR validation.
Lines of evidence for the involvement of 38 genes in lipodystrophy or its variants were gleaned from PubMed searches and are presented in Supplementary Table S1.
Real-time PCR
A total of 2 μg of RNA was isolated from femoral subcutaneous adipose tissue biopsy and abdominal adipose tissue biopsy using the Qiagen RNeasy Mini Kit (Cat No. 74104). The quantification of samples was done using a microfluidic-based capillary electrophoresis system (Bio-Rad Experion, Bio-Rad Laboratories, Inc., Philadelphia, PA, USA). cDNA synthesis was performed using the QuantiNova Reverse Transcription Kit (Cat No. 205411) and real-time PCR was carried out using the QuantiNova SYBR Green PCR Kit (Cat. No 208052). We performed qPCR (quantitative polymerase chain reaction) on selected genes. Oligos (primers) were constructed from online available tools and synthesized as per appropriate melting temperature (Tm), GC%, synthesized by Integrated DNA Technologies, Inc. (Coralville, Iowa, USA). The primers synthesized were double checked to get amplimer product. The oligonucleotide primer sequences used in the qPCR analysis are listed in Table 1. Gene fold expression was calculated by the formula Fold change = 2−Δ;Δ;CT where 2−Δ;Δ;CT = [(CT gene of interest − CT internal control) sample A − (CT gene of interest − CT internal control) sample B)] (Schmittgen et al., 2008).
Creation of decision tree
To classify patients into different MetS levels based on gene expressions, we used a machine learning method, DecisionTreeClassifier, from the sklearn package in a Python environment. MetS status was set as the target variable, and all the genes were used as features. The gene selected for splitting the dataset was based on the reduction of entropy, which measures the randomness or impurity in the data. This was achieved by calculating the information gain, which represents the decrease in entropy after the split. For a binary classification problem, such as distinguishing between MetS and non-MetS, the entropy E(S) was calculated as:
where p1 is the proportion of data points in the dataset belonging to the MetS class and p2 is the proportion of data points in the dataset belonging to the non-MetS class.
Library train_test_split from the same package was used to divide samples in the training (80%) as well as in the test set. Maximum depth for tree construction was set to 10 and graphviz library was used to create the decision tree figure for visualization.
Results
Not-MetS and MetS have shown significant differences between their waist circumference and BMI in both thigh and abdominal cohorts. Other glycemic and fat parameters—HOMA-IR, Hb1Ac, and triglycerides—also differed significantly (Table 2). Visceral fat mass and adipocyte cell size were found significantly higher in MetS (Table 3). For the selected list of 50 lipodystrophy genes, a disease–gene network was constructed using the DisGeNET database in cytoscape environment and they showed an association with lipodystrophy and its variants (Figure 1).
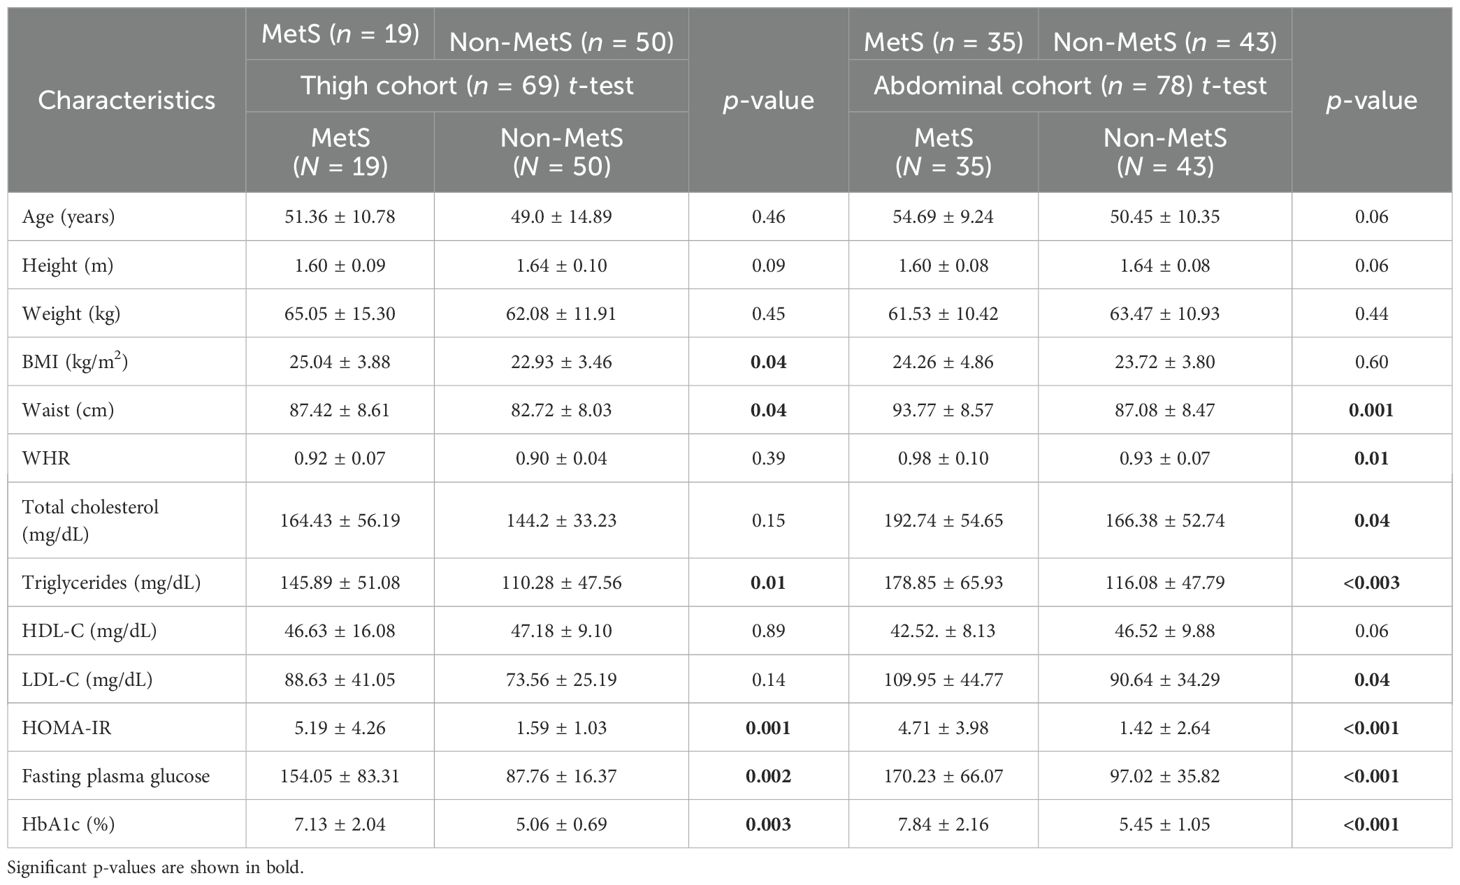
Table 2. Anthropometric, clinical, and biochemical parameters in subjects with MetS and Non-MetS.
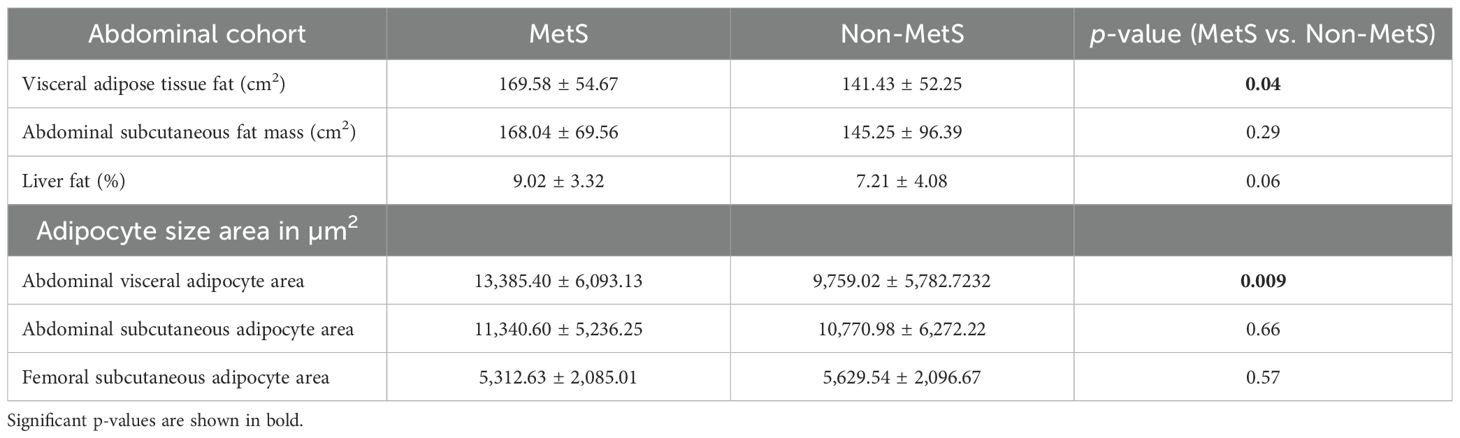
Table 3. Abdominal fat mass between MetS and Non-MetS in abdominal cohort.
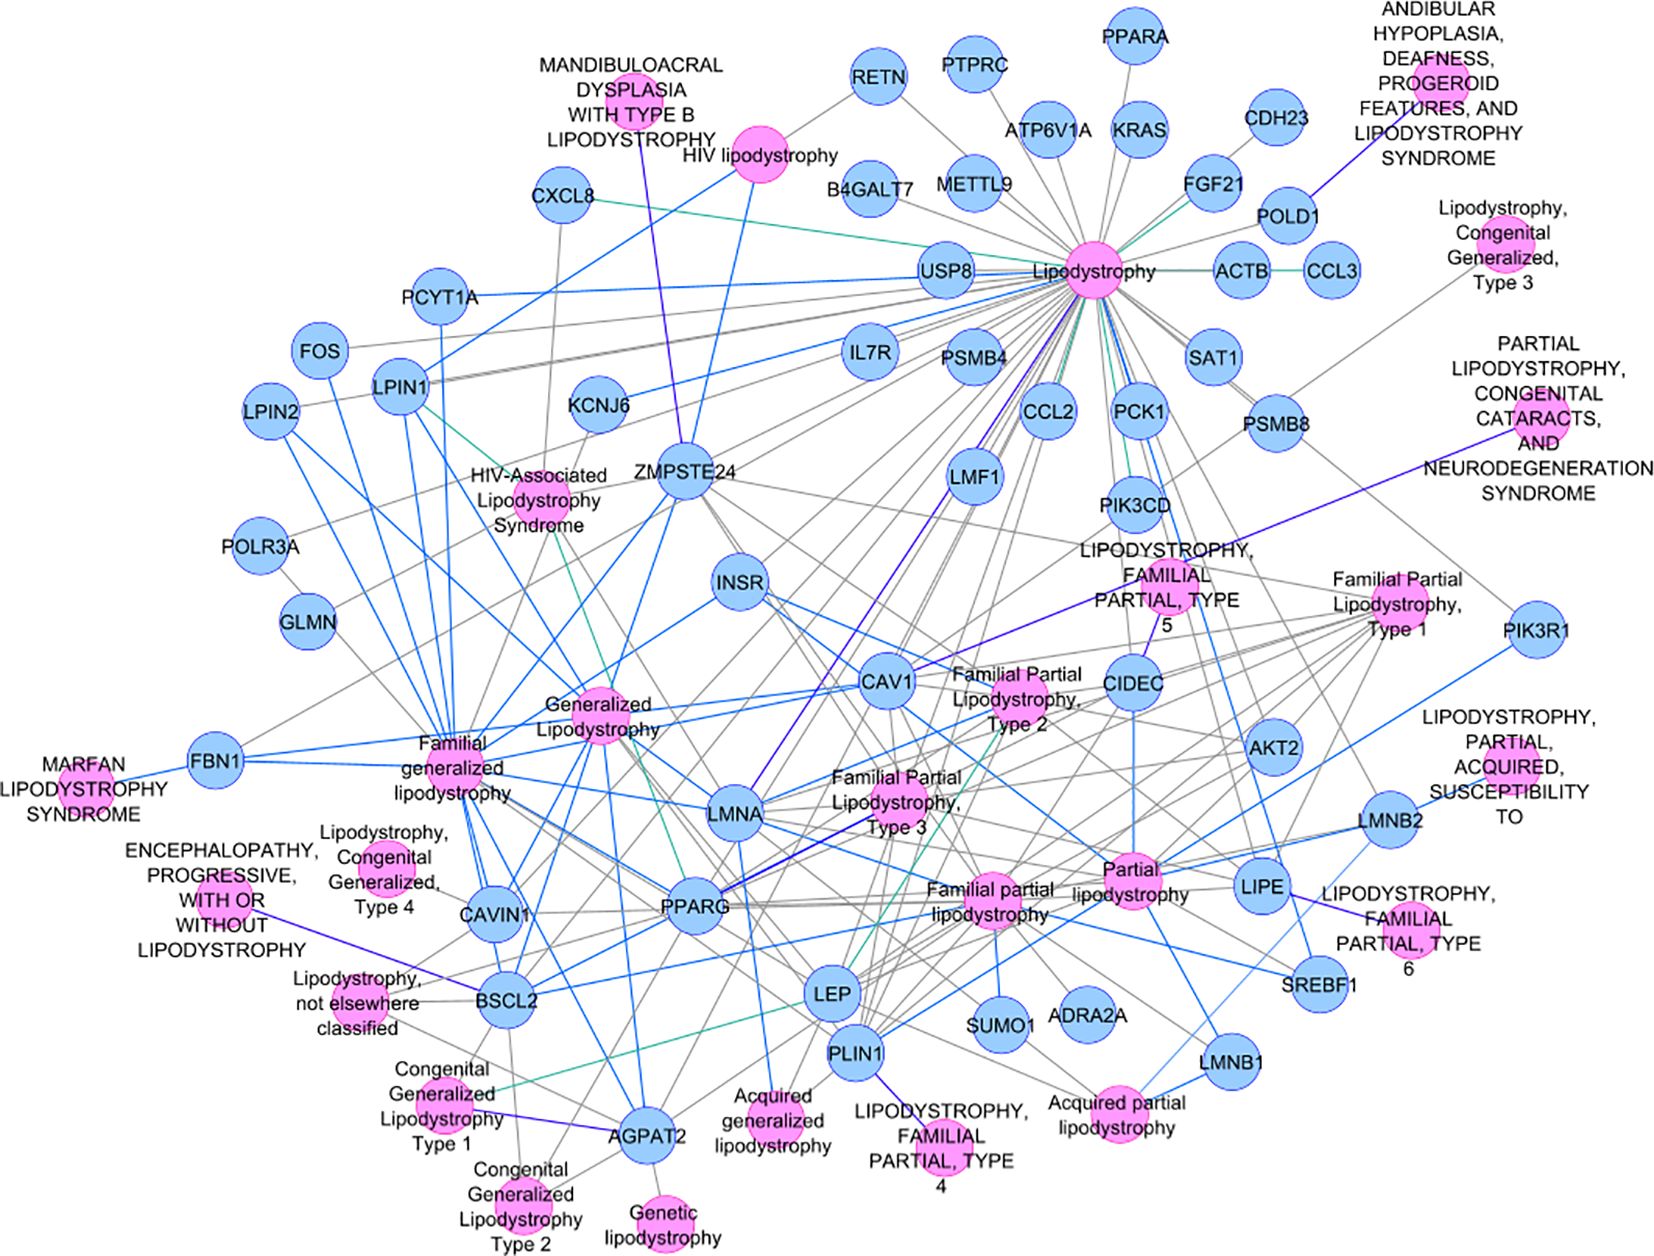
Figure 1. Disease–gene network selected lipodystrophy genes.
We also created a T2D interactome by taking 132 predicted T2D effector genes as seed nodes along with their first-degree neighbors from a high-confidence human protein–protein network obtained from ConsensusPathDB and StringDB using the PhenomeScape app (2,222 genes). Interestingly, this network showed ~51% overlap with the interactome of our qPCR (including their first-degree neighbors). This qPCR interactome of 1,191 genes also showed robust enrichment of insulin signaling, adipogenesis, laptin signaling, and AGE/RAGE signaling among others in WikiPathways.
Identified differentially expressed genes and their co-expression modules
Majority of lipodystrophy genes showed significant downregulation in MetS individuals compared to non-MetS in visceral fat (Figure 2A). Interestingly, the upregulated genes CAV1, POLD1, SAT1, SREBF1, LMNB1, FGF21, LMNA, and PLIN1 were those known to disrupt lipid homeostasis, leading to lipid accumulation or abnormal lipid distribution within cells. This could contribute to metabolic disorders such as dyslipidemia, obesity, or lipodystrophy. CAV1 was found to attenuate the Akt/mTOR pathway and hence alleviate lipid accumulation in non-alcoholic fatty liver disease (53). Overexpression of SAT1 enhances autophagy, which plays a significant role in lipid metabolism by regulating lipid droplet breakdown and fatty acid oxidation. An earlier study has shown that unbalanced autophagy may lead to type 2 familial partial lipodystrophy (54). Another upregulated gene PLIN1 encodes perilipin-1, which coats lipid droplets in adipocytes and is involved in droplet formation, triglyceride storage, and lipolysis. One study suggested that PLIN1 insufficiency causes a favorable metabolic profile (55) and therefore may protect against CVD and conversely its upregulation could lead to MetS.
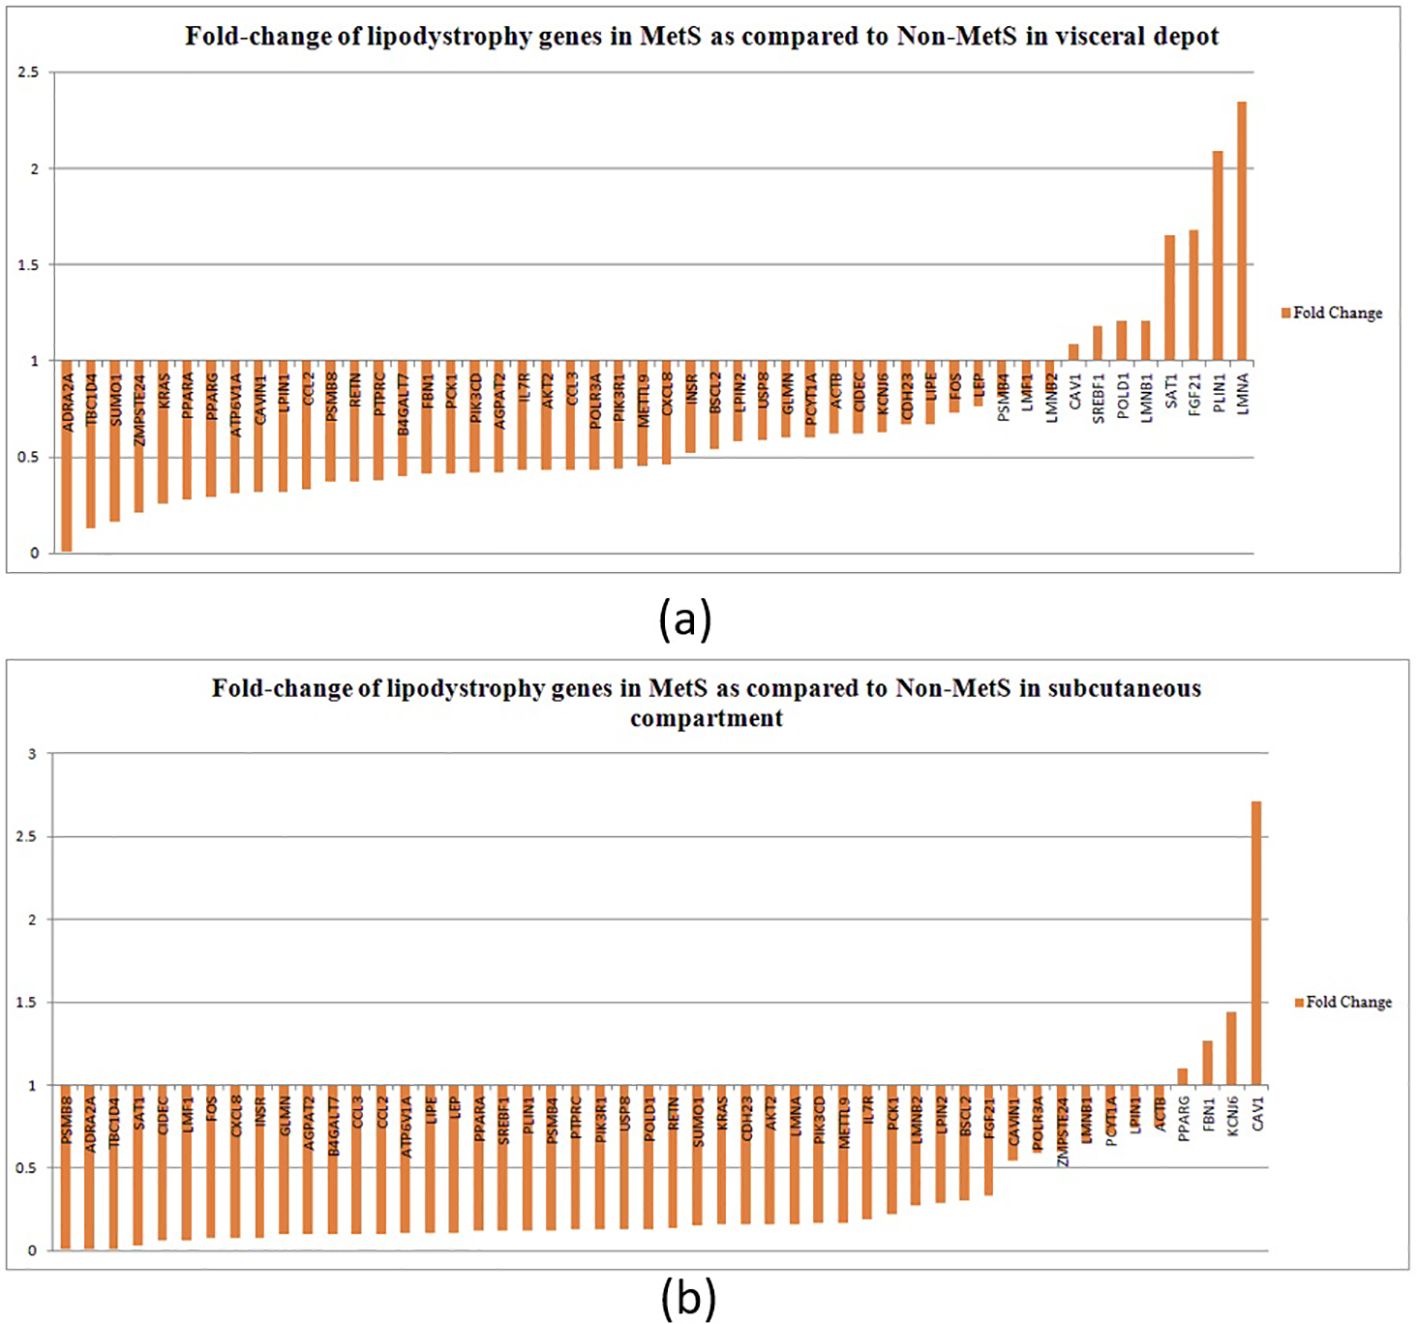
Figure 2. Fold change of lipodystrophy genes in MetS as compared to non-MetS (normalized to one) among individuals in (A) the visceral depot and in (B) the subcutaneous compartment.
In the subcutaneous compartment, all except four genes—PPARG, FBN1, KCNJ6, and CAV1—were found to be downregulated (Figure 2B). Upregulation of PPARγ, KCNJ6, and FBN1 promotes lipid storage, improves lipid and glucose metabolism, and attenuates inflammation, making them key regulators of lipid homeostasis. We propose that upregulation of these genes in subcutaneous compartment could be a compensatory mechanism to alleviate disturbed lipid metabolism.
We also analyzed relative fold difference in gene expression between visceral and subcutaneous tissues. All the genes have a relatively higher expression in the visceral depot compared to their subcutaneous counterpart. This relative expression was found to be decreased for 32 genes with increasing MetS score and to be increased for the remaining genes (marked in green and red boxes in Figure 3).
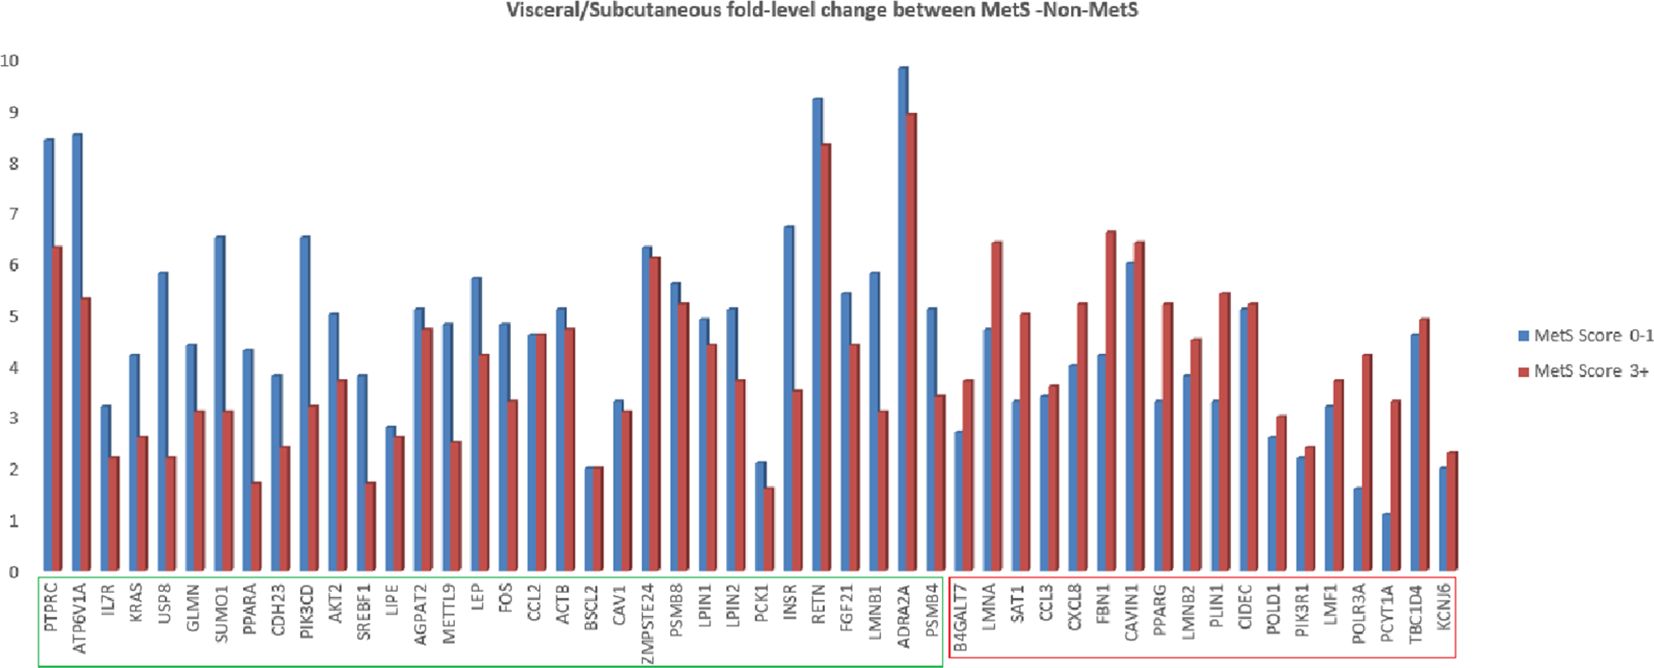
Figure 3. Fold change of lipodystrophy specific genes in abdominal visceral adipose tissue as compared to abdominal subcutaneous adipose tissue in MetS (3+ score) and non-MetS (0–1 score) cohort.
Earlier, we have identified modules of co-expressed genes from a gene expression DNA microarray study in abdominal visceral and subcutaneous as well as gluteo-femoral fat depots, which were showing correlation with various clinical and biochemical intermediate traits (48).
On further inspection of these modules for the enrichment of these qPCR gene panels, we could find four genes—CCL3, CXCL8, FOS, and KRAS—in the gray module, 16 genes—AGPAT2, AKT2, ATP6V1A, CCL2, CDH23, FBN1, INSR, KCNJ6, LIPE, LMF1, LPIN2, PCK1, PIK3CD, PIK3R1, PPARA, and RETN—in the turquoise module, 13 genes—ACTB, CAV1, CIDEC, LPIN1, PLIN1, PPARG, PSMB4, PSMB8, SAT1, SUMO1, TBC1D4, USP8, and ZMPSTE24—in the blue module, 2 genes—LMNA and PTPRC—in the brown module, and 2 genes—ADRA2A and LEP—in the green module. The association of these 37 genes with diabetes-related intermediate traits reflects the shared molecular etiology of MetS and T2D with lipodystrophy.
Correlation patterns among gene expressions
Majority of genes (~43–50) have shown a negative correlation with MetS, T2D, and HOMA-IR for both depots, which was in line with differential expression analysis.
In subcutaneous fat, 30 genes compared to 10 genes in the visceral fat showed a positive correlation with HOMA-B, pointing toward a possible relation of insulin secretion with these lipodystrophy genes.
With respect to visceral fat, 40 genes showed a negative correlation, whereas 42 genes showed a positive correlation in subcutaneous with adipocyte size; of them, 28 genes were statistically significant (p ~ 0). Earlier, we observed an increasing trend of adipocyte hyperplasia from non-MetS to MetS across subcutaneous and visceral fat, which was statistically significant (p < 0.009). Tables 4, 5 show the statistically significant correlations (p < 0.05) of genes with measured intermediate and biochemical traits in visceral fat and subcutaneous fat, respectively.
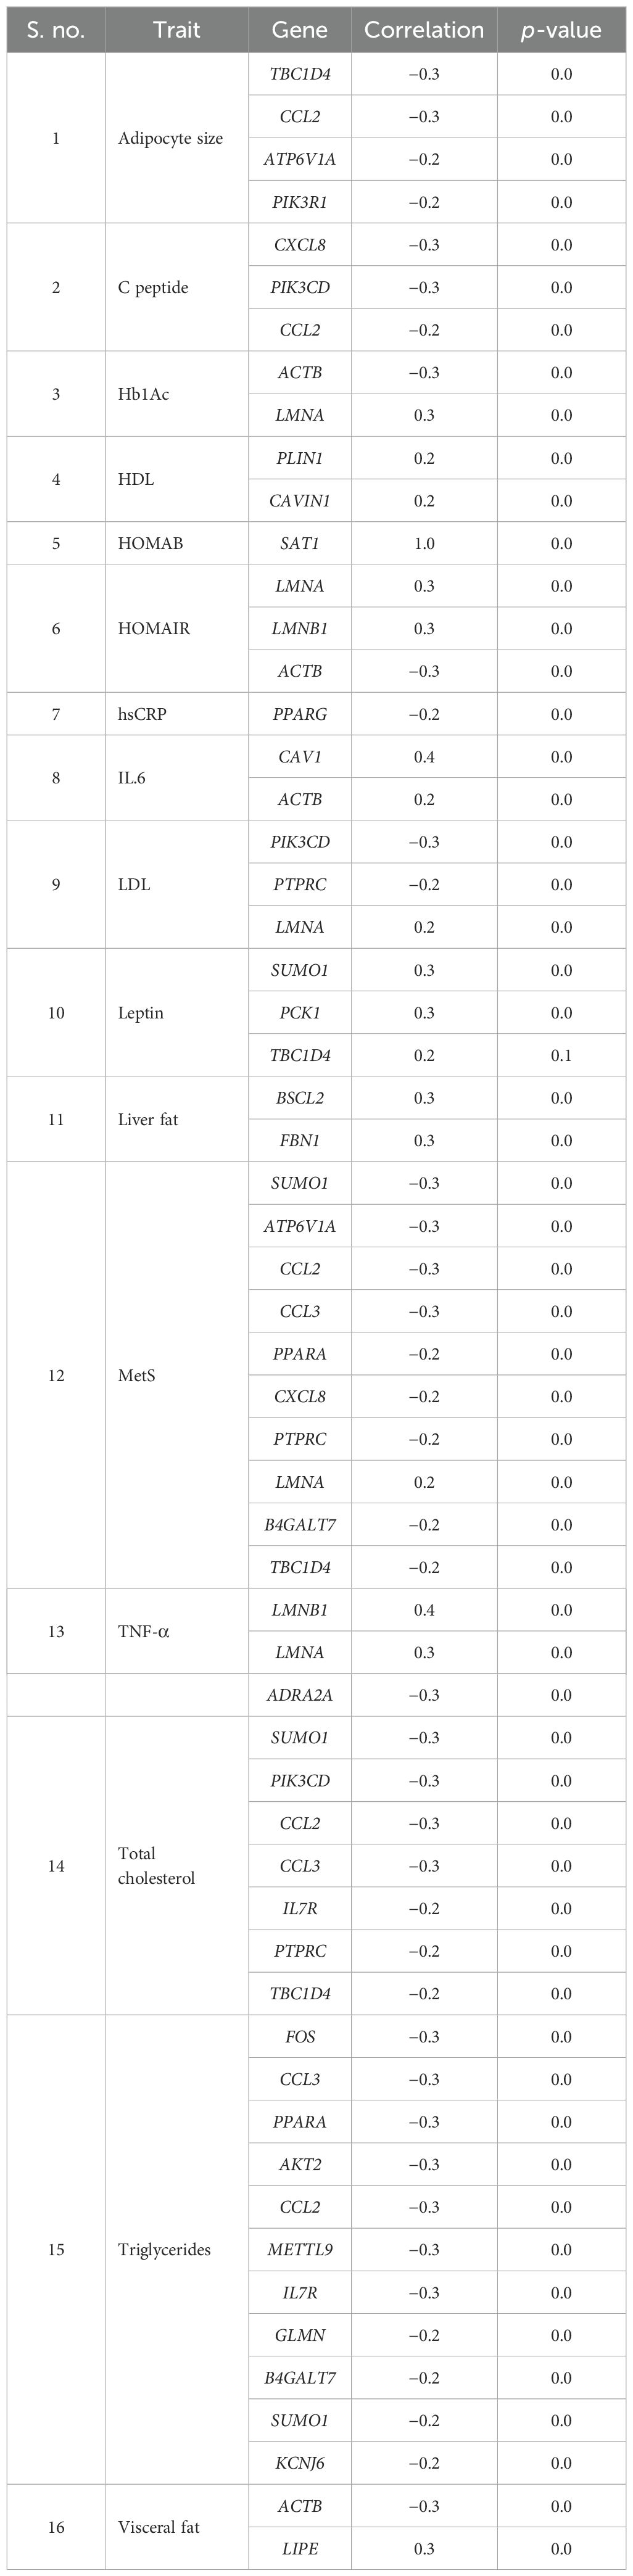
Table 4. Genes showing statistically significant correlation with measured biochemical and intermediate traits in abdominal visceral depot.
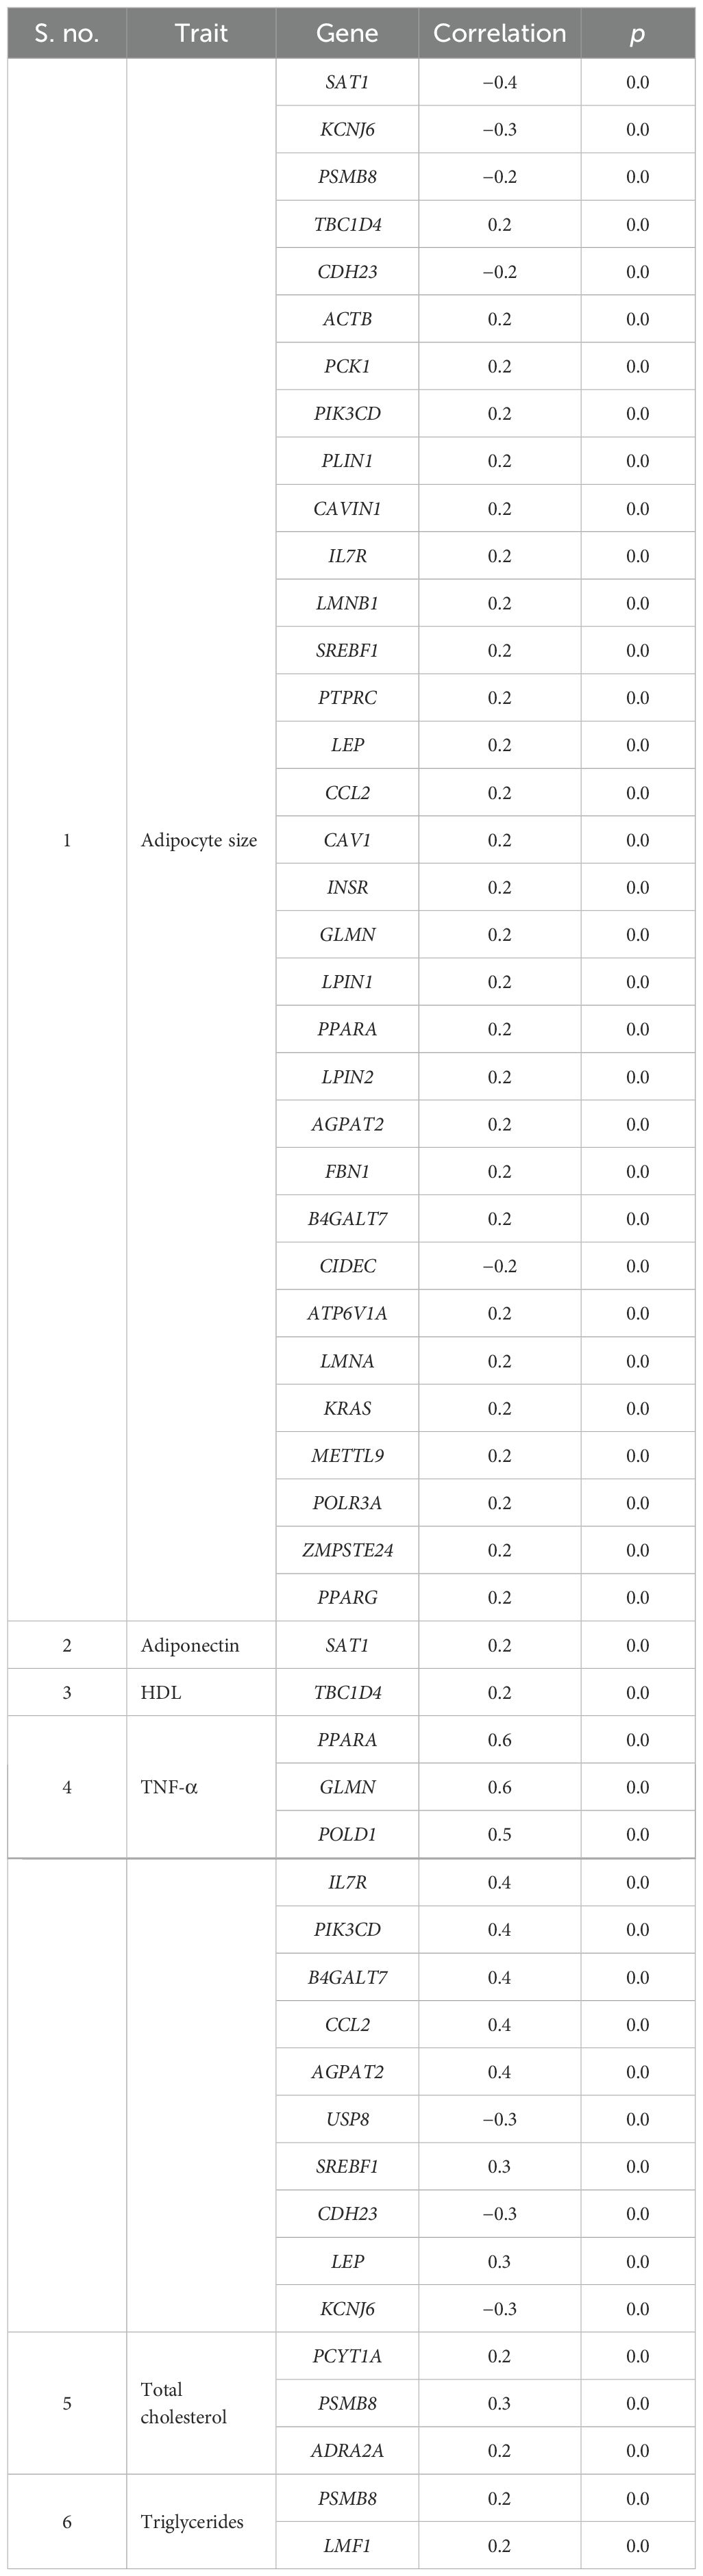
Table 5. Genes showing statistically significant correlation with measured biochemical and intermediate traits in abdominal and peripheral subcutaneous compartments.
MetS patient subgroups based on lipodystrophy-related gene expression profiles
A decision tree classifier was built for all the 50 genes for subcutaneous fat, and it could segregate all the 117 samples into 50 subgroups, belonging to MetS group 0–5 (Figure 4; Supplementary Figure 1). Our decision tree could segregate one to two patients along a particular path from root node to MetS class level. This observation, ~2 patients/path (117 patients/50 paths), might be a clinically effective strategy to individualize patients and to impart personalized care.
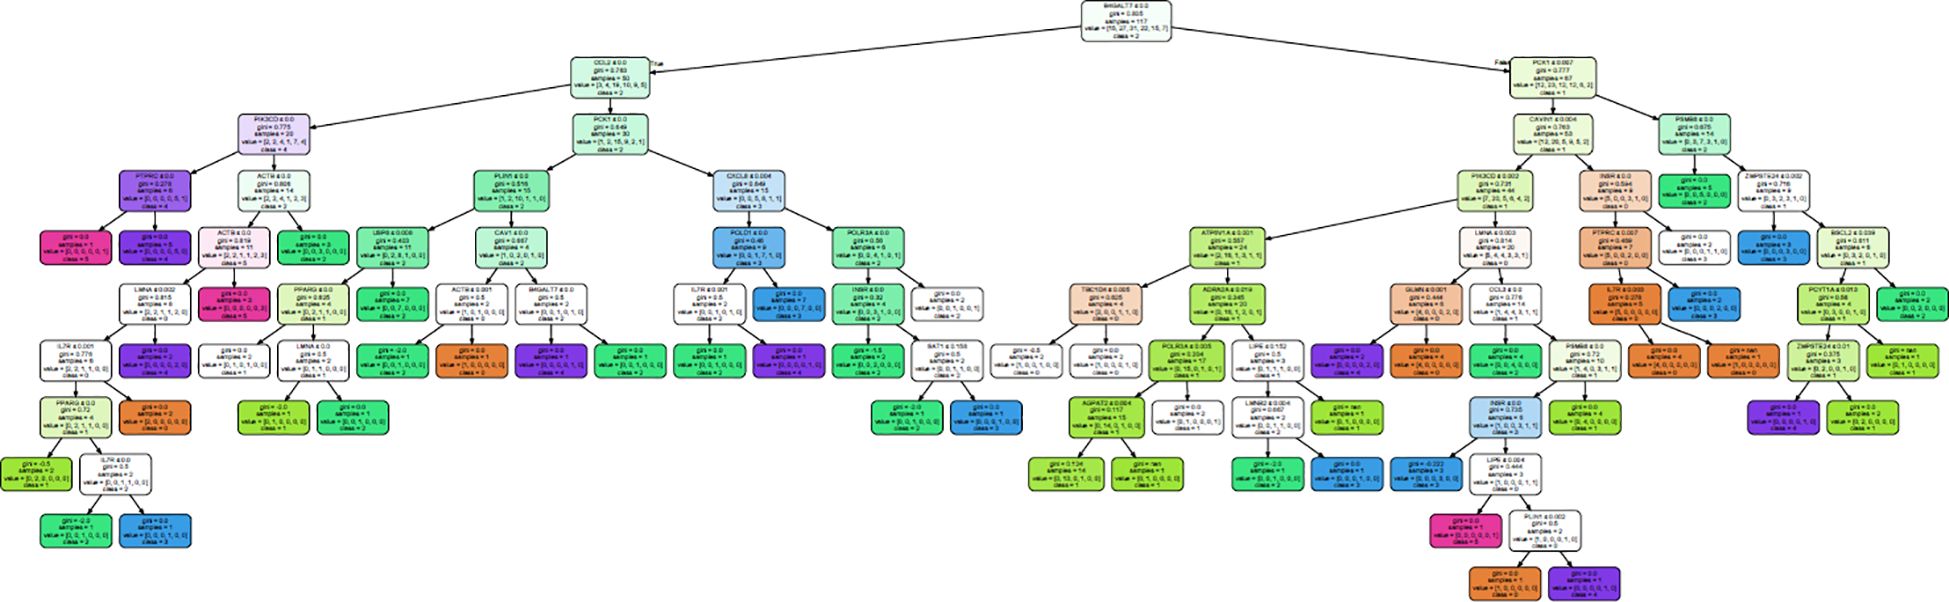
Figure 4. Decision tree generated to classify all the 117 samples into their MetS group in subcutaneous fat.
From this analysis, we were able to conclude that expression of just 28 genes—BSCL2, CAV1, CAVIN1, LMNA, LMNB2, PCYT1A, PLIN1, PPARG, PSMB8, ZMPSTE24, ACTB, AGPAT2, ATP6V1A, B4GALT7, CCL2, CCL3, CXCL8, GLMN, IL7R, INSR, LIPE, PCK1, PIK3CD, POLR3A, PTPRC, SAT1, TBC1D4, and USP8—out of the 50 genes (Table 6) is sufficient to classify all the patients. Interestingly, the first 10 genes were also present in the lipodystrophy panel.
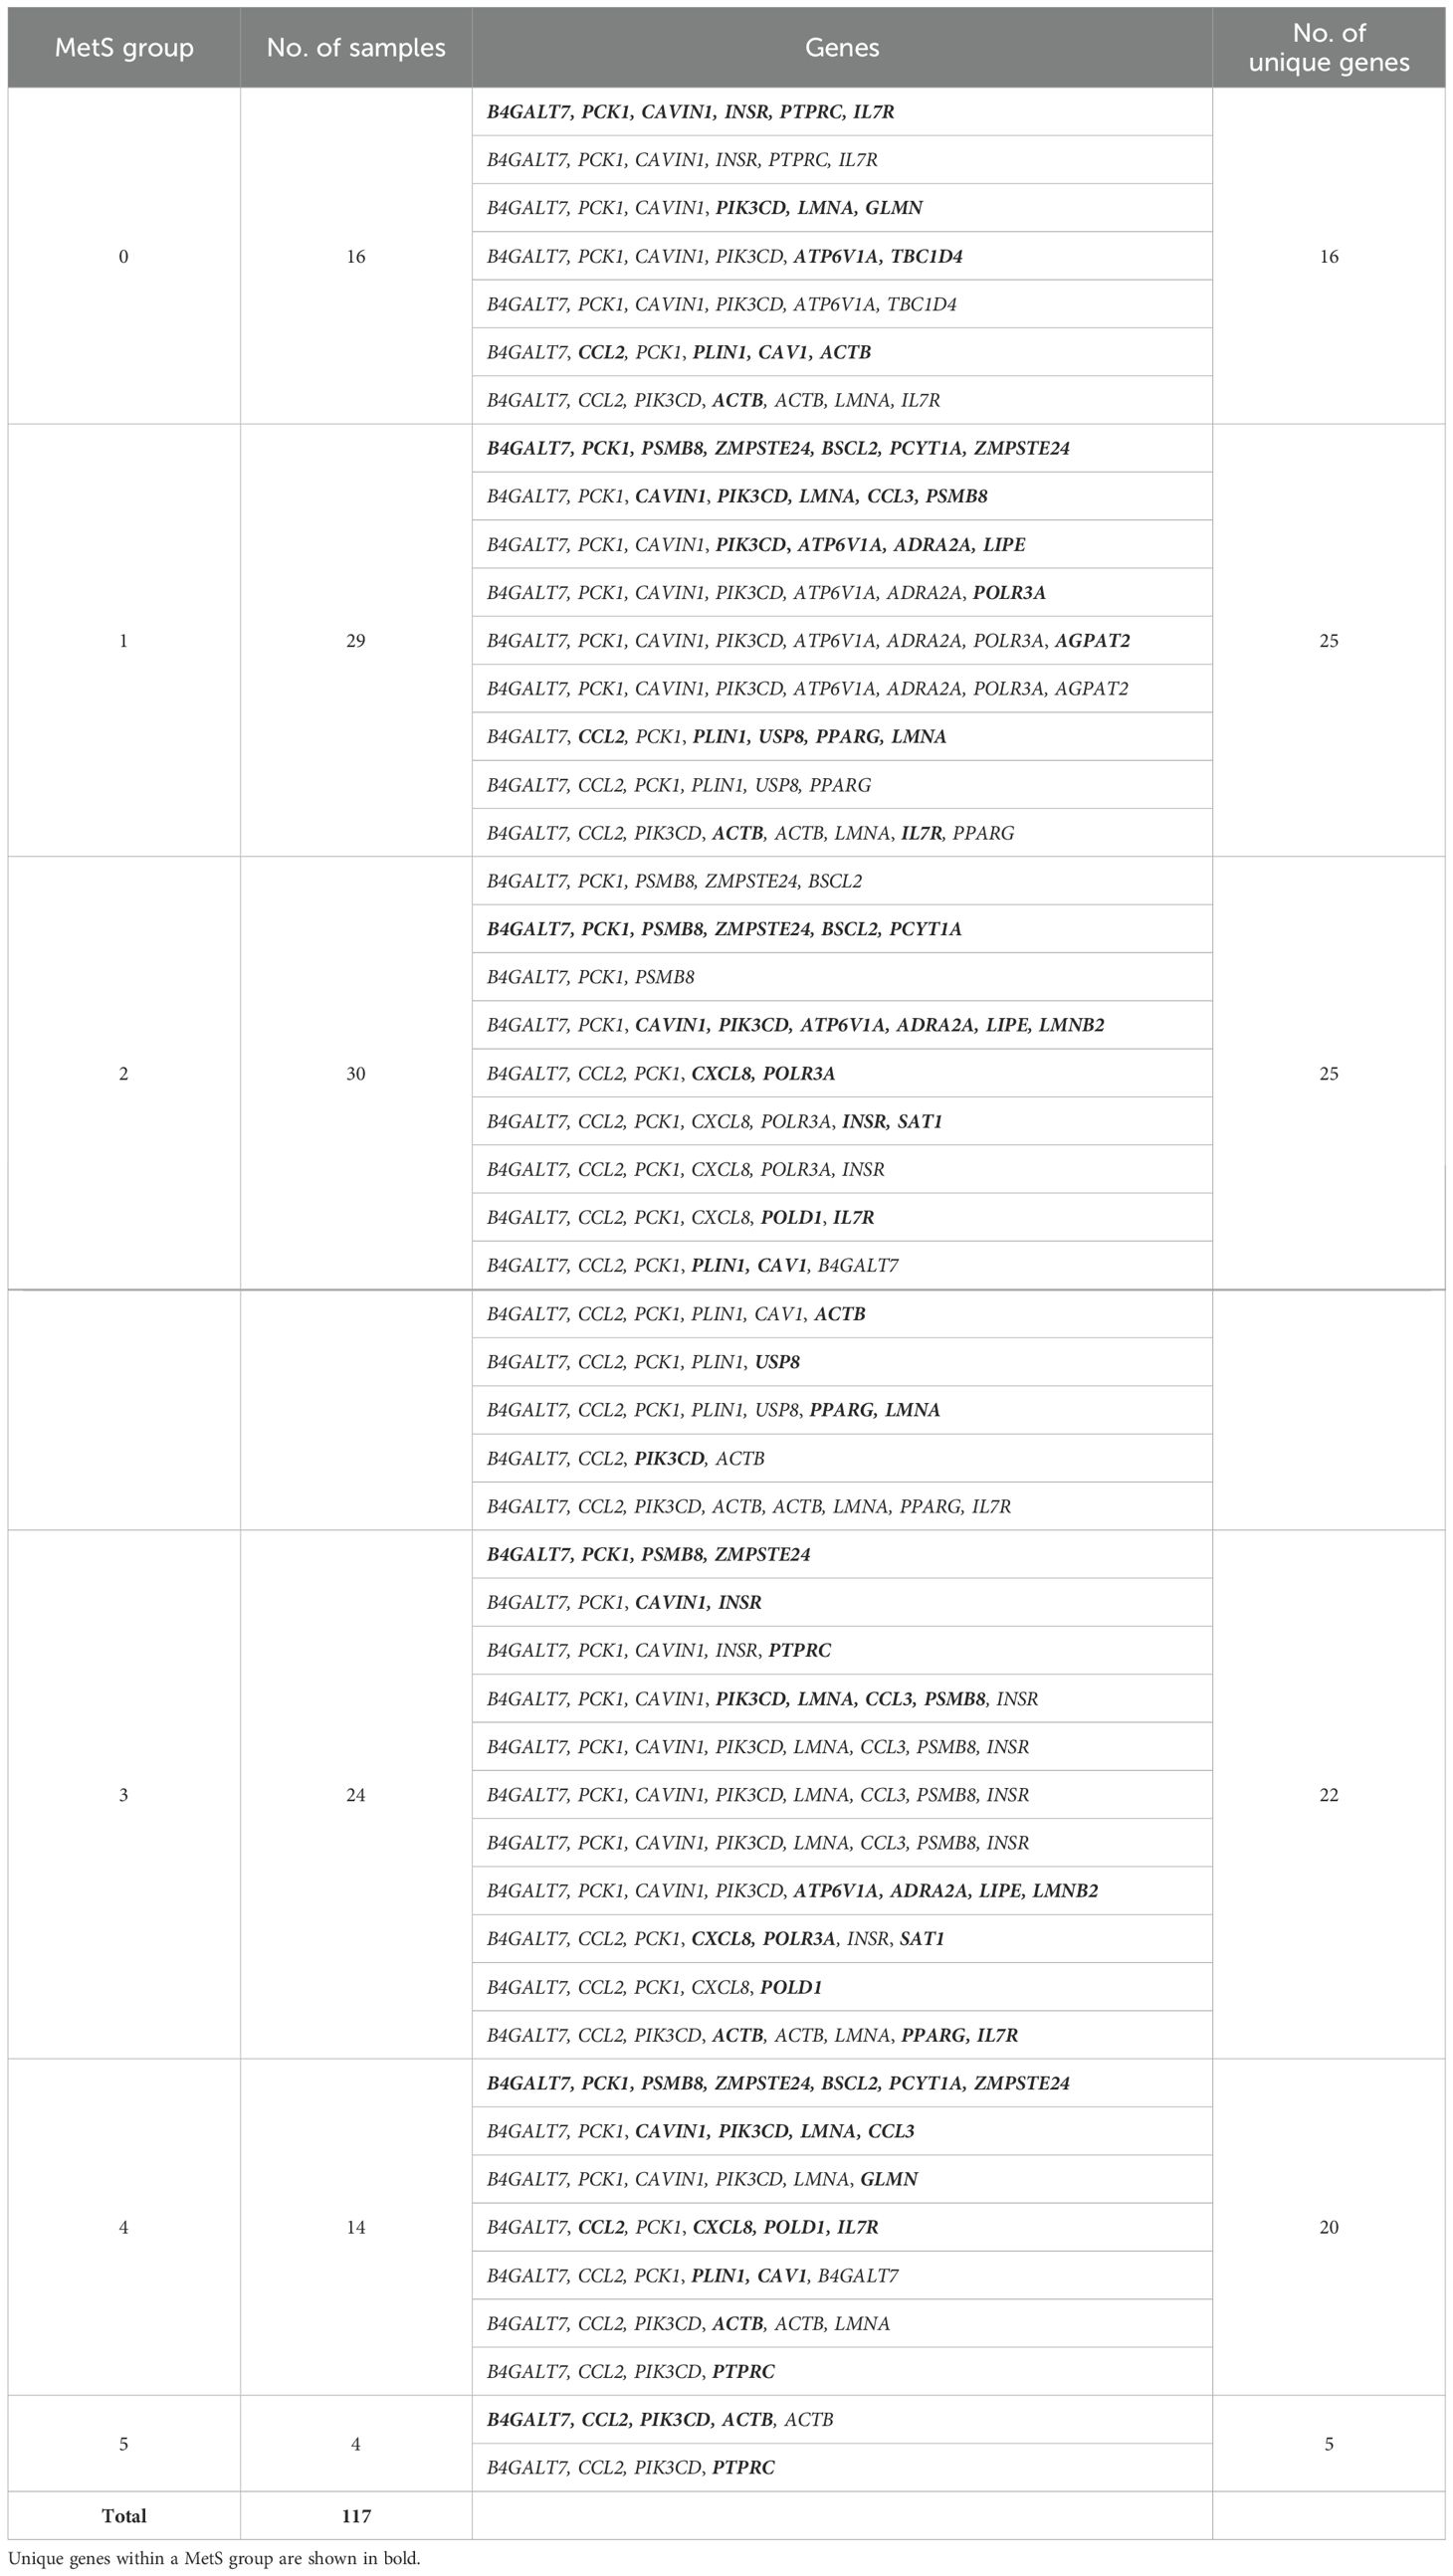
Table 6. Gene paths identified from the decision tree along with the number of samples in the leaf nodes.
Discussion
In South Asians, the complex genetic trait of T2D is associated with altered expression of several genes that enrich pathways in pathological adipose tissue, with their modules of co-expressed genes showing an association with disease-related intermediate phenotypic traits (42–49). Interestingly, mutations in several of these genes have also been reported to be implicated in the causation of lipodystrophy, a monogenetic disorder of lipid metabolism that also shares phenotypic similarity with T2D and MetS (56, 57). Lipodystrophy and T2D have traditionally been considered two distinct diseases, highlighting the critical role of adipose tissue in metabolic dysfunction. In lipodystrophy, severe MetS develops due to an absolute lack of adipose tissue, whereas in T2D, the metabolic dysfunction arises primarily because adipose tissue function becomes overwhelmed by the stress of overnutrition. Early diagnosis of adipose tissue dysfunction, particularly before the onset of MetS, is therefore crucial in clinical settings to improve outcomes (58). To confirm these observations, we conducted this study by performing large-scale qPCR expression profiling of selected lipodystrophy genes in adipose tissue. The findings of this study can be summarized as follows: (1) the majority of lipodystrophy genes show altered expression in both visceral and subcutaneous compartments in a direction that could adversely influence adipose tissue development or function; (2) the altered expression of these genes also shows an association with T2D, MetS, and IR, and their expression level tends to increase with increasing MetS score; (3) there is a significant overlap between their protein–protein interaction network with T2D interactome; and (4) individualization for prediction of MetS severity based on expression of these lipodystrophy genes is also feasible. Therefore, these findings support the hypothesis that MetS in South Asians share a common pathophysiological and molecular mechanism with congenital lipodystrophy syndromes as its susceptibility genes were found to be differently expressed in T2D patients having MetS. Therefore, functionally, they are more likely to be linked to adipocyte functions in these patients and they might not be specific to congenital lipodystrophy.
Several previous studies describing the striking phenotypic overlap between lipodystrophy and MetS (albeit with different degrees of severity) have suggested that subtle forms of lipodystrophy may be relevant to the pathogenesis of MetS and T2D (36, 36, 59, 60). However, this is a widely hypothetical premise. We previously demonstrated that T2D is associated with altered expression of several lipodystrophy genes in the adipose tissues of South Asians (45). Additionally, we have independently demonstrated a significant overlap between the protein–protein interaction network of lipodystrophy genes and the adipose tissue transcriptome of individuals with T2D (46). The findings of the present study, which revealed the altered expression of lipodystrophy genes in adipose tissue and their association with several MetS, T2D, and IR-related intermediate phenotypic traits, not only confirm our earlier findings but also further point to the role of altered adipose tissue expression of lipodystrophy genes in their pathogenesis. In other words, these findings support the hypothesis that functional defects caused by altered lipodystrophy gene expression in adipose tissue is involved in T2D, MetS, and IR pathogenesis. Another line of evidence to support this premise of a shared molecular thread between congenital lipodystrophy syndrome and T2D and MetS disease is the finding in the present study that various lipodystrophy genes are also part of the pathogenic modules of co-expressed genes identified in previous transcriptomic studies. In other words, the modules of co-expressed genes associated with diabetes and its intermediate phenotypic traits, the so-called “adipose tissue molecular units of dysmetabolism”, also include lipodystrophy genes. Arguably, these findings can only be proven in longitudinal follow-up studies.
Although South Asians as a race exhibit the obesity paradox, its cellular and molecular pathophysiology remains largely unexplored. As discussed previously, we observed that several modules of co-expressed genes in adipose tissue showing association with diabetes and its intermediate phenotypic traits converge on the molecular pathways of adipogenesis and inflammation (47–49, 52). There are also sporadic references supporting the fact that germline mutations in several adipogenesis genes have been identified by linkage analysis in several pedigrees with congenital lipodystrophies and are considered to be the primary drivers of the pathophysiology of these syndromes. Therefore, the two instances of the obesity paradox, i.e., congenital lipodystrophies and Asian Indian MetS and T2D, appear to converge in the cellular process of adipogenesis.
This shared functional molecular pathway between T2D, IR, MetS, and lipodystrophy has several implications. Firstly, the mechanisms and pathways of severe metabolic defects underlying congenital lipodystrophies are well deciphered, and their altered expression and representation in the modules of co-expressed genes in adipose tissue in patients with diabetes suggests their role in the pathogenesis of T2D and adipocentric metabolic dysfunction underlying MetS (i.e., MetS disease or adiposopathy) on the same lines. The significance of this observation is that altered expression of lipodystrophy genes in various adipose compartments can serve as a template for studying the precise molecular mechanisms of IR, T2D, and MetS disease. Investigation in both directions, i.e., the mechanisms of their regulation and the cellular and metabolic pathways regulated by them, can decipher the genome-to-phenome pathways and mechanisms of T2D and MetS disease. This view is also important considering our finding that altered expression of only a few genes is a major determinant of clinical MetS. Therefore, these findings highlight the oligogenic nature of complex traits of T2D and MetS disease (61, 62). Secondly, the constituent genes in the pathological “modules of co-expressed genes”, which are otherwise not known to be implicated in the pathogenesis of congenital lipodystrophy, could be explored for mutations in pedigrees with unexplained congenital lipodystrophies. Thirdly, as the genome-to-phenome pathways of congenital lipodystrophies are well understood, the primary role of adipose tissue dysfunction in the pathogenesis of the severe underlying metabolic dysfunction is well established. Therefore, on the same lines, altered expression of these genes in adipose tissue and their association with IR, T2D, and MetS support the concept of “MetS disease” or the so-called “adiposopathy” as a primary disease and the components of “clinical MetS” as its clinical manifestations (63–66). However, this concept needs to be validated in longitudinal and intervention studies in the future.
We further attempted to identify hallmark genes that could be decisive in stratifying “clinical MetS” individuals and constructed a decision tree using machine learning. This decision tree requires only 20 genes (among the 50 genes) to classify “clinical MetS”. Nine of them were also included in the monogenic lipodystrophy syndrome diagnostic gene panel; this further points out how ancient lipid dysfunction with vivid molecular etiology could be shaped by various evolutionary processes and transformed into present-day IR, T2D, and MetS disease. This picture—however obscure—also promises to deliver fundamental drug targets that enable personalized T2D and MetS therapy in the future.
There are several limitations to this study. This study was conducted at a single center with a relatively small sample size. However, owing to ethical considerations, it was difficult to obtain a large sample size. Second, the study was cross-sectional in design; thus, causal inferences could not be drawn. Longitudinal studies performed at different stages of natural T2D and MetS disease can only help confirm these findings, but such studies are challenging to perform. Finally, it is important to determine whether gene expression can be reversed by a healthy lifestyle, including the intake of low-calorie diets and/or increased physical activity.
Data availability statement
The original contributions presented in the study are included in the article/Supplementary Material. Further inquiries can be directed to the corresponding author.
Ethics statement
The studies involving humans were approved by Institutional Ethics Committee (IEC) of SMS Medical College Jaipur India. The studies were conducted in accordance with the local legislation and institutional requirements. The participants provided their written informed consent to participate in this study.
Author contributions
AS: Methodology, Writing – original draft, Writing – review & editing, Data curation, Investigation, Software. PT: Formal analysis, Methodology, Resources, Writing – review & editing. SG: Methodology, Writing – review & editing, Formal analysis. RM: Formal analysis, Methodology, Writing – review & editing, Conceptualization, Resources. RB: Formal analysis, Methodology, Writing – review & editing, Investigation. RL: Formal analysis, Methodology, Data curation, Writing – review & editing. RA: Data curation, Methodology, Writing – review & editing, Project administration. VR: Data curation, Writing – review & editing, Formal analysis, Funding acquisition. VM: Writing – review & editing, Methodology, Project administration, Supervision. SM: Methodology, Project administration, Supervision, Writing – review & editing, Conceptualization, Formal analysis, Writing – original draft.
Funding
The author(s) declare financial support was received for the research, authorship, and/or publication of this article. This study was financially supported by the Metabolic and Molecular Research Society (MMRS) (Jaipur) and the Indian Council of Medical Research (ICMR), Government of India through grant no. 5/4/8/2012-RMC and Research Society for the Study of Diabetes in India (RSSDI) grant no. RSSDI/HQ/Grants/2018/4647.
Acknowledgments
We gratefully acknowledge the Research Society for the Study of Diabetes in India (RSSDI) and the Metabolism and Molecular Research Society (MMRS), Jaipur for providing partial funding and Principal, SMS Medical College, and Hospital, Jaipur (Rajasthan) India for providing the necessary infrastructural facility to carry out this study.
Conflict of interest
The authors declare that the research was conducted in the absence of any commercial or financial relationships that could be construed as a potential conflict of interest.
Publisher’s note
All claims expressed in this article are solely those of the authors and do not necessarily represent those of their affiliated organizations, or those of the publisher, the editors and the reviewers. Any product that may be evaluated in this article, or claim that may be made by its manufacturer, is not guaranteed or endorsed by the publisher.
Supplementary material
The Supplementary Material for this article can be found online at: https://www.frontiersin.org/articles/10.3389/fendo.2024.1468824/full#supplementary-material
References
1. Alberti KG, Zimmet P, Shaw J. The metabolic syndrome–a new worldwide definition. Lancet. (2005) 366:1059–62. doi: 10.1016/s0140-6736(05)67402-8
2. Bhalwar R. Metabolic syndrome: The Indian public health perspective. Med J Armed Forces India. (2020) 76:8–16. doi: 10.1016/j.mjafi.2019.12.001
3. Goel K, Lopez-Jimenez F, De Schutter A, Coutinho T, Lavie CJ. Obesity paradox in different populations: evidence and controversies. Future Cardiol. (2014) 10:81–91. doi: 10.2217/fca.13.84
4. Kwon Y, Kim HJ, Park S, Park YG, Cho KH. Body mass index-related mortality in patients with type 2 diabetes and heterogeneity in obesity paradox studies: A dose-response meta-analysis. PloS One. (2017) 12:e0168247. doi: 10.1371/journal.pone.0168247
5. Han SJ, Boyko EJ. The evidence for an obesity paradox in type 2 diabetes mellitus. Diabetes Metab J. (2018) 42:179–87. doi: 10.4093/dmj.2018.0055
6. Doehner W, Clark A, Anker SD. The obesity paradox: weighing the benefit. Eur Heart J. (2010) 31:146–8. doi: 10.1093/eurheartj/ehp339
7. Misra A, Soares MJ, Mohan V, Anoop S, Abhishek V, Vaidya R, et al. Body fat, metabolic syndrome and hyperglycemia in South Asians. J Diabetes Complications. (2018) 32:1068–75. doi: 10.1016/j.jdiacomp.2018.08.001
8. Gajalakshmi V, Lacey B, Kanimozhi V, Sherliker P, Peto R, Lewington S. Body-mass index, blood pressure, and cause-specific mortality in India: a prospective cohort study of 500 810 adults. Lancet Glob Health. (2018) 6:e787–94. doi: 10.1016/s2214-109x(18)30267-5
9. Kumar R, Mujtaba M, Ahmed R, Samad M, Ahmed S, Siddiqui MN, et al. Obesity paradox: a myth or reality, time to reveal the fact in a South Asian cohort presenting with STE-ACS undergoing primary percutaneous coronary intervention. Open Heart. (2023) 10:e002260. doi: 10.1136/openhrt-2023-002260
10. Gupta RD, Parray AA, Kothadia RJ, Pulock OS, Pinky SD, Haider SS, et al. The association between body mass index and abdominal obesity with hypertension among South Asian population: findings from nationally representative surveys. Clin Hypertens. (2024) 30:3. doi: 10.1186/s40885-023-00257-2
11. Narayan KMV, Kanaya AM. Why are South Asians prone to type 2 diabetes? A hypothesis based on underexplored pathways. Diabetologia. (2020) 63:1103–9. doi: 10.1007/s00125-020-05132-5
12. Rochford JJ. When adipose tissue lets you down: understanding the functions of genes disrupted in lipodystrophy. Diabetes. (2022) 71:589–98. doi: 10.2337/dbi21-0006
14. Lightbourne M, Brown RJ. Genetics of lipodystrophy. Endocrinol Metab Clin North Am. (2017) 46:539–54. doi: 10.1016/j.ecl.2017.01.012
15. Patni N, Garg A. Lipodystrophy for the diabetologist-what to look for. Curr Diabetes Rep. (2022) 22:461–70. doi: 10.1007/s11892-022-01485-w
16. Akinci B, Meral R, Oral EA. Phenotypic and genetic characteristics of lipodystrophy: pathophysiology, metabolic abnormalities, and comorbidities. Curr Diabetes Rep. (2018) 18:143. doi: 10.1007/s11892-018-1099-9
17. Joffe BI, Panz VR, Raal FJ. From lipodystrophy syndromes to diabetes mellitus. Lancet. (2001) 357:1379–81. doi: 10.1016/s0140-6736(00)04616-x
18. Hegele RA. Phenomics, lipodystrophy, and the metabolic syndrome. Trends Cardiovasc Med. (2004) 14:133–7. doi: 10.1016/j.tcm.2004.02.001
19. Melvin A, Stears A, Savage DB. Recent developments in lipodystrophy. Curr Opin Lipidol. (2019) 30:284–90. doi: 10.1097/mol.0000000000000613
20. Kahn CR, Wang G, Lee KY. Altered adipose tissue and adipocyte function in the pathogenesis of metabolic syndrome. J Clin Invest. (2019) 129:3990–4000. doi: 10.1172/jci129187
21. Jéru I. Genetics of lipodystrophy syndromes. Presse Med. (2021) 50:104074. doi: 10.1016/j.lpm.2021.104074
22. Zammouri J, Vatier C, Capel E, Auclair M, Storey-London C, Bismuth E, et al. Molecular and cellular bases of lipodystrophy syndromes. Front Endocrinol (Lausanne). (2022) 12:803189. doi: 10.3389/fendo.2021.803189
23. Stančáková A, Laakso M. Genetics of metabolic syndrome. Rev Endocr Metab Disord. (2014) 15:243–52. doi: 10.1007/s11154-014-9293-9
24. Desai M, Jellyman JK, Ross MG. Epigenomics, gestational programming and risk of metabolic syndrome. Int J Obes (Lond). (2015) 39:633–41. doi: 10.1038/ijo.2015.13
25. Lind L. Genome-wide association study of the metabolic syndrome in UK biobank. Metab Syndr Relat Disord. (2019) 17:505–11. doi: 10.1089/met.2019.0070
26. Wan JY, Goodman DL, Willems EL, Freedland AR, Norden-Krichmar TM, Santorico SA, et al. Genome-wide association analysis of metabolic syndrome quantitative traits in the GENNID multiethnic family study. Diabetol Metab Syndr. (2021) 13:59. doi: 10.1186/s13098-021-00670-3
27. Graziano F, Biino G, Bonati MT, Neale BM, Do R, Concas MP, et al. Estimation of metabolic syndrome heritability in three large populations including full pedigree and genomic information. Hum Genet. (2019) 138:739–48. doi: 10.1007/s00439-019-02024-6
28. Oh SW, Lee JE, Shin E, Kwon H, Choe EK, Choi SY, et al. Genome-wide association study of metabolic syndrome in Korean populations. PloS One. (2020) 15:e0227357. doi: 10.1371/journal.pone.0227357
29. Ho CY, Lee JI, Huang SP, Chen SC, Geng JH. A genome-wide association study of metabolic syndrome in the Taiwanese population. Nutrients. (2023) 16:77. doi: 10.3390/nu16010077
30. Prasad G, Bandesh K, Giri AK, Kauser Y, Chanda P, Parekatt V, et al. Genome-wide association study of metabolic syndrome reveals primary genetic variants at CETP locus in Indians. Biomolecules. (2019) 9:321. doi: 10.3390/biom9080321
31. Fall T, Ingelsson E. Genome-wide association studies of obesity and metabolic syndrome. Mol Cell Endocrinol. (2014) 382:740–57. doi: 10.1016/j.mce.2012.08.018
32. Pulit SL, Stoneman C, Morris AP, Wood AR, Glastonbury CA, Tyrrell J, et al. Meta-analysis of genome-wide association studies for body fat distribution in 694 649 individuals of European ancestry. Hum Mol Genet. (2019) 28:166–74. doi: 10.1093/hmg/ddy327
33. Scott RA, Fall T, Pasko D, Barker A, Sharp SJ, Arriola L, et al. Common genetic variants highlight the role of insulin resistance and body fat distribution in type 2 diabetes, independent of obesity. Diabetes. (2014) 63:4378–87. doi: 10.2337/db14-0319
34. Lotta LA, Gulati P, Day FR, Payne F, Ongen H, van de Bunt M, et al. Integrative genomic analysis implicates limited peripheral adipose storage capacity in the pathogenesis of human insulin resistance. Nat Genet. (2017) 49:17–26. doi: 10.1038/ng0217-317c
35. Mann JP, Savage DB. What lipodystrophies teach us about the metabolic syndrome. J Clin Invest. (2019) 129:4009–21. doi: 10.1172/jci129190
36. Sniderman AD, Bhopal R, Prabhakaran D, Sarrafzadegan N, Tchernof A. Why might South Asians be so susceptible to central obesity and its atherogenic consequences? The adipose tissue overflow hypothesis. Int J Epidemiol. (2007) 36:220–5. doi: 10.1093/ije/dyl245
37. Gujral UP, Kanaya AM. Epidemiology of diabetes among South Asians in the United States: lessons from the MASALA study. Ann N Y Acad Sci. (2021) 1495:24–39. doi: 10.1111/nyas.14530
38. Shah AD, Kandula NR, Lin F, Allison MA, Carr J, Herrington D, et al. Less favorable body composition and adipokines in South Asians compared with other US ethnic groups: results from the MASALA and MESA studies. Int J Obes (Lond). (2016) 40:639–45. doi: 10.1038/ijo.2015.219
39. Abate N, Chandalia M. Ethnicity and type 2 diabetes: focus on Asian Indians. J Diabetes Complications. (2001) 15:320–7.
40. Misra A, Khurana L. Obesity-related non-communicable diseases: South Asians vs White Caucasians. Int J Obes (Lond). (2011) 35:167–87. doi: 10.1038/ijo.2010.135
41. Misra A, Anoop S, Gulati S, Mani K, Bhatt SP, Pandey RM. Correction: body fat patterning, hepatic fat and pancreatic volume of non-obese asian Indians with type 2 diabetes in north India: A case-control study. PloS One. (2015) 10:e0142749. doi: 10.1371/journal.pone.0142749
42. Garg UK, Mathur N, Sahlot R, Tiwari P, Sharma B, Saxena A, et al. Abdominal fat depots and their association with insulin resistance in patients with type 2 diabetes. PloS One. (2023) 18:e0295492. doi: 10.1371/journal.pone.0295492
43. Mathur SK, Jain P, Mathur P, Punjabi P, Agarwal A, Sharma A. Transcriptomic analysis of visceral adipose from healthy and diabetic obese subjects. Indian J Endocrinol Metab. (2013) 17:446–50. doi: 10.4103/2230-8210.111639
44. Jain P, Vig S, Datta M, Jindel D, Mathur AK, Mathur SK, et al. Systems biology approach reveals genome to phenome correlation in type 2 diabetes. PloS One. (2013) 8:e53522. doi: 10.1371/journal.pone.0053522
45. Saxena A, Mathur N, Tiwari P, Mathur SK. Whole transcriptome RNA-seq reveals key regulatory factors involved in type 2 diabetes pathology in peripheral fat of Asian Indians. Sci Rep. (2021) 11:10632. doi: 10.1038/s41598-021-90148-z
46. Tiwari P, Saxena A, Gupta N, Medicherla KM, Suravajhala P, Mathur SK. Systems genomics of thigh adipose tissue from asian Indian type-2 diabetics revealed distinct protein interaction hubs. Front Genet. (2019) 9:679. doi: 10.3389/fgene.2018.00679
47. Kumar A, Tiwari P, Saxena A, Purwar N, Wahi N, Sharma B, et al. The transcriptomic evidence on the role of abdominal visceral vs. Subcutaneous adipose tissue in the pathophysiology of diabetes in asian Indians indicates the involvement of both. Biomolecules. (2020) 10:1230. doi: 10.3390/biom10091230
48. Saxena A, Tiwari P, Wahi N, Soni A, Bansiwal RC, Kumar A, et al. Transcriptome profiling reveals association of peripheral adipose tissue pathology with type-2 diabetes in Asian Indians. Adipocyte. (2019) 8:125–36. doi: 10.1080/21623945.2019.1595269
49. Saxena A, Tiwari P, Wahi N, Kumar A, Mathur SK. The common pathophysiologic threads between Asian Indian diabetic’s ‘Thin Fat Phenotype’ and partial lipodystrophy: the peripheral adipose tissue transcriptomic evidences. Adipocyte. (2020) 9:253–63. doi: 10.1080/21623945.2020.1776082
50. Habehh H, Gohel S. Machine learning in healthcare. Curr Genomics. (2021) 22:291–300. doi: 10.2174/1389202922666210705124359
51. Yadav DP, Jalal AS, Prakash V. Human burn depth and grafting prognosis using ResNeXt topology based deep learning network. Multimed Tools Appl. (2022) 81:18897–914. doi: 10.1007/s11042-022-12555-2
52. Piñero J, Bravo À, Queralt-Rosinach N, Gutiérrez-Sacristán A, Deu-Pons J, Centeno E, et al. DisGeNET: a comprehensive platform integrating information on human disease-associated genes and variants. Nucleic Acids Res. (2017) 45:D833–9. doi: 10.1093/nar/gkw943
53. Xue W, Wang J, Jiang W, Shi C, Wang X, Huang Y, et al. Caveolin-1 alleviates lipid accumulation in NAFLD associated with promoting autophagy by inhibiting the Akt/mTOR pathway. Eur J Pharmacol. (2020) 871:172910. doi: 10.1016/j.ejphar.2020.172910
54. Pellegrini C, Columbaro M, Schena E, Prencipe S, Andrenacci D, Iozzo P, et al. Altered adipocyte differentiation and unbalanced autophagy in type 2 Familial Partial Lipodystrophy: an in vitro and in vivo study of adipose tissue browning. Exp Mol Med. (2019) 51:1–17. doi: 10.1038/s12276-019-0289-0
55. Patel KA, Burman S, Laver TW, Hattersley AT, Frayling TM, Weedon MN. PLIN1 haploinsufficiency causes a favorable metabolic profile. J Clin Endocrinol Metab. (2022) 107:e2318–23. doi: 10.1210/clinem/dgac104
56. Nolis T. Exploring the pathophysiology behind the more common genetic and acquired lipodystrophies. J Hum Genet. (2014) 59:16–23. doi: 10.1038/jhg.2013.107
57. Vatier C, Bidault G, Briand N, Guénantin AC, Teyssières L, Lascols O, et al. What the genetics of lipodystrophy can teach us about insulin resistance and diabetes. Curr Diabetes Rep. (2013) 13:757–67. doi: 10.1007/s11892-013-0431-7
58. Fourman LT, Lima JG, Simha V, Cappa M, Alyaarubi S, Montenegro J, et al. A rapid action plan to improve diagnosis and management of lipodystrophy syndromes. Front Endocrinol. (2024) 15:1383318. doi: 10.3389/fendo.2024.1383318
59. Pandžić Jakšić V, Grizelj D. Under the surface of subcutaneous adipose tissue biology. Acta Dermatovenerol Croat. (2016) 24:250–60.
60. Sattar N, Gill JM. Type 2 diabetes as a disease of ectopic fat? BMC Med. (2014) 12:123. doi: 10.1186/s12916-014-0123-4
61. Shulman GI. Cellular mechanisms of insulin resistance. J Clin Invest. (2000) 106:171–176. 172. doi: 10.1172/jci10583
62. Virtue S, Vidal-Puig A. It’s not how fat you are, it’s what you do with it that counts. PloS Biol. (2008) 6:e237. 173. doi: 10.1371/journal.pbio.0060237
63. Danforth E. Failure of adipocyte differentiation causes type II diabetes mellitus? Nat Genet. (2000) 26:13. doi: 10.1038/79111
64. Fuchsberger C, Flannick J, Teslovich TM, Mahajan A, Agarwala V, Gaulton KJ, et al. The genetic architecture of type 2 diabetes. Nature. (2016) 536:41–7.
65. Mahajan A, Taliun D, Thurner M, Robertson NR, Torres JM, Rayner NW, et al. Fine-mapping type 2 diabetes loci to single-variant resolution using high-density imputation and islet-specific epigenome maps. Nat Genet. (2018) 50:1505–13.
Keywords: lipodystrophy, type 2 diabetes, Asian Indians, central obesity, insulin resistance, metabolic syndrome MetS, qPCR, adipose tissue
Citation: Saxena A, Tiwari P, Gupta S, Mandia R, Banshiwal RC, Lamoria RK, Anjana RM, Radha V, Mohan V and Mathur SK (2024) Exploring lipodystrophy gene expression in adipocytes: unveiling insights into the pathogenesis of insulin resistance, type 2 diabetes, and clustering diseases (metabolic syndrome) in Asian Indians. Front. Endocrinol. 15:1468824. doi: 10.3389/fendo.2024.1468824
Received: 22 July 2024; Accepted: 16 September 2024;
Published: 09 October 2024.
Edited by:
Lin Zhu, Vanderbilt University Medical Center, United StatesReviewed by:
Qing Cai, Virginia Commonwealth University, United StatesSivaprakasam Chinnarasu, Vanderbilt University Medical Center, United States
Copyright © 2024 Saxena, Tiwari, Gupta, Mandia, Banshiwal, Lamoria, Anjana, Radha, Mohan and Mathur. This is an open-access article distributed under the terms of the Creative Commons Attribution License (CC BY). The use, distribution or reproduction in other forums is permitted, provided the original author(s) and the copyright owner(s) are credited and that the original publication in this journal is cited, in accordance with accepted academic practice. No use, distribution or reproduction is permitted which does not comply with these terms.
*Correspondence: Sandeep Kumar Mathur, ZHJzYW5kZWVwbWF0aHVyQHJlZGlmZm1haWwuY29t
†ORCID: Sandeep Kumar Mathur, orcid.org/0000-0001-7494-4061