- 1School of Public Health, North China University of Science and Technology, Tangshan, China
- 2Department of Cardiology, Kailuan General Hospital, Tangshan, China
- 3Graduate School, North China University of Science and Technology, Tangshan, China
- 4Department of Cardiology, Chengde Central Hospital/Second Clinical College of Chengde Medical University, Chengde, Hebei, China
Objective: For a long time, the dispute about whether improved glycemic control can bring significant benefits has remained unresolved. We aimed to investigate the association of time spent in different fasting glucose target ranges with cardiovascular risk and all-cause mortality in a population with type 2 diabetes (T2DM).
Method: A total of 3460 T2DM patients in the Kailuan cohort were included in this study. The Time in Target Range (TITRE) was calculated as the proportion of time that fasting blood glucose (FBG) was within the usual glycemic control range and the intensive glycemic control range between 2006 and 2016. The Cox proportional hazards regression model analyzed the relationship between TITRE, defined by different glucose ranges, and cardiovascular disease and all-cause mortality.
Results: During a median follow-up of 4.23 years, a total of 360 CVDs and 238 deaths were recorded. After correcting for traditional risk factors, we observed that in the conventional blood glucose control group, each increase of 1 standard deviation in TITRE was associated with a 23% (HR, 0.77; 95%CI, 0.68-0.87) reduction in CVD risk and a 20% reduction in all-cause mortality (HR, 0.80; 95%CI, 0.69-0.92). Similar results were also observed in the intensified blood glucose control group. In the conventional blood glucose control group, participants with TITRE of 50% or more had an absolute incidence rate of CVD of 16.77%, whereas in the intensified blood glucose control group, participants with TITRE of 50% or more had an absolute incidence rate of CVD of 11.82%.
Conclusions: In patients with type 2 diabetes, achieving near-normal blood glucose levels appears to significantly reduce the risk of diabetes-related cardiovascular outcomes.
Introduction
Elevated fasting blood glucose (FBG) levels increase the risk of cardiovascular diseases (CVD) (1), significantly contributing to the global burden of CVD and mortality. Intensive glycemic control has been a primary strategy in managing type 2 diabetes mellitus (T2DM), aiming to reduce the risk of diabetes-related complications by strictly regulating blood glucose levels. However, the controversy over the significant benefits of intensive glycemic control remains unresolved (2).
Early clinical studies indicated that intensive glycemic control did not significantly reduce the incidence of macrovascular complications in T2DM patients and might even be associated with an increased risk of adverse events (3). The 6-year follow-up results of the ADVANCE study, presented at the 2014 EASD Annual Meeting, further explored the “legacy effect” of intensive glycemic control, showing that this effect diminishes during extended follow-up (4). In contrast, the recent UKPDS 91 study, which included a 10-year follow-up of 3277 surviving participants, confirmed the enduring benefits of intensive glycemic control (5). This phenomenon has prompted a reevaluation of intensive glycemic control strategies.
Traditional management of FBG involves controlling FBG levels within a specified target range at a single time point, without accounting for FBG fluctuations over time. Recently, glucose target time (TITRE) (6, 7), derived from multiple FBG measurements, has emerged as a measure associated with the risk of adverse outcomes in diabetes. Therefore, our objective was to assess the relationship between glucose target time and adverse cardiovascular outcomes and all-cause mortality among individuals with varying degrees of glycemic control.
Methods
Study population
Since 2006, all employees and retirees of Kailuan Group have undergone biennial physical examinations conducted by Kailuan General Hospital and its affiliated medical facilities. To date, seven rounds of comprehensive health assessments have been completed.
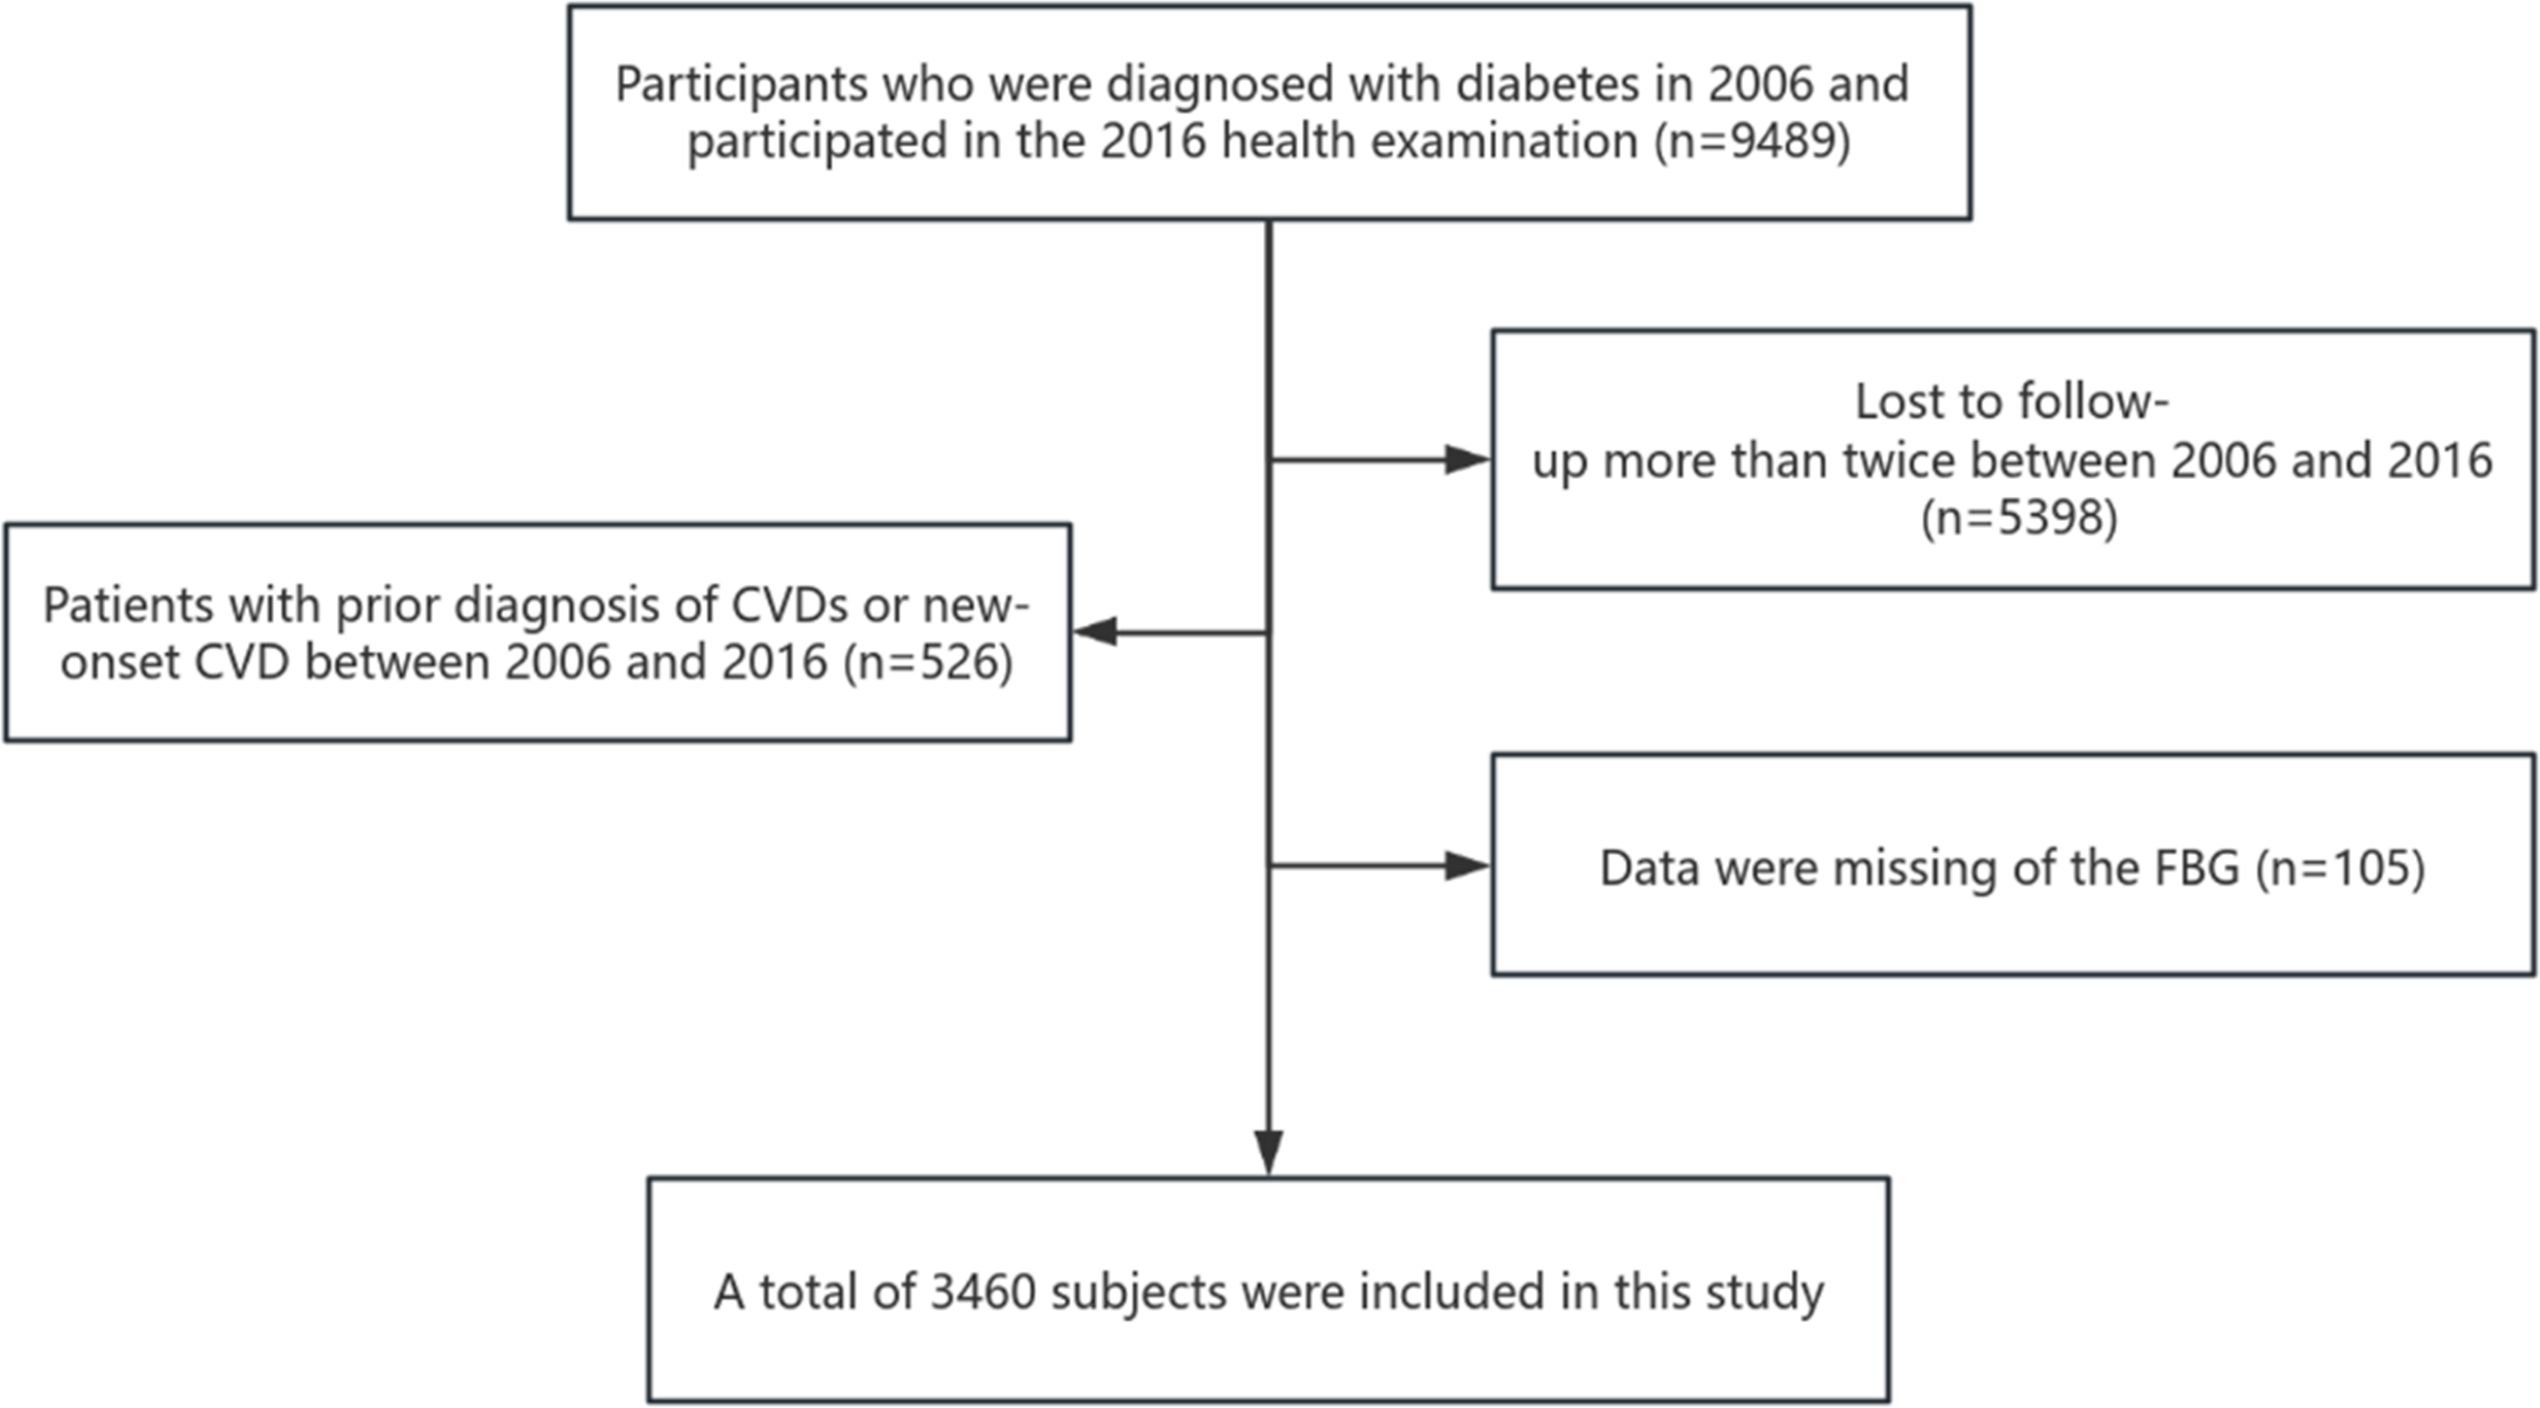
This study included 9489 subjects who were diagnosed with diabetes or had a history of diabetes in 2006 and actively participated in health examinations from 2006 to 2016. The time difference between health check-ups in 2006 and 2016 is considered the window period. Subjects were subsequently excluded from the analysis if any of the following criteria applied: (1) Lost to follow-up more than twice between 2006 and 2016 (n=5398); (2) Patients with prior diagnosis of CVDs or new-onset CVD between 2006 and 2016 (n=526); (3) Data were missing of the FBG (n=105). Therefore, 3,460 subjects were deemed eligible for the analysis. The detailed process is shown in Figure 1.
This study adheres to the principles of the Helsinki Declaration and has received approval from the Ethics Committee of Kailuan General Hospital (Approval Number: 2006-05). All participants agreed to take part in the study and provided informed written consent.
Fasting glucose measurement and definition of TITRE
FBG was measured using the hexokinase/glucose-6-phosphate dehydrogenase method (Mind Bioengineering Co Ltd, Shanghai, China) with an upper detection limit of 30.07 mmol/L (8). Five milliliters of fasting cubital venous blood were collected from each participant at 7:00-9:00 a.m. on the same day. Fasting blood glucose was measured by a Hitachi 7600 automatic biochemical analyzer within 4 hours. According to the guideline, the traditional control range of FBG was defined as 4.4mmol/L<FBG<7.0mmol/L (9). The intensive FBG control range was 3.9mmol/L<FBG<6.1mmol/L. The TITRE was calculated by the ratio of the time that the FBG was in the target range during the window period to the total time in the window period. cv-FBG was calculated using FBG data from the window period. FBG variability was calculated using the coefficient of variation as follows: SD is the standard deviation of the FBG values of the subjects and is their mean-FBG.
Assessment of covariates
Information on age, sex, smoking status, alcohol use status, education, medical history, and medication use was ascertained by standardized questionnaires. Physical examinations, including measurements of height, weight, and blood pressure, were conducted by trained nurses. Body mass index (BMI) was calculated as weight (kg) divided by height squared (m2). High-density lipoprotein cholesterol (HDL-C) and Low-density lipoprotein cholesterol (LDL-C) were measured by enzyme colorimetry. Serum creatinine (Scr) was measured using the sarcosine oxidase method, and the estimated glomerular filtration rate (eGFR) was calculated using Scr, which was calculated using the CKD Epidemiology Collaboration (CKD-EPI) equation (10).
Diabetes was defined as FBG ≥ 7.0 mmol/L or history of diabetes or use of antidiabetic drugs (11, 12). Hypertension was defined as systolic blood pressure (SBP) ≥ 140 mmHg and/or diastolic blood pressure (DBP) ≥ 90 mmHg, use of antihypertensive medications, or a self-reported history of hypertension (13).
Outcome events and follow-up time
The primary outcomes of this study were the first occurrence of cardiovascular disease (CVD) and all-cause mortality. Data on annual CVD events were obtained from the Kailuan Social Security Information System, with trained medical personnel responsible for recording events at designated hospitals. Specialist physicians confirmed all diagnoses based on hospital medical records. The definition of myocardial infarction (MI) followed the criteria from the World Health Organization’s “Multinational Monitoring of Trends and Determinants in Cardiovascular Disease (MONICA)” project, based on clinical symptoms, dynamic changes in cardiac enzyme and biomarker levels, and electrocardiogram (ECG) results [38]. Heart failure (HF) was diagnosed according to the European Society of Cardiology (ESC) guidelines. Stroke was defined based on clinical symptoms and confirmed by computed tomography (CT), magnetic resonance imaging (MRI), or other diagnostic reports [39].
Cardiovascular disease diagnosis data were sourced from the city’s social insurance agency and hospital discharge records, updated annually during the follow-up period. These records covered all participants in the Kailuan study. A specialized team reviewed discharge records from Kailuan General Hospital and its 11 affiliated hospitals each year to identify suspected cardiovascular disease cases. All-cause mortality data were collected from the Provincial Vital Statistics Office and verified by physicians.
The follow-up began in 2016, and it ended upon the occurrence of the first CVD event. In cases where multiple CVD events occurred, the time of the first event was recorded as the endpoint. If no CVD event occurred but death was reported, the follow-up was considered complete at the time of death. For participants who experienced neither a CVD event nor death, the follow-up continued until December 31, 2021.
Statistical analysis
The observation subjects were divided into 3 groups according to the TITRE (0%, <50%, ≥50%). Normality test for quantitative variables (see Supplementary Figure A). Measurement data by normal distribution were expressed as ( ± S), and a one-way analysis of variance was used for comparison among multiple groups. Measurement data not in line with normal distribution were expressed as median (P25, P75), and the Kruskal-Wallis tests were used to compare various groups. Count data were expressed as the number of cases and percentage, and comparison between groups was analyzed using the chi-square test. Standard deviation (SD) and P for trend were used to estimate the trends in the risk of CVDs and all-cause mortality. Restricted cubic spline curves explored the dose-response relationship of TITRE across different glycemic control ranges at the 30th, 60th, and 90th percentiles of the TITRE distribution.
The linear interpolation method was used to estimate TITRE (14). Cox proportional regression models were used to estimate crude hazard ratios (HRs). They adjusted 95% confidence intervals (CIs) for each 1-SD increase in TITRE for the two different target ranges and cardiovascular outcomes, as well as all-cause mortality. The model was adjusted for age, sex, education level, smoking status, drinking status, physical activity, history of hypertension, dyslipidemia, antihypertensive medication, antidiabetic medication, BMI, SBP, and eGFR. The proportional hazards assumption in the Cox model was tested using the Schoenfeld residual test. All scaling assumptions were generally appropriate.
In addition, we investigated the association of each 1-SD increase in TITRE with CVD subtypes separately. HF and MI were combined as a single category for analysis due to the small number of events. In the stratification analysis, multiplicative interaction terms were used to assess the interaction between the randomization arm and the association of TITRE with CVDs and deaths. The random variables included age (>65 years or ≤65 years), sex (male or female), eGFR at baseline (< 90 mL/min/1.73 m2 or ≥ 90 mL/min/1.73 m2), BMI at baseline (<25kg/m2 or ≥25kg/m2) and hypertension (yes or no). Finally, we also considered the average blood glucose (mean-FBG) and cv-FBG about TITRE with CVD and all-cause mortality. Pearson correlation analysis assessed the association between these factors and TITRE.
Multiple studies have demonstrated that diabetic patients are often accompanied by elevated levels of CRP, a marker of chronic low-grade inflammation (15, 16), which may serve as an important driver of CVD (17). Therefore, in the sensitivity analysis, generalized estimating equations (GEE) (18) were used to quantify the association between TITRE and repeated measurements of CRP. As CRP does not follow a normal distribution, it was log-transformed for analysis. The purpose of this analysis was to assess the robustness of the primary findings.
All statistical analyses above were performed using SAS 9.4 and Stata 16 software. A two-sided P value<0.05 was considered statistically significant.
Result
Baseline characteristics of the subjects
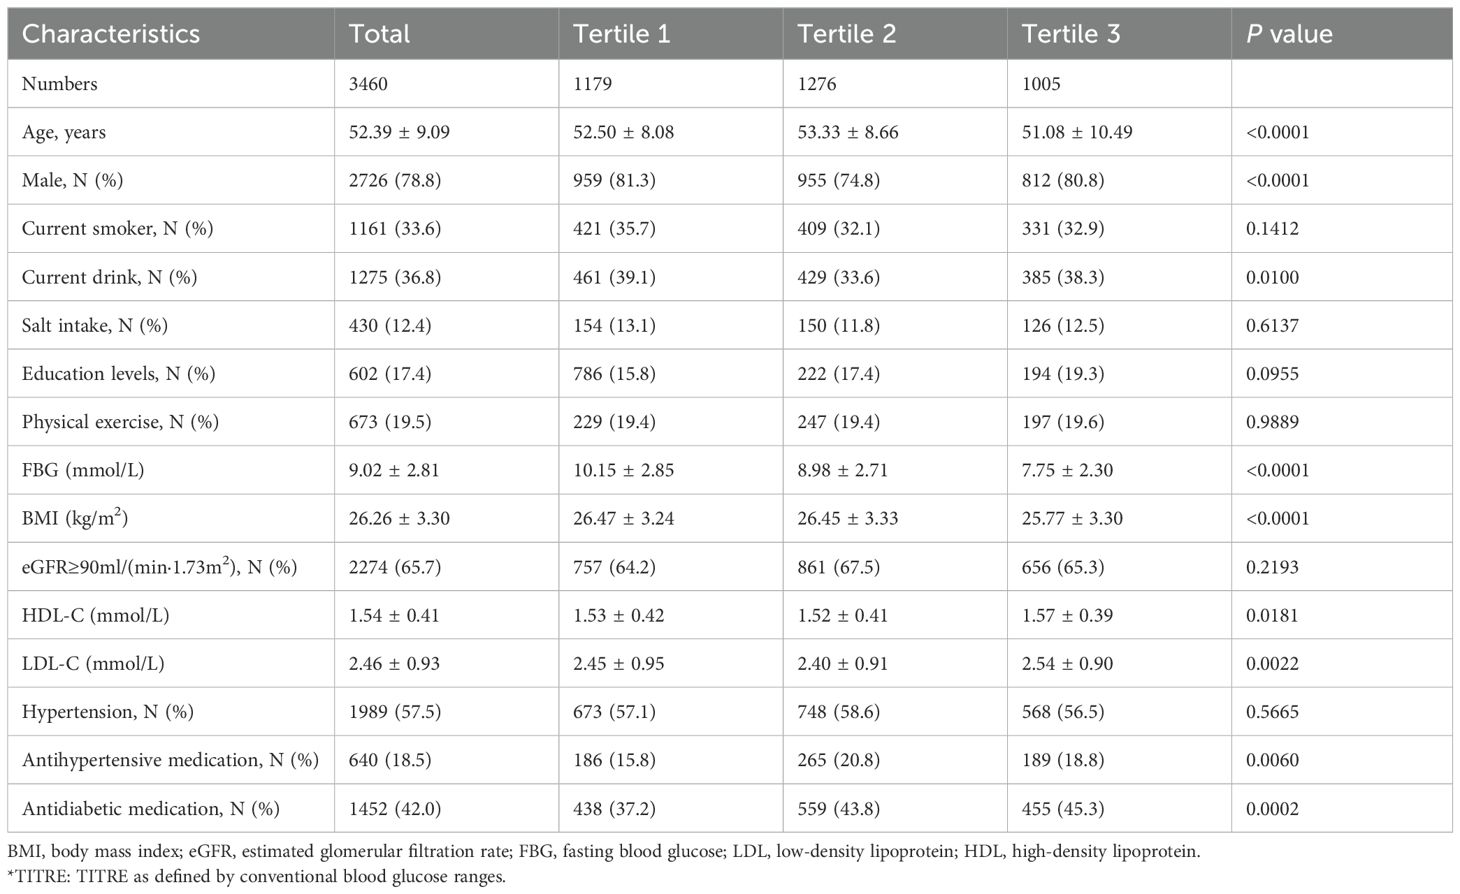
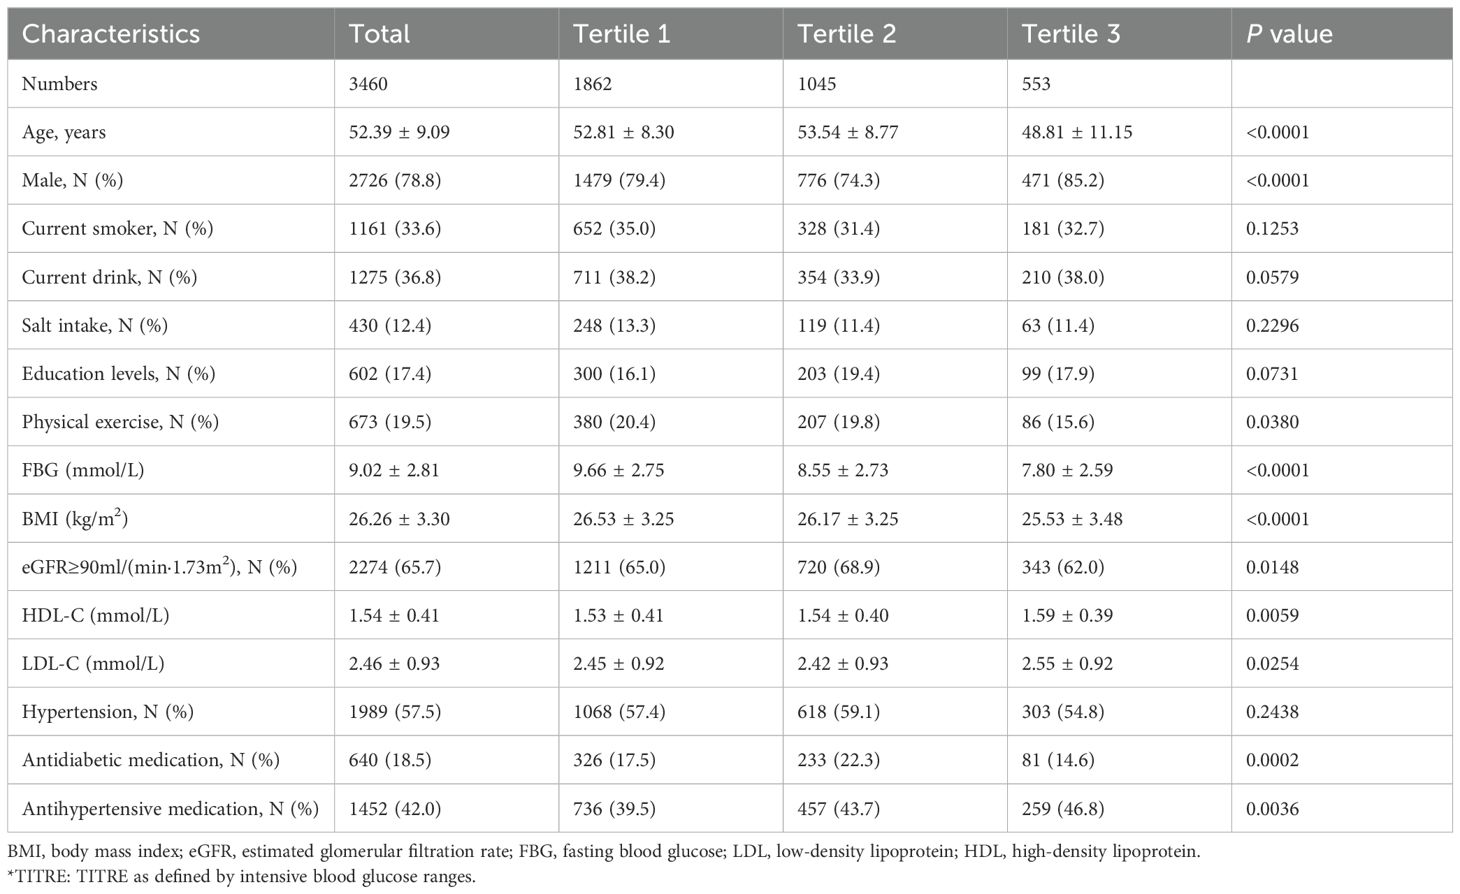
A total of 3,460 participants were enrolled in the analysis, the mean age was 52.39 ± 9.09 years, and 2,726 (78.8%) were men. Among them, 80% of the subjects had participated in five or more health checkups. The basic characteristics after grouping the TITRE according to different ranges of glycemic control are shown in Tables 1, 2. Regardless of the glycemic range, individuals with higher TITRE were younger, had a lower proportion of smokers, were less likely to have hypertension, and had lower levels of BMI and LDL.
Association of TITRE with outcomes
During a median follow-up of 4.23 years, 360 CVD events and 238 deaths were recorded. Higher TITRE was associated with a decreased cumulative risk of cardiovascular outcomes and all-cause mortality (log-rank test, P < 0.05, Figure 2).
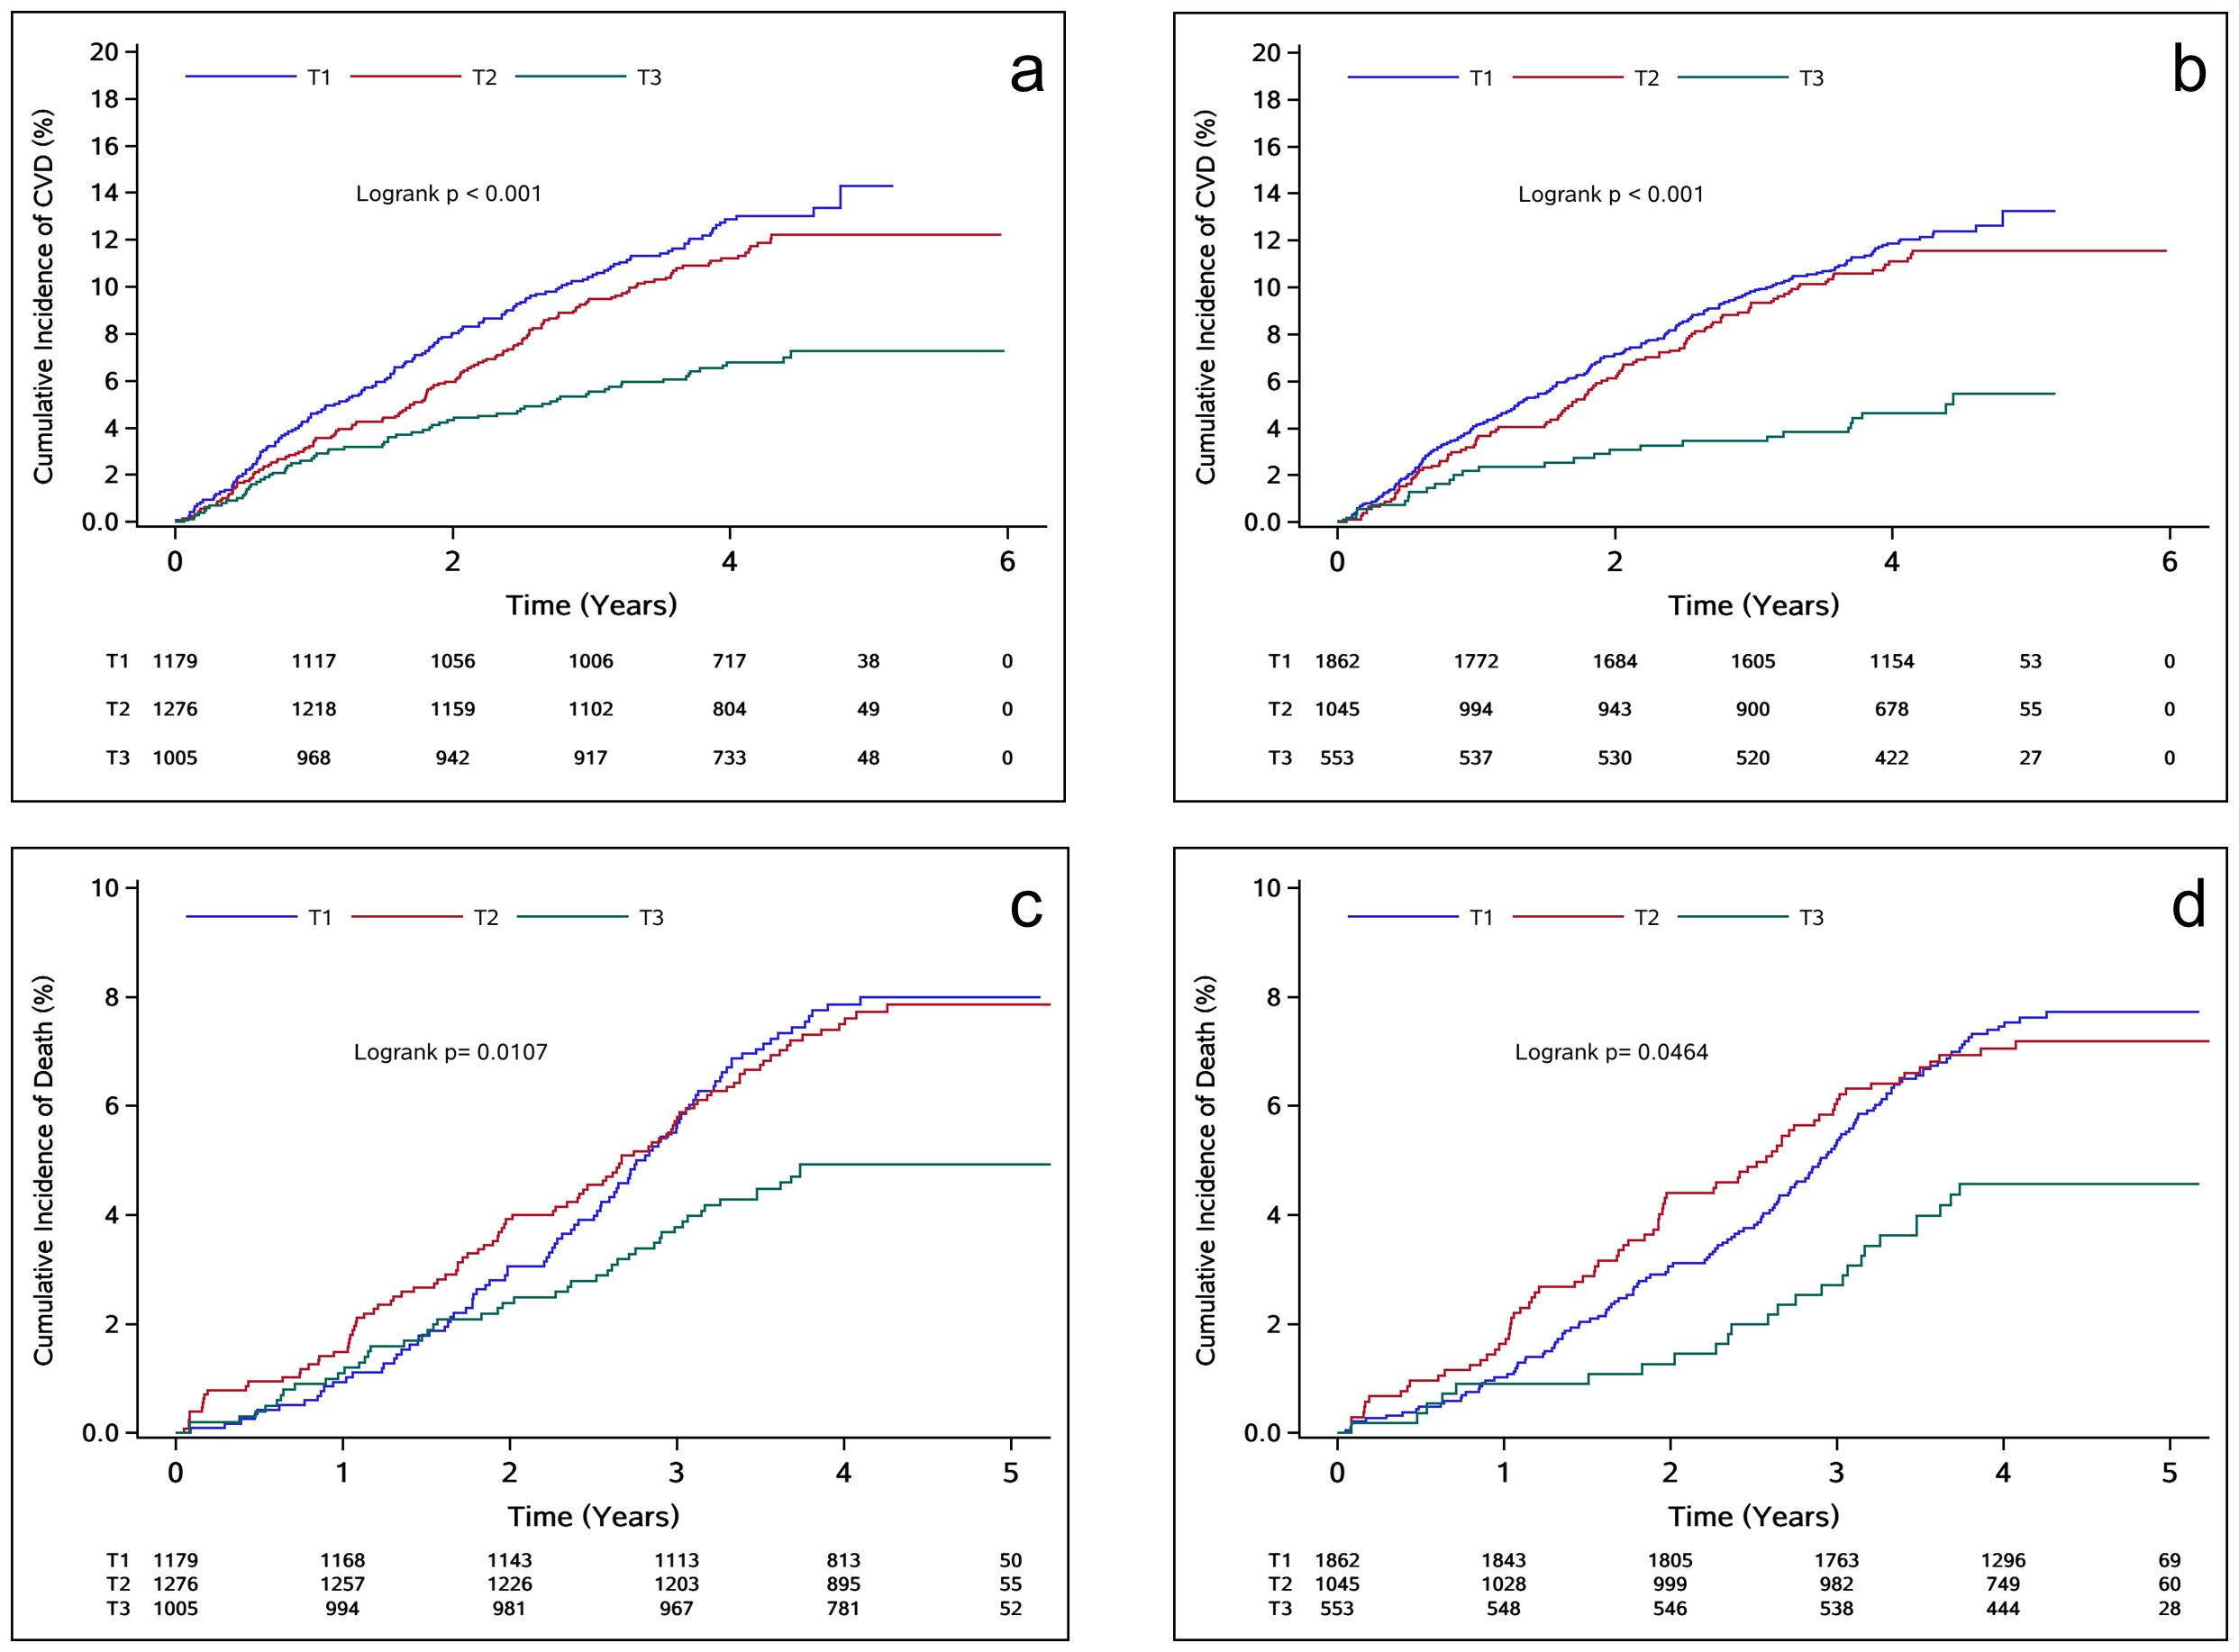
Figure 2. (A, C) depict the K-M survival curves focusing on the relationship between TITRE of the traditional group and the observed outcomes; (B, D) in order to strengthen group. T1: TITRE=0%; T2: 0%<TITRE<50%; T3: TITRE≥50%.
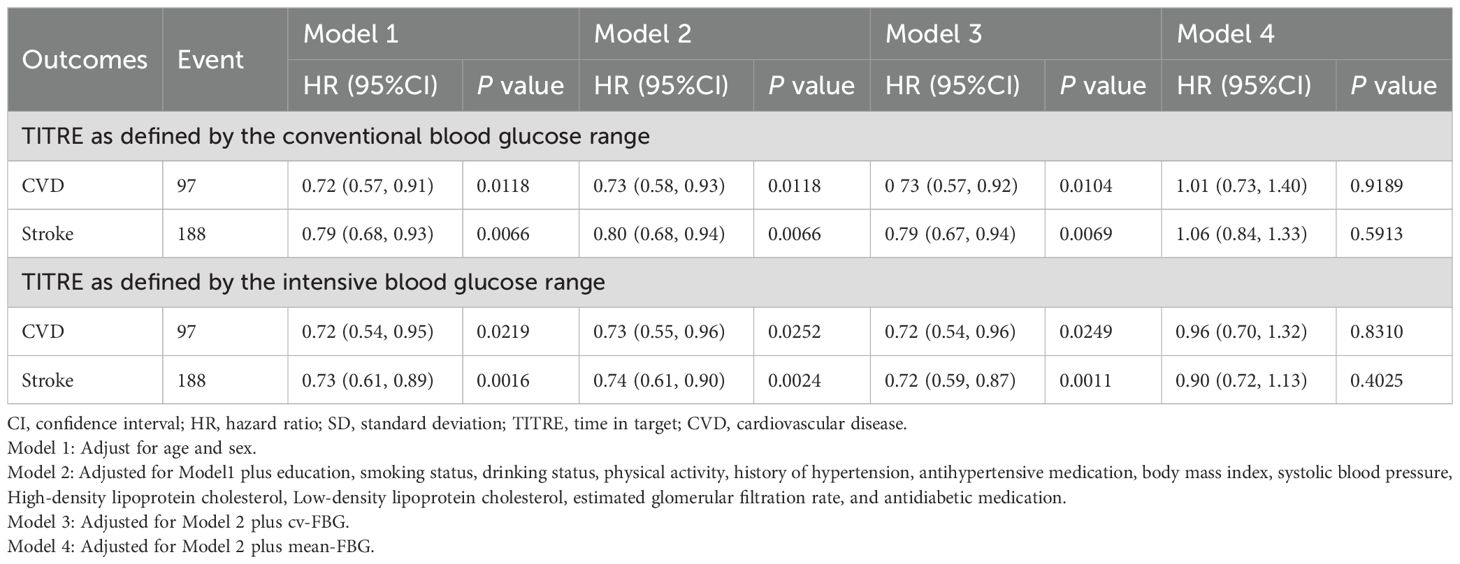
In the traditional group, the incidence of CVD and all-cause mortality for individuals with TITRE >50% were 16.77 and 11.62 per 1000 person-years, respectively. In the intensified group, the incidence of CVD and all-cause mortality were 11.82 and 10.64 per 1000 person-years, respectively. After adjusting for potential confounding factors, the negative association between TITRE and the risks of CVD and all-cause mortality persisted in both groups. In the traditional group, each 1 SD increase in TITRE was associated with a 23% reduction in the risk of CVD (HR, 0.77; 95% CI, 0.70-0.85; P for trend < 0.0001, Table 3) and a 20% reduction in the risk of all-cause mortality (HR, 0.80; 95% CI, 0.73-0.93; P for trend < 0.0001). Similar trends were observed in the intensified group, with an even stronger inverse association noted for cardiovascular disease, as illustrated in Figure 3. This association persisted despite further adjustment for cv-FBG in the model. However, it disappeared after correction for mean-FBG. The results of the Pearson correlation test showed a strong negative correlation between the average value of FBG and TITRE (R = -0.76; R = -0.69 in the intensive control group).
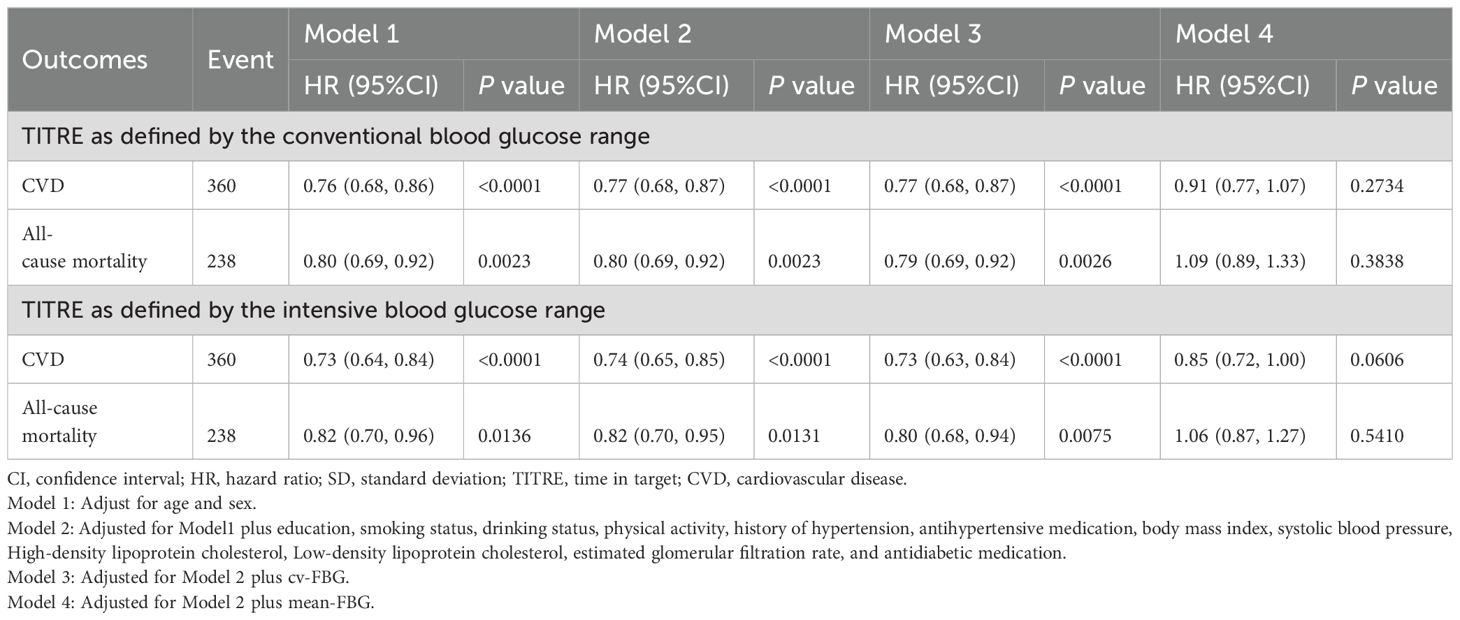
Table 3. Adjusted hazard ratios for the association of a 1 SD increase in TITRE with cardiovascular outcomes and all-cause mortality.
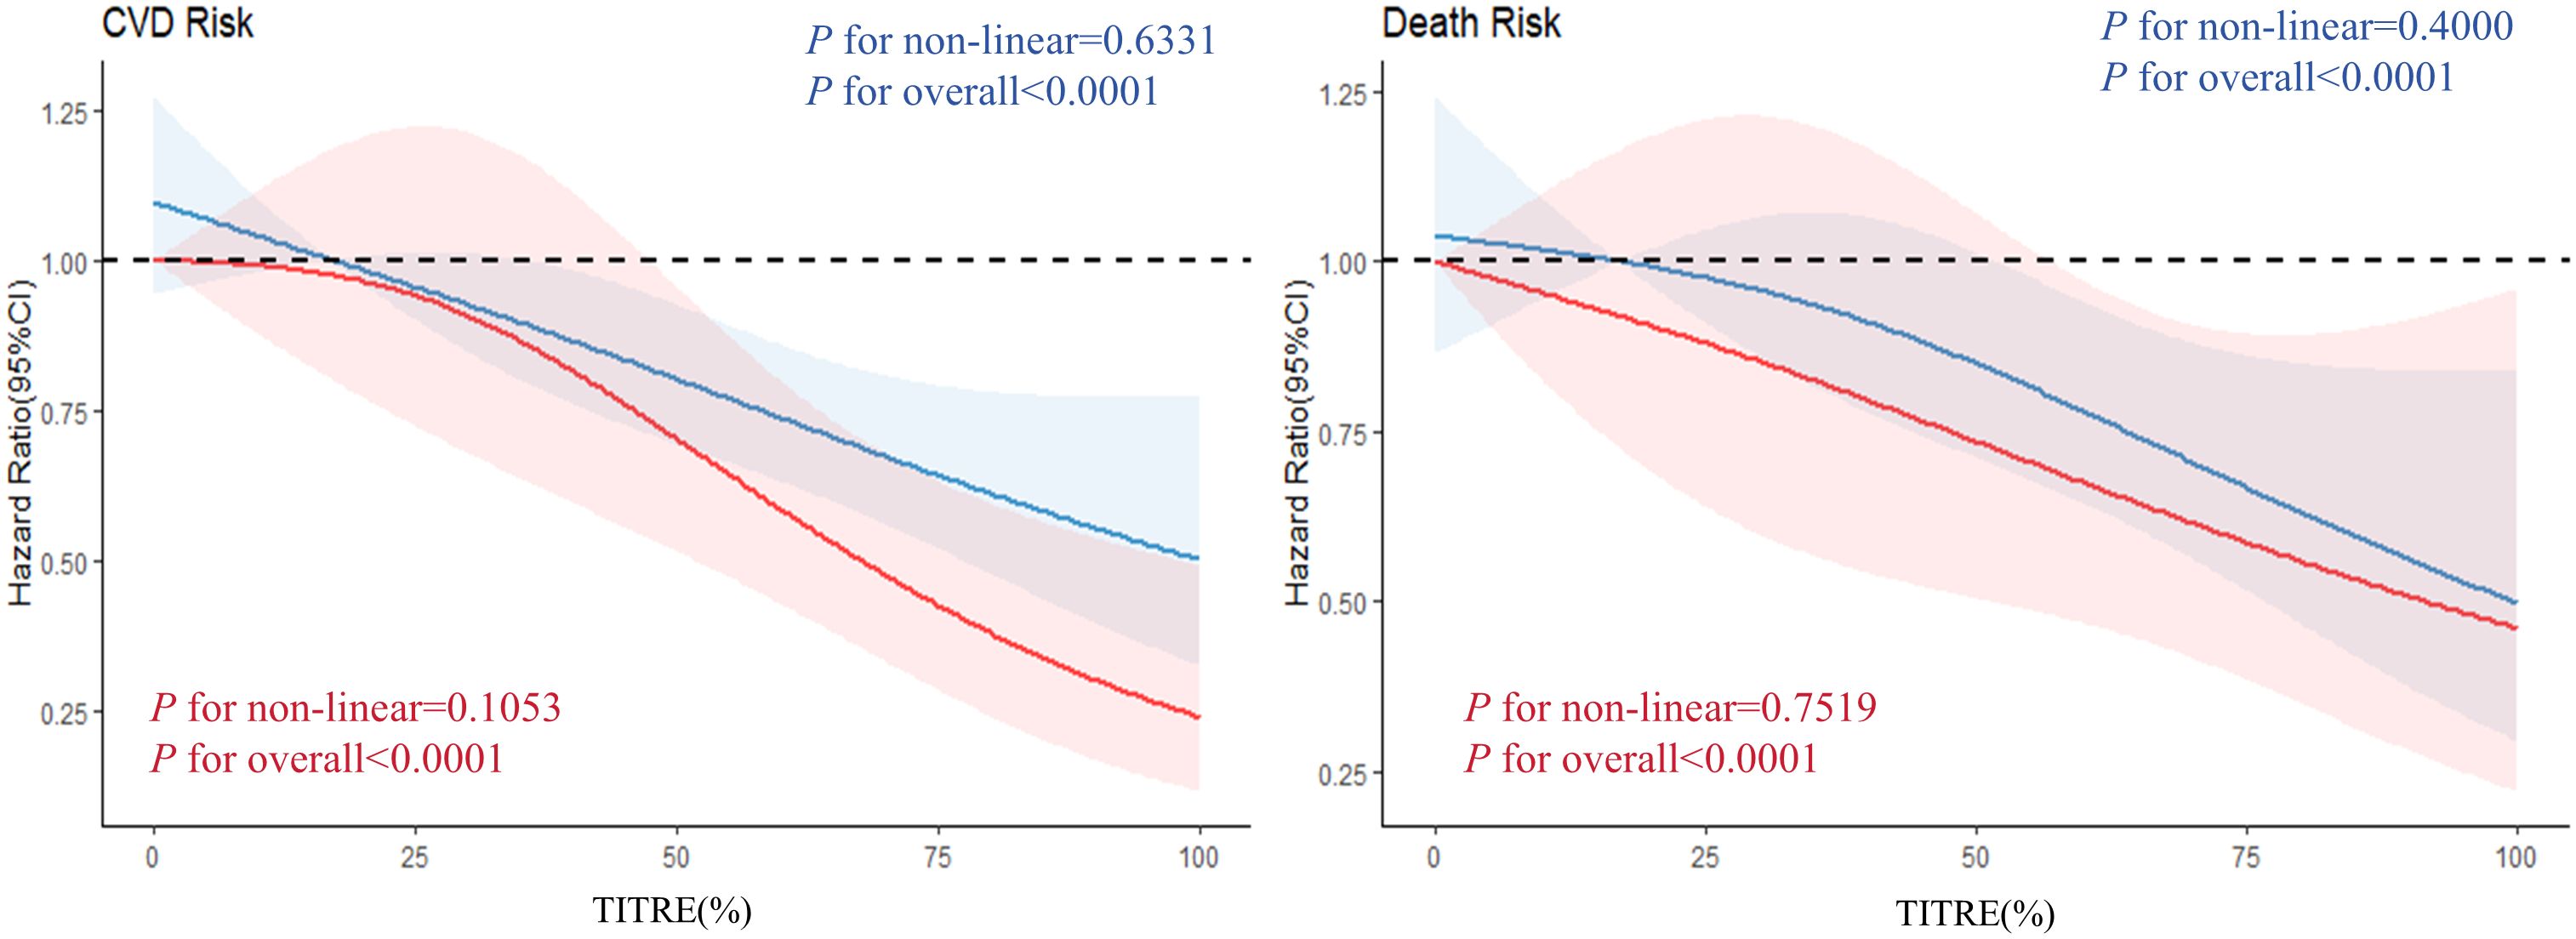
Figure 3. Analyzing the dose-response relationship between different groups of TITRE and the observed outcomes. The red curve represents the intensive group, while the blue curve represents the traditional group.
Consistent results were obtained for CVD subtypes, with a more pronounced negative association between TITRE and stroke in the intensified group (Table 4). Each 1 SD increase in TITRE was associated with a 26% reduction in stroke risk in the intensified group, compared to a 20% reduction in the traditional group.
The aforementioned model has no multicollinearity among the covariates (VIF < 10).
Stratification analysis
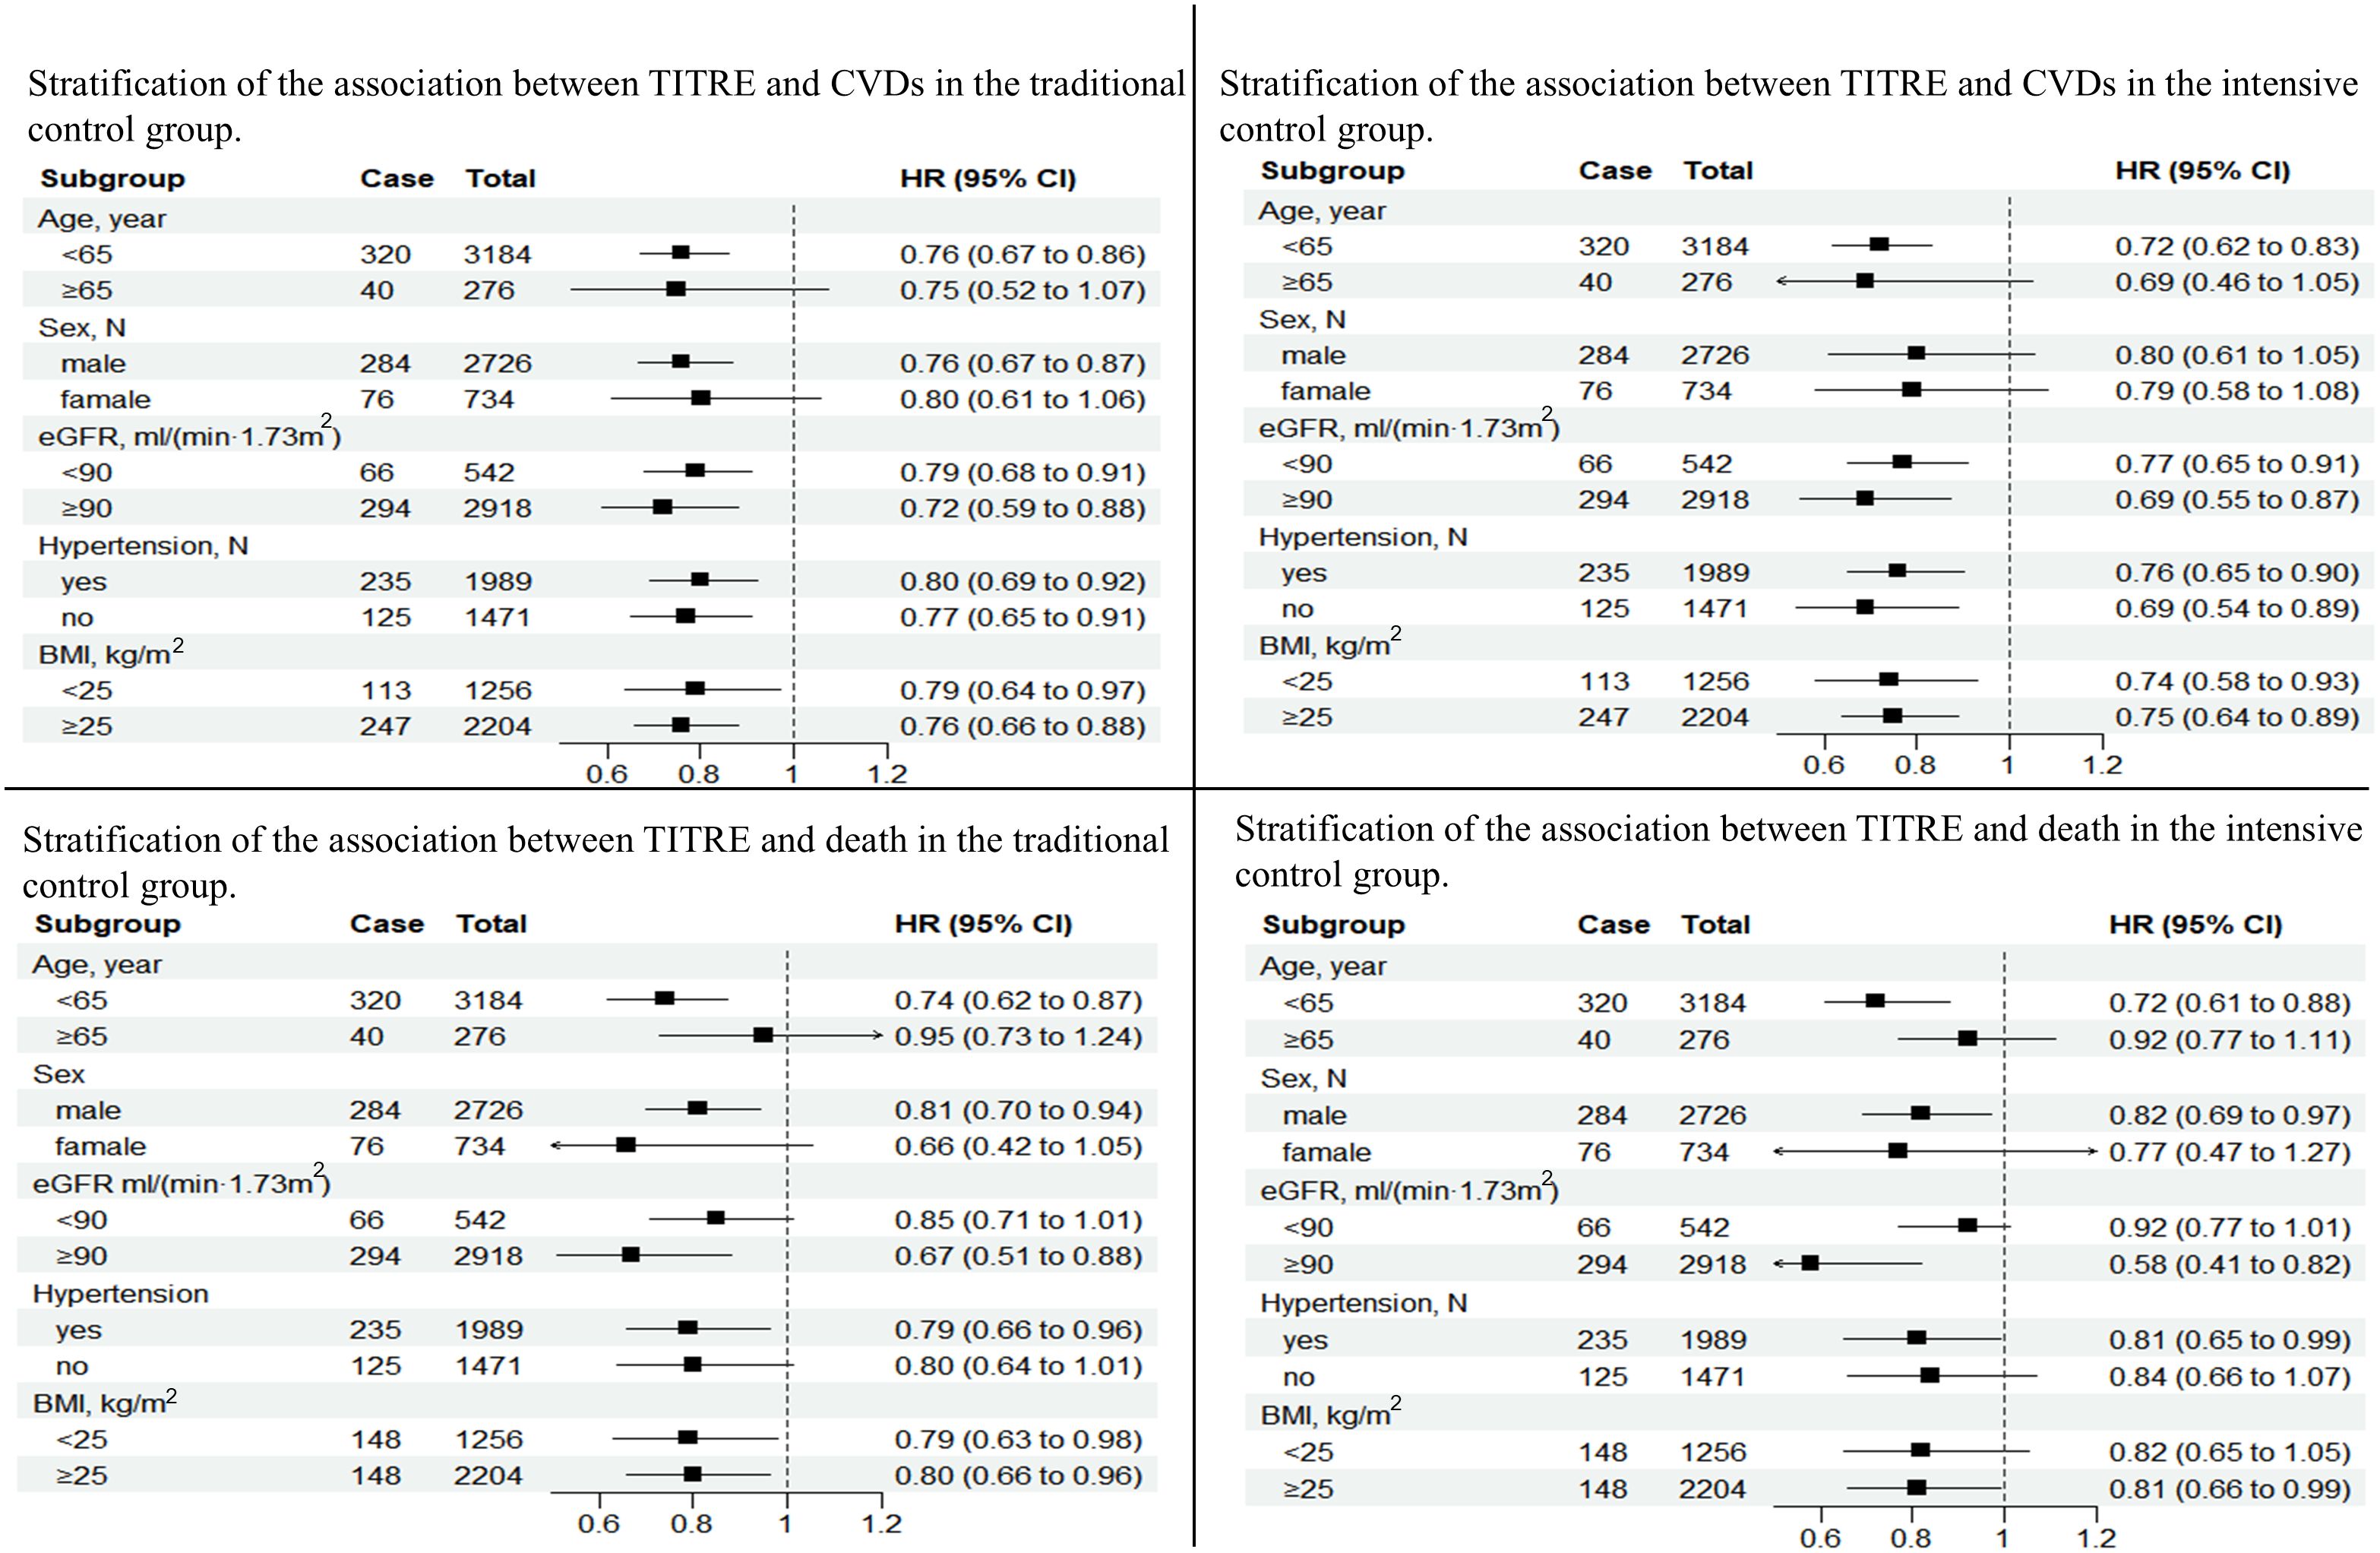
Subgroup analysis showed that the cardiovascular protective effect of TITRE was more significant in male (P for interaction < 0.0001), with each 1-SD increase in TITRE being associated with a 24% reduction in the risk of CVD in the conventional group and a 28% reduction in the enhanced group. Similar results were found in age stratification. In addition, no other significant differences were observed between the groups. However, prolonged intensive glucose control significantly reduced the risk of all-cause death in patients with normal renal function (HR, 0.58; 95% CI, 0.41-0.82, Figure 4).
Sensitivity analysis
In the sensitivity analysis, we applied GEE to assess the relationship between TITRE and repeated measurements of CRP. Since CRP is skewed, we log-transformed CRP in this analysis. The results are shown in Supplementary Table S1. In both the conventional and intensive groups, an increase in TITRE was associated with a decrease in log (CRP) values. Notably, this association was more pronounced in the intensive treatment group.
Discussion
In the Kailuan cohort analysis, after a median follow-up of 4.23 years, we found that long-term control of fasting blood glucose within the intensive target range (TITRE in the intensive group) was associated with a significant reduction in the risk of CVD and all-cause mortality. This inverse association of TITRE with CVD and all-cause mortality was independent of traditional risk factors, including FBG variability.
Our study results indicate a significant linear decreasing trend in the risk of CVD and all-cause mortality with increasing TITRE levels, regardless of the target range. As TITRE levels increase, the risk of CVD and all-cause mortality progressively decreases. Notably, in the intensive glycemic control group, the cardiovascular protective effect in diabetic patients was more pronounced, especially in reducing stroke risk (CVD: HR 0.74, 95% CI 0.65-0.85; stroke: HR 0.74, 95% CI 0.61-0.90). When patients maintained their FBG within the target range for more than 50% of the time, the absolute risk of CVD was reduced by 4.95% in the intensive group compared to the conventional group. The 24-year follow-up of the UKPDS study demonstrated that the legacy effect of early intensive glycemic control did not attenuate during the 24 years after the trial ended (5). The intensive glycemic control group still exhibited significant cardiovascular benefits (a 10% reduction in overall relative risk of death, a 17% reduction in the risk of myocardial infarction, and a 26% reduction in the risk of microvascular complications). This is consistent with our findings. It is important to note that the post-trial follow-up of the UKPDS study lacked detailed glycemic data after the intervention period. In contrast, our study had access to glycemic data. This allowed us to calculate the time within the glycemic target range through a large number of repeated glucose measurements, providing a more comprehensive understanding of long-term glycemic control. Although our study had a shorter follow-up period (median follow-up time of 4.23 years), we preserved detailed glycemic records, allowing for a more in-depth exploration of the sustained impact of glycemic control at different target ranges on cardiovascular outcomes. This fills a critical gap in the UKPDS study results. However, the ADVANCE study, which reported 6-year follow-up results in 2014 (4), showed that intensive glycemic control, compared with standard control, failed to demonstrate long-term benefits in reducing mortality or major macrovascular events. This is inconsistent with our findings, and a possible explanation could be that, after the end of the ADVANCE trial, both groups of patients received similar conventional treatment, leading to a convergence of glucose levels. In contrast, our study grouped patients by their TITRE over ten years, allowing a more intuitive analysis of the relationship between glycemic control and adverse cardiovascular outcomes and all-cause mortality. Additionally, we included heart failure as part of the definition of adverse cardiovascular outcomes, whereas heart failure was not considered in the ADVANCE study. These factors enabled our study to provide a more comprehensive assessment of the potential cardiovascular health benefits of long-term glycemic control.
Moreover, in the stratified analysis of TITRE and the risk of CVD and all-cause mortality, we found that the protective effect of TITRE was more significant in the intensive group, with a larger reduction in the risk of CVD and all-cause mortality. This effect was particularly prominent in the subgroup of patients under 65 years old and those with good renal function. Another interesting finding was that, compared to diabetic patients without hypertension, those with concomitant hypertension who maintained their blood glucose within the target range for a longer period may have a reduced risk of all-cause mortality.
Finally, we also considered the relationship between good glycemic control and the risk of inflammation in the diabetic population. In the sensitivity analysis, repeated measurements of CRP, as an inflammatory marker, were collected to further explore the association between diabetes control and inflammation risk. As glycemic control improved (with increasing TITRE), inflammation levels [log (CRP) values] significantly decreased. This negative correlation was more pronounced under intensive glycemic control (with an estimated coefficient of -0.0025, compared to -0.0020 under conventional glycemic control), suggesting that intensive glycemic control may be more effective than conventional control in reducing systemic inflammation. This finding further emphasizes the importance of early and sustained good glycemic control in patients with type 2 diabetes.
Although the physiological mechanisms underlying the association between TITRE and cardiovascular outcomes remain unclear, some possible explanations have been proposed (19–21). Lower TITRE reflects poorer glycemic control, which may promote the deterioration of β-cell function. The loss of β-cells may lead to increased oxidative stress, activation of the renin-angiotensin system, release of inflammatory cytokines, and endothelial dysfunction, thereby accelerating atherosclerosis and increasing the risk of cardiovascular disease.
Limitations
First, we did not measure other glycemic indicators, such as glycated hemoglobin (HbA1c), and therefore were unable to compare the effectiveness of TITRE and HbA1c in predicting cardiovascular disease risk and mortality. This requires further investigation. Additionally, the absence of HbA1c data may have resulted in a slightly lower number of diagnosed diabetes cases. However, our laboratory used the same diagnostic criteria in previous studies, and these criteria underwent careful review, so we believe they are reliable. Second, the need to observe a longer time window for fasting blood glucose target achievement resulted in a relatively short follow-up period. Finally, all participants were of Chinese ethnicity, which may limit the generalizability of our findings.
Conclusion
In conclusion, our findings further emphasize the importance of maintaining good glycemic control in patients with type 2 diabetes. Long-term control of blood glucose at lower levels in patients with type 2 diabetes appears to significantly reduce the risk of diabetes-related cardiovascular outcomes and mortality.
Data availability statement
The raw data supporting the conclusions of this article will be made available by the authors, without undue reservation.
Ethics statement
The studies involving humans adheres to the principles of the Helsinki Declaration and has received approval from the Ethics Committee of Kailuan General Hospital (Approval Number: 2006- 05). All participants agreed to take part in the study and provided informed written consent. The studies were conducted in accordance with the local legislation and institutional requirements. The human samples used in this study were acquired from primarily isolated as part of your previous study for which ethical approval was obtained. Written informed consent for participation was not required from the participants or the participants’ legal guardians/next of kin in accordance with the national legislation and institutional requirements. Written informed consent was obtained from the individual(s) for the publication of any potentially identifiable images or data included in this article.
Author contributions
JZ: Formal analysis, Writing – original draft, Writing – review & editing. LL: Investigation, Writing – review & editing. DL: Methodology, Writing – review & editing. ZYH: Investigation, Writing – review & editing. XZ: Formal analysis, Writing – review & editing. YX: Data curation, Writing – review & editing. JJ: Data curation, Writing – review & editing. TL: Project administration, Writing – review & editing. SW: Formal analysis, Investigation, Supervision, Writing – review & editing. ZH: Investigation, Resources, Supervision, Writing – review & editing.
Funding
The author(s) declare that no financial support was received for the research, authorship, and/or publication of this article.
Acknowledgments
The authors express their gratitude to the employees of the Kailuan Group for their participation in this study and acknowledge the Kailuan Study for providing data support.
Conflict of interest
The authors declare that the research was conducted in the absence of any commercial or financial relationships that could be construed as a potential conflict of interest.
Publisher’s note
All claims expressed in this article are solely those of the authors and do not necessarily represent those of their affiliated organizations, or those of the publisher, the editors and the reviewers. Any product that may be evaluated in this article, or claim that may be made by its manufacturer, is not guaranteed or endorsed by the publisher.
Supplementary material
The Supplementary Material for this article can be found online at: https://www.frontiersin.org/articles/10.3389/fendo.2024.1449925/full#supplementary-material
Supplementary Table 1 | Sensitivity analysis of GEE results for traditional group and intensive group.
References
1. Collaboration APCS. Blood glucose and risk of cardiovascular disease in the Asia pacific region. Diabetes Care. (2004) 27:2836–42. doi: 10.2337/diacare.27.12.2836
2. Folz R, Laiteerapong N. The legacy effect in diabetes: are there long-term benefits? Diabetologia. (2021) 64:2131–7. doi: 10.1007/s00125-021-05539-8
3. Zhang X, Liu Y, Zhang F, Li J, Tong N. Legacy effect of intensive blood glucose control on cardiovascular outcomes in patients with type 2 diabetes and very high risk or secondary prevention of cardiovascular disease: A meta-analysis of randomized controlled trials. Clin Ther. (2018) 40:776–788.e3. doi: 10.1016/j.clinthera.2018.03.015
4. Zoungas S, Chalmers J, Neal B, Billot L, Li Q, et al. Follow-up of blood-pressure lowering and glucose control in type 2 diabetes. N Engl J Med. (2014) 371:1392–406. doi: 10.1056/NEJMoa1407963
5. Adler AI, Coleman RL, Leal J, Whiteley WN, Clarke P, Holman RR. Post-trial monitoring of a randomised controlled trial of intensive glycaemic control in type 2 diabetes extended from 10 years to 24 years (UKPDS 91). Lancet. (2024) 404:145–55. doi: 10.1016/S0140-6736(24)00537-3
6. Thabit H, Prabhu JN, Mubita W, Fullwood C, Azmi S, Urwin A, et al. Use of factory-calibrated real-time continuous glucose monitoring improves time in target and hbA1c in a multiethnic cohort of adolescents and young adults with type 1 diabetes: the MILLENNIALS study. Diabetes Care. (2020) 43:2537–43. doi: 10.2337/dc20-0736
7. Rodbard D. Glucose time in range, time above range, and time below range depend on mean or median glucose or hbA1c, glucose coefficient of variation, and shape of the glucose distribution. Diabetes Technol Ther. (2020) 22:492–500. doi: 10.1089/dia.2019.0440
8. Jin C, Chen S, Vaidya A, Wu Y, Wu Z, Hu FB, et al. Longitudinal change in fasting blood glucose and myocardial infarction risk in a population without diabetes. Diabetes Care. (2017) 40:1565–72. doi: 10.2337/dc17-0610
9. Jia W, Weng J, Zhu D, Ji L, Lu J, Zhou Z, et al. Standards of medical care for type 2 diabetes in China 2019. Diabetes/Metabol Res Rev. (2019) 35:e3158. doi: 10.1002/dmrr.3158
10. Li J, Huang Z, Hou J, Sawyer AM, Wu Z, Cai J, et al. Sleep and CKD in Chinese adults: A cross-sectional study. Clin J Am Soc Nephrol. (2017) 12:885–92. doi: 10.2215/cjn.09270816
11. Zhao M, Song L, Sun L, Wang M, Wang C, Yao S, et al. Associations of type 2 diabetes onset age with cardiovascular disease and mortality: the Kailuan study. Diabetes Care. (2021) 44:1426–32. doi: 10.2337/dc20-2375
12. Sattar N, Rawshani A, Franzen S, Rawshani A, Svensson AM, Rosengren A, et al. Age at diagnosis of type 2 diabetes mellitus and associations with cardiovascular and mortality risks. Circulation. (2019) 139:2228–37. doi: 10.1161/CIRCULATIONAHA.118.037885
13. Mancia G, Kreutz R, Brunström M, Burnier M, Grassi G, Januszewicz A, et al. 2023 ESH Guidelines for the management of arterial hypertension The Task Force for the management of arterial hypertension of the European Society of Hypertension: Endorsed by the International Society of Hypertension (ISH) and the European Renal Association (ERA). J Hypertens. (2023) 41:1874–2071. doi: 10.1097/hjh.0000000000003480
14. Schmitt L, Speckman J, Ansell J. Quality assessment of anticoagulation dose management: comparative evaluation of measures of time-in-therapeutic range. J Thromb Thrombol. (2003) 15:213–6. doi: 10.1023/b:Thro.0000011377.78585.63
15. Shrivastava AK, Singh HV, Raizada A, Singh SK. C-reactive protein, inflammation and coronary heart disease. Egypt Heart J. (2015) 67:89–97. doi: 10.1016/j.ehj.2014.11.005
16. Nakanishi N, Shiraishi T, Wada M. Association between fasting glucose and C-reactive protein in a Japanese population: the Minoh study. Diabetes Res Clin Pract. (2005) 69:88–98. doi: 10.1016/j.diabres.2004.11.009
17. Barzilay J, Freedland E. Inflammation and its association with glucose disorders and cardiovascular disease. Treat Endocrinol. (2003) 2:85–94. doi: 10.2165/00024677-200302020-00002
19. Griendling KK, FitzGerald GA. Oxidative stress and cardiovascular injury. Circulation. (2003) 108:2034–40. doi: 10.1161/01.CIR.0000093661.90582.c4
20. Son SM, Whalin MK, Harrison DG, Taylor WR, Griendling KK. Oxidative stress and diabetic vascular complications. Curr Diabetes Rep Aug. (2004) 4:247–52. doi: 10.1007/s11892-004-0075-8
Keywords: fasting blood glucose, time in range, diabetes, cardiovascular outcomes, legacy effect
Citation: Zhang J, Li L, Luo D, Huo Z, Zhang X, Xu Y, Jiang J, Liu T, Wu S and Huang Z (2024) Traditional versus intensive blood glucose control: long-term target range duration and cardiovascular disease risk and all-cause mortality - a real-world cohort study. Front. Endocrinol. 15:1449925. doi: 10.3389/fendo.2024.1449925
Received: 16 June 2024; Accepted: 22 November 2024;
Published: 10 December 2024.
Edited by:
Åke Sjöholm, Gävle Hospital, SwedenReviewed by:
Cosmin Mihai Vesa, University of Oradea, RomaniaLubia Velázquez López, Instituto Mexicano del Seguro Social, Mexico
Copyright © 2024 Zhang, Li, Luo, Huo, Zhang, Xu, Jiang, Liu, Wu and Huang. This is an open-access article distributed under the terms of the Creative Commons Attribution License (CC BY). The use, distribution or reproduction in other forums is permitted, provided the original author(s) and the copyright owner(s) are credited and that the original publication in this journal is cited, in accordance with accepted academic practice. No use, distribution or reproduction is permitted which does not comply with these terms.
*Correspondence: Shouling Wu, ZHJ3dXNsQDE2My5jb20=; Zhe Huang, aHVhbmd6aGVza3lAMTYzLmNvbQ==
 Jingdi Zhang
 Liuxin Li2,3
 Donglei Luo
 Shouling Wu