 Quanhui Liao
 Yongtai Chen†
94% of researchers rate our articles as excellent or good
Learn more about the work of our research integrity team to safeguard the quality of each article we publish.
Find out more
ORIGINAL RESEARCH article
Front. Endocrinol. , 11 July 2024
Sec. Clinical Diabetes
Volume 15 - 2024 | https://doi.org/10.3389/fendo.2024.1420999
Background: Globally, gallstones represented a prevalent condition of the digestive system, heavily affected by metabolic dysfunctions such as obesity, dyslipidemia, insulin resistance, and diabetes. The triglyceride-glucose (TyG) index served as an accessible novel indicator for evaluating insulin resistance, offering a precise reflection of metabolic conditions. However, no studies have yet explored their relationship. The link between the TyG and gallstone risk was the primary purpose of this study.
Methods: Utilized data from the public database, the National Health and Nutrition Examination Survey, for the years 2017-2020. The logit model was utilized to elucidate the connection between the TyG and the gallstones risk. The restricted cubic spline (RCS) analysis served to verify any non-linear relationships existing between them. Sensitivity analyses, encompassing both stratified and interaction analyses, were conducted to identify populations of particular interest and assess potential interactions between covariates and the TyG index.
Results: A total of 4544 individuals were included. The risk of gallstones in high group was 1.6 times that of the low group. The potential cut-off value for the TyG index was 6.19. Above this threshold, there was a 40% heightened risk of gallstones with each one-unit increment in the TyG. The RCS analysis revealed the absence of a non-linear association between them. The populations warranting particular focus included those over 60 years, non-White people, individuals with a body mass index ≥25, smokers, drinkers, those with hypertension, and diabetes. Apart from smoking history, alcohol consumption, and history of diabetes, there were no interactions between other variables and the TyG index.
Conclusion: The current study represented the inaugural investigation into the link between TyG index and the risk of gallstones. A positive correlation existed between them, signifying that an increase in TyG paralleled an elevated risk of gallstones. No non-linear relationship has been found between them. Besides, a 40% increase in gallstone risk accompanied each unit rise in TyG. Considering the convenience and accessibility of TyG in clinical settings, it has a promising potential for clinical application.
Gallstones were a widespread chronic disease of the digestive system found globally. The worldwide incidence of gallstones in adults ranged from 10 to 20% (1). Gallstones were primarily categorized as cholesterol stones, pigment stones, and mixed stones, where cholesterol and cholesterol-dominated mixed stones accounted for more than 80% of all stones (2). While typically asymptomatic, around 20% of individuals with gallstones would show symptoms including biliary pain or infections during their lifetime, with 1-2% facing severe complications. Such complications could include acute pancreatitis, acute obstructive purulent cholangitis, and gallbladder cancer (3, 4).
Earlier studies have identified demographic factors like age, gender, and race as risk factors for gallstones. The occurrence of gallstones grew with age, peaking after 50 for females and 60 for males. Females have a substantially higher risk of developing gallstones than males. Additionally, the prevalence of gallstones was elevated among Hispanic populations in Central and South America, average in Asians, and lowest among Africans (1, 5–7). Recent studies found that the development of cholesterol gallstones was deeply affected by metabolic disorders. Factors such as obesity, lipid abnormalities, insulin resistance, and diabetes contributed to this condition. For example, with every 5 unit increased in body mass index (BMI) or presence of diabetes, the risk of developing gallstones was 1.63 and 1.56 respectively (8, 9). Both insulin resistance and diabetes were distinct risk factors for the development of gallstones (10, 11). Although metabolic surgery, such as Roux-en-Y gastric-bypass lead to improvement of glycemic control and consequently cholelilthiasis reduction, the abrupt weight reduction has an opposite effect predisposing to gallbladder stones formation (12). In contrast to the less changeable demographic features, metabolic factors could be more easily altered through changes in one’s lifestyle.
The triglyceride-glucose (TyG) index was an accessible marker that merged fasting triglycerides and glucose for assessing insulin resistance (13). It accurately reflected an individual’s metabolic status. Relative to traditional insulin resistance markers like the intravenous glucose tolerance test, which was expensive and invasive (14), and the homeostasis model assessment of insulin resistance that has not yet gained broad clinical application (15), the TyG index was more accessible and cost-efficient. Prior research demonstrated a notable connection between the TyG and diseases like diabetes, cardiovascular disorders, and metabolic disorders (16–19). Considering that metabolic abnormalities profoundly affected gallstones, there might be an underlying link between the TyG and gallstones.
The main objective of the current research was to assess the connection between them according to a large dataset, the National Health and Nutrition Examination Survey (NHANES), encompassing the effect of continuous variations in the TyG index. Based on this, the study preliminarily identified the populations that required focused attention. This was intended to enable a more convenient and accurate evaluation of individual gallstone risks.
NHANES was a comprehensive, ongoing survey involving large samples, collecting clinical measurements, laboratory data, and questionnaire information to detail public health, nutrition, diseases, and risk factors. The process for inclusion and exclusion in the current study was thoroughly outlined in Figure 1. From the NHANES database, we selected the cohort from 2017 to 2020, comprising 23883 participants. Due to unclear information about gallstones, 9119 participants were excluded. A total of 8454 individuals were excluded because they lacked data on fasting triglycerides and glucose. 1766 individuals were excluded due to missing data on alanine aminotransferase (ALT), total cholesterol (TC), BMI, gender, age, race, smoking history, alcohol consumption, history of hypertension, or diabetes. In the end, 4544 individuals were included in the study. All participants were older than 20 years.
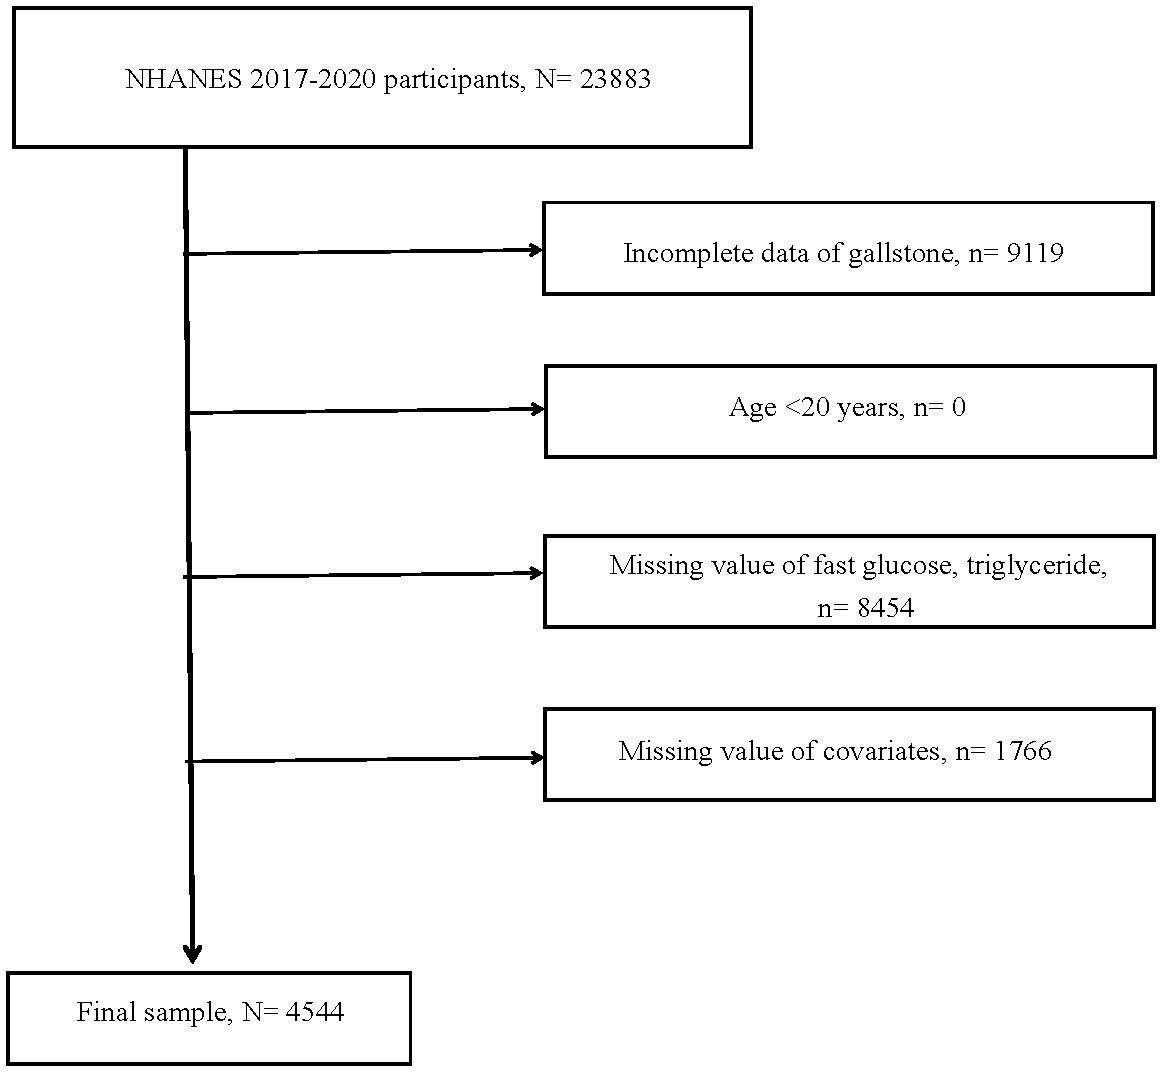
Figure 1 Flow chart of study. N, the number of individuals being included. n, the number of individuals being excluded.
Gallstones were determined based on the results of a standardized questionnaire. In other word, if a participant answered “yes” to the question “Have you ever been told you have gallstones?”, they were considered to have gallstones.
The TyG index, which was made up of fasting triglycerides and glucose, was calculated using the formula: Ln [fasting triglycerides (mg/dL) × fasting glucose (mg/dL)/2]. Participants were classified into three groups, each approximately comprising one-third of the total, according to the TyG index levels. Specially, low (6.19≤TyG ≤ 8.15, n=1515), moderate (8.15< TyG ≤ 8.75, n=1511), and high (8.75< TyG ≤ 11.94, n=1518).
From the NHANES database, we pulled a number of variables that could be linked to gallstone formation, encompassing history of hypertension or diabetes, smoking or alcohol status, ALT, and TC, BMI, gender, age, race. The definitions and categorizations of these variables were displayed in the Supplementary Methods.
This research was carried out in strict accordance with NHANES recommended practices. All analyses were based on weighted data. The Wilcoxon rank-sum test was employed to discern differences among continuous variables. The chi-squared test clarified differences among categorical variables. Multivariate logit analysis, a frequently used statistical method, was applied to analyze the connection between the TyG and the gallstones risk. Specifically, crude model, model1, and model2 were three crucial models in this research. The first model solely incorporated the TyG index. The second model added demographic characteristics such as age, gender, and race as adjusting factors. The last and most significant model not only included age, gender, and race but also incorporated BMI, smoking and drinking status, hypertension, diabetes, ALT, and TC for comprehensive adjustment. A noteworthy point was the exploration of a potential non-linear association between the TyG and gallstone risk in this study. The non-linear relationship was investigated using restricted cubic spline (RCS) analysis. Should a non-linear correlation be present, the inflection points would be further defined (using recursive algorithms), and threshold effects would be assessed (using segmented logit regression models). Moreover, to assist doctors in clinical settings in more effectively evaluating the dynamic effects of continuous changes in the TyG index on gallstone risk, additional analyses were conducted. The TyG index served as continuous variable for following analysis, without grouping based on its levels, to evaluate the effect of each unit change on gallstone risk. Sensitivity analysis, incorporating stratified analysis and interaction analysis, was employed to increase the robustness of this research. Stratified analyses, formulating based on factors such as age, gender, race, BMI, smoking and drinking habits, hypertension, diabetes, as well as ALT and TC levels. BMI was segmented into ≥25 and <25 categories. ALT was split into >40 and ≤40 groups. TC was categorized into >5.18 and ≤5.18 groups. From the stratified analysis, it was possible to identify dominant subgroups. Interaction analysis was employed to evaluate potential interactions among different covariates with the TyG index. All statistical analyses were completed using R4.3.1. When P-value was less than 0.05, it indicated statistical significance.
In total, 4544 individuals who met the criteria were incorporated into this study for further analysis. Participants were divided into low, moderate, and high groups, with 1515, 1511, and 1518 individuals respectively. The median TyG index values were 7.86, 8.46, and 9.12, while the mean values were 7.78, 8.45, and 9.24, respectively. Distinct characteristics were observed in the moderate and high groups compared to the low group. On one hand, some values or proportions were higher, including age, average values of TyG index, BMI, TC, and ALT, as well as the proportions of males, smokers, hypertension, and diabetes. On the other hand, the proportion of drinkers in the moderate and high groups was lower. There were no racial differences among the three groups (Table 1).
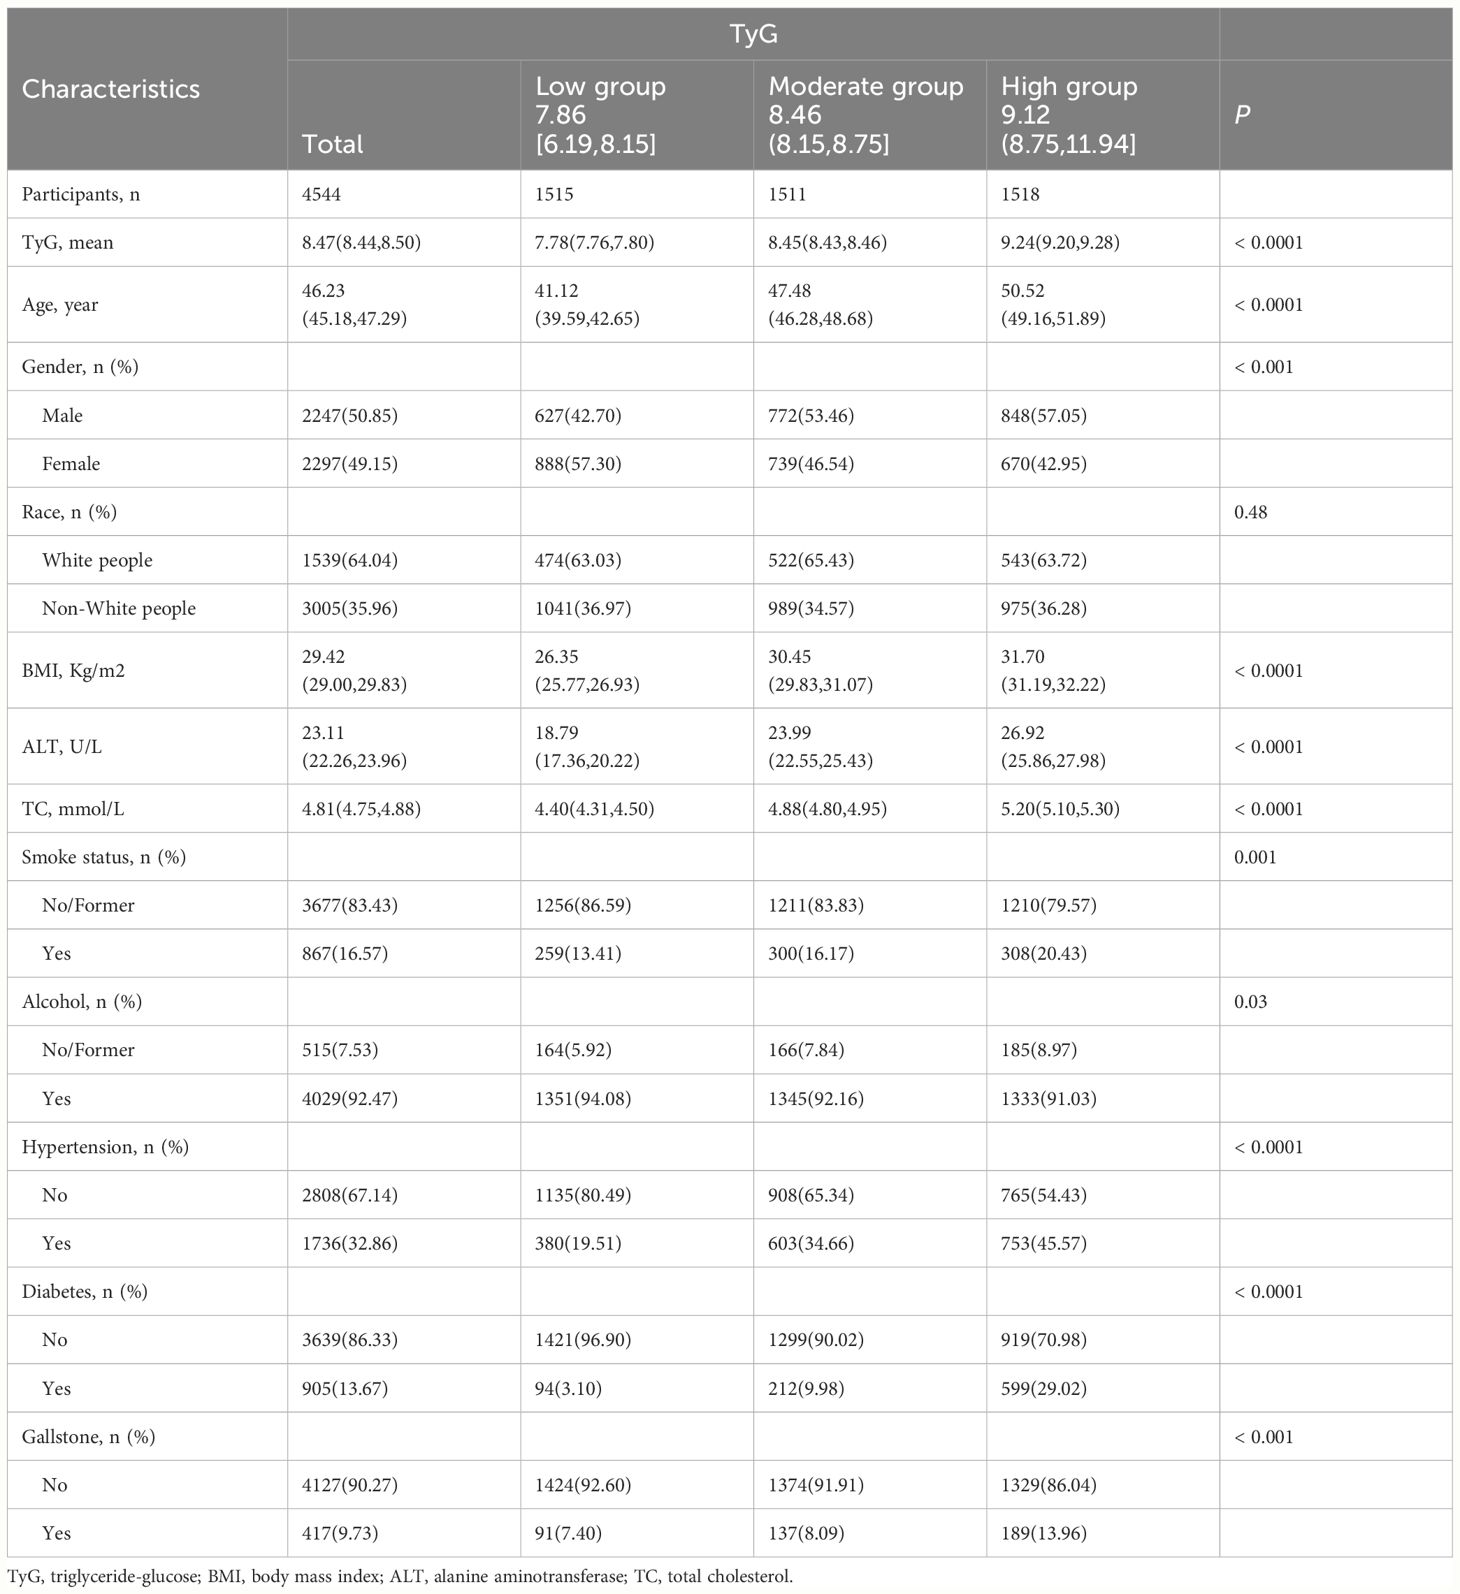
Table 1 Baseline characteristics of patients with gallstone in the NHANES 2017–2020 cohort.
Across the crude model to model2, the TyG index high group showed a significantly increased risk of gallstones, with odds ratio (OR) values being 2.03 (Ptrend <0.001), 2.06 (Ptrend <0.001), and 1.60 (Ptrend = 0.04) respectively. When the TyG was incorporated as a continuous variable in multivariate adjusted logit regression analysis, results implied that each unit increase in the TyG index raised the risk of gallstones by 44%, 57%, and 40%, respectively. Regardless of whether the TyG index was considered a categorical or continuous variable, the risk of gallstones increased with rising levels of the index (Table 2).
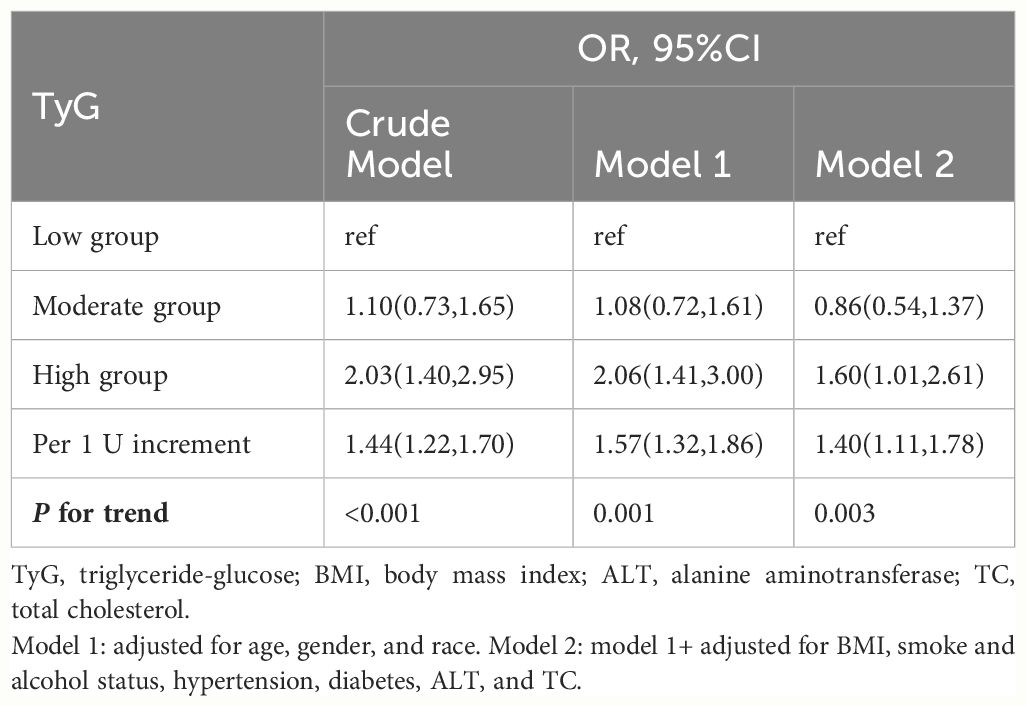
Table 2 Relationships of TyG with risk of gallstone from the NHANES 2017–2020 cohort.
According to Figure 2, non-linear association was not be found between the TyG and the risk of gallstones (Pnon-linear = 0.123). With the rise of the TyG index, gallstones risk initially elevated significantly, then the rate of increase moderately slowed (yet continued to rise). In general, the rise of the TyG index corresponded to a heightened risk of gallstones.
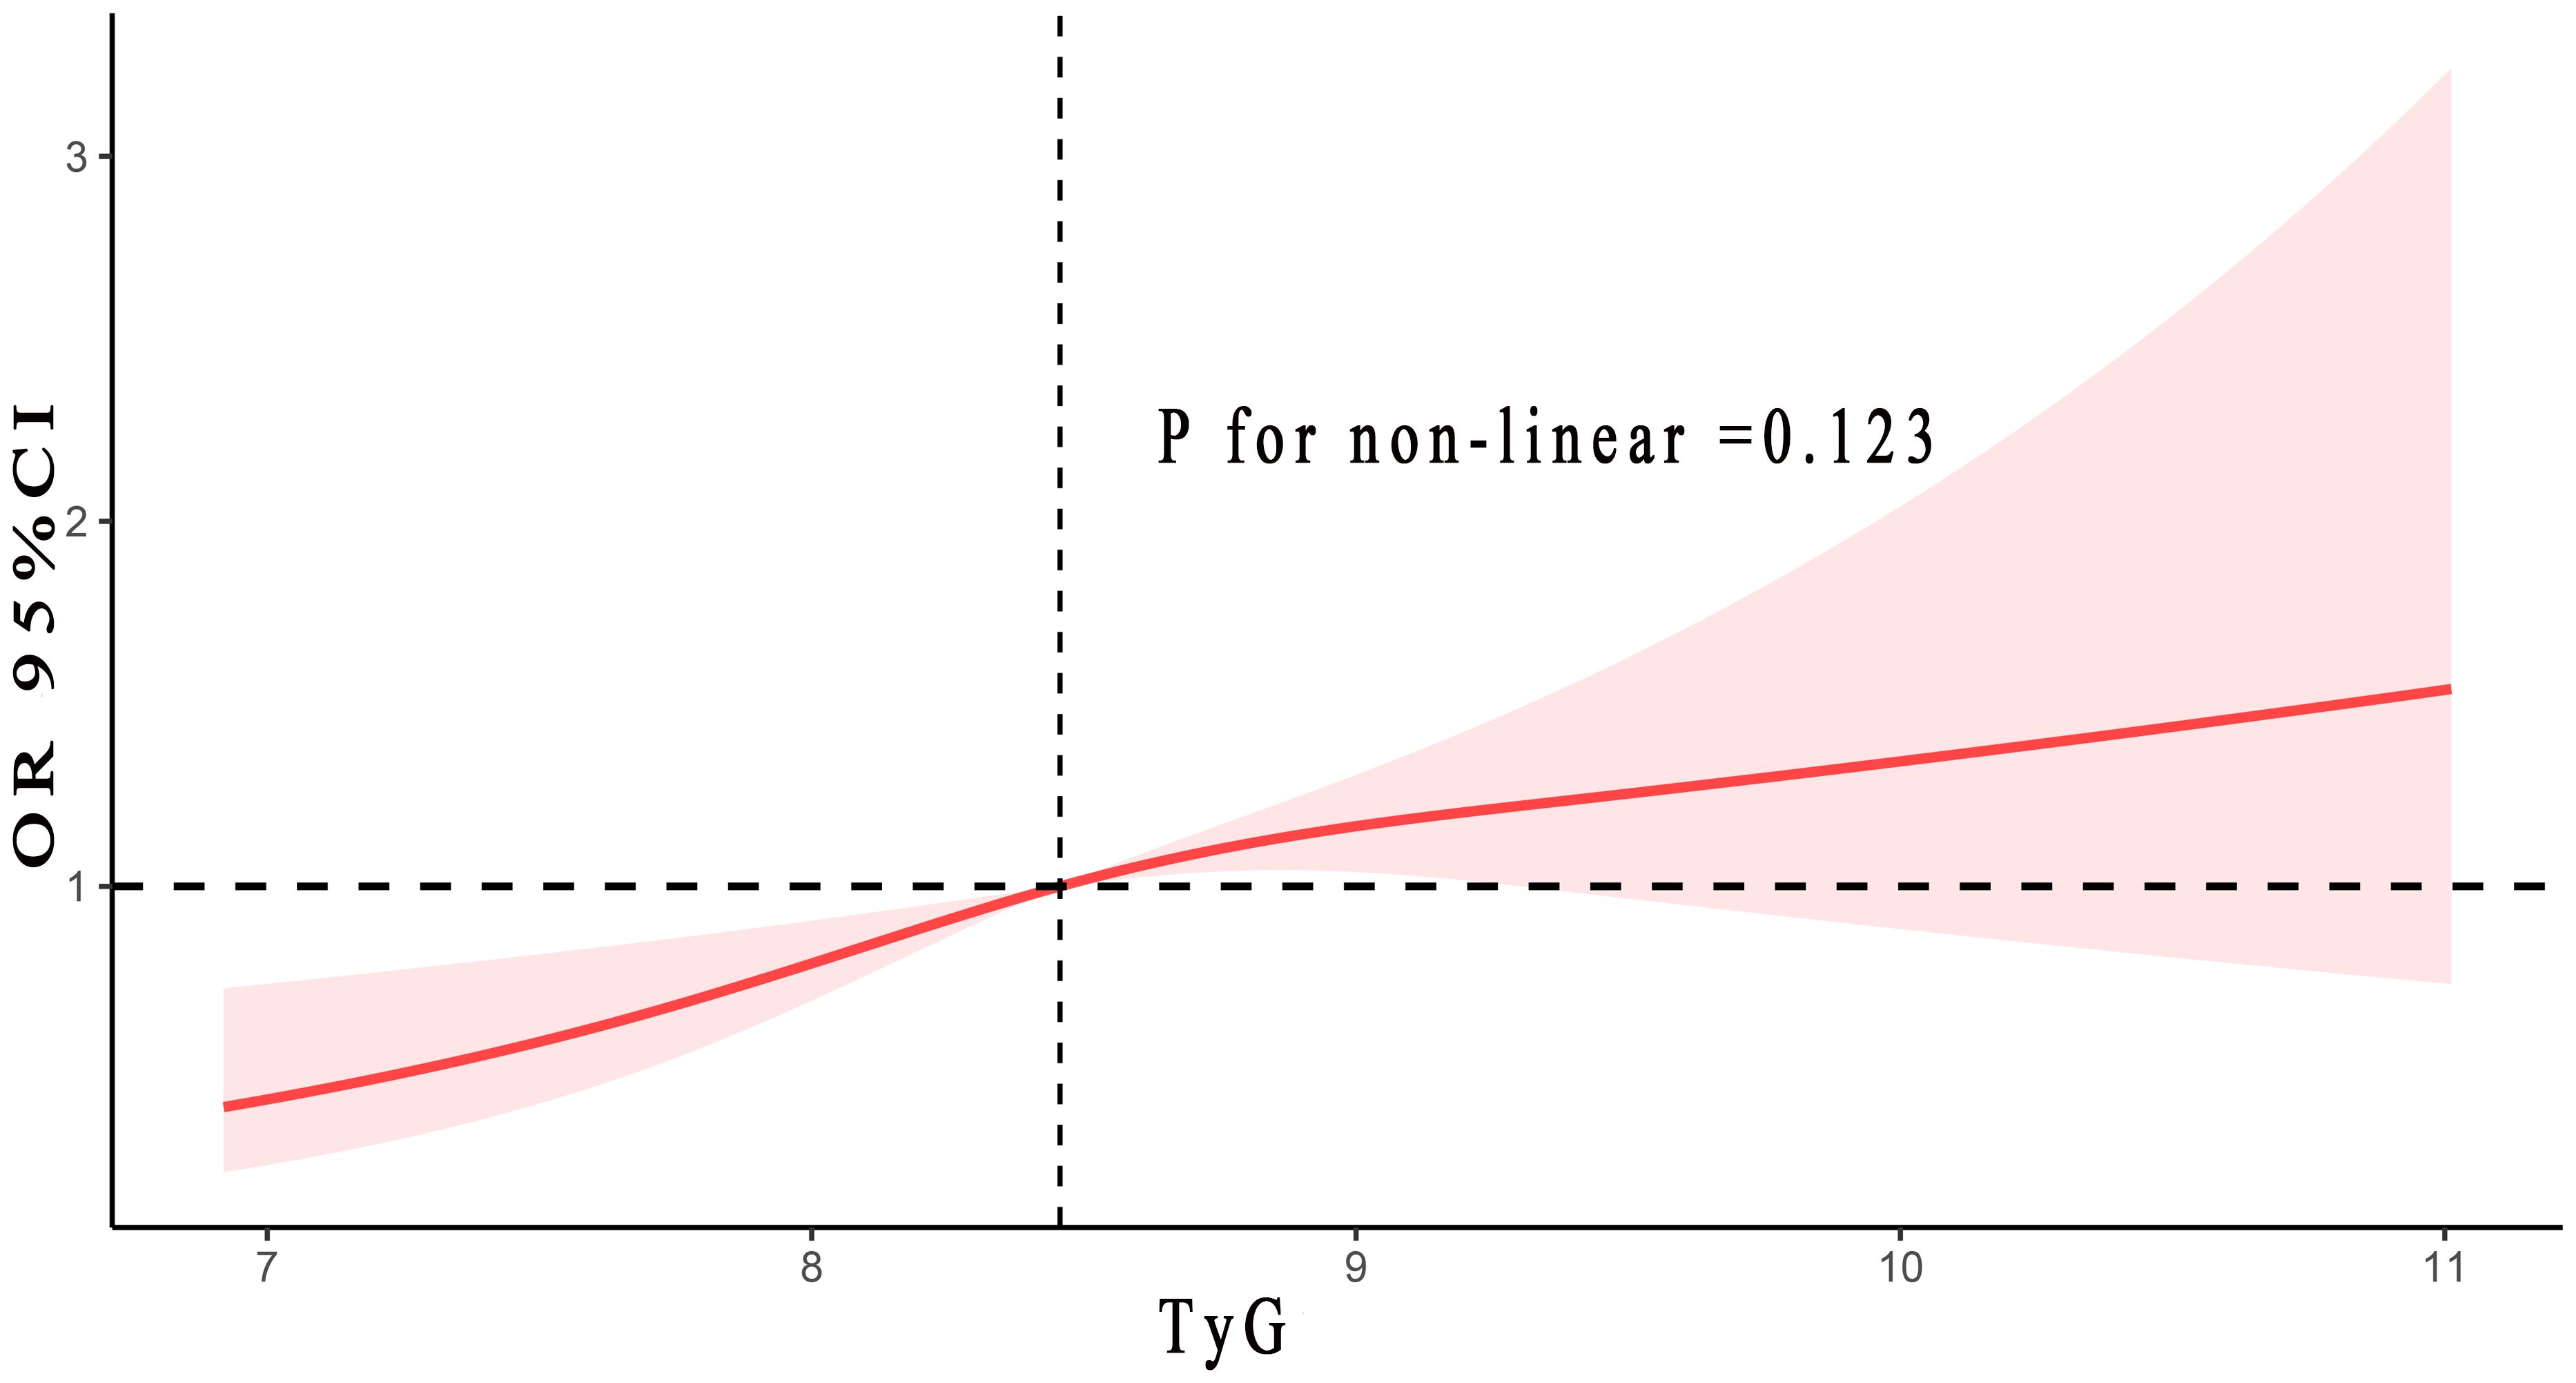
Figure 2 The correlation between TyG index and gallstones risk. Adjusted for age, gender, race, BMI, smoke and alcohol status, hypertension, diabetes, ALT and TC. TyG, triglyceride-glucose; BMI, body mass index; ALT, alanine aminotransferase; TC, total cholesterol.
The results of stratified analysis indicated that the following populations need particular focus: those aged over 60, non-White people, individuals with a BMI of ≥25, smokers, drinkers, and people with hypertension or diabetes. According to the interaction analysis, there were no interactions between the TyG index and any variables except for smoking and alcohol status, and diabetes history (Table 3).

Table 3 Stratified analyses of the relationships between TyG and risk of gallstone from the NHANES 2017–2020 cohort.
For the first time, this study demonstrated the relationship between the TyG index and gallstones, derived from a publicly available, representative large sample cohort. Finding indicated that a positive association between them, showing a 60% increase in gallstone risk with the rise of the TyG index. Furthermore, the potential critical threshold value for the TyG index was 6.19. Above this threshold, each unit increase in the TyG index resulted in a 40% higher risk of developing gallstones. For the first time, this study found that there was no non-linear relationship between them. Subgroup analysis suggested that populations needing particular attention included those aged over 60, non-White people, individuals with a BMI of ≥25, smokers, drinkers, and those with hypertension or diabetes. Interaction analysis results showed that, except for smoking and alcohol status, and diabetes history, there were no interactions between other variables and the TyG index, indicating that the study results were stable and reliable.
The formation of gallstones was triggered by elevated levels of cholesterol or bilirubin in the bile (20). Depending on their chemical composition and appearance, gallstones were mainly divided into two types: cholesterol gallstones and pigment gallstones. Of these, cholesterol gallstones are more common. Formation of cholesterol gallstones was caused by a failure in maintaining cholesterol homeostasis within the bile, with the key factor being the disturbance of physicochemical balance of cholesterol solubility (21). several factors, such as hepatic cholesterol hypersecretion, facilitating the crystallization of cholesterol and gallstone formation (1). Increasing research found that the formation of cholesterol gallstones was profoundly affected by metabolic abnormalities, incorporating obesity, abnormal blood lipids, insulin resistance, and diabetes. Insulin resistance and diabetes stood as independent risk factors for gallstone formation (10, 11). Gallstones became symptomatic in around 20%, presenting from biliary colic pain to the more complicated gallstone ileus, demonstrating the need for immediate diagnosis with convenient applied indices, such as TyG (22).
Insulin resistance, defined as diminished sensitivity and reactivity to insulin, was a key indicator of type 2 diabetes mellitus. Composed of fasting triglycerides and fasting blood glucose, the TyG index served as a comprehensive, novel index for the convenient assessment of insulin resistance, proving to be a superior alternative to the homeostasis model assessment of insulin resistance index (23, 24). Apart from diabetes, insulin resistance also served as a crucial marker for conditions such as obesity, hypertension, dyslipidemia, and other metabolic syndromes (25, 26). In these metabolic diseases, the TyG index served an important predictive function.
Our research indicated a positive connection between the TyG and gallstone risk, with gallstone risk increasing by 60% as the TyG index rose. A one-unit increment in the TyG index led to a 40% increase in the gallstones risk. The underlying reason might be that insulin resistance was not only associated with metabolic syndrome but also closely related to the occurrence of gallstones (4, 11, 27, 28). Prior studies have demonstrated that insulin resistance, through the dysregulation of the transcription factor FOXO1 in hepatocytes, induced ABCG5 and ABCG8, thus enhancing biliary cholesterol secretion and disrupting cholesterol homeostasis in the bile duct, leading to cholesterol gallstone formation (29). As the TyG index was a reliable indicator of insulin resistance, an increase in the TyG index signified heightened insulin resistance, potentially resulting in an increased risk of gallstones. On the other hand, the gut microbiota might also play a significant role in this process. Earlier studies revealed that individuals with gallstones have decreased levels of Lachnospiraceae and Bacteroidales and increased levels of Ruminococcaceae and Spirochaetae in their intestinal flora. Notably, an increase in the abundance of Spirochaetae led to elevated levels of bile acids in the feces (30, 31). A study on the gut microbiota and insulin resistance showed that individuals with a higher number of Bacteroidales have a lower degree of insulin resistance (32). Thus, it was evident that the gut microbiota was linked to both insulin resistance and gallstones. Given that the TyG index was a reliable measure of insulin resistance, an elevation in the TyG index reflected an increase in insulin resistance, leading to alterations in the gut microbiota, notably Bacteroidales, and consequently increased the risk of gallstones. Prospective clinical research with large samples was necessary to further corroborate our findings.
The strengths of this study included, first, that the data came from the large sample NHANES database, which was representative and readily accessible. The findings based on this data were reliable and credible. Furthermore, confounding factors were extensively controlled for using multivariate, stratified, and interaction analyses. Lastly, fasting triglycerides and blood glucose, which made up the TyG index, were extensively utilized in clinical settings and were conveniently obtainable, thus supporting their broad clinical application.
It was undeniable that this study has some limitations. One limitation, inherent to the observational nature of the current research, was the inability to precisely ascertain the causal correlation between the TyG index and gallstone risk. This also pointed to the necessity for future prospective research to determine causality based on large sample data. Additionally, there were still some unknown biases, despite efforts to minimize them using various statistical methods. Finally, the diagnosis of gallstones was confirmed through questionnaire results, which might introduce some bias into the findings of the article.
This was the first article to reveal a positive association between the TyG and gallstone risk, establishing an initial understanding of their relationship. This signified that as the TyG index progressively rose, gallstones risk enhanced accordingly. The potential cut-off value for the TyG index was 6.19. Above this threshold, every unit rise of the TyG was associated with a 40% higher risk of developing gallstones. Examining the continuous changes was essential in clinical settings because it aided doctors in more personalized assessments of individual risks for gallstones. Moreover, this study first demonstrated that non-linear relationship was not be found between the TyG and gallstones. Briefly, considering the convenience and ease of obtaining the TyG index in clinical practice, it held promising prospects for clinical application.
The original contributions presented in the study are included in the article/Supplementary Material. Further inquiries can be directed to the corresponding author.
The studies involving humans were approved by the Institutional Review Board at the Centers for Disease Control and Prevention. The studies were conducted in accordance with the local legislation and institutional requirements. The participants provided their written informed consent to participate in this study.
QL: Conceptualization, Formal analysis, Methodology, Software, Visualization, Writing – original draft. YC: Conceptualization, Formal analysis, Methodology, Software, Visualization, Writing – original draft. QP: Data curation, Methodology, Software, Writing – original draft. CL: Conceptualization, Project administration, Supervision, Validation, Writing – review & editing.
The author(s) declare that no financial support was received for the research, authorship, and/or publication of this article.
The authors declare that the research was conducted in the absence of any commercial or financial relationships that could be construed as a potential conflict of interest.
All claims expressed in this article are solely those of the authors and do not necessarily represent those of their affiliated organizations, or those of the publisher, the editors and the reviewers. Any product that may be evaluated in this article, or claim that may be made by its manufacturer, is not guaranteed or endorsed by the publisher.
The Supplementary Material for this article can be found online at: https://www.frontiersin.org/articles/10.3389/fendo.2024.1420999/full#supplementary-material
ALT, Aminotransferase; BMI, Body mass index; NHANES, National Health and Nutrition Examination Survey; OR, Odds ratio; RCS, Restricted cubic spline; TC, Total cholesterol; TyG, triglyceride-glucose.
1. Lammert F, Gurusamy K, Ko CW, Miquel J-F, Méndez-Sánchez N, Portincasa P, et al. Gallstones. Nat Rev Dis Primers. (2016) 2. doi: 10.1038/nrdp.2016.24
2. Du W, Wang Y, Song C, Tian Z, Liu Y, Shen W. Diabetes mellitus mediates the relationship between atherogenic index of plasma and gallstones: A population-based cross-sectional study. Diabetes Metab syndrome obesity: Targets Ther. (2024) 17:317–32. doi: 10.2147/DMSO.S449562
3. Zhang G, Ding Z, Yang J, Wang T, Tong L, Cheng J, et al. Higher visceral adiposity index was associated with an elevated prevalence of gallstones and an earlier age at first gallstone surgery in US adults: the results are based on a cross-sectional study. Front endocrinol. (2023) 14:1189553. doi: 10.3389/fendo.2023.1189553
4. Ke B, Sun Y, Dai X, Gui Y, Chen S. Relationship between weight-adjusted waist circumference index and prevalence of gallstones in U.S. adults: a study based on the NHANES 2017-2020. Front Endocrinol. (2023) 14:1276465. doi: 10.3389/fendo.2023.1276465
5. Stinton LM, Shaffer EA. Epidemiology of gallbladder disease: cholelithiasis and cancer. Gut liver. (2012) 6:172–87. doi: 10.5009/gnl.2012.6.2.172
6. Everhart JE, Yeh F, Lee ET, Hill MC, Fabsitz R, Howard BV, et al. Prevalence of gallbladder disease in American Indian populations: findings from the Strong Heart Study. Hepatol (Baltimore Md). (2002) 35:1507–12. doi: 10.1053/jhep.2002.33336
7. Figueiredo JC, Haiman C, Porcel J, Buxbaum J, Stram D, Tambe N, et al. Sex and ethnic/racial-specific risk factors for gallbladder disease. BMC gastroenterol. (2017) 17:153. doi: 10.1186/s12876-017-0678-6
8. Aune D, Norat T, Vatten LJ. Body mass index, abdominal fatness and the risk of gallbladder disease. Eur J Epidemiol. (2015) 30:1009–19. doi: 10.1007/s10654-015-0081-y
9. Aune D, Vatten LJ. Diabetes mellitus and the risk of gallbladder disease: A systematic review and meta-analysis of prospective studies. J Diabetes its complications. (2016) 30:368–73. doi: 10.1016/j.jdiacomp.2015.11.012
10. Weikert C, Weikert S, Schulze MB, Pischon T, Fritsche A, Bergmann MM, et al. Presence of gallstones or kidney stones and risk of type 2 diabetes. Am J Epidemiol. (2010) 171:447–54. doi: 10.1093/aje/kwp411
11. Nervi F, Miquel JF, Alvarez M, Ferreccio C, García-Zattera MJ, González R, et al. Gallbladder disease is associated with insulin resistance in a high risk Hispanic population. J hepatol. (2006) 45:299–305. doi: 10.1016/j.jhep.2006.01.026
12. Kehagias D, Lampropoulos C, Georgopoulos N, Habeos I, Kalavrizioti D, Vamvakas SS, et al. Diabetes remission after LRYGBP with and without fundus resection: a randomized clinical trial. Obes surg. (2023) 33:3373–82. doi: 10.1007/s11695-023-06857-z
13. Liu Q, Zhang Y, Chen S, Xiang H, Ouyang J, Liu H, et al. Association of the triglyceride-glucose index with all-cause and cardiovascular mortality in patients with cardiometabolic syndrome: a national cohort study. Cardiovasc diabetol. (2024) 23:80. doi: 10.1186/s12933-024-02152-y
14. Park SE, Park CY, Sweeney G. Biomarkers of insulin sensitivity and insulin resistance: Past, present and future. Crit Rev Clin Lab Sci. (2015) 52:180–90. doi: 10.3109/10408363.2015.1023429
15. Wallace TM, Levy JC, Matthews DR. Use and abuse of HOMA modeling. Diabetes Care. (2004) 27:1487–95. doi: 10.2337/diacare.27.6.1487
16. Yao Y, Wang B, Geng T, Chen J, Chen W, Li L. The association between TyG and all-cause/non-cardiovascular mortality in general patients with type 2 diabetes mellitus is modified by age: results from the cohort study of NHANES 1999-2018. Cardiovasc diabetol. (2024) 23:43. doi: 10.1186/s12933-024-02120-6
17. Wang R, Chen C, Xu G, Jin Z. Association of triglyceride glucose-body mass index and hemoglobin glycation index with heart failure prevalence in hypertensive populations: a study across different glucose metabolism status. Lipids Health disease. (2024) 23:53. doi: 10.1186/s12944-024-02045-9
18. Tao LC, Xu JN, Wang TT, Hua F, Li JJ. Triglyceride-glucose index as a marker in cardiovascular diseases: landscape and limitations. Cardiovasc diabetol. (2022) 21:68. doi: 10.1186/s12933-022-01511-x
19. Zhang L, Zeng L. Non-linear association of triglyceride-glucose index with prevalence of prediabetes and diabetes: a cross-sectional study. Front endocrinol. (2023) 14:1295641. doi: 10.3389/fendo.2023.1295641
20. Everhart JE, Ruhl CE. Burden of digestive diseases in the United States Part III: Liver, biliary tract, and pancreas. Gastroenterology. (2009) 136:1134–44. doi: 10.1053/j.gastro.2009.02.038
21. Lyons MA, Wittenburg H. Cholesterol gallstone susceptibility loci: a mouse map, candidate gene evaluation, and guide to human LITH genes. Gastroenterology. (2006) 131:1943–70. doi: 10.1053/j.gastro.2006.10.024
22. Mulita F, Tchabashvili L, Bousis D, Kehagias D, Kaplanis C, Liolis E, et al. Gallstone ileus: A rare cause of small intestine obstruction. Clin Case Rep. (2021) 9:e04924. doi: 10.1002/ccr3.4924
23. Simental-Mendía LE, Rodríguez-Morán M, Guerrero-Romero F. The product of fasting glucose and triglycerides as surrogate for identifying insulin resistance in apparently healthy subjects. Metab syndrome related Disord. (2008) 6:299–304. doi: 10.1089/met.2008.0034
24. Lee SH, Kwon HS, Park YM, Ha HS, Jeong SH, Yang HK, et al. Predicting the development of diabetes using the product of triglycerides and glucose: the Chungju Metabolic Disease Cohort (CMC) study. PloS One. (2014) 9:e90430. doi: 10.1371/journal.pone.0090430
25. Khan SH, Sobia F, Niazi NK, Manzoor SM, Fazal N, Ahmad F. Metabolic clustering of risk factors: evaluation of Triglyceride-glucose index (TyG index) for evaluation of insulin resistance. Diabetol Metab syndrome. (2018) 10:74. doi: 10.1186/s13098-018-0376-8
26. Moon S, Park JS, Ahn Y. The cut-off values of triglycerides and glucose index for metabolic syndrome in American and Korean adolescents. J Korean Med science. (2017) 32:427–33. doi: 10.3346/jkms.2017.32.3.427
27. Miyasaka K, Kanai S, Ohta M, Sekime A, Akimoto S, Takiguchi S, et al. Susceptibility to obesity and gallbladder stasis produced by a protein- and fat-enriched diet in male mice compared with female mice. Nutr Metab. (2007) 4:14. doi: 10.1186/1743-7075-4-14
28. Wang J, Yang J, Chen Y, Rui J, Xu M, Chen M. Association of METS-IR index with prevalence of gallbladder stones and the age at the first gallbladder stone surgery in US adults: A cross-sectional study. Front Endocrinol. (2022) 13. doi: 10.3389/fendo.2022.1025854
29. Biddinger SB, Haas JT, Yu BB, Bezy O, Jing E, Zhang W, et al. Hepatic insulin resistance directly promotes formation of cholesterol gallstones. Nat Med. (2008) 14:778–82. doi: 10.1038/nm1785
30. Wang Q, Jiao L, He C, Sun H, Cai Q, Han T, et al. Alteration of gut microbiota in association with cholesterol gallstone formation in mice. BMC gastroenterol. (2017) 17:74. doi: 10.1186/s12876-017-0629-2
31. Keren N, Konikoff FM, Paitan Y, Gabay G, Reshef L, Naftali T, et al. Interactions between the intestinal microbiota and bile acids in gallstones patients. Environ Microbiol Rep. (2015) 7:874–80. doi: 10.1111/1758-2229.12319
Keywords: Triglyceride-glucose index, gallstones, National Health and Nutrition Examination Survey, risk, insulin resistance
Citation: Liao Q, Chen Y, Peng Q and Li C (2024) Relationship between triglyceride-glucose index and gallstones risk: a population-based study. Front. Endocrinol. 15:1420999. doi: 10.3389/fendo.2024.1420999
Received: 21 April 2024; Accepted: 28 June 2024;
Published: 11 July 2024.
Edited by:
Francesk Mulita, General University Hospital of Patras, GreeceReviewed by:
Angelis Peteinaris, University of Patras, GreeceCopyright © 2024 Liao, Chen, Peng and Li. This is an open-access article distributed under the terms of the Creative Commons Attribution License (CC BY). The use, distribution or reproduction in other forums is permitted, provided the original author(s) and the copyright owner(s) are credited and that the original publication in this journal is cited, in accordance with accepted academic practice. No use, distribution or reproduction is permitted which does not comply with these terms.
*Correspondence: Chunying Li, TENZMTM1OTkzMjY5OTJAc2luYS5jb20=
†These authors have contributed equally to this work and share first authorship
Disclaimer: All claims expressed in this article are solely those of the authors and do not necessarily represent those of their affiliated organizations, or those of the publisher, the editors and the reviewers. Any product that may be evaluated in this article or claim that may be made by its manufacturer is not guaranteed or endorsed by the publisher.
Research integrity at Frontiers
Learn more about the work of our research integrity team to safeguard the quality of each article we publish.