 Zhanbin Li
 Qiaoran Liu
 Zhenyu Yao
- 1Department of Endocrinology, Shandong Provincial Hospital, Shandong University; Key Laboratory of Endocrine Glucose & Lipids Metabolism and Brain Aging, Ministry of Education, Jinan, Shandong, China
- 2Shandong Clinical Research Center of Diabetes and Metabolic Diseases, Jinan, Shandong, China
- 3Shandong Institute of Endocrine and Metabolic Diseases, Jinan, Shandong, China
- 4“Chuangxin China” Innovation Base of Stem Cell and Gene Therapy for Endocrine Metabolic Diseases, Jinan, Shandong, China
- 5Shandong Engineering Laboratory of Prevention and Control for Endocrine and Metabolic Diseases, Jinan, Shandong, China
- 6Shandong Engineering Research Center of Stem Cell and Gene Therapy for Endocrine and Metabolic Diseases, Jinan, Shandong, China
- 7Department of Breast Surgery, Shandong Provincial Qianfoshan Hospital, Shandong University, Jinan, Shandong, China
Objective: The exact relationship between the serum uric acid-to-HDL cholesterol ratio (UHR) and mortality rates remains enigmatic among American adults. This study aims to clarify the association between UHR and both all-cause and cardiovascular disease (CVD) mortality in US adults.
Methods: This study enrolled 48054 patients from the National Health and Nutrition Examination Survey (NHANES). Mortality outcomes were determined by linking to National Death Index (NDI) records up to December 31,2019. Multivariate Cox proportional hazards models were constructed to analyze explore the associations between UHR and mortality. Dose-response relationships were explored using restricted cubic splines, and stratified analyses were conducted based on gender, age, race, education, PIR, smoking status, alcohol intake, physical activity, BMI, diabetes and hypertension.
Results: During the follow-up period, the overall mortality for all-cause and CVD was 10.9% and 2.7%, respectively. The adjusted HRs in the highest quintile were 1.16 (95% CI: 1.05, 1.29) for all-cause mortality and 1.2 (95% CI: 1, 1.45) for CVD mortality. In diabetes, obese, and CVD subgroups, significantly elevated adjusted HRs were observed for both all-cause and CVD mortality. Specifically, diabetes patients had adjusted HRs of 1.32 (95% CI: 1.11, 1.57) and 1.38 (95% CI: 1.01, 1.90), obese individuals had HRs of 1.32 (95% CI: 1.10, 1.58) and 1.55 (95% CI: 1.06, 2.28), and CVD patients had HRs of 1.29 (95% CI: 1.10, 1.50) and 1.38 (95% CI: 1.06, 1.79), respectively. A non-linear relationship between UHR and mortality was identified, with critical thresholds of 12.4 for all-cause mortality and 10.7 for CVD mortality in the general population. Significant interactions were observed between UHR and stratified variables, including gender, BMI, education, smoking, alcohol use, and hypertension for all-cause mortality, while significant interactions were observed based on gender, smoking, and alcohol intake for CVD mortality. Comparable trends were also observed in patient with diabetes, obese and CVD.
Conclusions: In this cohort study, we provide novel insights into the association between serum UHR concentrations and mortality in the general population. UHR is a strong predictor of all-cause and cardiovascular mortality in the general population.
Background
Cardiovascular disease (CVD), the foremost cause of mortality globally, remains a formidable barrier to public health (1, 2). Despite remarkable treatment breakthroughs, patients with CVD still grapple with persistent recurrences (3), maintaining a stubbornly high mortality rate (1). Unraveling the prognostic factors for CVD patients offers a promising avenue to significantly reduce the global mortality burden, particularly cardiovascular mortality. Ideally, prognostic factors should be independently identifiable, cost-effective, and seamlessly integrated into clinical practice for enhanced prognostic precision and patient care.
In clinical practice, serum uric acid (UA) (4–9) and high-density lipoprotein cholesterol (HDL-C) (10–12) have been linked to cardiovascular disease (CVD) and adverse events. However, comorbidities affecting renal excretion and lipid metabolism limit their predictive accuracy (13–15). This underscores the importance of a more comprehensive, multifaceted evaluation. In this context, the serum uric acid-to-HDL-cholesterol ratio (UHR) emerges as a promising marker. Studies show a strong correlation between UHR and CVD, including atherosclerosis (16), ischemic heart disease (17–20), hypertension (21), acute myocardial infarction (22), coronary artery disease (CAD) (23, 24) and acute coronary syndrome (18). More importantly, studies have shown that the UHR predicts the onset of coronary artery disease better than UA or HDL-C alone in patients with chronic kidney disease (23). Additionally, UHR is correlated with CVD risk factors, including insulin resistance (25, 26), visceral fat accumulation (27, 28), and is also associated with metabolic diseases such as diabetes (29–31), metabolic syndrome (32), metabolism dysfunction-associated fatty liver disease (33–36), chronic kidney disease (37), Hashimoto’s thyroiditis (38). UHR’s broad correlation with these factors and conditions underscores its value in CVD risk assessment, integrating several key risk indicators.
Despite the remarkable potential of the UHR in forecasting CVD, investigations into its correlation with adverse cardiovascular outcomes, notably CVD mortality, are still limited. To date, there is only one study that has identified UHR as a predictive factor for cardiovascular mortality in patients undergoing peritoneal dialysis (39). The question of whether UHR can similarly predict cardiovascular mortality in the general population and among specific subgroups remains elusive. Therefore, our study endeavors to bridge this knowledge gap by examining the influence of UHR on mortality and elucidating the dose-response relationship, utilizing data from the National Health and Nutrition Examination Survey (NHANES) across diverse American populations.
Methods
Study population and design
NHANES, a comprehensive, multistage survey conducted by the U.S. Centers for Disease Control and Prevention’s National Center for Health Statistics, collects demographic, socioeconomic, dietary, physiological, and laboratory data through interviews and medical exams. NHANES has received ethical approval from the CDC’s research ethics review board [NHANES 1999-2004: Protocol #98-12; NHANES 2005-2010; Protocol #2005-06; NHANES 2011-2018: Protocol #2011-17, #2018-01 (Effective beginning October 26, 2017)7]. NHANES ensures participant rights protection through informed written consent. Datasets from NHANES, including those used in our study, are publicly accessible on the official NHANES website (https://www.cdc.gov/nchs/nhanes/index.html).
Criteria for subgroup division are as follows: diabetes, defined by the American Diabetes Association (ADA), includes self-reported diagnosis, insulin/oral hypoglycemic use, fasting blood glucose ≥ 126 mg/dL, or HbA1c ≥ 6.5% (40). BMI is calculated as weight divided by height squared, with obesity defined as BMI ≥ 30 kg/m² (41), and CVD diagnosis is determined through self-reported physician diagnoses during interviews using a standardized questionnaire on CHF/CHD/angina pectoris/MI/stroke, with affirmative answers indicating the presence of CVD.
Patients were excluded if they met any of the following criteria: 1) age < 20 years; 2) missing death status information; 3) incomplete data on UA levels and HDL-C values; or 4) missing covariant data. A final cohort of 48,054 patients from NHANES 1999–2018 was included in the study (Figure 1).
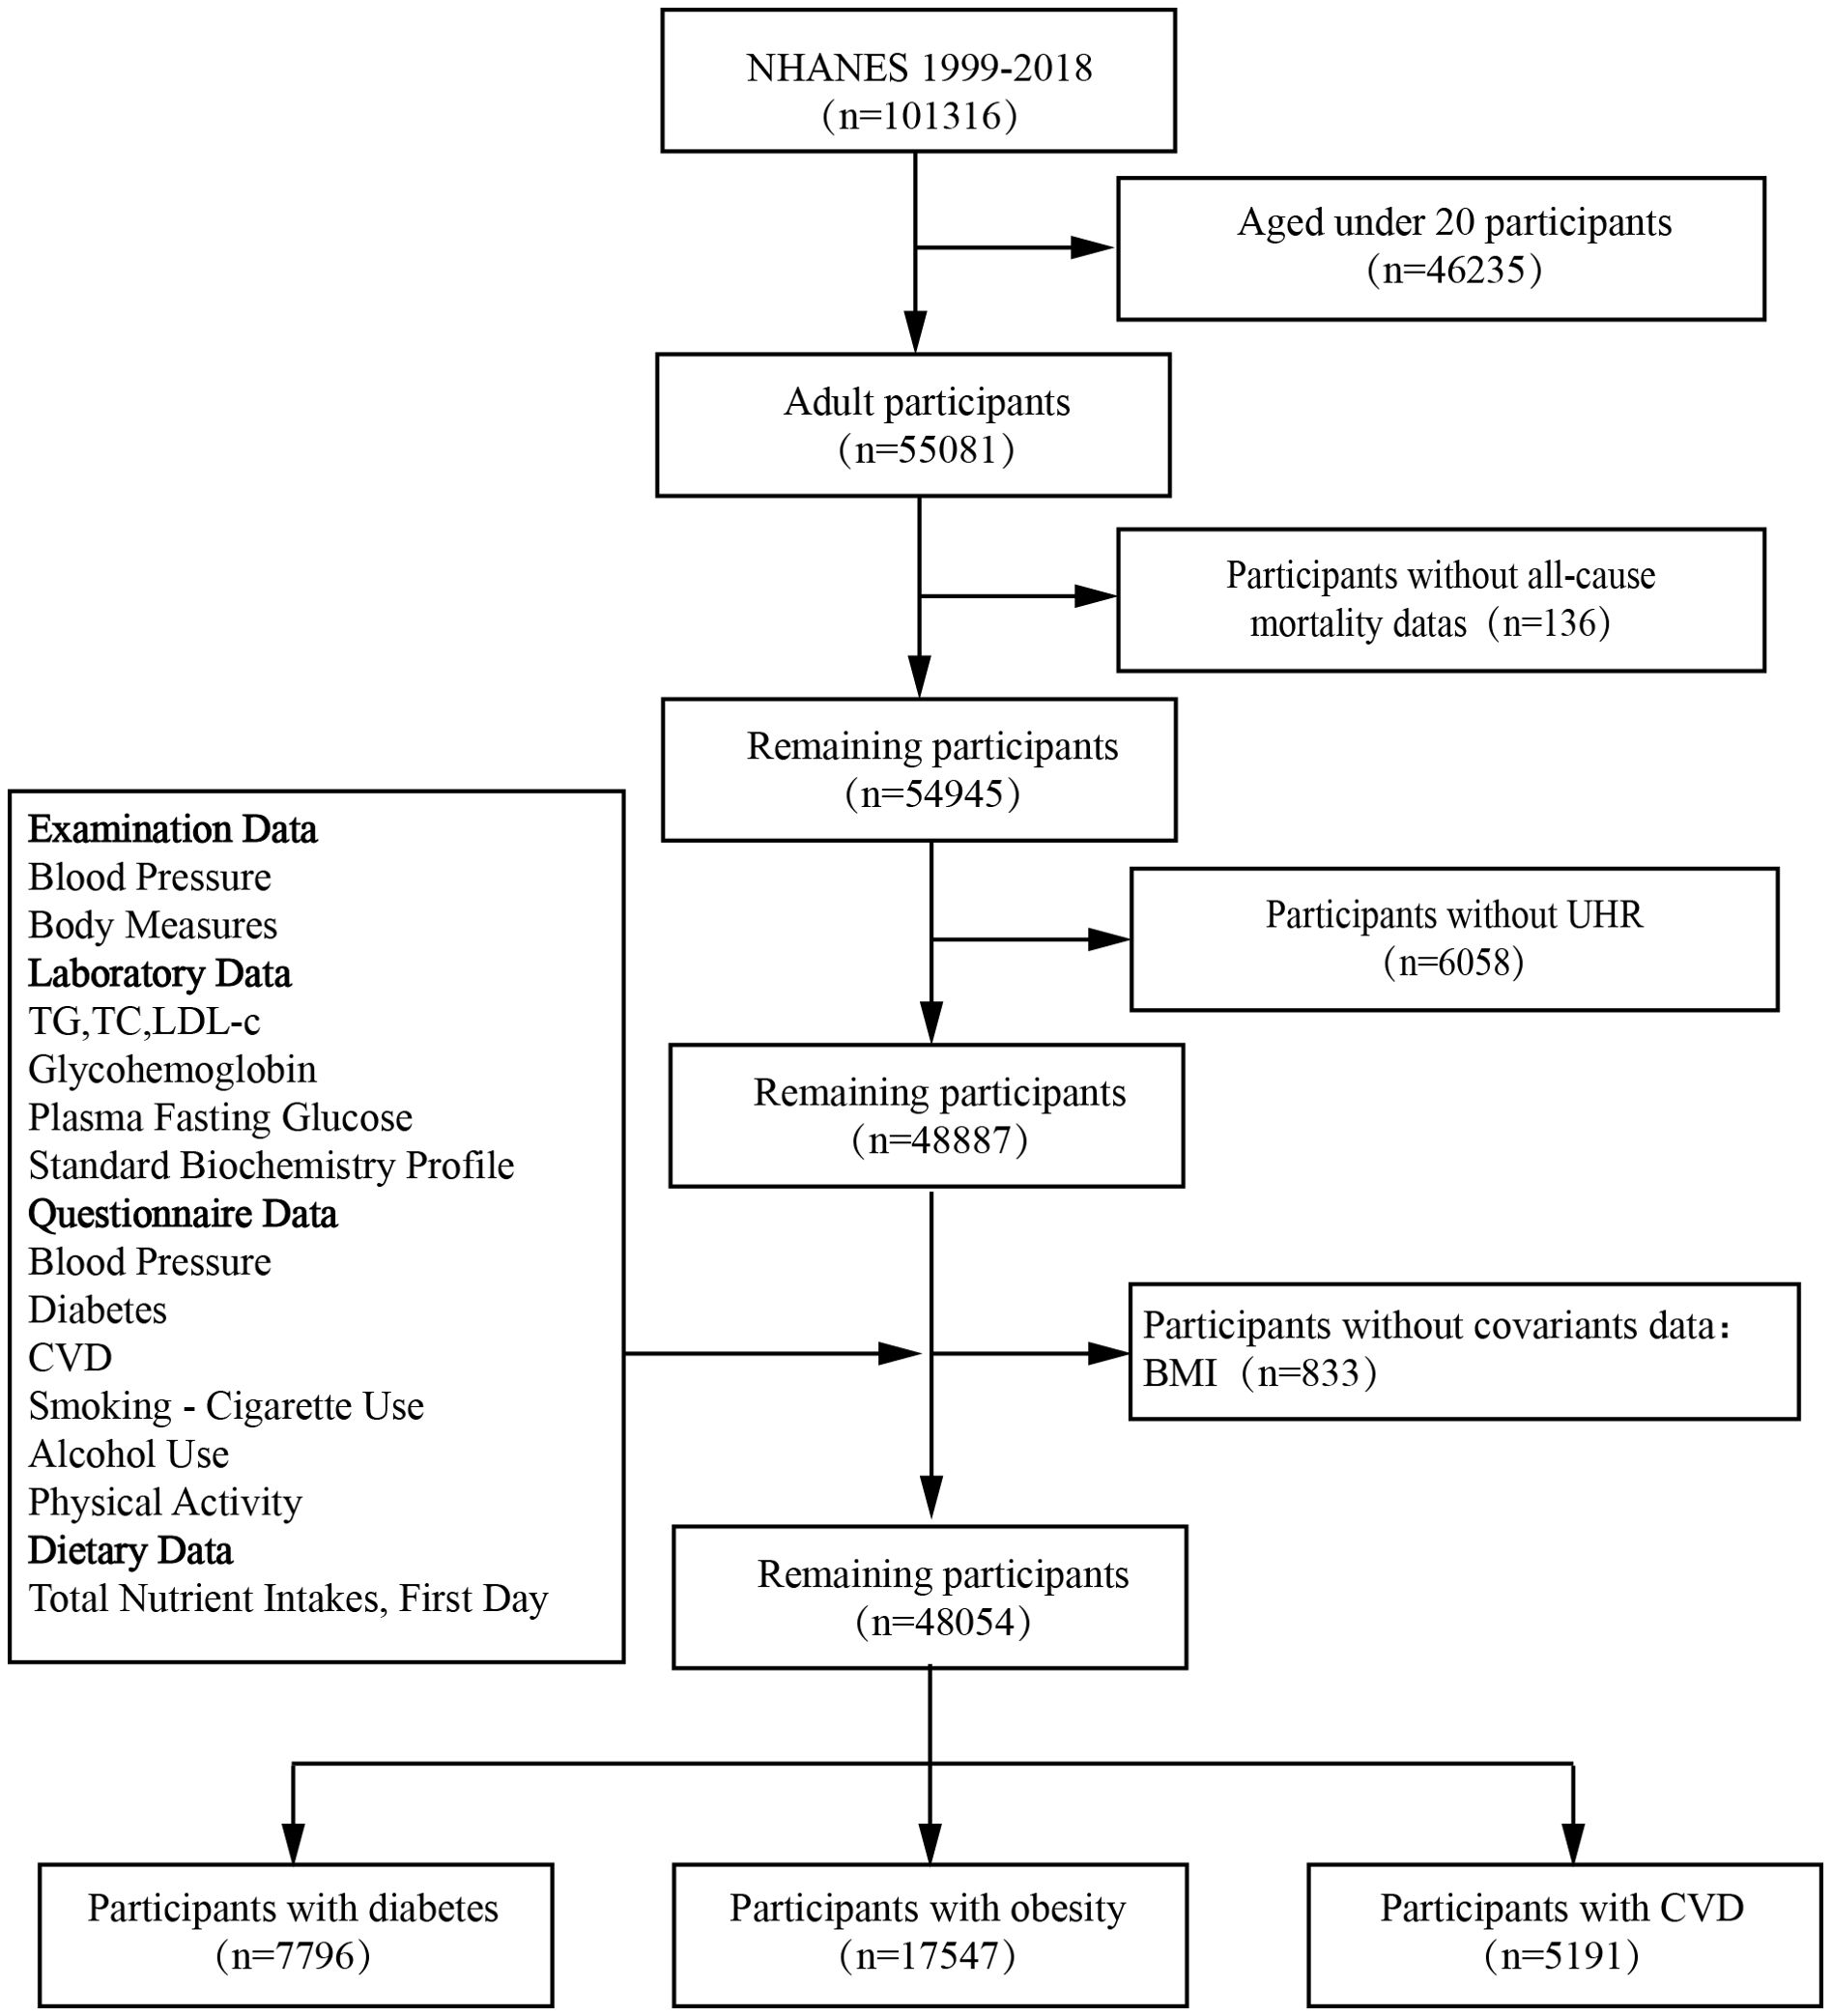
Figure 1. The selection flowchart of the participants.
Assessment of UHR
The exposure variable was the UHR, calculated as serum UA divided by HDL- C. UA measurements were performed using various multichannel analyzers across NHANES cycles (Hitachi Model 704, Beckman Synchron LX20, Beckman UniCel DxC800 Synchron, and Roche Cobas 6000). Fasting serum HDL- C concentrations were measured using the ARCHITECT auto-analyzer and Abbott reagent kits. Participants were categorized into four groups (Q1-Q4) based on UHR quartiles, with Q1 serving as the reference group.
Outcome ascertainment
The primary endpoint was all-cause mortality, with CVD-specific mortality as a secondary outcome. Mortality status was determined using the NHANES Public-Use Linked Mortality File, updated until December 31, 2019 (https://www.cdc.gov/nchs/data-linkage/mortality-public.htm), which linked to the NDI data with a probabilistic matching algorithm to determine mortality status (42). The disease-specific mortality data in the NDI have been identified according to the International Statistical Classification of Diseases, 10th Revision (ICD-10), with only a relatively slight possibility of misclassification. Specific mortality was defined as death due to heart diseases (054–064), malignant neoplasms (019–043), and all other causes (010) for our study (43). Follow-up time for each person was calculated as the difference between the baseline examination date and the last known date alive or censored from the mortality file.
Assessment of covariates
Confounding factors potentially associated with mortality were enrolled in this analysis. Information on age, sex, race or ethnicity, education level, and family income was collected from the demographic data. Race was categorized as Mexican American, non-Hispanic White, non-Hispanic Black, or other race, while education level was grouped as less than high school, high school or equivalent, or college or above. Family economic status was determined by income to poverty ratio (PIR), with three categories: < 1.30, 1.31 to 3.50, and ≥ 3.50 (44).
Smoking status, alcoholic intake, and physical activity were assessed via standardized questionnaires. Participants were categorized into nonsmokers, former smokers, and current smokers based on smoking history and habits. Alcohol consumption was determined using a 24-hour dietary recall, classifying individuals as nondrinkers, moderate drinkers (0.1-27.9 g/day for men, 0.1-13.9 g/day for women), or heavy drinkers (≥ 28 g/day for men, ≥ 14 g/day for women). Physical activity was divided into inactive, active (meeting recommended levels), and insufficiently active categories based on previous literature (45).
Clinical indicators such as alanine aminotransferase (ALT), aspartate aminotransferase (AST), blood urea nitrogen (BUN), serum creatinine (Scr), gamma-glutamyltransferase(GGT), lactate dehydrogenase (LDH), total bilirubin (Tbil), fasting blood glucose (FBG), glycosylated hemoglobin A1c (HbA1c), triglycerides (TG), total cholesterol (TC), low-density lipoprotein cholesterol (LDL-C), and HDL-C were measured in the NHANES laboratory following the relevant standardized protocols. The estimated glomerular filtration rate (eGFR) was calculated using the Chronic Kidney Disease Epidemiology Collaboration Equation (46).
Hypertension was defined as having a history of hypertension, systolic blood pressure ≥ 130 mmHg, or diastolic blood pressure ≥ 80 mmHg, according to the 2017 American College of Cardiology and American Heart Association hypertension guidelines.
Statistical analysis
The statistical analysis was performed by using R software (version 4.3.1; https://www.r-project.org). Given the complicated sampling design, NHANES weights and strata variables were considered when calculating statistics (47). Data categorized into continuous (mean ± SD) and categorical (percentages) variables. Statistical analysis of continuous variables employed Student’s t-test or Mann–Whitney U test, depending on data distribution. Categorical variables were compared using chi-square test. Obesity phenotype stratified, baseline characteristics compared using one-way ANOVA.
Study participants were divided into four quartiles (Q1-Q4) of UHR. Baseline characteristics were compared across quartiles using ANOVA and chi-square tests. Incidence rates of all-cause and CVD mortality were computed for each quartile during follow-up.
To evaluate the independent predictive value of the UHR, we developed multivariate weighted Cox proportional hazards regression models with three models to control for confounding factors. Model 1 was unadjusted, Model 2 was adjusted for age, race, and gender, and Model 3 was adjusted for age, gender, race, education level, family income level, BMI, smoking status, alcohol intake, diabetes and hypertension. We utilized the restricted cubic spline (RCS) model to graphically represent the dose-response relationship between UHR levels and both all-cause and CVD mortality.
Stratified analyses were performed in the strata of age (< 30,30-40,40-50 or ≥ 50 years old), sex (male or female), race or ethnicity (White, Black, Mexican, or Other), education level (less than high school, high school or equivalent, or college or above), family income level(<1.30, 1.31 to 3.50, and ≥ 3.50), smoking status (current smoker, former smoker or nonsmoker), alcohol intake (heavy drinking, moderate drinking or nondrinking), physical activity(active, insufficiently or active), BMI (< 25 or 25-30, ≥ 30 kg/m2), diabetes and hypertension. A P-value of less than 0.05 was considered statistically significant.
Results
Baseline characteristics of study participants
Table 1 outlines the baseline characteristics of 48,054 participants stratified by UHR quartiles. The average age of the participants was 46.99 ± 16.85 years, and 51.8% of them were women. During a mean follow-up of 8.05 ± 5.17 years, the mortality of all-cause, CVD and malignant neoplasms were 10.9%, 2.7% and 2.5%, respectively. Average UHR in the enrolled patients was 5.4 ± 1.42. Participants with higher UHR level tended to be older, male, obese, and had a higher prevalence of comorbidities. They exhibited significantly higher all-cause and CVD mortality rates. Among all subjects, there were 7796 patients with diabetes, 17547 patients with obesity, and 5191 patients with CVD. Detailed characteristics of patients with diabetes, obesity and CVD are provided in Supplementary Tables 1–3 of the Supplementary Material.
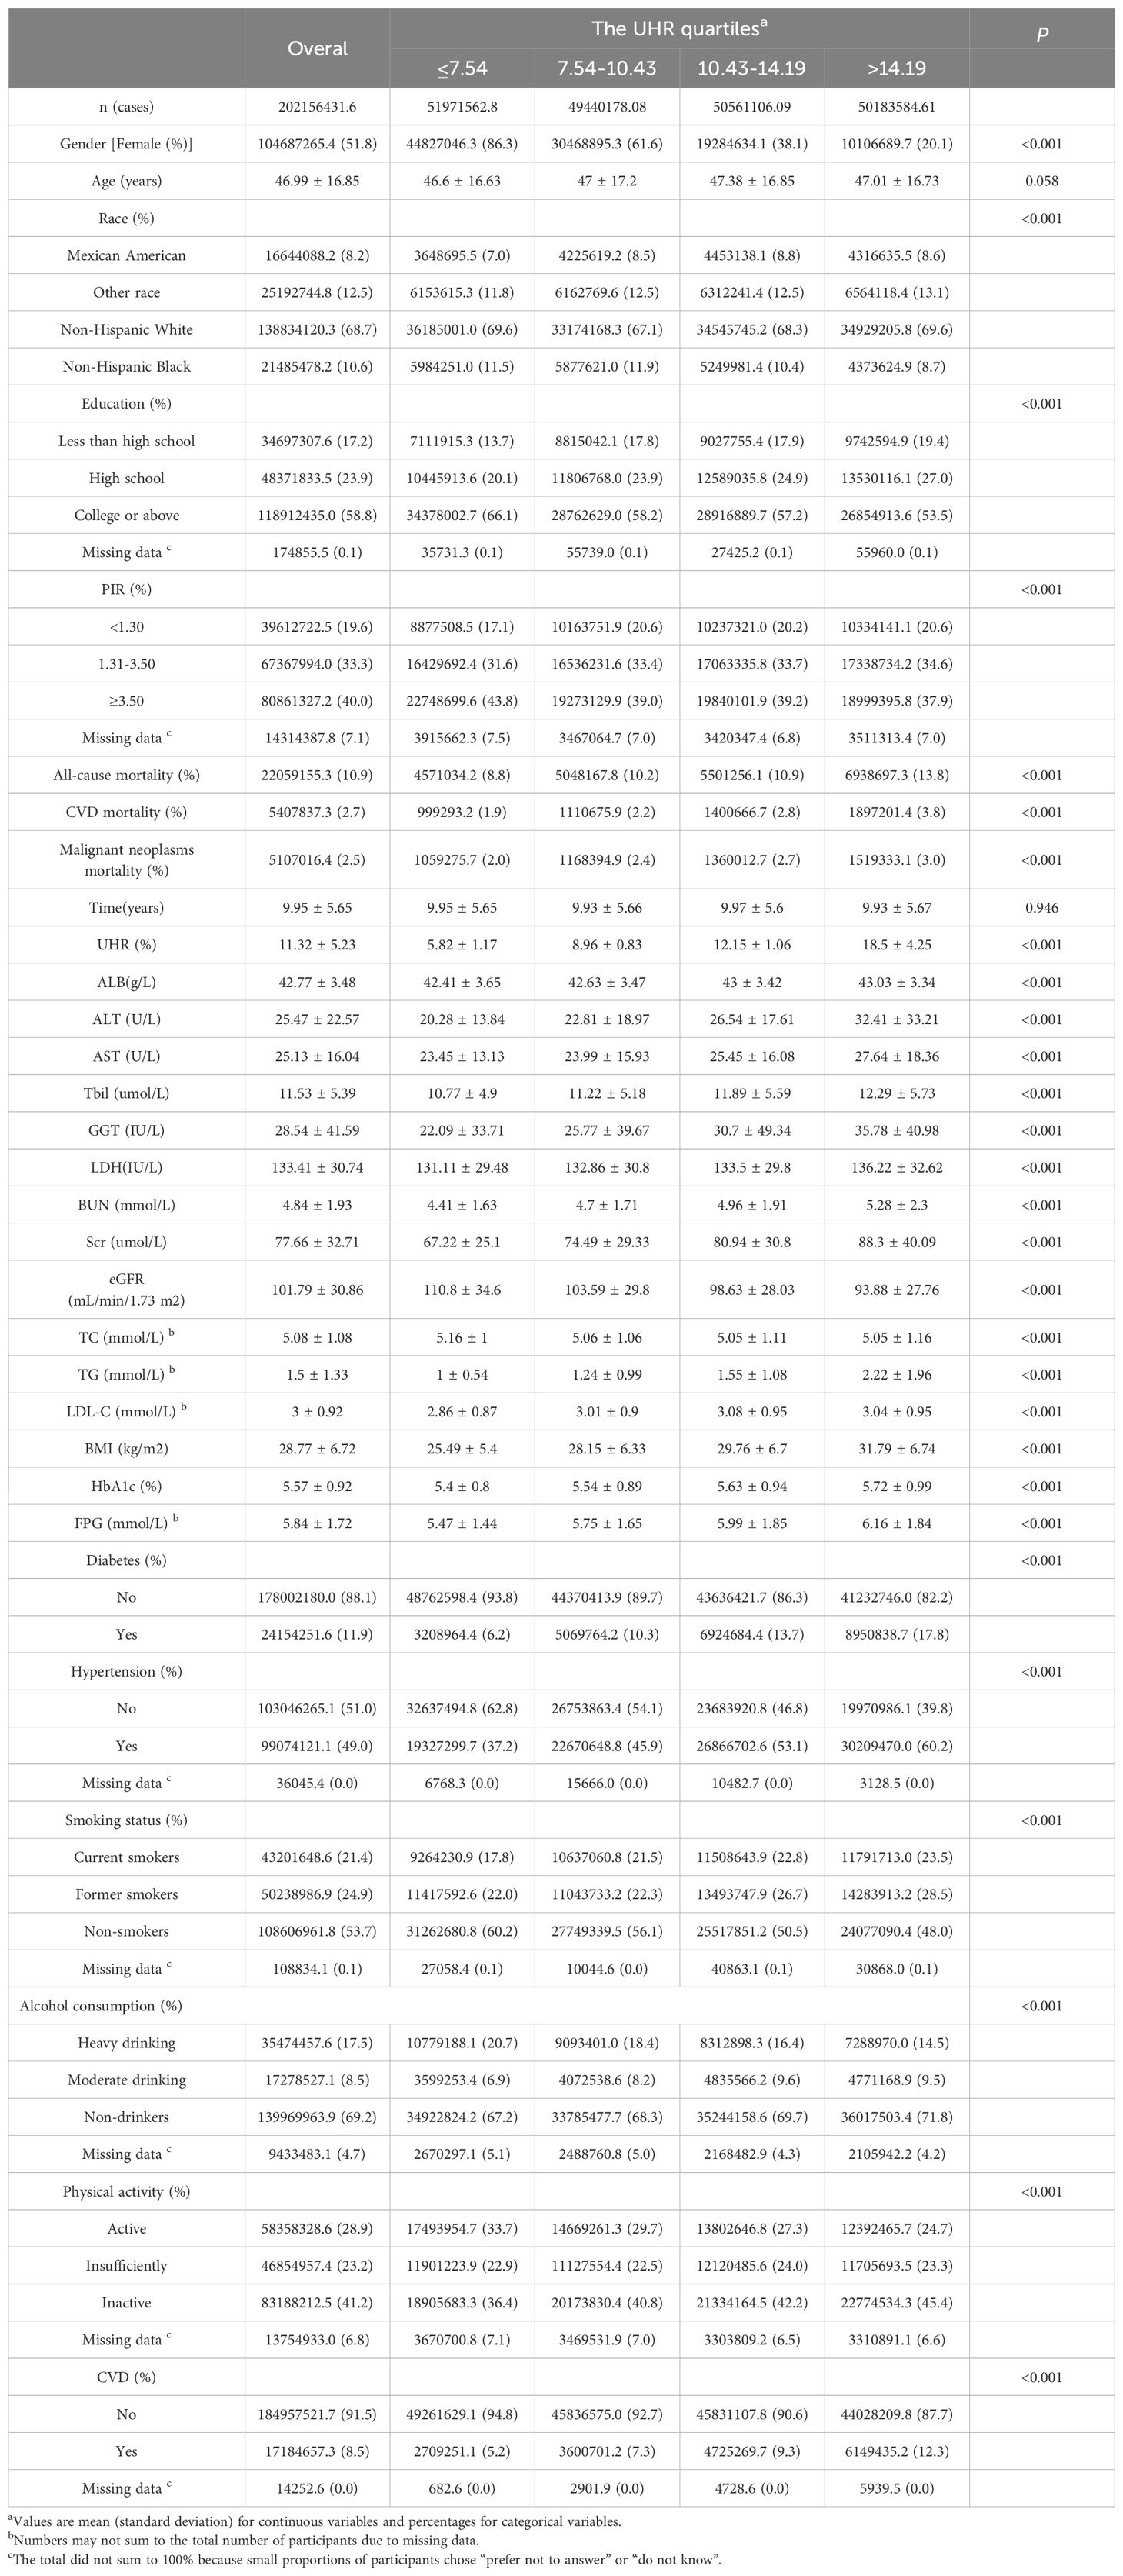
Table 1. Baseline characteristics of participants.
Relationships of UHR level with mortality
Table 2 presents the results of Cox regression analysis, revealing a positive association between UHR levels and all-cause and CVD mortality, adjusting for covariates. No significant association was found between UHR and malignant neoplasms mortality. The hazard ratios (HRs) and 95% confidence intervals (CIs) in the highest quintile were 1.16 (95% CI: 1.05, 1.29) for all-cause mortality and 1.2 (95% CI: 1.00, 1.45) for CVD mortality, indicating increasing risk with higher UHR quartiles. Interestingly, not all the quadratic term for UHR was not statistically significant, suggesting a non-linear association between UHR and mortality.
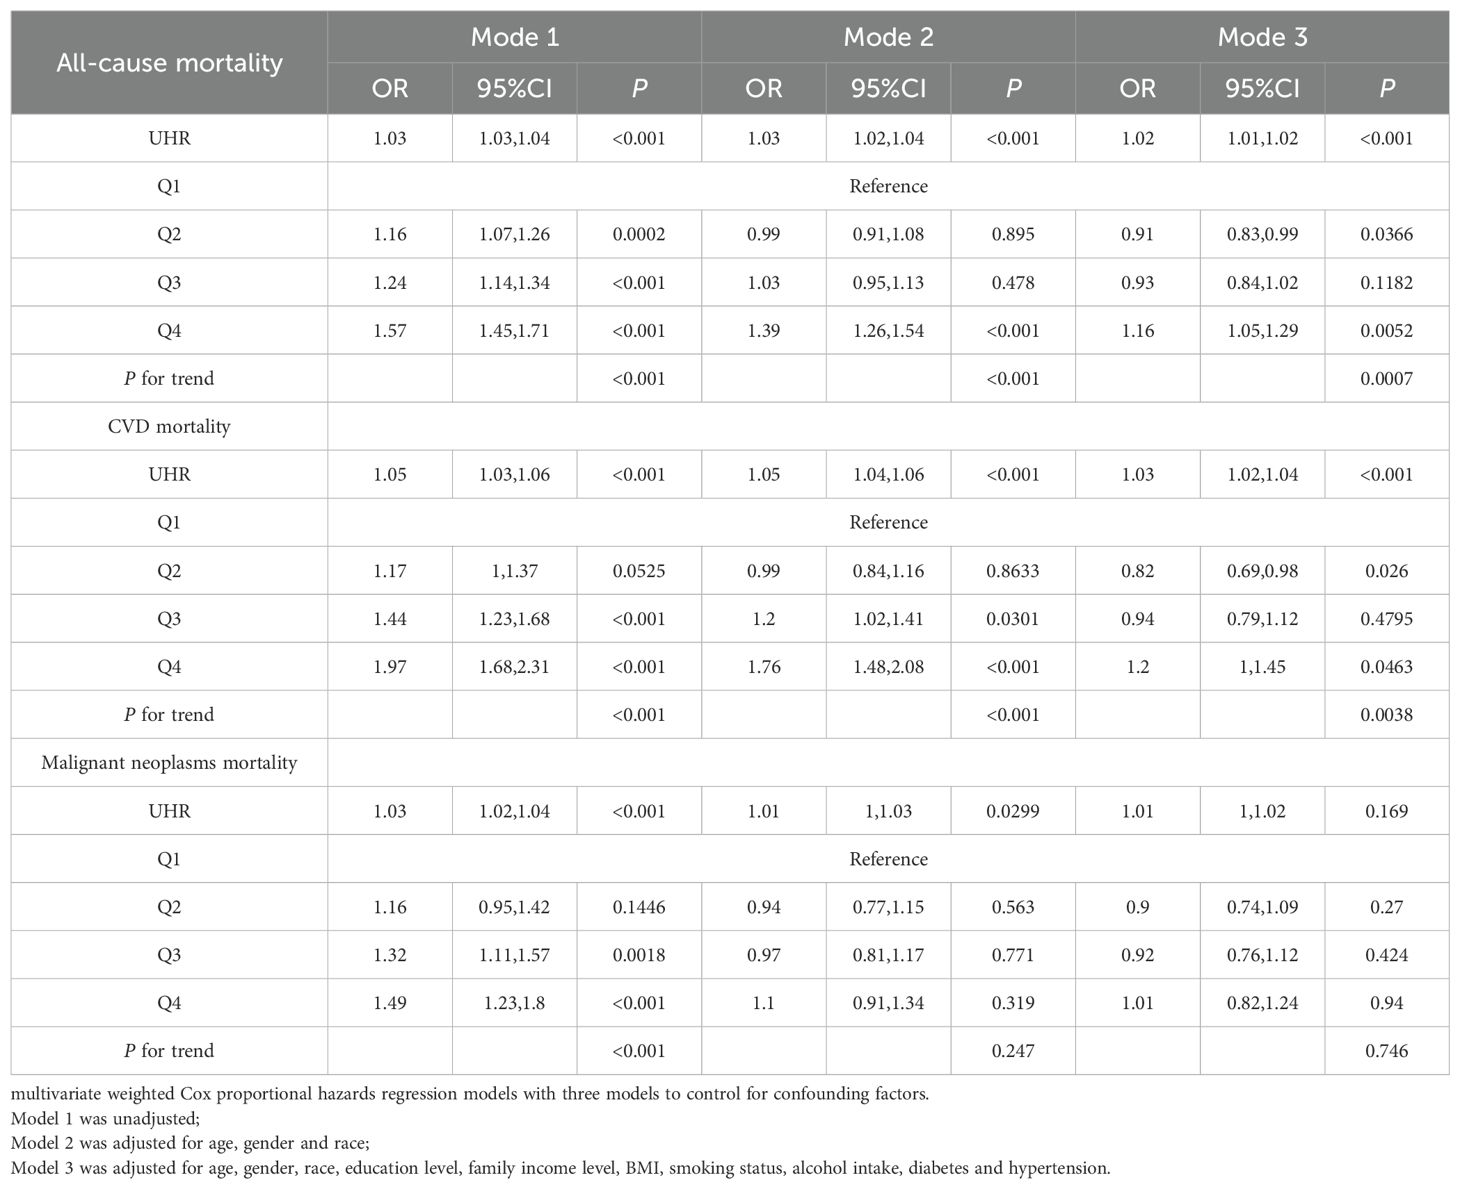
Table 2. Associations of serum UHR with mortality in US adults.
Patients in the highest quintile of diabetes, obesity, and CVD exhibited significantly elevated risks for both all-cause and CVD mortality compared to those in the lowest quintile. Specifically, HRs were 1.32 (95% CI: 1.11, 1.57) for all-cause mortality and 1.38 (95% CI: 1.01, 1.9) for CVD mortality in diabetes patients (Supplementary Table 4); 1.32 (95% CI: 1.10, 1.58) and 1.55 (95% CI: 1.06, 2.28) in obesity patients (Supplementary Table 5); and 1.29 (95% CI: 1.10, 1.50) and 1.38 (95% CI: 1.06, 1.79) in CVD patients (Supplementary Table 6), respectively.
The dose-response association of UHR level with mortality
Due to Cox regression analysis indicated a non-linear relationship between UHR and the risk of all-cause and CVD mortality, we employed a restricted cubic splines models to further investigate the correlation. After adjusting for multiple potential confounders, we found a non-linear relationship between UHR and all-cause (P-nonlinearity < 0.0001) (Figure 2A) and CVD (P-nonlinearity = 0.018) (Figure 2B) in general population and different subgroup (Supplementary Figure 1).
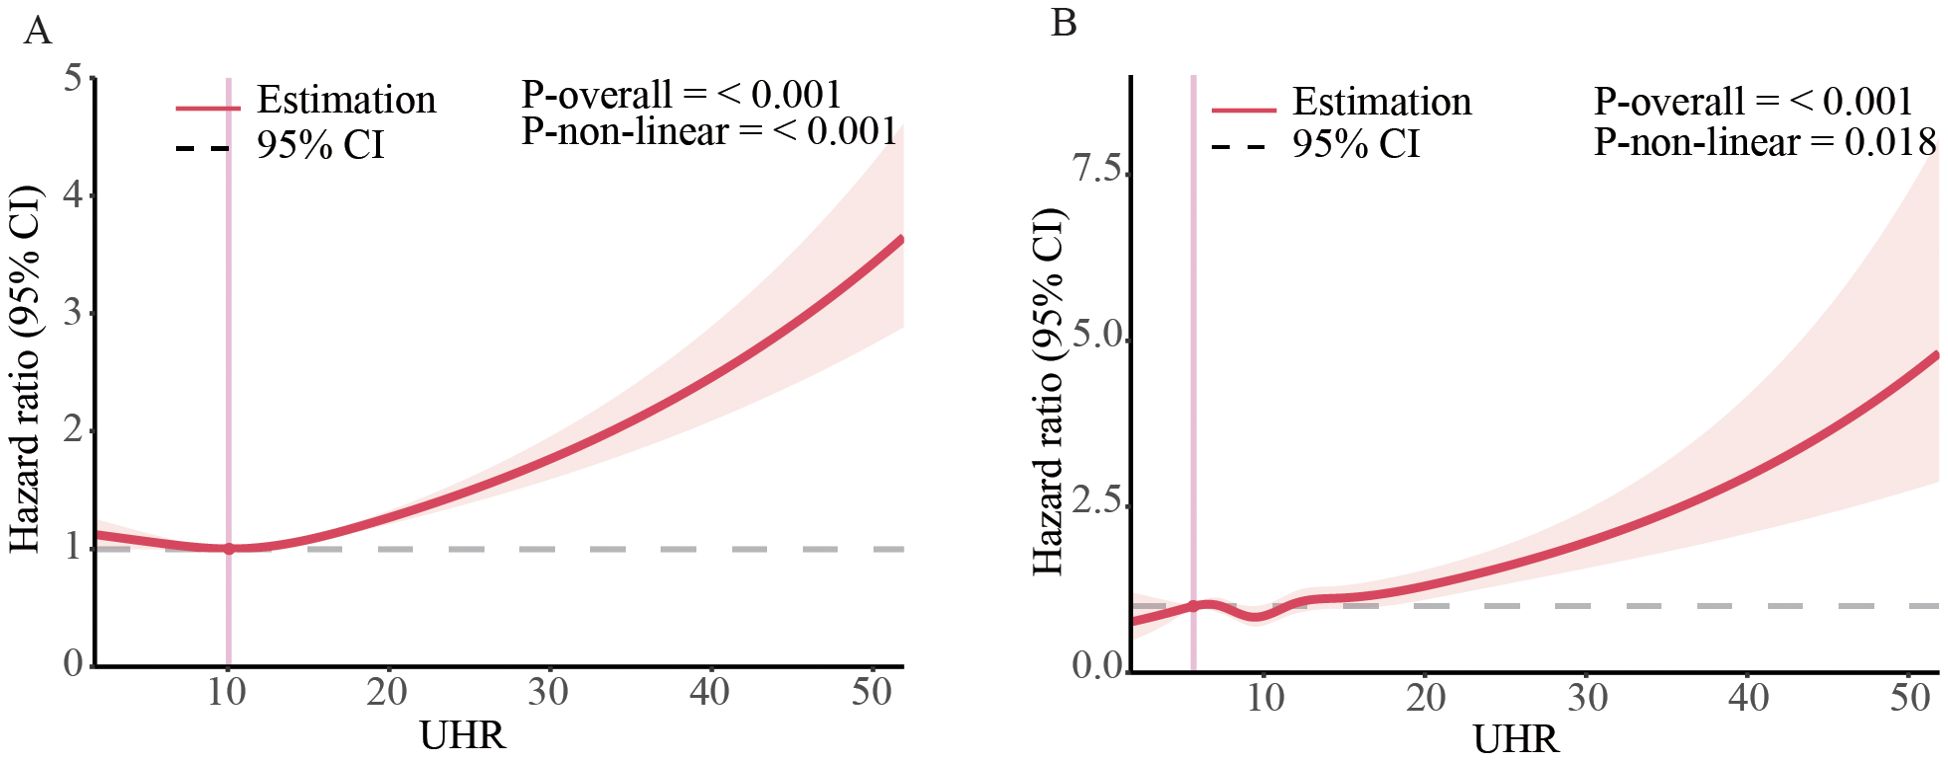
Figure 2. Dose-response associations of UHR with all-cause, and CVD mortality in US adults. Association between UHR and all-cause (A) and CVD mortality (B) in general population. The associations were examined by multivariable Cox regression models with restricted cubic splines. HRs adjusted for age, gender, race, education level, family income level, BMI, smoking status, alcohol intake, diabetes and hypertension except the corresponding stratification variable. Solid lines represent estimates of HRs and dashed lines represent 95% CIs.
Using Kaplan-Meier analysis, we identified critical thresholds of 12.4 for all-cause mortality and 10.7 for CVD mortality. Analysis of adjusted Cox-regression survival estimates across UHR groups, stratified by these thresholds, demonstrated significant dose-dependent increases in both all-cause (adjusted HR: 1.16, 95% CI: 1.09, 1.24, P < 0.0011) and CVD mortality (adjusted HR: 1.2, 95% CI: 1.05, 1.37, P = 0.0064). Notably, survival rates were notably lower in the high UHR group, as summarized in Table 3.

Table 3. Threshold effect analysis of UHR on mortality in US patients.
In the subgroup analysis, adjusted Cox-regression survival analysis demonstrated significant and dose-dependent increases in both all-cause and CVD mortality among UHR groups stratified by individual thresholds. Specifically, for the diabetes subgroup, the HRs were 1.32 (95% CI: 1.15, 1.51) for all-cause mortality and 1.5 (95% CI: 1.18, 1.89) for CVD mortality compared to the low group (Supplementary Table 7). Comparable trends were observed in the obese and CVD subgroups, with adjusted HRs of 1.22 (95% CI: 1.08, 1.37) for all-cause mortality and 1.49 (95% CI: 1.17, 1.9) for CVD mortality in obese patients (Supplementary Table 8), and 1.37 (95% CI: 1.16, 1.62) for all-cause mortality and 1.46 (95% CI: 1.21, 1.77) for CVD mortality in CVD patients (Supplementary Table 9).
Stratified analyses
Stratified analyses demonstrated the disadvantage of higher UHR (≥ 12.4 for all-cause mortality) versus lower UHR (< 12.4) was consistent across subgroups in the general population (Figure 3). Significant interactions were observed between UHR and stratified variables, particularly gender, BMI, education, smoking, alcohol use, and hypertension. subgroup analysis revealed a strong association between UHR and all-cause mortality among female patients aged over 50. Similarly, the disadvantage of higher UHR (≥ 10.7 for CVD mortality) compared to lower UHR (< 10.7) was consistent across subgroups (Figure 4), with significant interactions based on gender, smoking, and alcohol intake. These findings underscore the importance of considering multiple factors when assessing the impact of UHR on mortality outcomes.
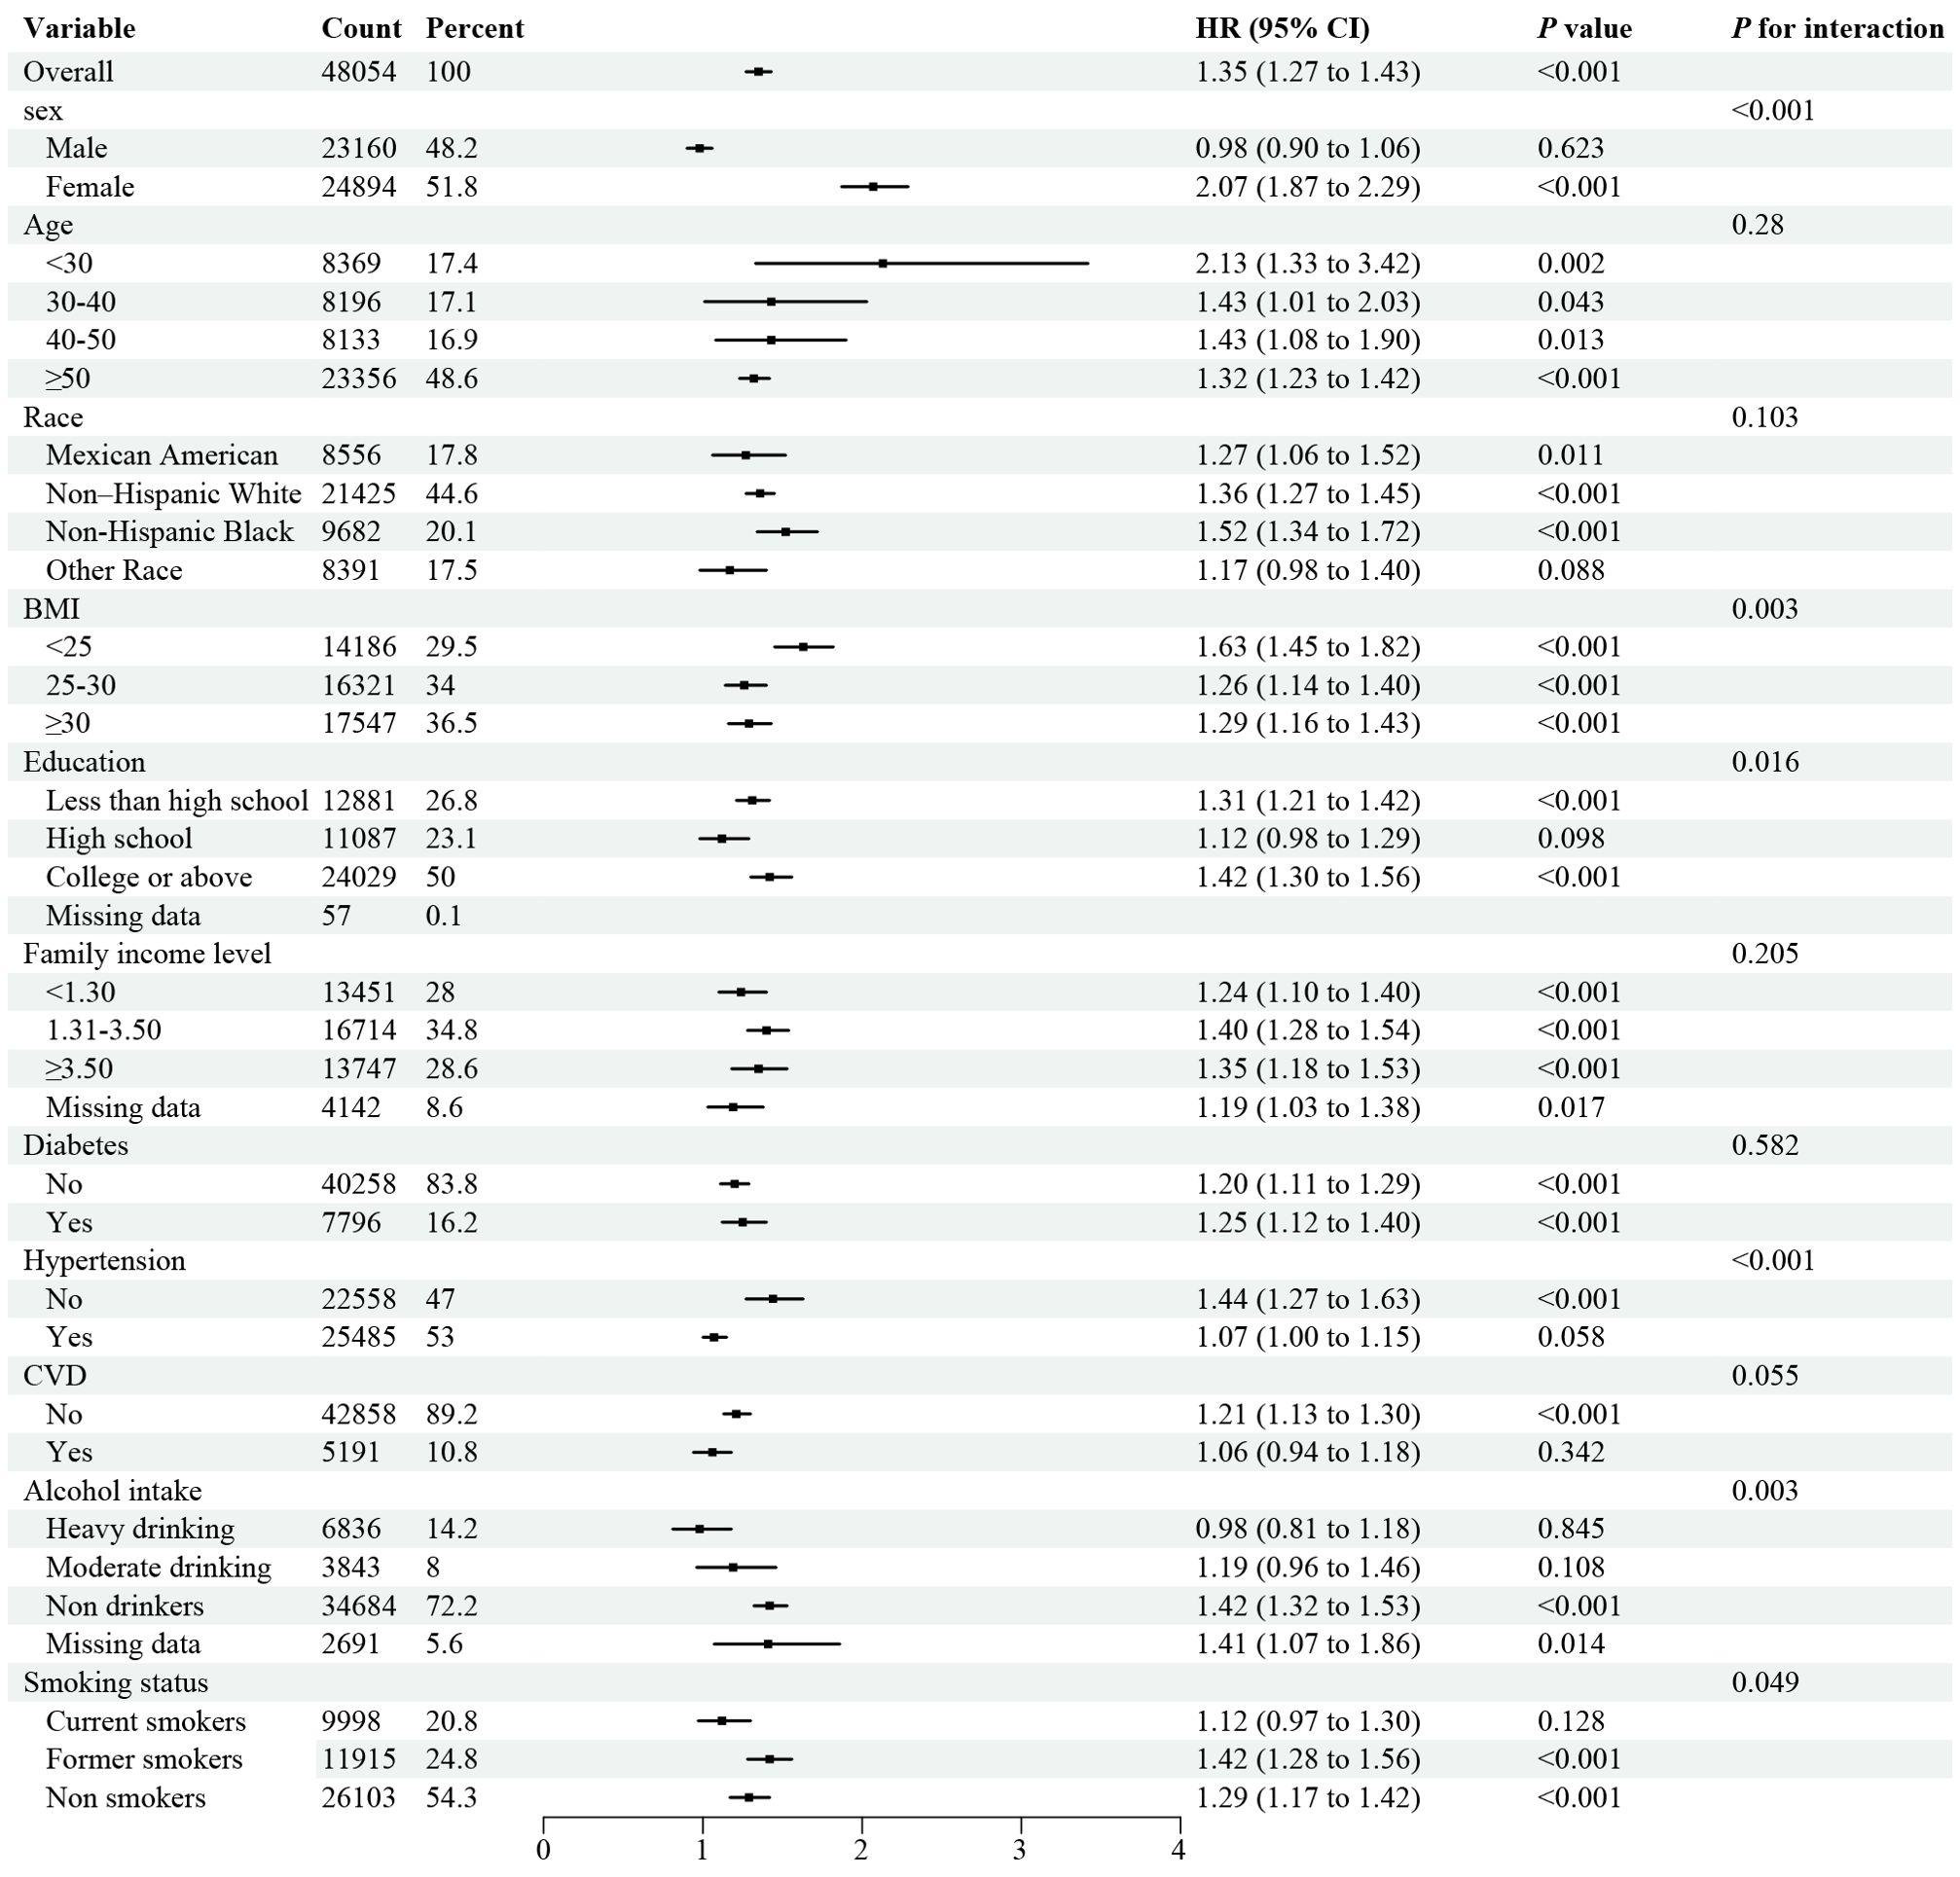
Figure 3. Forest plot of Stratified analyses of UHA and all-cause mortality in general population. HRs adjusted for age, gender, race, education level, family income level, BMI, smoking status, alcohol intake, diabetes and hypertension except the corresponding stratification variable.
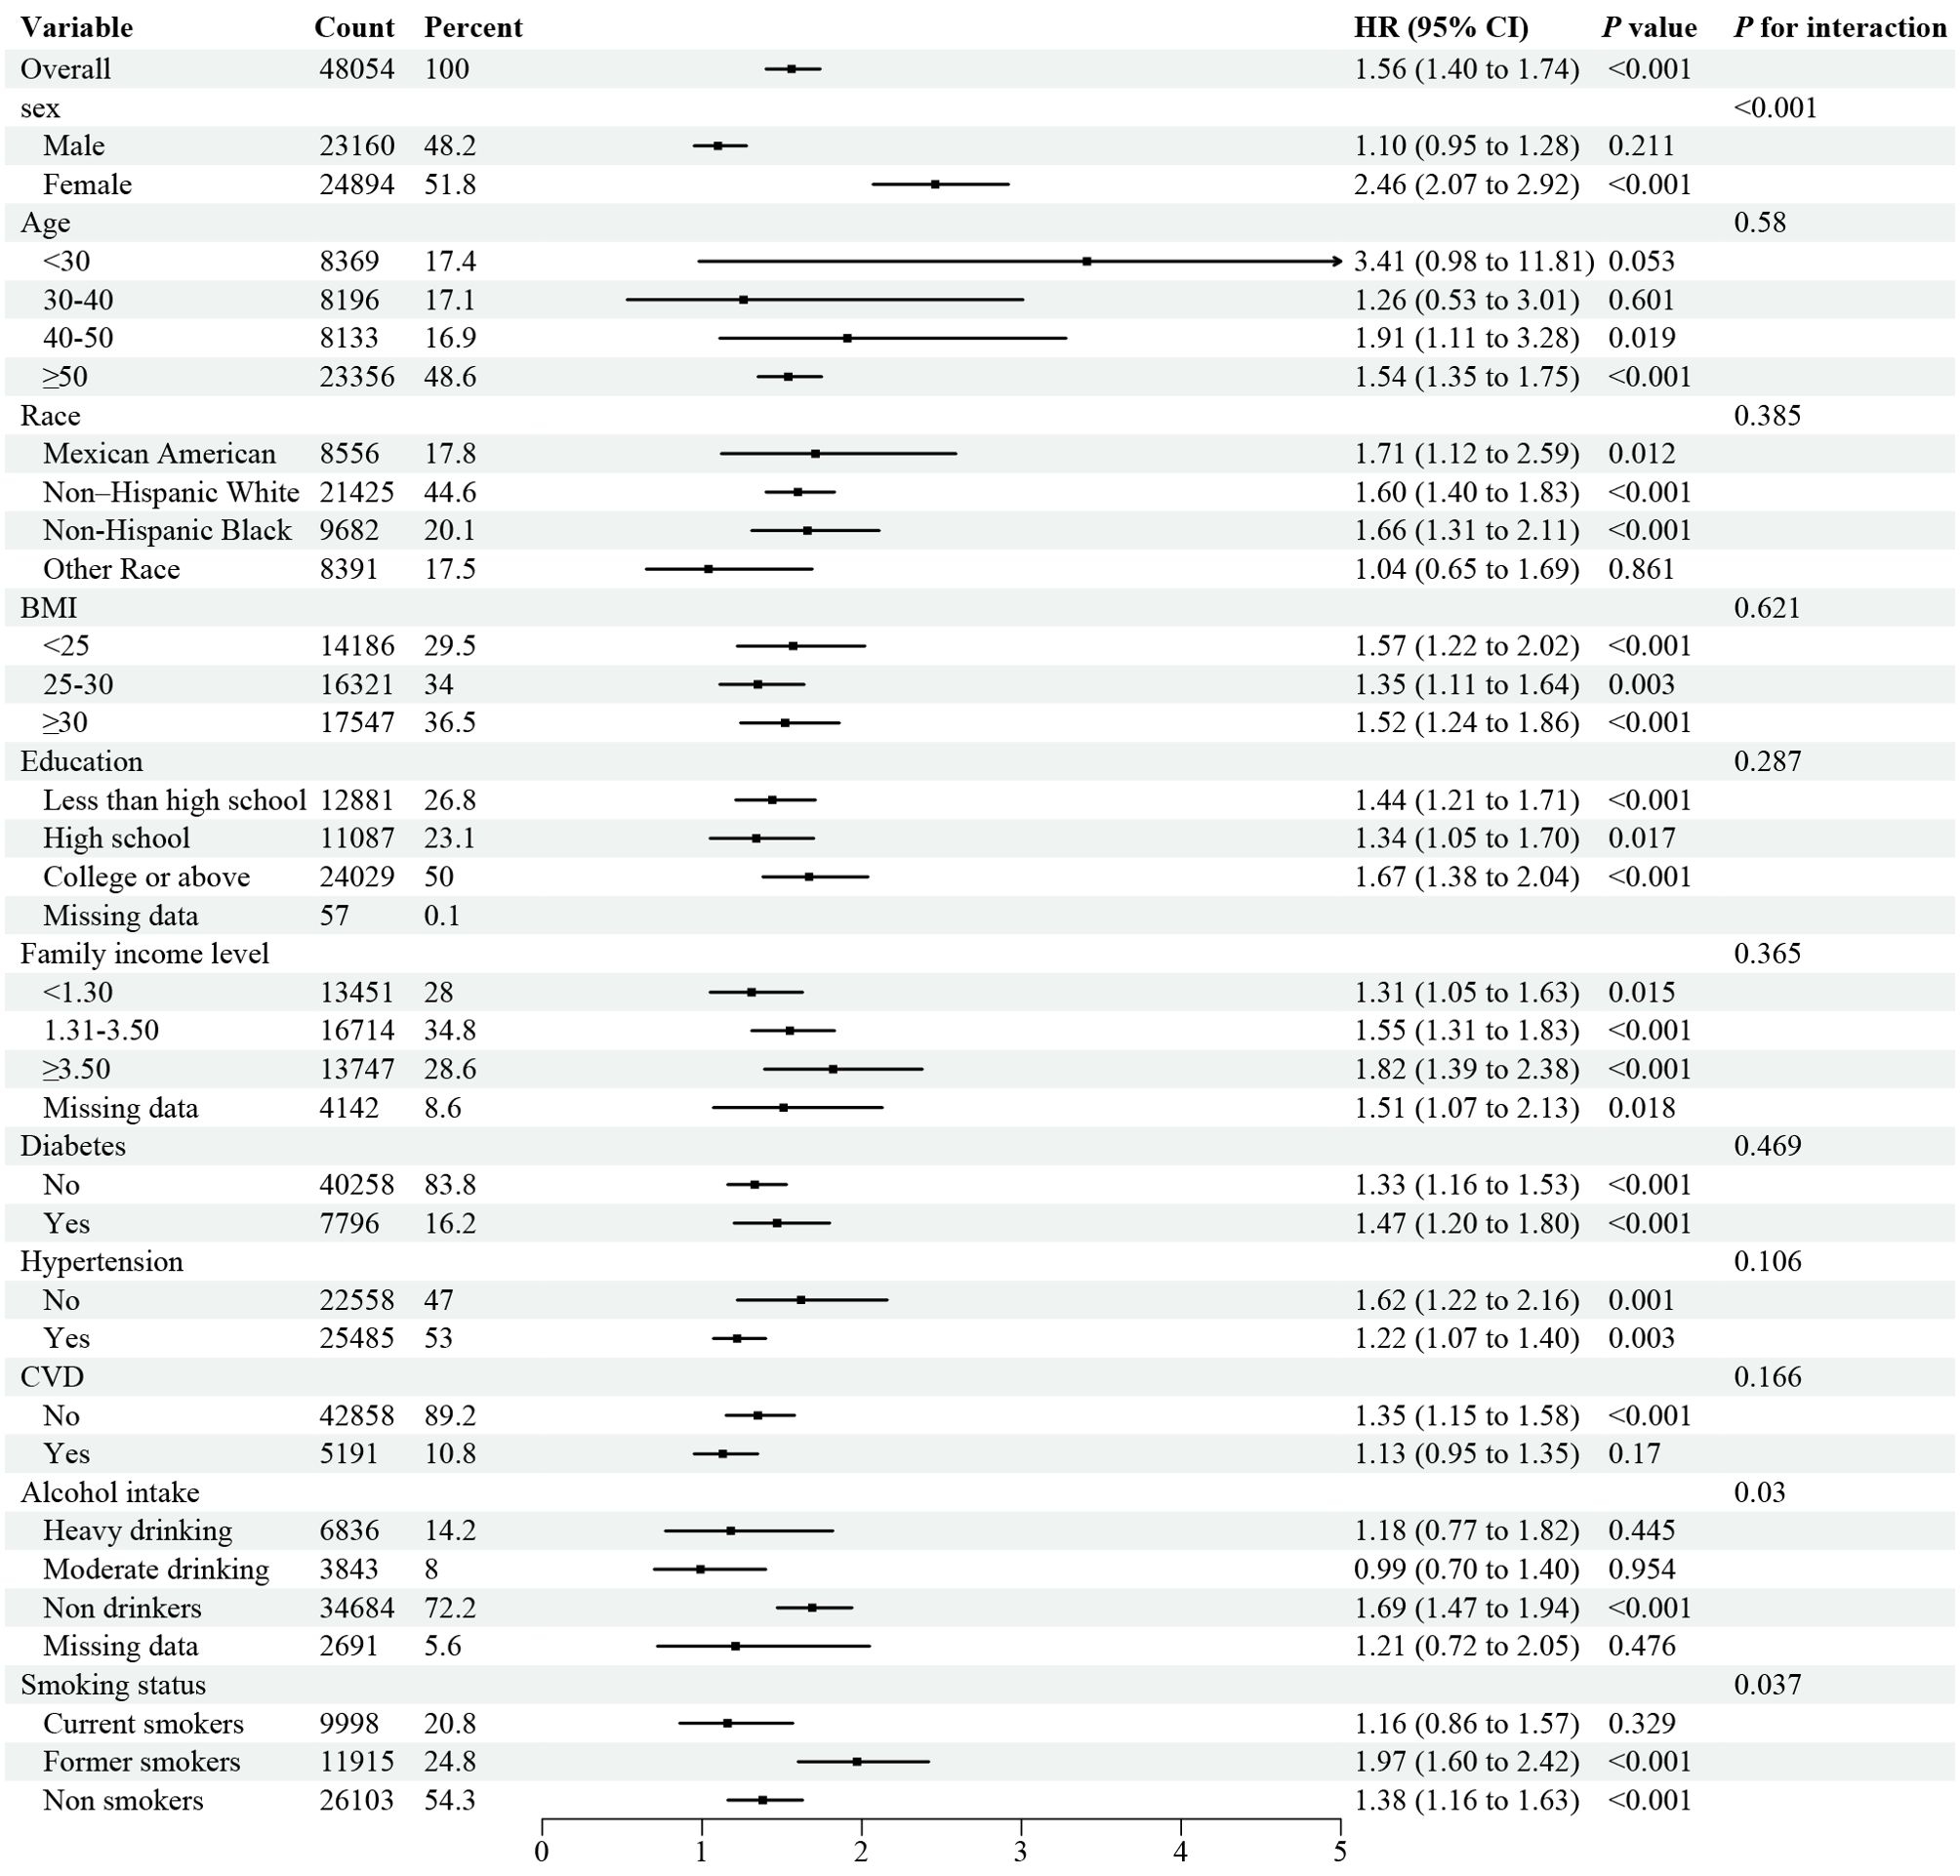
Figure 4. Forest plot of Stratified analyses of UHA and CVD mortality in general population. HRs adjusted for age, gender, race, education level, family income level, BMI, smoking status, alcohol intake, diabetes and hypertension except the corresponding stratification variable.
The stratified analyses on diabetes subgroup model revealed significant interactions between sex groups for all-cause mortality, and age categories, education level, and smoking status for CVD mortality (Supplementary Figures 2, 3). The stratified analyses on obesity subgroup model revealed significant interactions between sex groups, education level, and smoking status for all-cause mortality, and sex groups, education level, and diabetes status for CVD mortality (Supplementary Figures 4, 5). The stratified analyses on CVD subgroup model revealed significant interactions between sex groups and education level for all-cause mortality, and education level for CVD mortality (Supplementary Figures 6, 7).
Discussion
To our knowledge, this is the first study to investigate the relationship between the UHR with all-cause and CVD mortality among US general population, the current study demonstrated that higher UHR levels are associated with increased risks of both types of mortality. Kaplan-Meier analysis identified thresholds of 12.4 and 10.7 for all-cause and CVD mortality, respectively. Our results underscore the predictive power of UHR for cardiovascular and overall mortality.
Studies conducted by Yu et al. have investigated the association between UHR and all-cause/CVD mortality among peritoneal dialysis (PD) patients. Their findings revealed that patients with higher UHR exhibited an elevated risk of both all-cause and cardiovascular mortality, particularly among those aged 65 and older (39). Our study aligns with this evidence, further validating the predictive value of UHR for mortality. Meanwhile, previous studies have shown that UHR is a reliable marker for CVD risk across patient groups. Elevated UHR predicts increased risk of adverse cardiovascular events and CVD mortality, as demonstrated by studies on acute myocardial infarction (22), coronary chronic total occlusion (19), and ischemic heart disease (17). Our study further confirms the correlation between UHR and risk of CVD mortality across diverse patient groups, emphasizing the significance of UHR as a predictor of cardiovascular disease outcomes.
Although the precise biological mechanisms linking UHR index to mortality remain elusive, insulin resistance (IR) is a potential key pathway. IR, characterized by reduced insulin sensitivity and responsiveness, can trigger oxidative stress, exacerbate inflammation, promote foam cell formation, impair endothelial function, and encourage smooth muscle cell proliferation (48). Persistent IR can also increase sympathetic nervous system activity, renal sodium retention, and blood pressure, leading to vascular and renal damage (49). These pathological changes contribute to CVD development, progression, and poor prognosis. Multiple studies suggest a correlation between UHR and IR, with Xu et al. (26) finding a positive association between UHR and HOMA-IR in type 2 diabetes patients, and Dağ et al. (50) observing a link between high UHR levels and obesity/IR in adolescents. This suggests that UHR may influence all-cause and cardiovascular mortality through IR. Meanwhile, our study, in alignment with numerous previous investigations (21, 26–28, 30, 31, 50, 51), further confirms that an increase in UHR corresponds to a gradual elevation in multiple risk factors for CVD and IR, including BMI, FBG, HbA1c, TG, TC and LDL. Additionally, UHR has been associated with a spectrum of metabolic-inflammatory diseases, ranging from diabetes mellitus (31, 52), metabolic syndrome (53), and NAFLD (35, 36, 38, 54). Collectively, these findings suggest that the association between UHR and adverse outcomes is primarily explained by the presence of traditional CVD and IR risk factors.
We further studied the population with diabetes, obesity, and CVD separately, and the results showed that there was still a nonlinear relationship between the UHR index and the all-cause mortality and CVD mortality of the population with diabetes, obesity, and CVD. Among these different populations, the diagnostic predictive value of UHR is higher than that of the general population. Taken together, our findings support the utility of the UHR as a reliable and accurate indicator of all-cause and CVD mortality in the real world.
To fully appreciate the research findings, acknowledging the limitations of this cross-sectional study is paramount. Firstly, causality cannot be definitively established, necessitating further cohort studies to confirm the results. Secondly, cross-sectional studies, although valuable, are susceptible to confounding variables that could potentially bias the results, thereby affecting the interpretation of the findings. Although attempts were made to account for these factors, unknown variables or biases may still exist, leading to inaccurate results. Therefore, a cautious approach is warranted when interpreting the findings, requiring further validation under different conditions. At last, this analysis only examines the prognostic value of the UHR, and it is unclear whether changes in the UHR during follow-up also predict mortality, which requires further investigation.
In conclusion, our study highlights the UHR as a key predictor of all-cause and CVD mortality across different populations. Measuring UHR could aid risk assessment and prognosis. Future research should explore interventions targeting UHR for improved outcomes.
Data availability statement
Publicly available datasets were analyzed in this study. This data can be found here: https://www.cdc.gov/nchs/nhanes/index.htm.
Ethics statement
The studies involving humans were approved by The Centers for Disease Control and Prevention (CDC) and the National Center for Health Statistics (NCHS) research Ethics Review Committee. The studies were conducted in accordance with the local legislation and institutional requirements. Written informed consent for participation was not required from the participants or the participants’ legal guardians/next of kin in accordance with the national legislation and institutional requirements.
Author contributions
ZL: Conceptualization, Data curation, Formal analysis, Methodology, Project administration, Resources, Software, Writing – original draft, Writing – review & editing. QL: Data curation, Formal analysis, Funding acquisition, Writing – original draft. ZY: Conceptualization, Data curation, Formal analysis, Funding acquisition, Investigation, Methodology, Supervision, Validation, Writing – original draft, Writing – review & editing.
Funding
The author(s) declare financial support was received for the research, authorship, and/or publication of this article. This article is supported by National Natural Science Foundation of China (82200879, 82200958) and Natural Science Foundation of Shandong Province (ZR2022QH272, ZR2021QH182).
Acknowledgments
We thank the National Health and Nutrition Examination Survey participants and staff and the National Center for Health Statistics for their valuable contributions.
Conflict of interest
The authors declare that the research was conducted in the absence of any commercial or financial relationships that could be construed as a potential conflict of interest.
Publisher’s note
All claims expressed in this article are solely those of the authors and do not necessarily represent those of their affiliated organizations, or those of the publisher, the editors and the reviewers. Any product that may be evaluated in this article, or claim that may be made by its manufacturer, is not guaranteed or endorsed by the publisher.
Supplementary material
The Supplementary Material for this article can be found online at: https://www.frontiersin.org/articles/10.3389/fendo.2024.1417485/full#supplementary-material
Abbreviations
ALT, Alanine aminotransferase; AST, Aspartate aminotransferase; BMI, Body mass index; BUN, Blood urea nitrogen; CHD, Coronary heart disease; CHF, Congestive heart failure; CI, Confidence interval; CV, Cardiovascular; CVD, Cardiovascular disease; DBP, Diastolic blood pressure; eGFR, estimated glomerular filtration rate; FBG, Fasting blood glucose; GGT, gamma-glutamyltransferase; HbA1c, Glycosylated hemoglobin A1c; HDL-C, High-density lipoprotein cholesterol; HR, Hazard ratio; IR, Insulin resistance; LDH, Lactate dehydrogenase; LDL-C, Low-density lipoprotein cholesterol; MI, Myocardial infarction; MNCHS, National Center for Health Statistics; NDI, National Death Index; NHANES, National Health and Nutrition Examination Survey; PIR, Family income to poverty ratios; SBP, Systolic blood pressure; Scr, Serum creatinine; SD, Standard deviation; T2DM, Type 2 diabetes mellitus; Tbil, Total bilirubin; TC, Total cholesterol; TG, Triglyceride; UA, Uric acid; UHR, Uric acid-to-high-density lipoprotein cholesterol ratio.
References
1. Virani SS, Alonso A, Benjamin EJ, Bittencourt MS, Callaway CW, Carson AP, et al. Heart disease and stroke statistics-2020 update: A report from the American Heart Association. Circulation. (2020) 141:e139–596. doi: 10.1161/CIR.0000000000000757
2. Roth GA, Mensah GA, Johnson CO, Addolorato G, Ammirati E, Baddour LM, et al. Global burden of cardiovascular diseases and risk factors, 1990-2019: update from the GBD 2019 study. J Am Coll Cardiol. (2020) 76:2982–3021. doi: 10.1016/j.jacc.2020.11.010
3. Roshandel G, Khoshnia M, Poustchi H, Hemming K, Kamangar F, Gharavi A, et al. Effectiveness of polypill for primary and secondary prevention of cardiovascular diseases (PolyIran): a pragmatic, cluster-randomised trial. Lancet. (2019) 394:672–83. doi: 10.1016/S0140-6736(19)31791-X
4. Rahimi-Sakak F, Maroofi M, Rahmani J, Bellissimo N, Hekmatdoost A. Serum uric acid and risk of cardiovascular mortality: a systematic review and dose-response meta-analysis of cohort studies of over a million participants. BMC Cardiovasc Disord. (2019) 19:218. doi: 10.1186/s12872-019-1215-z
5. Virdis A, Masi S, Casiglia E, Tikhonoff V, Cicero AFG, Ungar A, et al. Identification of the uric acid thresholds predicting an increased total and cardiovascular mortality over 20 years. Hypertens (Dallas Tex: 1979). (2020) 75:302–8. doi: 10.1161/HYPERTENSIONAHA.119.13643
6. Zheng Y, Ou J, Huang D, Zhou Z, Dong X, Chen J, et al. The U-shaped relationship between serum uric acid and long-term all-cause mortality in coronary artery disease patients: A cohort study of 33,034 patients. Front Cardiovasc Med. (2022) 9:858889. doi: 10.3389/fcvm.2022.858889
7. Casiglia E, Tikhonoff V, Virdis A, Masi S, Barbagallo CM, Bombelli M, et al. Serum uric acid and fatal myocardial infarction: detection of prognostic cut-off values: The URRAH (Uric Acid Right for Heart Health) study. J Hypertens. (2020) 38:412–9. doi: 10.1097/HJH.0000000000002287
8. Hajizadeh R, Ghaffari S, Salehi R, Mazani S, Aghavali S. Association of serum uric acid level with mortality and morbidity of patients with acute ST-elevation myocardial infarction. J Cardiovasc Thorac Res. (2016) 8:56–60. doi: 10.15171/jcvtr.2016.11
9. von Lueder TG, Girerd N, Atar D, Agewall S, Lamiral Z, Kanbay M, et al. Serum uric acid is associated with mortality and heart failure hospitalizations in patients with complicated myocardial infarction: findings from the High-Risk Myocardial Infarction Database Initiative. Eur J Heart Fail. (2015) 17:1144–51. doi: 10.1002/ejhf.419
10. Takaeko Y, Matsui S, Kajikawa M, Maruhashi T, Kishimoto S, Hashimoto H, et al. Association of extremely high levels of high-density lipoprotein cholesterol with endothelial dysfunction in men. J Clin Lipidol. (2019) 13:664–72 e1. doi: 10.1016/j.jacl.2019.06.004
11. Ahmed HM, Miller M, Nasir K, McEvoy JW, Herrington D, Blumenthal RS, et al. Primary low level of high-density lipoprotein cholesterol and risks of coronary heart disease, cardiovascular disease, and death: results from the multi-ethnic study of atherosclerosis. Am J Epidemiol. (2016) 183:875–83. doi: 10.1093/aje/kwv305
12. Park JS, Cha KS, Lee HW, Oh JH, Choi JH, Lee HC, et al. Predictive and protective role of high-density lipoprotein cholesterol in acute myocardial infarction. Cardiol J. (2019) 26:176–85. doi: 10.5603/CJ.a2018.0020
13. Wen S, Arakawa H, Tamai I. Uric acid in health and disease: From physiological functions to pathogenic mechanisms. Pharmacol Ther. (2024) 256:108615. doi: 10.1016/j.pharmthera.2024.108615
14. Mocciaro G, D’Amore S, Jenkins B, Kay R, Murgia A, Herrera-Marcos LV, et al. Lipidomic approaches to study HDL metabolism in patients with central obesity diagnosed with metabolic syndrome. Int J Mol Sci. (2022) 23. doi: 10.3390/ijms23126786
15. Hui N, Barter PJ, Ong KL, Rye KA. Altered HDL metabolism in metabolic disorders: insights into the therapeutic potential of HDL. Clin Sci (Lond). (2019) 133:2221–35. doi: 10.1042/CS20190873
16. Ahari RK, Sahranavard T, Mansoori A, Fallahi Z, Babaeepoor N, Ferns G, et al. Association of atherosclerosis indices, serum uric acid to high-density lipoprotein cholesterol ratio and triglycerides-glucose index with hypertension: A gender-disaggregated analysis. J Clin Hypertens (Greenwich). (2024) 26:645–55. doi: 10.1111/jch.14829
17. Park B, Jung DH, Lee YJ. Predictive value of serum uric acid to HDL cholesterol ratio for incident ischemic heart disease in non-diabetic Koreans. Biomedicines. (2022) 10. doi: 10.3390/biomedicines10061422
18. Deng F, Jia F, Sun Y, Zhang L, Han J, Li D, et al. Predictive value of the serum uric acid to high-density lipoprotein cholesterol ratio for culprit plaques in patients with acute coronary syndrome. BMC Cardiovasc Disord. (2024) 24:155. doi: 10.1186/s12872-024-03824-z
19. Yang Y, Zhang J, Jia L, Su J, Ma M, Lin X. Uric acid to high-density lipoprotein cholesterol ratio predicts adverse cardiovascular events in patients with coronary chronic total occlusion. Nutr Metab Cardiovasc Dis. (2023) 33:2471–8. doi: 10.1016/j.numecd.2023.07.037
20. Aydin C, Emlek N. The relationship between uric acid to high-density lipoprotein cholesterol ratio and collateral index in patients with chronic total occlusion. Kardiologiia. (2021) 61:61–5. doi: 10.18087/cardio.2021.9.n1750
21. Aktas G, Khalid A, Kurtkulagi O, Duman TT, Bilgin S, Kahveci G, et al. Poorly controlled hypertension is associated with elevated serum uric acid to HDL-cholesterol ratio: a cross-sectional cohort study. Postgrad Med. (2022) 134:297–302. doi: 10.1080/00325481.2022.2039007
22. Yang Y, Zhang J, Jia L, Su J, Ma M, Lin X. The interaction between uric acid and high-density lipoprotein cholesterol on the prognosis of patients with acute myocardial infarction. Front Cardiovasc Med. (2023) 10:1226108. doi: 10.3389/fcvm.2023.1226108
23. Yang Y, Shen XY, Tang HX, Liu H, Wen Y. Sex differences in the association of the uric acid to high-density lipoprotein cholesterol ratio with coronary artery disease risk among Chinese nondialysis patients with CKD stages 3-5. Nutr Metab Cardiovasc Dis. (2024) 34:1546–53. doi: 10.1016/j.numecd.2024.03.003
24. Li F, Zhao D, Li Q, Lin X, Sun H, Fan Q. Uric acid to high-density lipoprotein cholesterol ratio is a novel marker to predict functionally significant coronary artery stenosis. J Interv Cardiol. (2022) 2022:9057832. doi: 10.1155/2022/9057832
25. Zhou X, Xu J. Association between serum uric acid-to-high-density lipoprotein cholesterol ratio and insulin resistance in an American population: A population-based analysis. J Diabetes Investig. (2024) 15:762–71. doi: 10.1111/jdi.14170
26. Zhou X, Xu J. Association between serum uric acid-to-high-density lipoprotein cholesterol ratio and insulin resistance in patients with type 2 diabetes mellitus. J Diabetes Investig. (2024) 15:113–20. doi: 10.1111/jdi.14086
27. Wang Y, Xu Y, Hu T, Xiao Y, Wang Y, Ma X, et al. Associations of serum uric acid to high-density lipoprotein cholesterol ratio with trunk fat mass and visceral fat accumulation. Diabetes Metab Syndr Obes. (2024) 17:121–9. doi: 10.2147/DMSO.S444142
28. Sun H, Su H, Zheng R, Liu C, Wang Y, Fang C. Serum uric acid to high−density lipoprotein cholesterol ratio is associated with visceral fat in patients with type 2 diabetes. Diabetes Metab Syndr Obes. (2023) 16:959–67. doi: 10.2147/DMSO.S403895
29. Kosekli MA, Aktas G. Serum uric acid to hdl cholesterol ratio is associated with diabetic control in new onset type 2 diabetic population. Acta Clin Croat. (2023) 62:277–82. doi: 10.20471/acc.2023.62.02.04
30. Xuan Y, Zhang W, Wang Y, Wang B, Xia F, Zhang K, et al. Association between uric acid to HDL cholesterol ratio and diabetic complications in men and postmenopausal women. Diabetes Metab Syndr Obes. (2023) 16:167–77. doi: 10.2147/DMSO.S387726
31. Aktas G, Kocak MZ, Bilgin S, Atak BM, Duman TT, Kurtkulagi O. Uric acid to HDL cholesterol ratio is a strong predictor of diabetic control in men with type 2 diabetes mellitus. Aging Male. (2020) 23:1098–102. doi: 10.1080/13685538.2019.1678126
32. Yu X, Sun F, Ming J, Liang S, Zhang W, Wang L, et al. Serum uric acid to high-density lipoprotein cholesterol ratio is a promising marker for identifying metabolic syndrome in nondiabetic Chinese men. Postgrad Med. (2023) 135:741–9. doi: 10.1080/00325481.2023.2263372
33. Li XM, Liu SL, He YJ, Shu JC. Using new indices to predict metabolism dysfunction-associated fatty liver disease (MAFLD): analysis of the national health and nutrition examination survey database. BMC Gastroenterol. (2024) 24:109. doi: 10.1186/s12876-024-03190-2
34. Cui Y, Qu Z, Hu W, Shi H. Relationship between uric acid to high density lipoprotein cholesterol ratio and nonalcoholic fatty liver disease in nonoverweight/obese patients with type 2 diabetes. Int J Endocrinol. (2023) 2023:2513175. doi: 10.1155/2023/2513175
35. Xie Y, Huang K, Zhang X, Wu Z, Wu Y, Chu J, et al. Association of serum uric acid-to-high-density lipoprotein cholesterol ratio with non-alcoholic fatty liver disease in American adults: a population-based analysis. Front Med (Lausanne). (2023) 10:1164096. doi: 10.3389/fmed.2023.1164096
36. Zhao H, Qiu X, Li HZ, Cui JJ, Sun YY. Association between serum uric acid to HDL-cholesterol ratio and nonalcoholic fatty liver disease risk among Chinese adults. BioMed Environ Sci. (2023) 36:1–9. doi: 10.3967/bes2022.111
37. Liu P, Li J, Yang L, Zhang Z, Zhao H, Zhao N, et al. Association between cumulative uric acid to high-density lipoprotein cholesterol ratio and the incidence and progression of chronic kidney disease. Front Endocrinol (Lausanne). (2023) 14:1269580. doi: 10.3389/fendo.2023.1269580
38. Kurtkulagi O, Tel BMA, Kahveci G, Bilgin S, Duman TT, Erturk A, et al. Hashimoto’s thyroiditis is associated with elevated serum uric acid to high density lipoprotein-cholesterol ratio. Rom J Intern Med. (2021) 59:403–8. doi: 10.2478/rjim-2021-0023
39. Liu R, Peng Y, Wu H, Diao X, Ye H, Huang X, et al. Uric acid to high-density lipoprotein cholesterol ratio predicts cardiovascular mortality in patients on peritoneal dialysis. Nutr Metab Cardiovasc Dis. (2021) 31:561–9. doi: 10.1016/j.numecd.2020.10.005
40. Zou X, Zhou X, Zhu Z, Ji L. Novel subgroups of patients with adult-onset diabetes in Chinese and US populations. Lancet Diabetes Endocrinol. (2019) 7:9–11. doi: 10.1016/S2213-8587(18)30316-4
41. National Center for Health Statistics.National Health and Nutrition Examination Survey. US centers for disease control and prevention. Available online at: https://www.cdc.gov/nchs/nhanes/index.htm (Accessed April 18, 2022).
42. Skopp NA, Smolenski DJ, Schwesinger DA, Johnson CJ, Metzger-Abamukong MJ, Reger MA. Evaluation of a methodology to validate National Death Index retrieval results among a cohort of U. S. service members. Ann Epidemiol. (2017) 27:397–400. doi: 10.1016/j.annepidem.2017.05.004
43. World Health Organization. ICD-10: international statistical classification of diseases and related health problems: tenth revision, 2nd ed. World Health Organization. (2004). https://iris.who.int/handle/10665/42980
44. Johnson CL, Paulose-Ram R, Ogden CL, Carroll MD, Kruszon-Moran D, Dohrmann SM, et al. National health and nutrition examination survey: analytic guidelines, 1999-2010. Vital Health Stat 2. (2013) 161):1–24.
45. Pate RR, Pratt M, Blair SN, Haskell WL, Macera CA, Bouchard C, et al. Physical activity and public health. A recommendation from the Centers for Disease Control and Prevention and the American College of Sports Medicine. JAMA. (1995) 273:402–7. doi: 10.1001/jama.273.5.402
46. Levey AS, Stevens LA, Schmid CH, Zhang YL, Castro AF 3rd, Feldman HI, et al. A new equation to estimate glomerular filtration rate. Ann Intern Med. (2009) 150:604–12. doi: 10.7326/0003-4819-150-9-200905050-00006
47. The National Health and Nutrition Examination Survey. (NHANES) Analytic and Reporting Guidelines Centers for Disease Control Prevention Atlanta. GA: CDC (2006).
48. Laakso M, Kuusisto J. Insulin resistance and hyperglycaemia in cardiovascular disease development. Nat Rev Endocrinol. (2014) 10:293–302. doi: 10.1038/nrendo.2014.29
49. da Silva AA, do Carmo JM, Li X, Wang Z, Mouton AJ, Hall JE. Role of hyperinsulinemia and insulin resistance in hypertension: metabolic syndrome revisited. Can J Cardiol. (2020) 36:671–82. doi: 10.1016/j.cjca.2020.02.066
50. Dikker O, Aktas A, Sahin M, Dogan M, Dag H. The association of serum uric acid levels and various uric acid-related ratios with insulin resistance and obesity: A preliminary study in adolescents. Children (Basel). (2023) 10. doi: 10.3390/children10091493
51. Aktas G, Yilmaz S, Kantarci DB, Duman TT, Bilgin S, Balci SB, et al. Is serum uric acid-to-HDL cholesterol ratio elevation associated with diabetic kidney injury? Postgrad Med. (2023) 135:519–23. doi: 10.1080/00325481.2023.2214058
52. Kocak MZ, Aktas G, Erkus E, Sincer I, Atak B, Duman T. Serum uric acid to HDL-cholesterol ratio is a strong predictor of metabolic syndrome in type 2 diabetes mellitus. Rev Assoc Med Bras (1992). (2019) 65:9–15. doi: 10.1590/1806-9282.65.1.9
53. Yazdi F, Baghaei MH, Baniasad A, Naghibzadeh-Tahami A, Najafipour H, Gozashti MH. Investigating the relationship between serum uric acid to high-density lipoprotein ratio and metabolic syndrome. Endocrinol Diabetes Metab. (2022) 5:e00311. doi: 10.1002/edm2.311
Keywords: the serum uric acid-to-high-density lipoprotein cholesterol ratio, mortality, cardiovascular disease, obese, diabetes, NHANES
Citation: Li Z, Liu Q and Yao Z (2024) The serum uric acid-to-high-density lipoprotein cholesterol ratio is a predictor for all-cause and cardiovascular disease mortality: a cross-sectional study. Front. Endocrinol. 15:1417485. doi: 10.3389/fendo.2024.1417485
Received: 15 April 2024; Accepted: 28 August 2024;
Published: 13 September 2024.
Edited by:
Yun Kyung Cho, Asan Medical Center, Republic of KoreaReviewed by:
Antonietta Franco, Washington University in St. Louis, United StatesOsama Shoeib, Tanta University, Egypt
Copyright © 2024 Li, Liu and Yao. This is an open-access article distributed under the terms of the Creative Commons Attribution License (CC BY). The use, distribution or reproduction in other forums is permitted, provided the original author(s) and the copyright owner(s) are credited and that the original publication in this journal is cited, in accordance with accepted academic practice. No use, distribution or reproduction is permitted which does not comply with these terms.
*Correspondence: Zhenyu Yao, eWFvemhlbnl1QHNkZm11LmVkdS5jbg==
†ORCID: Zhenyu Yao, orcid.org/0000-0002-0616-8037