- 1College of Medicine, Shantou University, Shantou, China
- 2Department of Endocrinology and Metabolism, First Affiliated Hospital of Shantou University Medical College, Shantou, China
Introduction: Oxidative stress plays a crucial role in the development and progression of hyperuricemia/gout. This study aims to explore the relationship between the Oxidative Balance Score (OBS) and hyperuricemia/gout.
Methods: The study utilized complete data from adult participants in the National Health and Nutrition Examination Survey (NHANES) spanning from 2009 to 2018. OBS, composed of scores for 20 dietary and lifestyle factors, served as the exposure variable. Multivariable linear regression model was applied to evaluate the association between OBS and uric acid (UA). Multivariable logistic regression, subgroup analyses, and restricted cubic spline (RCS) regression were conducted to explore the relationship between OBS and hyperuricemia/gout.
Results: A total of 18,998 participants were included. In the fully adjusted model, compared to the lowest quartile, the highest quartiles of OBS, dietary OBS, and lifestyle OBS were negatively correlated with UA (β=-0.31 (-0.36,-0.25), β=-0.18 (-0.24,-0.12), and β=-0.64 (-0.69,-0.59), respectively) and hyperuricemia (OR=0.63 (0.55,0.71), OR=0.76 (0.67,0.86), OR=0.37 (0.33,0.42), respectively). Moreover, the highest quartiles of OBS and lifestyle OBS exhibited a negative correlation with gout (OR=0.72(0.58,0.91), OR=0.54 (0.43,0.67), respectively). Subgroup analyses revealed differences in the negative association between OBS and hyperuricemia concerning hypertension (p for interaction =0.002) and diabetes (p for interaction= 0.004), while gender-related disparities were observed in the negative association between OBS and gout (p for interaction =0.008). RCS analysis demonstrated a linear negative association between hyperuricemia and OBS (p for non-linearity >0.05), while gout exhibited a non-linear negative association (p for non-linearity<0.05).
Conclusion: The study found that a higher OBS was associated with a decreased risk of developing hyperuricemia/gout, underscoring its potential in the prevention and management of these conditions.
1 Introduction
Uric acid (UA), a terminal product of purine analog metabolism, plays a crucial role in the development of hyperuricemia (1). Hyperuricemia is characterized by excessive production, arising from increased endogenous purine catabolism and excessive exogenous purine intake, or by impaired plasma UA excretion (2). The manifestation of hyperuricemia occurs when UA levels surpass a defined threshold, signifying the onset of a chronic metabolic disorder. Prolonged deposition of substantial UA amounts in joints and tissues eventually progresses into gout (3), affecting individuals of all ages and genders. Gout can manifest as recurrent acute attacks accompanied by joint damage and bone erosion, leading to functional impairment in severe cases (4). Additionally, hyperuricemia emerges as an independent risk factor for various systemic diseases, including cardiovascular diseases (5), hypertension (6), diabetes (7), and chronic kidney disease (CKD) (8).
Oxidative stress is usually defined as an imbalance between reactive oxygen species (ROS) and antioxidants in our body, recognized as a leading cause of cell damage and disease development. A large body of evidence has demonstrated that oxidative stress plays a crucial role in the development and progression of hyperuricemia/gout (4, 9). The oxidative balance score (OBS) is a comprehensive indicator containing 20 distinct dietary and lifestyle components, offering a means to quantify exposure to antioxidants and pro-oxidants in diet and lifestyle, therefore reflecting the overall burden of oxidative stress (10). Generally, a higher OBS is indicative of a preference for antioxidants over pro-oxidants (11). Numerous epidemiological studies have found inverse associations between OBS and various inflammation-related diseases, including CKD (12), cardiovascular disease (13), osteoarthritis (14), and type 2 diabetes (15). Nevertheless, the existing research has yet to explore the association between OBS and hyperuricemia/gout.
Recognizing the significance of OBS and implementing timely interventions may be of great value in preventing the progression of hyperuricemia and facilitating the remission of gout. To address this knowledge gap, we employ the well-established OBS in a nationally representative survey, the National Health and Nutrition Examination Survey (NHANES), to investigate its impact on hyperuricemia and gout for the first time.
2 Method
2.1 Source of data and study population
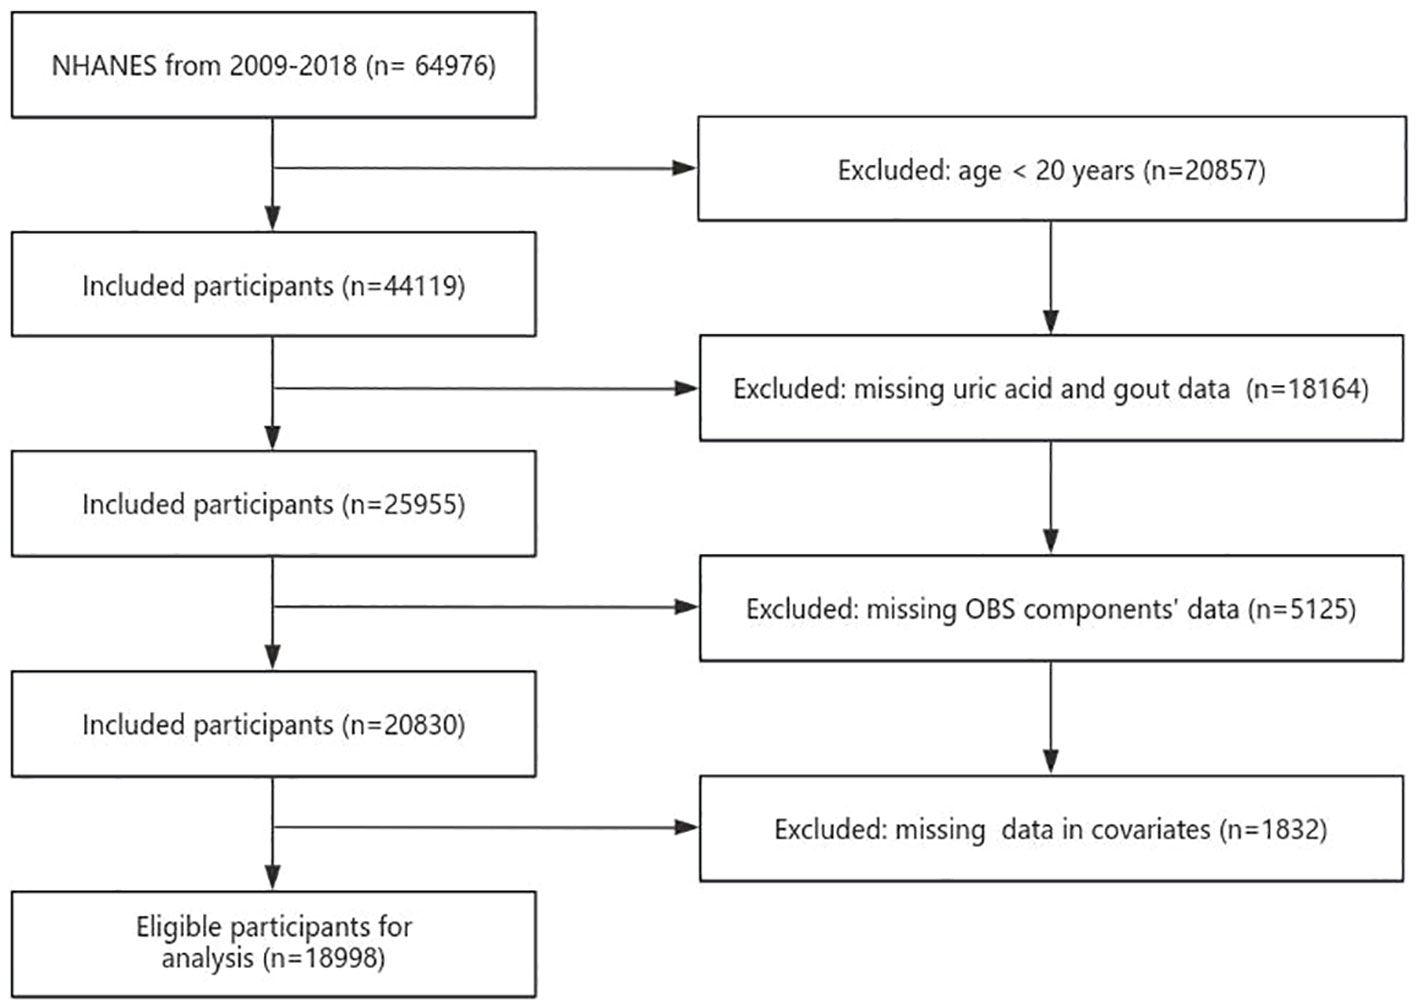
The NHANES conducted a national cross-sectional study to assess the health and nutrition status of both adults and children within the U.S. population. Employing a “stratified multistage probability sampling” method, the study gathered information through interviews, examinations, dietary questionnaires, and laboratory measurements. A total of 18998 participants were chosen from 2009 to 2018. Exclusion criteria were as follows: age of participants was <20 years, participants without serum UA and gout data, participants without OBS components’ data, and variables with missing values (Figure 1). All participants provided signed written informed consent, and the study conformed to ethical standards.
2.2 Calculation of OBS
The construction of OBS in this study was based on both prior research findings and experiential insights (16). The OBS incorporated 16 nutrients and 4 lifestyle factors. These 20 components were further classified into pro-oxidants (total fat, iron, alcohol intake, BMI, and cotinine) and antioxidants (dietary fiber, β-carotene, vitamin B2, niacin, vitamin B6, total folate, vitamin B12, vitamin C, vitamin E, calcium, magnesium, zinc, copper, selenium, and physical activity). The mean of the two 24-hour for diet and dietary supplements represented dietary and dietary supplement intake, and the intake of each nutrient was the sum of diet and dietary supplements (if available). Due to the absence of supplementation data for vitamin E and β-carotene from dietary supplements in NHANES, only dietary data were used for these two nutrients. Following Zhang et al. (16)’s method for calculating OBS, alcohol consumption was stratified into three groups, heavy drinkers (≥15 g/d for women and ≥30 g/d for men), non-heavy drinkers (0-15 g/d for women and 0-30 g/d for men), and nondrinkers, who were assigned 0, 1, and 2 points, respectively. Subsequently, the other components were categorized based on gender and further divided into three groups according to their tertile distributions. Antioxidants were assigned scores of 0-2 in groups 1-3, while pro-oxidants were assigned scores of 2-0 in groups 1-3, respectively (Supplementary Table 1). The total OBS score was the sum of scores for each component, where a higher OBS indicated a greater predominance of antioxidant exposure.
2.3 Evaluation of hyperuricemia and gout
Hyperuricemia was defined as a level of serum UA that was ≥416 mmol/L (7 mg/dL) in men and ≥357 mmol/L (6 mg/dL) in women (17). Gout was defined based on self-reported diagnosis by physicians, ascertained through the following question: “Has a doctor or other health professional ever told you that you have gout?” (17).
2.4 Covariates
Based on available literature and clinical considerations, we identified the following covariates considered potential confounders in the associations between OBS and hyperuricemia/gout. Standardized household interviews provided demographic characteristics, including age, gender (male and female), race (non-Hispanic white, non-Hispanic black, Mexican American, and other races), educational level(below high school, high school, and above high school), marital status (never married, married or lived with a partner, and others), family poverty income ratio (PIR) and total energy intake. Hypertension, diabetes, hyperlipidemia, and CKD are recognized as significant risk factors for hyperuricemia. Consequently, these diseases were integrated into the analysis. The diagnostic criteria for hypertension included an average systolic blood pressure ≥140 mmHg or average diastolic blood pressure ≥90 mmHg after at least three measurement, the use of antihypertensive drugs, and a physician-reported diagnosis of hypertension (18). Diabetes was diagnosed based on glycated hemoglobin (HbA1c) >6.5%, fasting glucose ≥7.0 mmol/L, use of diabetes medication or insulin and a previous diagnosis of diabetes by a physician (19). Hyperlipidemia was determined by total cholesterol levels ≥200 mg/dL, triglyceride levels ≥150 mg/dl, high-density lipoprotein-cholesterol ≤40 mg/dL in men and ≤50 mg/dL in women, and low-density lipoprotein-cholesterol ≥130 mg/dL (20). An albumin-to-creatinine ratio (ACR) ≥30 mg/g (3 mg/mmol) and estimated glomerular filtration rate (eGFR) <60 ml/min/1.73 m2 were adopted as diagnostic criteria for CKD (21). we utilized the Chronic Kidney Disease Epidemiology Collaboration formulate to evaluate eGFR (22).
2.5 Statistical analysis
OBS was treated as a continuous variable. OBS group (quartile conversion) was considered a categorical variable. Continuous variables are presented as median (interquartile range (IQR)), and categorical variables are presented as frequency (percentage). Baseline characteristics were compared using the chi-square test for categorical variables and the Kruskal-Wallis test for continuous variables. To evaluate the association between OBS and UA, coefficient (β) and 95% confidence intervals (CI) were calculated using multivariable linear regression models. To explore the relationship between OBS and hyperuricemia/gout, odds ratio (OR) and 95% CI were calculated using multivariable logistic regression. The crude model was not adjusted for any covariates. Model 1 was adjusted for age, gender, and race. Model 2 was further adjusted for education level, family PIR, marital status, hypertension, diabetes, hyperlipidemia, CKD and energy. Heterogeneity between OBS (as a continuous variable) and hyperuricemia/gout was assessed through interaction and subgroup analyses for the following variables, including gender, age groups, education, race, marital status, family PIR, hypertension, hyperlipidemia, diabetes and CKD. Restricted cubic spline (RCS) analysis with four knots was applied to evaluate non-linear associations between OBS/dietary OBS/lifestyle OBS and hyperuricemia/gout risk. All statistical analyses were performed using R Statistical Software (Version 4.2.2, http://www.R-project.org, The R Foundation) and the Free Statistics analysis platform (Version 1.9, Beijing, China). Alpha was set at <0.05 for statistical significance, and all analyses were two-sided, considering a two-sided p-value <0.05 as statistically significant.
3 Results
3.1 Baseline characteristics
Baseline characteristics of individuals grouped by OBS quartiles are shown in Table 1. The median age of subjects was 49 years, with 52.3% being female. The majority of participants were non-Hispanic white (43.5%), and the overall prevalence of hyperuricemia and gout in the entire U.S. population was 20.1% and 4.7%, respectively. Compared to the lowest OBS quartile (Q1), individuals in the highest OBS quartile (Q4) had higher age, higher education levels, greater wealth, higher total energy intake, lower UA levels, were married or partnered, and were non-Hispanic white or of other races. The prevalence of hyperuricemia and gout, along with their comorbidities, including hypertension, diabetes, hyperlipidemia, and CKD, gradually decreased as OBS increased.
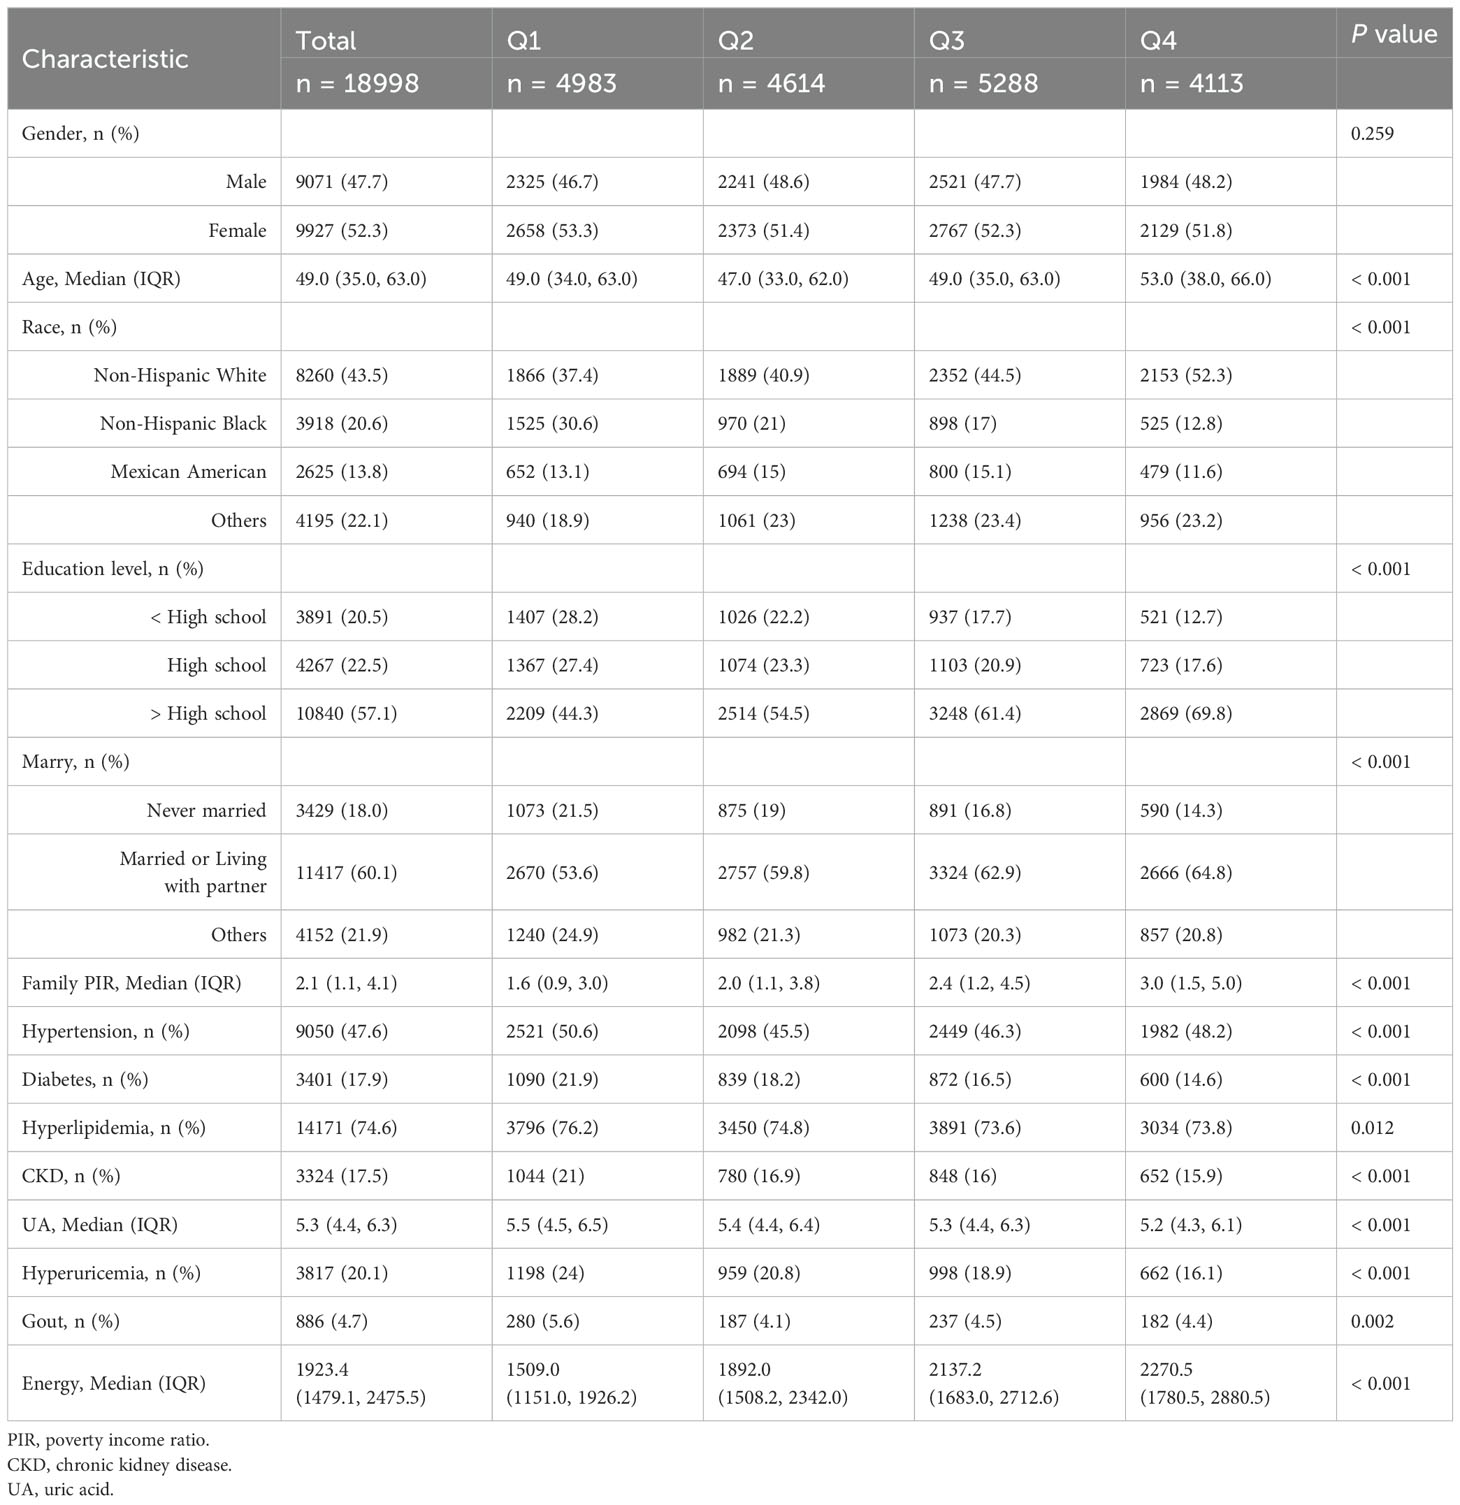
Table 1. The baseline characteristics by quartiles of the OBS: National Health and Nutrition Examination.
3.2 Association between OBS and UA
Linear regression was employed to assess the association between OBS and plasma UA. The data presented in Table 2 reveals a negative correlation between OBS and plasma UA (p < 0.05). In the fully adjusted model (Model 2), the highest quartile of OBS exhibited a stronger negative association with UA levels compared to the lowest quartile of OBS (β=-0.31 (-0.36, -0.25), p < 0.001), and this association remained relatively stable across models. We further explored the impact of dietary OBS and lifestyle OBS on UA using linear regression models. In Model 2, both dietary OBS and lifestyle OBS in the highest quartile group (Q4) were significantly associated with decreased uric acid levels compared to the lowest quartile (Q1) (β=-0.18 (-0.24, -0.12), p < 0.001, β=-0.64 (-0.69, -0.59), p < 0.001, respectively) (Table 2). The trend test indicated a statistically significant downward trend (p for trend < 0.001). These findings underscore the inverse relationship between OBS and plasma UA, highlighting the potential role of oxidative balance in modulating UA levels.
3.3 Association between OBS and hyperuricemia
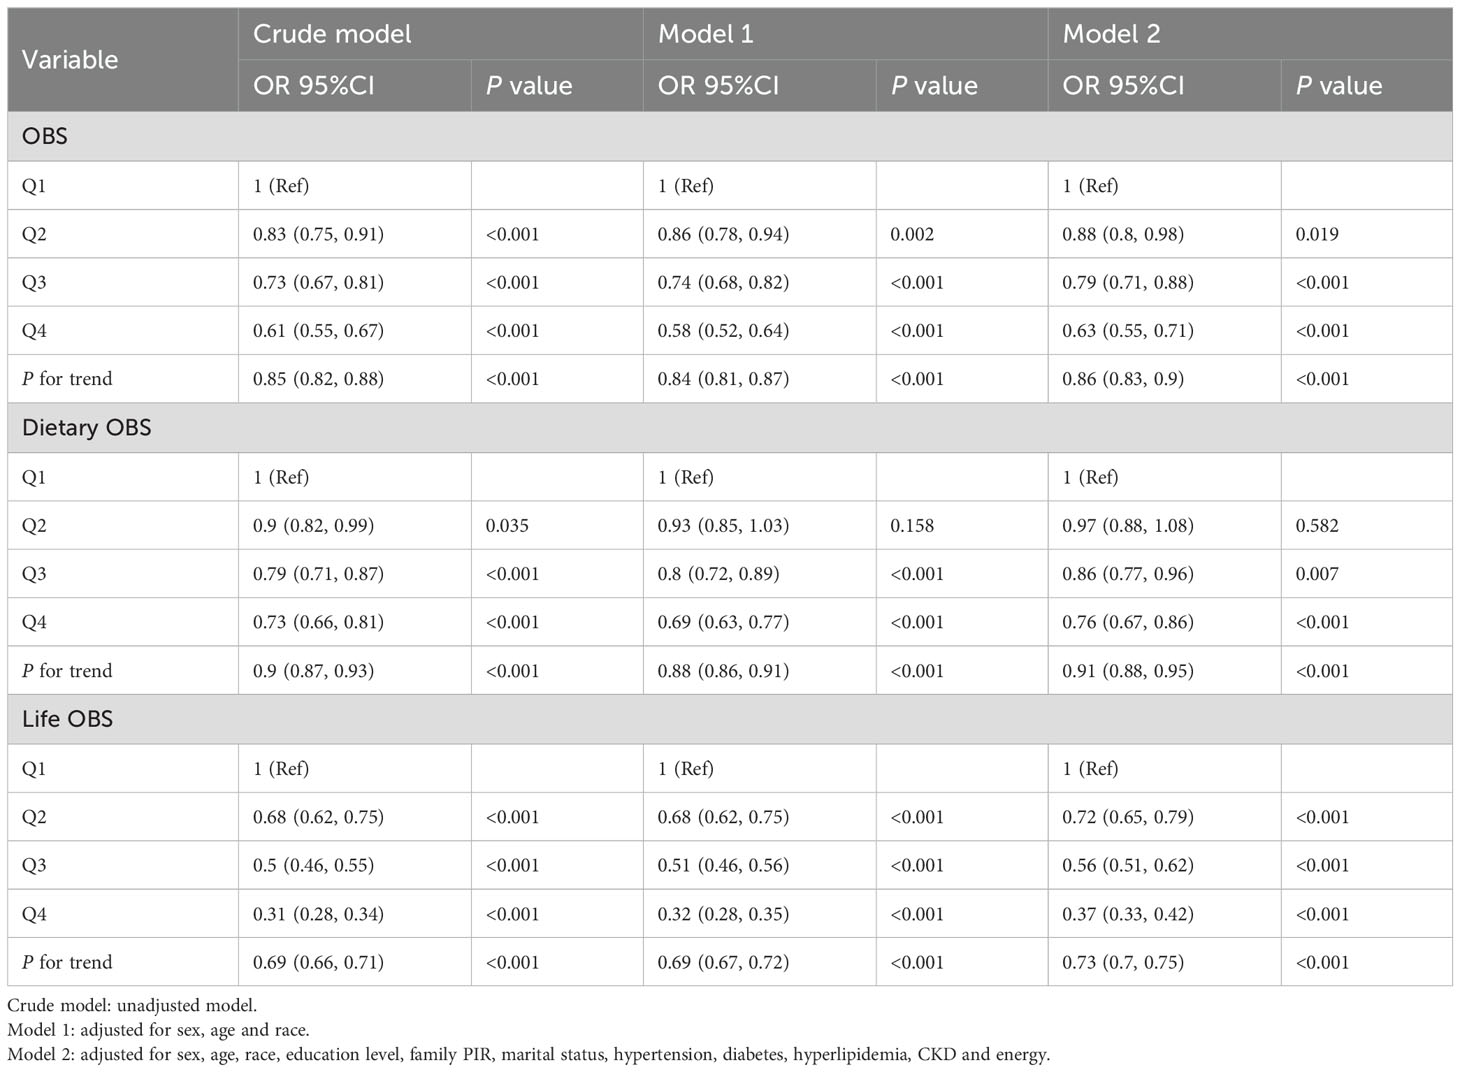
As shown in Table 3, logistic regression analysis revealed a significant negative association between OBS and hyperuricemia. The risk of hyperuricemia gradually decreased with increasing quartiles in all models (p for trend <0.001). In the fully adjusted model (Model 2), participants in Q4 of OBS showed a lower risk of hyperuricemia compared to the reference Q1 (OR = 0.63 (0.55, 0.71), p < 0.001), and this association remained consistent across models. Furthermore, in Model 2, both dietary OBS and lifestyle OBS in Q4 compared with Q1 reduced the risk of hyperuricemia (OR = 0.76 (0.67, 0.9), p < 0.001; OR = 0.37 (0.33, 0.42), p < 0.001, respectively) (Table 3). The trend test indicated a statistically significant downward trend (p for trend < 0.001).
3.4 Association between OBS and gout
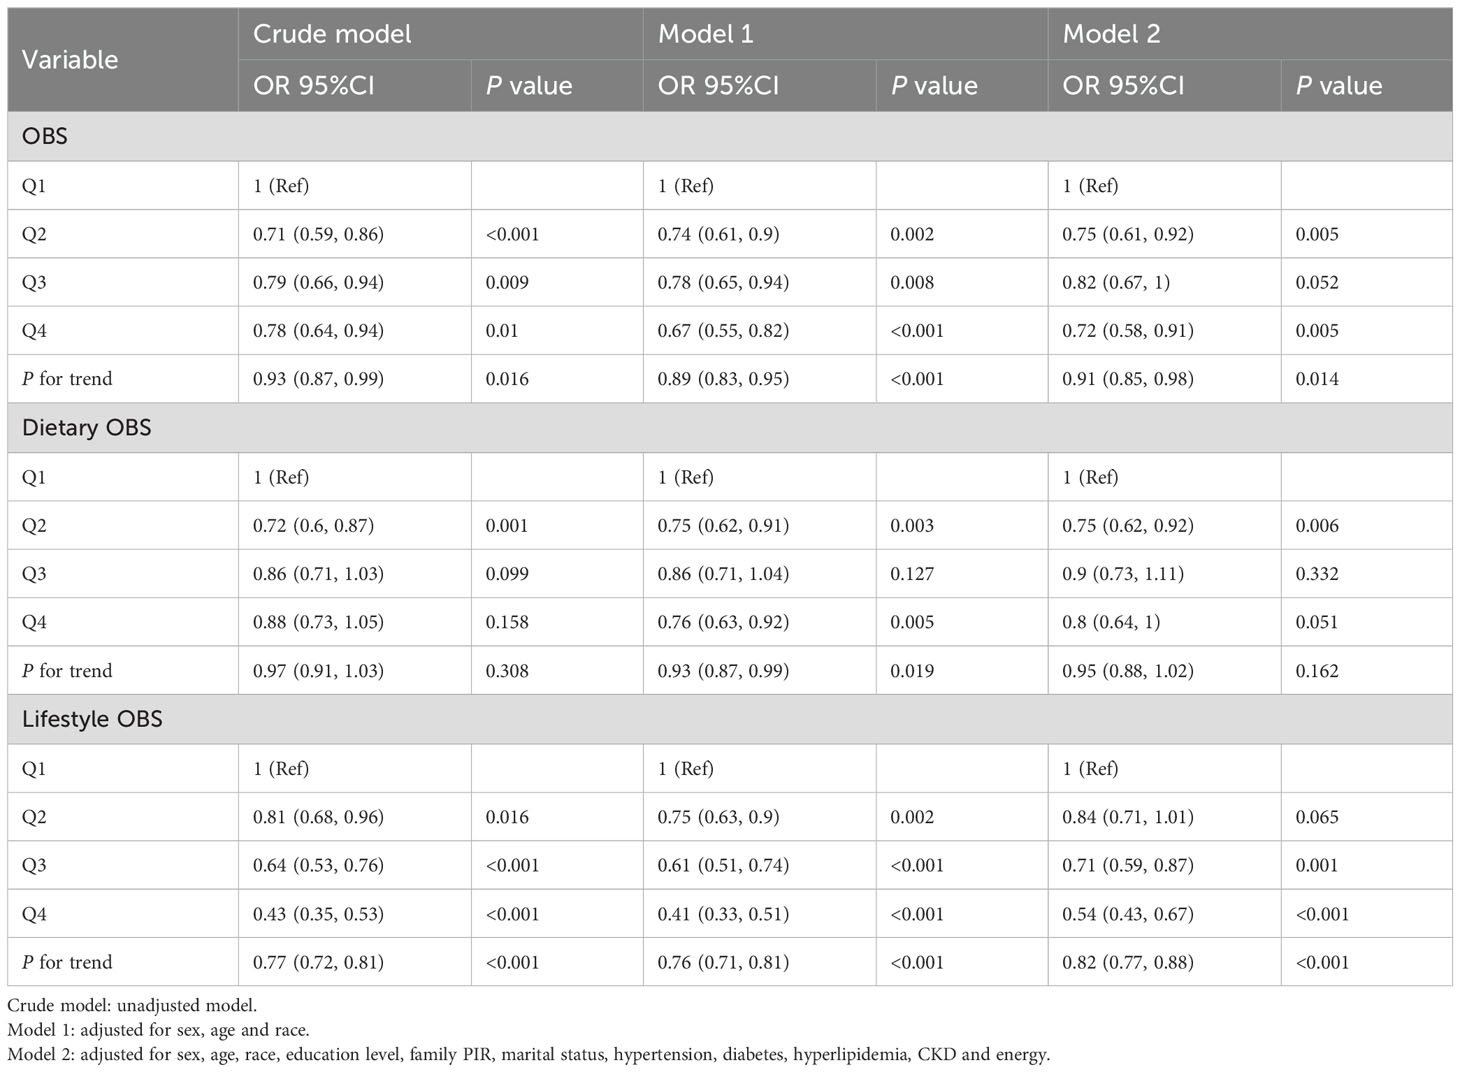
As shown in Table 4, logistic regression analysis found a significant negative association between OBS and gout. In the fully adjusted model (Model 2), OBS was associated with a lower risk of gout in Q4 compared to Q1 (OR = 0.72 (0.58, 0.91), p = 0.005), and this association maintained relative stability across models. The trend test indicated a statistically significant downward trend (p for trend=0.014). When examining lifestyle OBS, individuals in Q4 exhibited a decreased risk of gout (OR = 0.54 (0.43, 0.67), p < 0.001). However, the associations between dietary OBS and gout were not statistically significant in Q3 and Q4 compared to Q1 after adjusting for all confounders. Only participants in Q2 of dietary OBS exhibited a statistically significant decrease in the risk of gout compared to Q1 (OR=0.75 (0.62, 0.92), p = 0.006) in Model 2.
3.5 Subgroup analysis
Subgroup analyses and interaction tests, stratified by sex, age, education level, race, family PIR, hypertension, diabetes, hyperlipidemia, and CKD, were conducted to identify potential variations across different populations. In hyperuricemia, as shown in Figure 2, statistical significance was found in hypertension and diabetes subgroups (P for interaction =0.002, P for interaction =0.004, respectively). The negative association effect of OBS with hyperuricemia was significantly greater in participants without hypertension (OR=0.96 (0.95, 0.97)) than in those with hypertension (OR = 0.98 (0.97, 0.99)). Similarly, the negative association effect of OBS was significantly greater in participants without diabetes (OR = 0.97 (0.96, 0.98)) than in those with diabetes (OR = 0.99 (0.98, 1.01)). In the analysis of gout prevalence (Figure 3), statistical significance was found in gender subgroups (P for interaction =0.008). A considerably stronger negative association between OBS and the prevalence of gout was observed in females (OR=0.97 (0.95, 0.99)) compared to males (OR=0.99 (0.98, 1)). Despite some inconsistent effect values in certain subgroups, our findings suggest that the negative association between OBS and hyperuricemia/gout was consistently maintained across all subgroups.
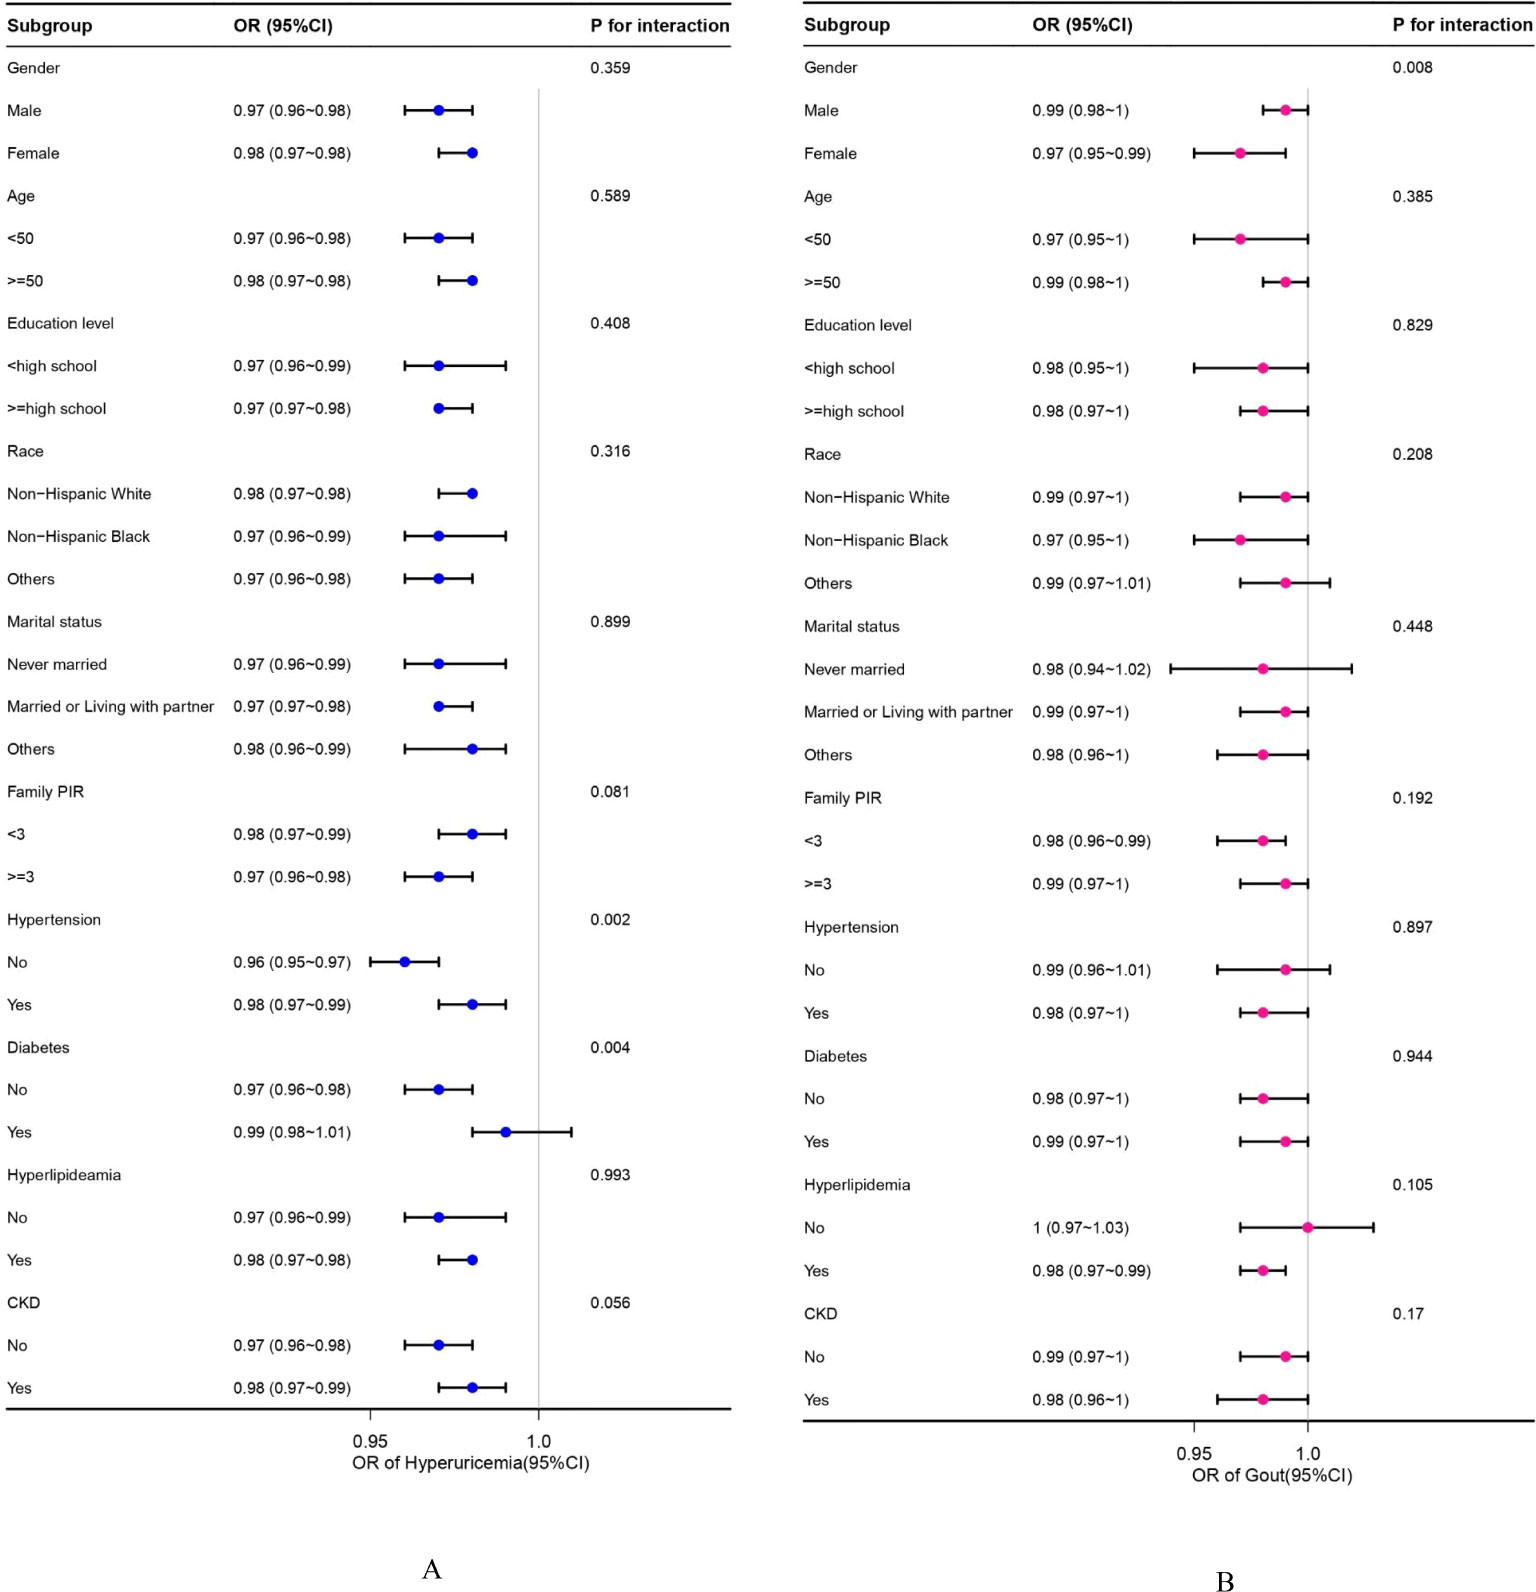
Figure 2. (A, B) Subgroup analyses between OBS and hyperuricemia/gout. (A) Hyperuricemia; (B) Gout. OR values are based on different population stratifications, estimated using a multivariable logistic regression model to assess the OR and 95% CI between OBS and hyperuricemia/gout. P for interaction values pertains to the significance of models considering interaction terms between OBS and various variables (sex, age, race, education level, family PIR, marital status, hypertension, diabetes, hyperlipidemia, and CKD) except for the stratification component itself. OBS, oxidative balance score; OR, odds ratio; CI, confidence intervals; CKD, chronic kidney disease.
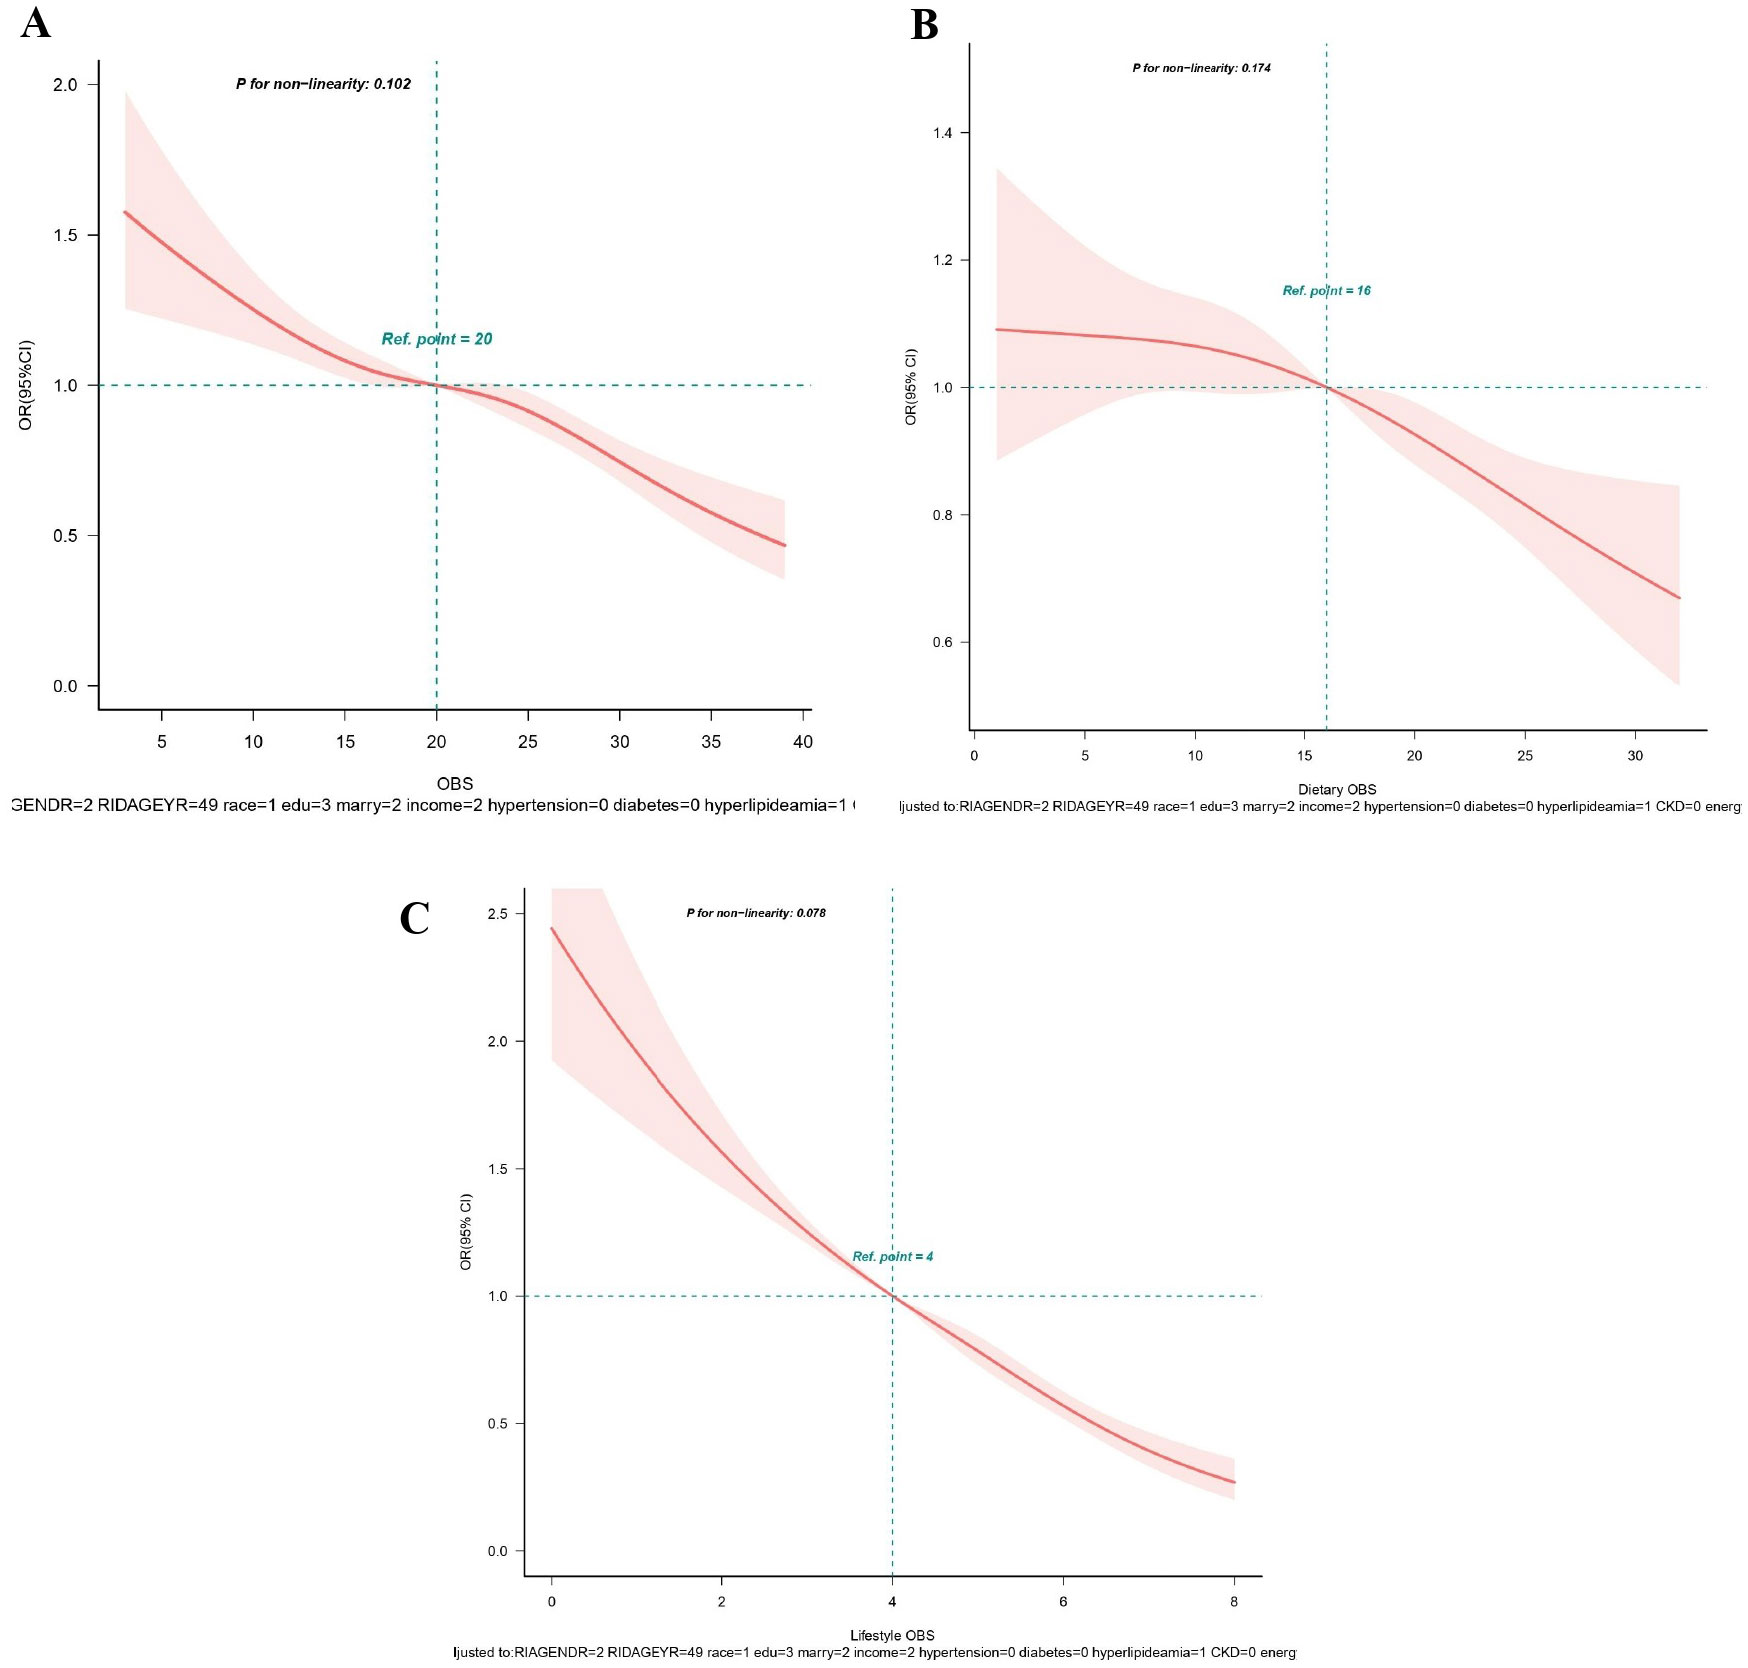
Figure 3. (A-C) Restricted spline curves for the associations between all OBS and hyperuricemia. (A) OBS; (B) Dietary OBS; (C) Lifestyle OBS. Red lines represent the OR and red transparent areas represent the 95% CI. OR (95% CI) were all adjusted according to Model 2. OBS, oxidative balance score; OR, odds ratio; CI, confidence intervals.
3.6 RCS analysis
From RCS analysis based on multivariable logistic regression adjusting for all covariates, a linear association was observed between OBS, dietary OBS, and lifestyle OBS and the prevalence of hyperuricemia (all p for non−linear > 0.05) (Figures 3A–C). A significant nonlinear relationship was identified between OBS and the risk of gout (p for non-linear < 0.05, Figure 4A). Figures 4B, C display that dietary OBS and lifestyle OBS were negatively and linearly associated with the risk of gout (p for non-linear > 0.05). These findings indicate that higher OBS is related to a lower prevalence of hyperuricemia and gout.
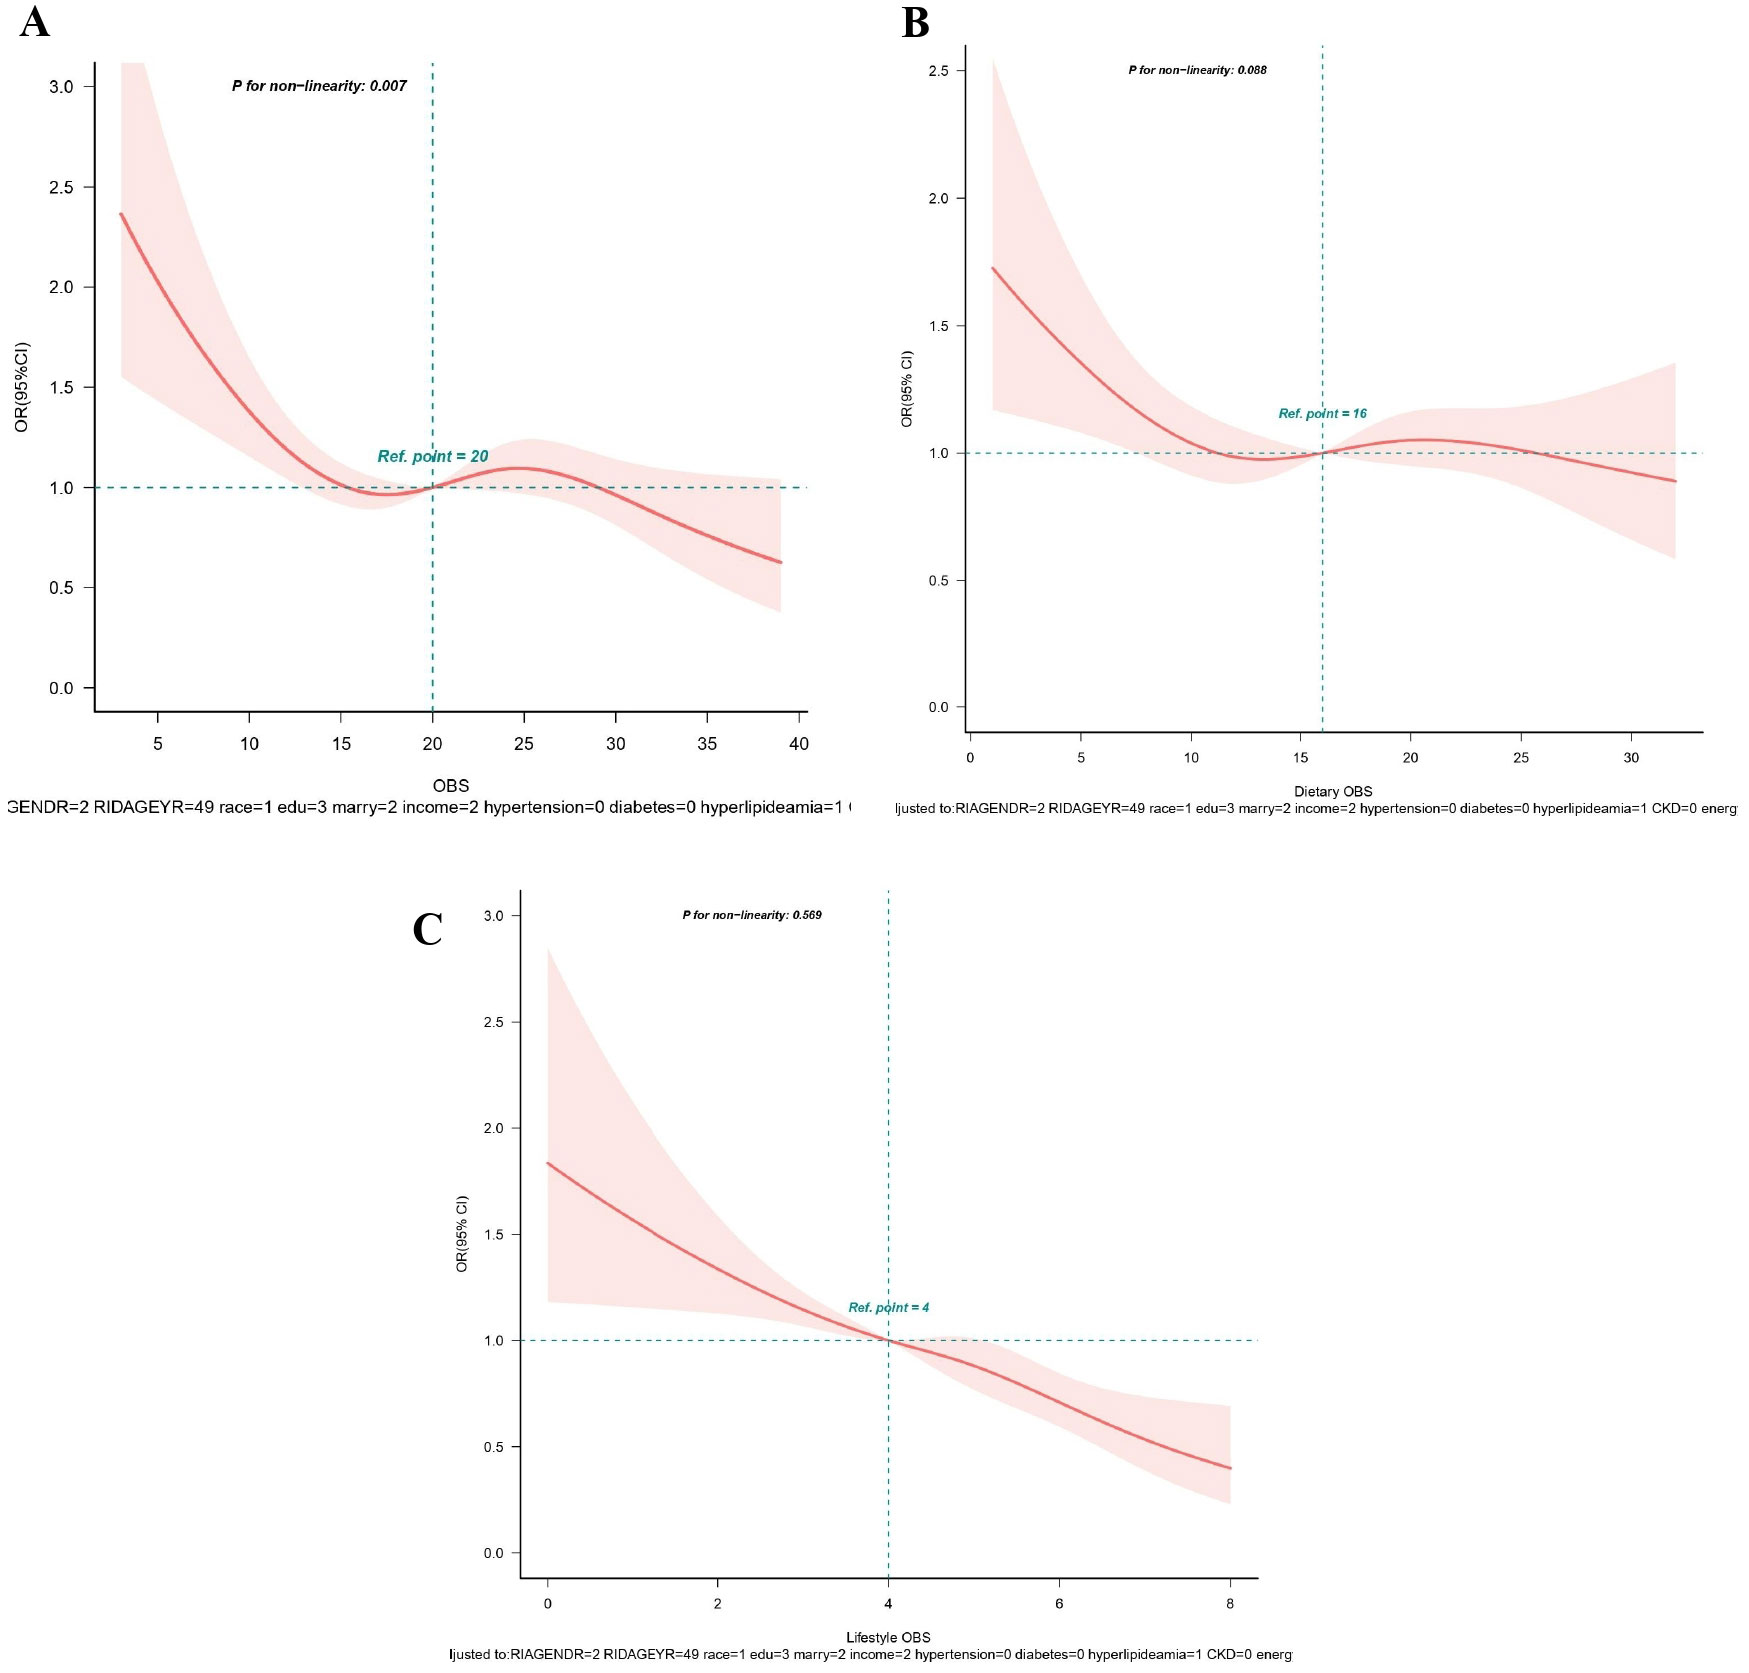
Figure 4. (A-C) Restricted spline curves for the associations between all OBS and gout. (A) OBS; (B) Dietary OBS; (C) Lifestyle OBS. Red lines represent the OR and red transparent areas represent the 95% CI. OR (95% CI) were all adjusted according to Model 2. OBS, oxidative balance score; OR, odds ratio; CI, confidence intervals.
4 Discussion
To illuminate the relationship between OBS and hyperuricemia/gout, we conducted a cross-sectional analysis of 18998 individuals in the NHANES cohort. Our study found that total OBS was negatively associated with the levels of UA and the prevalence of hyperuricemia/gout. In addition, both dietary and lifestyle components exhibited independent associations with UA and hyperuricemia. Besides, the risk of gout was observed with higher OBS in lifestyle components. These associations remained significant even after adjusting for potential confounders, suggesting that increased exposure to antioxidants and decreased exposure to pro-oxidants, as indicated by a higher OBS, could potentially reduce the risk of hyperuricemia/gout. To the best of our knowledge, our research is the first comprehensive retrospective study to investigate the association between OBS and hyperuricemia/gout prevalence. It may be considered a good indicator of hyperuricemia/gout prevalence. These findings may provide some potential theoretical reference for the prevention of hyperuricemia/gout through oxidative stress.
The pathogenesis of hyperuricemia/gout is multifactorial and complex, involving a mix of genetic, environmental, and dietary factors (9). Mechanistically, oxidative stress is essentially due to an imbalance between pro-oxidants and antioxidants in the body, which is considered a major contributor to cellular damage and disease progression (23). Existing evidence indicates that UA has complex chemical and biological actions, featuring antioxidant properties with potential protective effects (2). However, it can also act as a pro-oxidant, contributing to the development of diseases such as hypertension, metabolic syndrome, and cardiovascular diseases (2). The exact role of UA in oxidative stress is not fully elucidated and may depend on its chemical microenvironment (2, 23). Increasing evidence suggests that some of the harmful intracellular effects induced by UA are mediated by oxidative stress. For instance, during the UA metabolism process, xanthine oxidoreductase (XOR) catalyzes the hydroxylation of hypoxanthine to xanthine, inducing the generation of ROS, subsequently resulting in an imbalance in redox signaling (24). Additionally, animal experiments have indicated that hyperuricemia-induced renal oxidative stress promotes mitochondrial dysfunction and reduced ATP levels in rats (25). Furthermore, a study conducted by Sánchez-Lozada et al. demonstrated that an elevated UA concentration exacerbates intracellular ROS production through the activation of nicotinamide adenine dinucleotide phosphate (NADPH) oxidase (26). Our research results indicate that a high OBS exerts a protective effect against the development of hyperuricemia/gout, aligning with the current understanding of the role of oxidative stress in the pathogenesis of hyperuricemia/gout.
A longitudinal study has revealed that individuals with high genetic risk, who adhere to a healthy diet and lifestyle, experience a 40% reduction in the risk of developing hyperuricemia compared to those with unhealthy dietary and living habits (27). Similarly, maintaining a healthy diet and lifestyle is associated with a nearly one-third reduction in the risk of gout related to genetic factors (28). Regarding dietary factors, some studies propose that supplementing dietary antioxidants, such as dietary fiber (29), vitamin B2 (30), vitamin E (31), vitamin C (32), folate (33, 34), carotenoids (35), calcium (30), and zinc (34), may contribute to lower UA levels. Conversely, pro-oxidants, exemplified by fat (30) and iron (36) intake, are linked to elevated UA levels. In our study, the OBS incorporates various dietary and lifestyle factors to comprehensively assess an individual’s antioxidant and pro-oxidant status. The findings indicate that certain specific antioxidants within the OBS are significantly associated with a reduced risk of hyperuricemia and gout. Dietary fiber plays an important role in OBS. An experimental study has demonstrated that dietary fiber can reduce oxidative stress and inflammatory responses in hyperuricemic mice by regulating the Toll-like receptor 4/NF-κB signaling pathway. Additionally, dietary fiber shows potential in alleviating hyperuricemic by modulating the gut microbiota and metabolites (37). Vitamin E is also a potent antioxidant. It protects cell membranes from oxidative damage by inhibiting free radical production and reducing oxidative stress. Research has shown that higher vitamin E intake is associated with a lower risk of hyperuricemia (31). This suggests that vitamin E may mitigate the negative impact of oxidative stress on uric acid metabolism, thereby lowering the risk of hyperuricemia. Lifestyle factors also play a significant role, wherein an elevated body mass index (BMI) increases the risk of hyperuricemia, while physical activity lowers the risk (38). A study (39) has indicated that men with a BMI over 27.5 kg/m² have a 16-fold higher risk of gout compared to those with a BMI below 20 kg/m², and a 4-fold higher risk compared to those with a BMI under 25 kg/m². The impact of alcohol consumption on hyperuricemia/gout remains controversial (40), with some studies suggesting that moderate wine consumption may enhance endogenous UA clearance and prevent gout attacks, attributed to the presence of antioxidants and phytoestrogens in wine. In contrast, others argue occasional alcohol intake is associated with increased UA secretion and gout attacks (40). Considering the pro-oxidant nature of alcohol, in conjunction with our research findings, and taking into account other health issues associated with alcohol, we recommend limiting alcohol intake, especially for individuals with gout or those at risk. Interestingly, certain studies have reported that smokers exhibit significantly lower serum UA levels. This is attributed to prolonged exposure to cigarette smoke, which leads to a reduction in the production of endogenous UA with antioxidant defense capabilities (41). However, conflicting findings have been reported, suggesting higher UA levels in smokers (42).
Recognizing the potential antagonistic and synergistic effects of pro-oxidants or antioxidants, we employed the OBS as a comprehensive assessment of individual oxidative balance for the first time to study its impact on hyperuricemia/gout. Our research indicated that the OBS in the non-hyperuricemia/gout group was markedly higher than that in the hyperuricemia/gout group. Notably, we found that lifestyle OBS was more effective in reducing the risk of hyperuricemia compared to dietary OBS. According to NHANES III data (43), 44%, 9%, and 8% of the risk of hyperuricemia in the general adult population may be attributed to obesity, unhealthy diet, and alcohol consumption, respectively. A study suggests that dietary habits exert a greater impact on the likelihood of developing hyperuricemia in males, while lifestyle factors related to physical activity have a more significant impact on females (44). Surprisingly, an unexpected finding in our study was a seemingly insignificant correlation between dietary OBS and gout. The underlying mechanism remains unclear, possibly because gout is a multifactorial metabolic disease, and its pathogenesis should not rely solely on hyperuricemia or monosodium urate (MSU) crystal formation (45). However, a study using NHANES data indicated a negative correlation between a comprehensive dietary antioxidant index(CDAI), evaluated with zinc, selenium, carotenoids, and vitamins A, C, and E, and the prevalence of gout in U.S. adults (46). Therefore, future high-quality prospective studies are needed to further explore the relevant mechanisms.
In the subgroup analysis, our study indicated a significant impact of diabetes and hypertension on the relationship between OBS and hyperuricemia. A prospective investigation revealed an elevated risk of developing hyperuricemia in individuals with diabetes or hypertension at baseline (47). The potential influences of insulin resistance and renal sodium handling on the renal clearance rate of UA might contribute to explaining the increased prevalence of hyperuricemia in individuals with diabetes and hypertension (48). Consequently, we speculate that the protective effect of OBS against hyperuricemia may not be as pronounced in participants with these chronic diseases. In addition, our research suggested a notable gender influence on the correlation between OBS and gout. Specifically, in females, there is a significantly stronger negative correlation between OBS and the incidence of gout. It may be attributed to the differing roles of sex hormones in oxidative stress and uric acid metabolism. Estrogen, which is more prevalent in females, has been shown to have antioxidant properties that can enhance the body’s defense against oxidative stress. This hormone may reduce the production of ROS and increase the activity of antioxidant enzymes, thereby lowering oxidative damage and potentially reducing uric acid levels (49). A study has demonstrated that postmenopausal hormone therapy, whether estrogen alone or in combination with progestin, moderately reduces the risk of gout (50). In contrast, androgens, which are more prevalent in males, have been associated with increased oxidative stress and higher uric acid levels (50). These differences in hormone profiles could explain why females might experience a more pronounced protective effect from a high OBS, leading to a stronger association with reduced gout risk. Future research should explore whether different antioxidant interventions differ in effectiveness between men and women. Specifically, studies could investigate if tailored antioxidant supplementation or lifestyle modifications based on hormonal profiles could optimize the reduction of uric acid levels and prevent gout more effectively in each gender.
This study suggests that the OBS may be a valuable tool for managing hyperuricemia and gout. Clinicians could use OBS in dietary and lifestyle counseling by encouraging patients to increase antioxidant-rich foods, such as fruits and vegetables, while reducing pro-oxidative factors like processed foods, potentially lowering the risk of these conditions. However, implementing OBS-based interventions in clinical practice presents challenges. Calculating OBS requires detailed dietary and lifestyle information, which can be difficult to collect and interpret. Additionally, patients’ adherence may also vary, especially with significant lifestyle changes. Integrating OBS into clinical workflows may require additional training for healthcare providers and the development of supportive tools.
While antioxidants generally protect against oxidative stress, certain antioxidants may exhibit pro-oxidative effects at high doses, known as the “antioxidant paradox.” For example, high doses of vitamin C may generate ROS instead of neutralizing them (51). Similarly, high concentrations of synthetic vitamin E can exacerbate oxidative stress (52). The threshold at which antioxidants shift from protective to harmful effects varies depending on factors such as the specific antioxidant, the presence of metal ions, and the redox status of the cellular environment. These threshold effects are critical for interpreting our study’s findings. The OBS reflects the balance between pro-oxidative and antioxidative factors, with higher scores suggesting a more favorable oxidative balance. However, at high doses, antioxidants may become pro-oxidative, indicating this balance is not linear. Individuals with very high antioxidant intake may experience diminished or even adverse effects, which could complicate the relationship between OBS and disease risk. While our study supports the general protective role of antioxidants, future research should explore dose-dependent effects, identify conditions where antioxidants become pro-oxidative, and determine optimal intake levels to maximize benefits and minimize risks.
This study employed a nationally representative population-based investigation, ensuring the universality and representativeness of our findings. Additionally, we incorporated potential covariates based on previous research, significantly reducing the impact of confounding factors. Finally, the robustness and stability of our study results were underscored through stratified analysis and sensitivity analysis. However, inherent limitations do exist in our study. Firstly, due to its cross-sectional nature, establishing causation is not feasible. Secondly, although averaging the data from two 24-hour dietary recalls enhanced representativeness, it may not fully capture long-term dietary habits, considering potential recall bias and the limited variety of foods considered. Thirdly, the study did not account for potential threshold effects of antioxidants, as some antioxidants have demonstrated potential pro-oxidative activity at high doses or under specific conditions. Therefore, the results obtained are merely the outcome of statistical analysis, and future prospective research is needed to address these limitations and provide further insights.
5 Conclusion
In conclusion, this nationally representative cross-sectional study revealed that a higher OBS was associated with a decreased risk of developing hyperuricemia/gout. The finding underscores the importance of adhering to an antioxidant-rich diet and lifestyle, contributing to the prevention and treatment of hyperuricemia/gout. However, further research is necessary in future studies to investigate the causal relationship and precise mechanisms underlying the association between OBS and hyperuricemia/gout.
Data availability statement
The original contributions presented in the study are included in the article/Supplementary Material. Further inquiries can be directed to the corresponding authors.
Ethics statement
The studies involving humans were approved by The National Center for Health Statistics (NCHS) Ethics Review Board. The studies were conducted in accordance with the local legislation and institutional requirements. The participants provided their written informed consent to participate in this study.
Author contributions
YH: Conceptualization, Writing – review & editing, Writing – original draft. XC: Writing – original draft, Visualization. ZM: Writing – original draft, Formal Analysis. JW: Data curation, Writing – original draft. KL: Supervision, Writing – review & editing, Writing – original draft.
Funding
The author(s) declare that no financial support was received for the research, authorship, and/or publication of this article.
Acknowledgments
We express our gratitude to the participants and staff of the NHANES for their invaluable contributions to this study.
Conflict of interest
The authors declare that the research was conducted in the absence of any commercial or financial relationships that could be construed as a potential conflict of interest.
Publisher’s note
All claims expressed in this article are solely those of the authors and do not necessarily represent those of their affiliated organizations, or those of the publisher, the editors and the reviewers. Any product that may be evaluated in this article, or claim that may be made by its manufacturer, is not guaranteed or endorsed by the publisher.
Supplementary material
The Supplementary Material for this article can be found online at: https://www.frontiersin.org/articles/10.3389/fendo.2024.1402369/full#supplementary-material
References
1. Steunou A-S, Babot M, Durand A, Bourbon M-L, Liotenberg S, Miotello G, et al. Discriminating susceptibility of xanthine oxidoreductase family to metals. Microbiol Spectr. 11:e04814–22. doi: 10.1128/spectrum.04814-22
2. So A, Thorens B. Uric acid transport and disease. J Clin Invest. (2010) 120(6):1791–1799. doi: 10.1172/JCI42344
3. Richette P, Doherty M, Pascual E, Barskova V, Becce F, Castaneda J, et al. 2018 updated European League Against Rheumatism evidence-based recommendations for the diagnosis of gout. Ann Rheum Dis. (2020) 79:31–8. doi: 10.1136/annrheumdis-2019-215315
4. McQueen FM, Chhana A, Dalbeth N. Mechanisms of joint damage in gout: evidence from cellular and imaging studies. Nat Rev Rheumatol. (2012) 8:173–81. doi: 10.1038/nrrheum.2011.207
5. Tseng W-C, Chen Y-T, Ou S-M, Shih C-J, Tarng D-C. U-shaped association between serum uric acid levels with cardiovascular and all-cause mortality in the elderly: the role of malnourishment. J Am Heart Assoc. (2018) 7:e007523. doi: 10.1161/JAHA.117.007523
6. Kanbay M, Segal M, Afsar B, Kang D-H, Rodriguez-Iturbe B, Johnson RJ. The role of uric acid in the pathogenesis of human cardiovascular disease. Heart. (2013) 99:759–66. doi: 10.1136/heartjnl-2012-302535
7. Dehghan A, van Hoek M, Sijbrands EJG, Hofman A, Witteman JCM. High serum uric acid as a novel risk factor for type 2 diabetes. Diabetes Care. (2008) 31:361–2. doi: 10.2337/dc07-1276
8. Madero M, Sarnak MJ, Wang X, Greene T, Beck GJ, Kusek JW, et al. Uric acid and long-term outcomes in CKD. Am J Kidney Dis. (2009) 53:796–803. doi: 10.1053/j.ajkd.2008.12.021
9. Wu Z-D, Yang X-K, He Y-S, Ni J, Wang J, Yin K-J, et al. Environmental factors and risk of gout. Environ Res. (2022) 212:113377. doi: 10.1016/j.envres.2022.113377
10. Goodman M, Bostick RM, Dash C, Flanders WD, Mandel JS. Hypothesis: oxidative stress score as a combined measure of pro-oxidant and antioxidant exposures. Ann Epidemiol. (2007) 17:394–9. doi: 10.1016/j.annepidem.2007.01.034
11. Lakkur S, Bostick RM, Roblin D, Ndirangu M, Okosun I, Annor F, et al. Oxidative balance score and oxidative stress biomarkers in a study of Whites, African Americans, and African immigrants. Biomarkers. (2014) 19:471–80. doi: 10.3109/1354750X.2014.937361
12. Ilori TO, Sun Ro Y, Kong SY, Gutierrez OM, Ojo AO, Judd SE, et al. Oxidative balance score and chronic kidney disease. Am J Nephrol. (2015) 42:320–7. doi: 10.1159/000441623
13. Ilori TO, Wang X, Huang M, Gutierrez OM, Narayan KMV, Goodman M, et al. Oxidative balance score and the risk of end-stage renal disease and cardiovascular disease. Am J Nephrol. (2017) 45:338–45. doi: 10.1159/000464257
14. Lee J-H, Joo YB, Han M, Kwon SR, Park W, Park K-S, et al. Relationship between oxidative balance score and quality of life in patients with osteoarthritis: Data from the Korea National Health and Nutrition Examination Survey (2014-2015). Med (Baltimore). (2019) 98:e16355. doi: 10.1097/MD.0000000000016355
15. Golmohammadi M, Ayremlou P, Zarrin R. Higher oxidative balance score is associated with better glycemic control among Iranian adults with type-2 diabetes. Int J Vitam Nutr Res. (2021) 91:31–9. doi: 10.1024/0300-9831/a000596
16. Zhang W, Peng S-F, Chen L, Chen H-M, Cheng X-E, Tang Y-H. Association between the oxidative balance score and telomere length from the national health and nutrition examination survey 1999-2002. Oxid Med Cell Longev. (2022) 2022:1345071. doi: 10.1155/2022/1345071
17. Chen-Xu M, Yokose C, Rai SK, Pillinger MH, Choi HK. Contemporary prevalence of gout and hyperuricemia in the United States and decadal trends: the national health and nutrition examination survey, 2007-2016. Arthritis Rheumatol. (2019) 71:991–9. doi: 10.1002/art.40807
18. Elliott WJ. Systemic hypertension. Curr Probl Cardiol. (2007) 32:201–59. doi: 10.1016/j.cpcardiol.2007.01.002
19. Wu C, Ren C, Song Y, Gao H, Pang X, Zhang L. Gender-specific effects of oxidative balance score on the prevalence of diabetes in the US population from NHANES. Front Endocrinol (Lausanne). (2023) 14:1148417. doi: 10.3389/fendo.2023.1148417
20. National Cholesterol Education Program (NCEP) Expert Panel on Detection, Evaluation, and Treatment of High Blood Cholesterol in Adults (Adult Treatment Panel III). Third Report of the National Cholesterol Education Program (NCEP) Expert Panel on Detection, Evaluation, and Treatment of High Blood Cholesterol in Adults (Adult Treatment Panel III) final report. Circulation. (2002) 106:3143–421. doi: 10.1161/circ.106.25.3143
21. Kidney Disease: Improving Global Outcomes (KDIGO) Glomerular Diseases Work Group. KDIGO 2021 clinical practice guideline for the management of glomerular diseases. Kidney Int. (2021) 100:S1–S276. doi: 10.1016/j.kint.2021.05.021
22. Levey AS, Stevens LA, Schmid CH, Zhang YL, Castro AF, Feldman HI, et al. A new equation to estimate glomerular filtration rate. Ann Intern Med. (2009) 150:604–12. doi: 10.7326/0003-4819-150-9-200905050-00006
23. Liu N, Xu H, Sun Q, Yu X, Chen W, Wei H, et al. The role of oxidative stress in hyperuricemia and xanthine oxidoreductase (XOR) inhibitors. Oxid Med Cell Longevity. (2021) 2021:e1470380. doi: 10.1155/2021/1470380
24. Krishnan E. Inflammation, oxidative stress and lipids: the risk triad for atherosclerosis in gout. Rheumatol (Oxford). (2010) 49:1229–38. doi: 10.1093/rheumatology/keq037
25. Cristóbal-García M, García-Arroyo FE, Tapia E, Osorio H, Arellano-Buendía AS, Madero M, et al. Renal oxidative stress induced by long-term hyperuricemia alters mitochondrial function and maintains systemic hypertension. Oxid Med Cell Longev. (2015) 2015:535686. doi: 10.1155/2015/535686
26. Sánchez-Lozada LG, Soto V, Tapia E, Avila-Casado C, Sautin YY, Nakagawa T, et al. Role of oxidative stress in the renal abnormalities induced by experimental hyperuricemia. Am J Physiol Renal Physiol. (2008) 295:F1134–1141. doi: 10.1152/ajprenal.00104.2008
27. Zhang T, Gu Y, Meng G, Zhang Q, Liu L, Wu H, et al. Genetic risk, adherence to a healthy lifestyle, and hyperuricemia: the TCLSIH cohort study. Am J Med. (2023) 136:476–483.e5. doi: 10.1016/j.amjmed.2023.01.004
28. Zhang Y, Yang R, Dove A, Li X, Yang H, Li S, et al. Healthy lifestyle counteracts the risk effect of genetic factors on incident gout: a large population-based longitudinal study. BMC Med. (2022) 20:138. doi: 10.1186/s12916-022-02341-0
29. Koguchi T, Tadokoro T. Beneficial effect of dietary fiber on hyperuricemia in rats and humans: A review. Int J Vitam Nutr Res. (2019) 89:89–108. doi: 10.1024/0300-9831/a000548
30. Zykova SN, Storhaug HM, Toft I, Chadban SJ, Jenssen TG, White SL. Cross-sectional analysis of nutrition and serum uric acid in two Caucasian cohorts: the AusDiab Study and the Tromsø study. Nutr J. (2015) 14:49. doi: 10.1186/s12937-015-0032-1
31. Zhang L, Shi X, Yu J, Zhang P, Ma P, Sun Y. Dietary vitamin E intake was inversely associated with hyperuricemia in US adults: NHANES 2009-2014. Ann Nutr Metab. (2020) 76:354–60. doi: 10.1159/000509628
32. Juraschek SP, Miller ER, Gelber AC. Effect of oral vitamin C supplementation on serum uric acid: a meta-analysis of randomized controlled trials. Arthritis Care Res (Hoboken). (2011) 63:1295–306. doi: 10.1002/acr.20519
33. Qin X, Li Y, He M, Tang G, Yin D, Liang M, et al. Folic acid therapy reduces serum uric acid in hypertensive patients: a substudy of the China Stroke Primary Prevention Trial (CSPPT). Am J Clin Nutr. (2017) 105:882–9. doi: 10.3945/ajcn.116.143131
34. Sun X, Wen J, Guan B, Li J, Luo J, Li J, et al. Folic acid and zinc improve hyperuricemia by altering the gut microbiota of rats with high-purine diet-induced hyperuricemia. Front Microbiol. (2022) 13:907952. doi: 10.3389/fmicb.2022.907952
35. Ford ES, Choi HK. Associations between concentrations of uric acid with concentrations of vitamin A and beta-carotene among adults in the United States. Nutr Res. (2013) 33:995–1002. doi: 10.1016/j.nutres.2013.08.008
36. Wang Y, Yang Z, Wu J, Xie D, Yang T, Li H, et al. Associations of serum iron and ferritin with hyperuricemia and serum uric acid. Clinical Rheumatology. (2020) 39(12):3777–3785. doi: 10.1007/s10067-020-05164
37. Wang Y, Miao F, Wang J, Zheng M, Yu F, Yi Y. The ameliorative and neuroprotective effects of dietary fibre on hyperuricaemia mice: a perspective from microbiome and metabolome. Br J Nutr. (2024) 132(3):275–88. doi: 10.1017/S0007114524001211
38. Zhou J, Wang Y, Lian F, Chen D, Qiu Q, Xu H, et al. Physical exercises and weight loss in obese patients help to improve uric acid. Oncotarget. (2017) 8:94893–9. doi: 10.18632/oncotarget.22046
39. Williams PT. Effects of diet, physical activity and performance, and body weight on incident gout in ostensibly healthy, vigorously active men. Am J Clin Nutr. (2008) 87:1480–7. doi: 10.1093/ajcn/87.5.1480
40. Nieradko-Iwanicka B. The role of alcohol consumption in pathogenesis of gout. Crit Rev Food Sci Nutr. (2022) 62:7129–37. doi: 10.1080/10408398.2021.1911928
41. Haj Mouhamed D, Ezzaher A, Neffati F, Douki W, Gaha L, Najjar MF. Effect of cigarette smoking on plasma uric acid concentrations. Environ Health Prev Med. (2011) 16:307–12. doi: 10.1007/s12199-010-0198-2
42. Jang YS, Nerobkova N, Yun I, Kim H, Park E-C. Association between smoking behavior and serum uric acid among the adults: Findings from a national cross-sectional study. PloS One. (2023) 18:e0285080. doi: 10.1371/journal.pone.0285080
43. Choi HK, McCormick N, Lu N, Rai SK, Yokose C, Zhang Y. Population impact attributable to modifiable risk factors for hyperuricemia. Arthritis Rheumatol. (2020) 72:157–65. doi: 10.1002/art.41067
44. Liu L, Lou S, Xu K, Meng Z, Zhang Q, Song K. Relationship between lifestyle choices and hyperuricemia in Chinese men and women. Clin Rheumatol. (2013) 32:233–9. doi: 10.1007/s10067-012-2108-z
45. Zhang W-Z. Why does hyperuricemia not necessarily induce gout? Biomolecules. (2021) 11:280. doi: 10.3390/biom11020280
46. Hu W, Ye Z, Li T, Shi Z. Associations between composite dietary antioxidant index and gout: national health and nutrition examination survey 2007-2018. Biol Res Nurs. (2024) 26:150–9. doi: 10.1177/10998004231198166
47. McAdams-DeMarco MA, Law A, Maynard JW, Coresh J, Baer AN. Risk factors for incident hyperuricemia during mid-adulthood in African American and white men and women enrolled in the ARIC cohort study. BMC Musculoskelet Disord. (2013) 14:347. doi: 10.1186/1471-2474-14-347
48. Perez-Ruiz F, Aniel-Quiroga MA, Herrero-Beites AM, Chinchilla SP, Erauskin GG, Merriman T. Renal clearance of uric acid is linked to insulin resistance and lower excretion of sodium in gout patients. Rheumatol Int. (2015) 35:1519–24. doi: 10.1007/s00296-015-3242-0
49. Chainy GBN, Sahoo DK. Hormones and oxidative stress: an overview. Free Radic Res. (2020) 54:1–26. doi: 10.1080/10715762.2019.1702656
50. Hak AE, Curhan GC, Grodstein F, Choi HK. Menopause, postmenopausal hormone use and risk of incident gout. Ann Rheum Dis. (2010) 69:1305–9. doi: 10.1136/ard.2009.109884
51. Buettner GR. The pecking order of free radicals and antioxidants: lipid peroxidation, α-tocopherol, and ascorbate. Arch Biochem Biophysics. (1993) 300:535–43. doi: 10.1006/abbi.1993.1074
Keywords: oxidative balance score, hyperuricemia, gout, NHANES, antioxidants, oxidative stress
Citation: He Y, Chen X, Ma Z, Wang J and Lin K (2024) Association of oxidative balance score with hyperuricemia and gout: NHANES 2009-2018. Front. Endocrinol. 15:1402369. doi: 10.3389/fendo.2024.1402369
Received: 23 April 2024; Accepted: 15 October 2024;
Published: 04 November 2024.
Edited by:
Jixin Zhong, Huazhong University of Science and Technology, ChinaReviewed by:
Hongrui Li, University of North Carolina at Chapel Hill, United StatesJia Peng, University of Kentucky, United States
Min Zhang, University of Kentucky, United States, in collaboration with reviewer JP
Copyright © 2024 He, Chen, Ma, Wang and Lin. This is an open-access article distributed under the terms of the Creative Commons Attribution License (CC BY). The use, distribution or reproduction in other forums is permitted, provided the original author(s) and the copyright owner(s) are credited and that the original publication in this journal is cited, in accordance with accepted academic practice. No use, distribution or reproduction is permitted which does not comply with these terms.
*Correspondence: Kun Lin, am9ybmJhckAxMjYuY29t
 Yiting He
 Xiaojing Chen1