 Rebecca L. Schill1
 Jack Visser1
 Mariah L. Ashby1Ziru Li1Kenneth T. Lewis1
 Antonio Morales-Hernandez2Keegan S. Hoose1Jessica N. Maung1Romina M. Uranga1
 Hadla Hariri1Isabel D. K. Hermsmeyer1
 Hiroyuki Mori1
 Ormond A. MacDougald1,3*
- 1Department of Molecular & Integrative Physiology, University of Michigan, Ann Arbor, MI, United States
- 2Department of Periodontics and Oral Medicine, University of Michigan School of Dentistry, Ann Arbor, MI, United States
- 3Department of Internal Medicine, University of Michigan, Ann Arbor, MI, United States
Introduction: Unlike white adipose tissue depots, bone marrow adipose tissue (BMAT) expands during caloric restriction (CR). Although mechanisms for BMAT expansion remain unclear, prior research suggested an intermediary role for increased circulating glucocorticoids.
Methods: In this study, we utilized a recently described mouse model (BMAd-Cre) to exclusively target bone marrow adipocytes (BMAds) for elimination of the glucocorticoid receptor (GR) (i.e. Nr3c1) whilst maintaining GR expression in other adipose depots.
Results: Mice lacking GR in BMAds (BMAd-Nr3c1-/-) and control mice (BMAd-Nr3c1+/+) were fed ad libitum or placed on a 30% CR diet for six weeks. On a normal chow diet, tibiae of female BMAd-Nr3c1-/- mice had slightly elevated proximal trabecular metaphyseal bone volume fraction and thickness. Both control and BMAd-Nr3c1-/- mice had increased circulating glucocorticoids and elevated numbers of BMAds in the proximal tibia following CR. However, no significant differences in trabecular and cortical bone were observed, and quantification with osmium tetroxide and μCT revealed no difference in BMAT accumulation between control or BMAd-Nr3c1-/- mice. Differences in BMAd size were not observed between BMAd-Nr3c1-/- and control mice. Interestingly, BMAd-Nr3c1-/- mice had decreased circulating white blood cell counts 4 h into the light cycle.
Discussion: In conclusion, our data suggest that eliminating GR from BMAd has minor effects on bone and hematopoiesis, and does not impair BMAT accumulation during CR.
Introduction
Adipocytes are widely distributed throughout the human body, and their physiological functions differ depending on location. Bone marrow adipose tissue (BMAT) is a unique adipocyte depot located within the medullary cavity of bones. While the presence of BMAT has been known since the late 19th century, the physiological importance of BMAT remains incompletely understood. Humans are born with very little BMAT, but it gradually expands with age, and by adulthood, BMAT constitutes about 50-70% of total marrow volume (1). Two types of BMAT have previously been described (2). Constitutive BMAT (cBMAT) is located within the distal region of long bones and in caudal vertebrae, and as suggested by the name, remains constitutively present despite a wide variety of physiological interventions. Alternatively, regulated BMAT (rBMAT) is in proximal tibia and distal femur. rBMAT is typically seen as single cells or in small clusters of adipocytes interspersed with hematopoietic cellularity. rBMAT volume changes under a variety of physiological and pathological conditions. For example, cold exposure, acute myeloid leukemia, exercise, and lactation lead to decreased rBMAT volume (3). Alternatively, expansion of rBMAT is observed with type 1 and type 2 diabetes, obesity, growth hormone deficiencies, impaired hematopoiesis, osteoporosis, as well as caloric restriction (CR) (3). BMAT also functions to influence bone and hematopoiesis by serving as an endocrine organ, contributing to circulating concentrations of adiponectin, stem-cell factor, leptin, and receptor activator for NF-κB (RANK) ligand (4–6).
Bone is a dynamic organ that responds to local and systemic stimuli to regulate resorption and formation of bone. Most human and mouse data suggest an inverse relationship between bone marrow adiposity and bone mineral density (7); however, this is not always the case. In C57Bl/6J mice, long-term high fat diet leads to increased BMAT with variable loss to trabecular and cortical bone mass (8, 9). Following bariatric surgery in mice, there is a dramatic loss of BMAT, in addition to a loss trabecular and cortical bone mass (10). Recent work demonstrates that BMAT has a negative effect on bone mass, although, under conditions of energy deficit, BMAT lipolysis helps to maintain bone mass (11). BMAds arise from skeletal stem cells, which also give rise to osteoblasts. Fate determination is controlled by several key transcription factors including runt-related transcription factor 2 (Runx2) and osterix (Osx), which promote osteoblastogenesis (12, 13) and proliferator-activated receptor gamma (PPARγ) and CCAAT/enhancer-binding protein alpha (C/EBPα), which promote adipogenesis (14). The bone marrow microenvironment is complex. In addition to impacting bone health, BMAds have also been shown to influence hematopoiesis. Several studies have suggested that BMAds are a negative regulator of hematopoiesis (15, 16). However, other studies suggest that BMAds support the function of hematopoietic cells (11, 17, 18). Thus, interactions between BMAT and other cell types within the marrow are complex and remain poorly understood.
CR has been shown to increase lifespan and improve overall metabolic health (19). Unlike white adipose tissue (WAT), BMAT paradoxically increases during CR (20), suggesting that BMAT and WAT are metabolically and functionally distinct. The physiological purpose for increased BMAT with CR is unknown; however, a recent study from Li et al. demonstrates that lipolysis of BMAds helps to fuel the bone and myelopoiesis during times of CR (11). M olecular signals that lead to these changes in BMAT volume remain poorly understood. Previous hypotheses have included potential roles for leptin, estradiol, fibroblast growth factor 21, ghrelin, and cortisol (21–25). Previously, Cawthorn et al. (26) showed that CR in female mice leads to BMAT increase, without changes in circulating leptin concentrations. Using mice and rabbits, these studies also showed that BMAT expansion was observed only when circulating corticosterone concentrations were elevated, implying a potential role for glucocorticoids in BMAT expansion following CR.
Glucocorticoids (GC) are corticosteroids that are essential for vertebrate biology. Due to their anti-inflammatory effects, they are widely used to treat a variety of inflammatory diseases. Glucocorticoids are mainly synthesized by the cortex of the adrenal gland. Production of GCs is regulated by the hypothalamic-pituitary-adrenal axis. Mechanisms of action by GCs are also tightly regulated by enzymatic conversion between active and inactive forms. Two enzymes regulate the conversion between active and inactive GCs. 11β-hydroxysteroid dehydrogenase 1 (11β-HSD1) catalyzes the conversion of inactive cortisone (11-dehydrocorticosterone in mice) to active cortisol (corticosterone in mice), while 11β-HSD2 performs the opposite conversion (27, 28). GCs bind to the glucocorticoid receptor (GR, gene name Nr3c1), a member of the nuclear receptor family. This receptor functions to regulate GC-responsive genes. Furthermore, activation of GRs is regulated by its subcellular distribution. When unbound, GR resides in the cytosol as a monomer, stabilized by several heat shock proteins. Once bound by a GC, a conformation change occurs, leading to exposure of two nuclear localization signals, at which point GR is transported to the nucleus. Once nuclear, GR directly binds DNA through GC-response elements. The effects of GC on adipose tissue are complex. Under most circumstances, GC stimulates fatty acid uptake and lipolysis in adipocytes (29, 30). Chronic GC treatment leads to metabolic impacts such as insulin resistance, dyslipidemia, and obesity (31). GC are present in almost all adipocyte differentiation protocols (32). In particular, the use of dexamethasone, a synthetic GR ligand, is common. Several groups have used adipocyte GR-knockout models with mixed results (31). Most studies demonstrate that GR is not required for development or maintenance of adipose depots (33–35). However, some studies suggest it may play an important role during high-fat diet feeding (36). Importantly, none of these studies have investigated the impact of adipocyte GR on bone biology.
To investigate the role of GC in BMAT expansion, we utilized a previously described BMAd-specific Cre mouse model to knock out GRs in BMAds (11). Female BMAd-Nr3c1-/- mice had a small but significant increase in trabecular bone volume fraction (Tb. BV/TV), trabecular thickness, and distal tibial bone volume (BV). Male BMAd-Nr3c1-/- mice did not show changes in bone parameters. Loss of GR in BMAds did not alter the response of young or adult male mice to CR. However, BMAd-Nr3c1-/- mice had decreased circulating white blood cells in the light cycle without changes to hematopoietic progenitor populations, suggesting that GRs in BMAds may play a regulatory role in hematopoiesis.
Materials and methods
Mouse generation, care, and housing
Generation and validation of the BMAd-specific Cre model were performed as previously described (11). By monitoring the conversion of cell membrane-localized tdTomato to cell membrane-localized EGFP, Cre efficiency was determined to be ~80% in both male and female mice over 16 weeks of age with one Cre allele, and over 90% with two Cre alleles (11). To generate BMAd-Nr3c1-/- mice, BMAd-specific Cre mice (11) were crossed to mice containing loxP sites flanking exon 3 of the Nr3c1 gene (Jax Strain #: 021021. ID: B6. Cg-Nr3c1tm1.1Jda/J (37)). Control BMAd-Nr3c1+/+ mice contain Osterix-Flpo and Flp-activated adiponectin-CRE but not the floxed Nr3c1. Since BMAd-Cre and Nr3c1-/- mice were initially obtained on mixed genetic backgrounds, and because a systematic breeding to congenicity was not performed, we monitored the background strain of BMAd-Nr3c1-/- (n=5; Transnetyx Inc, Cordova, TN). Our results demonstrated that these mice have an average observed frequency of the following sub-strains: 63.9% C57BL/6J, 13.2% C57BL/6NJ, and 33.4% C57BL/6. Three of the five mice demonstrated an observed frequency average of 17.6% 129S strain, with two mice showing nonsignificant amounts of the 129S strain. Together, these data indicate that mice used in these studies had a predominately C57BL/6 background. Control mice used in these studies are BMAd-Cre mice lacking loxP sites in the Nr3c1 gene. The presence of loxP sites and confirmation of recombination in BMAds was determined by PCR (see Genotyping and PCR). Mice were housed in a 12 h light/dark cycle in the Unit of Laboratory Animal Medicine at the University of Michigan, with free access to water. Unless indicated, mice were fed a normal chow diet (NCD) ad libitum (LabDiet 5LOD PicoLab). All procedures were approved by the University of Michigan Committee on the Use and Care of Animals.
Genotyping and PCR
The presence of flanking loxP sites on exon 3 of the mouse Nr3c1 gene was determined using PCR and the following primers:
Forward primer (Fwd): ATGCCTGCTAGGCAAATGAT
Reverse primer #1 (R1): TTCCAGGGCTATAGGAAGCA
Recombination and removal of exon 3 of the mouse Nr3c1 gene was determined using PCR and the following primers:
Forward primer (Fwd): ATGCCTGCTAGGCAAATGAT
Reverse primer #2 (R2): TTAAGACAGTCGTCTGGAATTCC
Caloric restriction
After acclimation to single housing and the control diet (D17110202; Research Diets) for two weeks, food intake was determined by giving a defined amount of food and weighing the remainder daily for 2 weeks. Individual adult male mice (starting age of 28-35 weeks, body weights of 26.5 g to 35.2 g) consumed approximately 2.42 g of food per day. As such, we provided 1.70 g of the nutrient-matched CR diet (D19051601; Research Diets) to mice daily to ensure 30% CR. Female mice consumed approximately 2.27 g of food per day and were therefore provided 1.59 g of the CR diet. Mice on CR consumed all the food provided and food was provided at ~2 pm daily.
Histology
Tissue histology was performed as previously described (10). Briefly, soft tissues were fixed in 10% formalin for 24 hours and embedded in paraffin for sectioning. Bones were fixed in formalin for 24 hours, decalcified in 14% EDTA for a minimum of 2 weeks, with fresh EDTA provided every 48 hours. Following decalcification, bones were fixed an additional 24 hours with 10% formalin. Bones were then embedded in paraffin and sectioned to 5 μm. After staining with hematoxylin and eosin (H&E), sectioned tissue was imaged on an Olympus BX52 microscope.
μCT analysis
Tibial bone parameters were measured using μCT as previously described (11, 38). Briefly, the entire tibia was scanned using a μCT system (μCT100 Scanco Medical, Bassersdorf, Switzerland). The following parameters were used: voxel size 12 µm, 70 kVp, 114 µA, 0.5 mm AL filter, and integration time 500 ms. Mid-cortical bone: a total of 30 slices (360 µm) were analyzed. The starting slice number was determined using the following equation: Starting slice = [(Tib/fib junction slice #) – (growth plate slice #)] x 0.7 + (growth plate slice #). Trabecular bone: a total of 50 slices (600 µm) were analyzed, initiated 5 slices distal to the proximal tibial growth plate. Distal cortical bone: slices were analyzed starting at the junction of the tibia and fibula and continuing to the distal end of the cortical bone, where distal trabecular bone is first observed (~450 slices, ~5.4 mm). Schematic of tibial bone locations use for µCT is present within relevant figures.
Osmium tetroxide staining and BMAd quantification
Mouse tibiae were fixed for 24 hours in formalin, then decalcified using 14% EDTA as previously described (10). Osmium tetroxide staining and μCT was performed as previously described (2, 38).
Circulating corticosterone measurements
Immediately following euthanasia, blood was harvested via cardiac punction, allowed to clot on ice for 2 hours and the serum was collected and stored at -80°C. To measure circulating corticosterone concentrations, an ELISA was performed per the manufacturer’s recommended protocols (Cayman Chemical, 501320, Ann Arbor, MI).
Complete blood count
Blood was harvested from the tail of BMAd-Nr3c1-/- and BMAd-Nr3c1+/+ mice and a complete blood count was performed by the University of Michigan Unit for Laboratory Animal Medicine Pathology Core using a Heska Element HT5 Veterinary Hematology Analyzer (Loveland, CO). Blood draws were performed at zeitgeber time 5 (ZT5; 10 am) and ZT17 (10 pm).
Bone marrow cellular quantification
Bone marrow was extracted from the femurs and tibiae of BMAd-Nr3c1-/- and BMAd-Nr3c1+/+ mice. Bones were crushed and incubated in Red Blood Cell lysis buffer (Sigma-Aldrich St. Louis, MO) for five minutes on ice. Bone marrow compartments were visualized by flow cytometry after staining with the following antibodies: LT-HSC/ST-HSC/MPP2/MPP3/MPP4 [B220-PerCP (RA3-6B2), CD3-PerCP (145-2C11), CD4-PerCP (GK1.5), CD8-PerCP (53-6.7), CD19-PerCP (6D5), Gr-1-PerCP (RB6-8C5), Ter119-PerCP (TER-119), Sca-1-PerCP-Cy5.5 (E13-161.7), c-Kit-APC-780 (2B8), CD150-PE-Cy7 (TC15-12F12.2), CD48-Alexa Fluor 700 (HM48-1), and Flt3-PE (A2F10.1)]; CMP/GMP/MEP [B220-PerCP (RA3-6B2), CD3-PerCP (145-2C11), CD4-PerCP (GK1.5), CD8-PerCP (53-6.7), CD19-PerCP (6D5), Gr-1-PerCP (RB6-Ter119-PerCP (TER-119), Sca-1-PerCP-Cy5.5 (E13-161.7), c-Kit-APC-780 (2B8), FcR II/III-Alexa Fluor 700 (93), CD34-FITC (RAM34), and IL-7R-PE-Cy7 (A7R34)]. All antibodies were used at 1:200 dilution except for CD34-FITC, which was used at 1:50 dilution. Populations were identified according to the following gating strategy: LT-HSC [Lineage-Sca1+cKit+ (LSK)CD48-CD150+Flt3-]; ST-HSC (LSK, CD48-CD150-Flt3-); MPP2 (LSK, CD48+CD150+Flt3-); MPP3 (LSK, CD48+CD150-Flt3-); MPP4 (LSK, CD48+CD150-Flt3+); CMP (Lineage-Sca1-cKit+CD34+ FcR II/IIImed); GMP (Lineage-Sca1-cKit+CD34+ FcR II/IIIhigh); MEP (Lineage-Sca1-cKit+CD34- FcR II/III-); CLP (Lineage-Sca1medcKitmedIL-7R+). DAPI (Sigma-Aldrich, St. Louis, MO) was used for dead cell exclusion. Data collection was performed using a Northern Lights (Cytek) flow cytometer. Data analyses were performed with FlowJo version 10 (LLC, Ashland, OR).
Statistics
Significant differences between groups were assessed using a two-sample t-test or ANOVA with post-tests as appropriate: one-way ANOVA with Tukey’s multiple comparisons test or two-way ANOVA with Sidak’s multiple comparisons test. All analyses were conducted using the GraphPad Prism version 9. All graphical presentations are mean ± SD. For statistical comparisons, a P-value of <0.05 was considered significant.
Results
Deletion of the GR in BMAds does not alter BMAT but slightly increases bone mass of proximal and distal tibia of female mice
To determine the roles of GR in BMAds we sought to selectively eliminate GR from BMAds while avoiding loss of GR in white adipocytes and osteoblasts. To do this, we utilized a recently described BMAd-specific Cre model (11). We crossed this BMAd-Cre line to mice containing loxP sites flanking exon 3 of the mouse GR gene (Nr3c1) (Figure 1A). We confirmed that recombination in BMAd-Nr3c1-/- mice occurred in caudal vertebrae and tibial bone marrow, where high amounts of BMAds are present (Figure 1B). No recombination was observed in subcutaneous WAT (sWAT), epididymal WAT (eWAT), or liver. In addition, RNA was isolated, converted to cDNA, and sequenced to confirm the presence of a product lacking exon 3 (not shown).
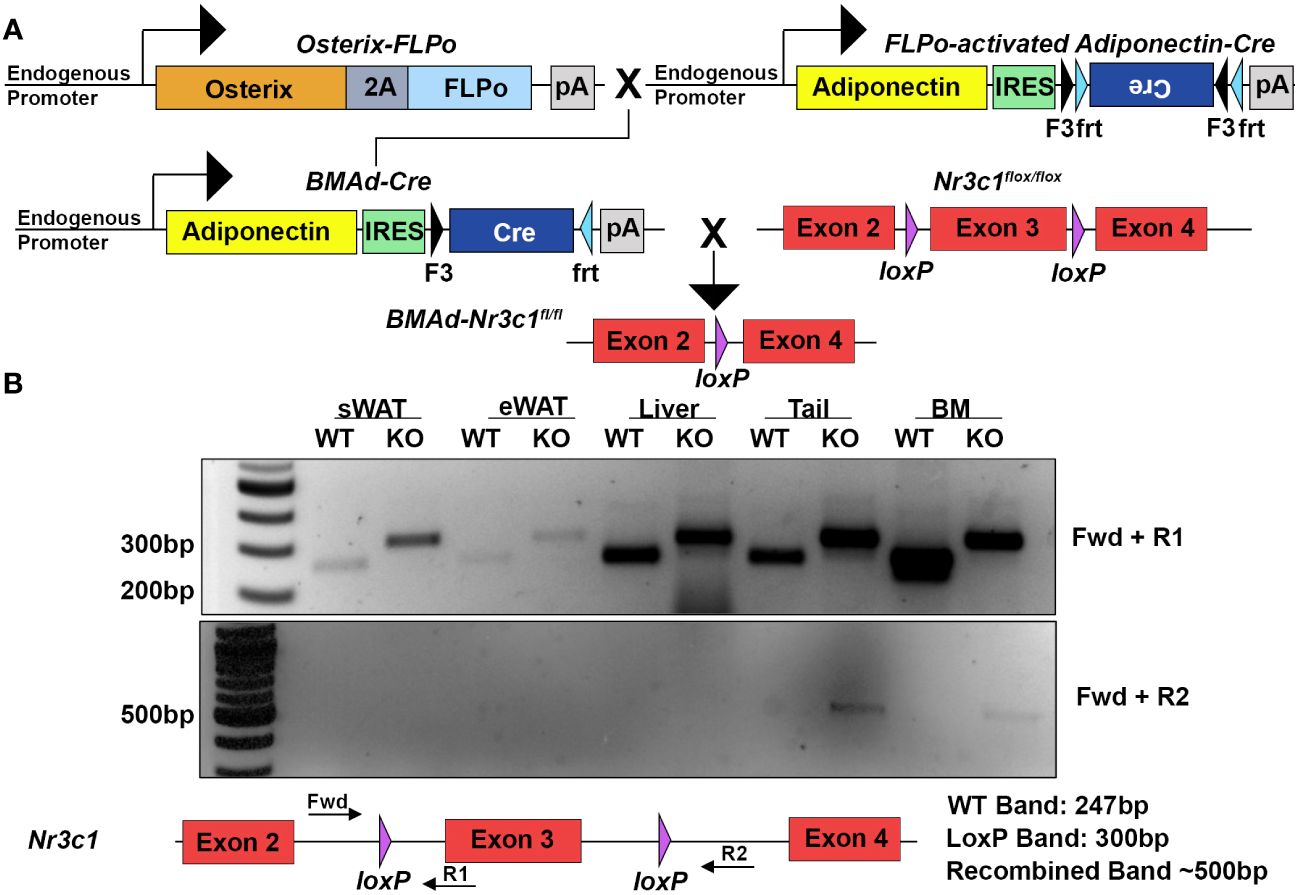
Figure 1 Deletion of GR specifically in BMAds using the BMAd-Cre mouse model. (A) Breeding strategy for generation of BMAd-Nr3c1-/- mice. (B) PCR amplification was used to detect the presence of loxP sites flanking exon 3 of Nr3c1 (top panel, primers Fwd + R1). PCR products demonstrate presence of a band lacking exon 3 (bottom panel, primers Fwd + R2) in tail and bone marrow (BM) of BMAd-Nr3c1-/- (KO) mice but not in subcutaneous WAT (sWAT), epididymal (eWAT), or liver. Recombination was not detected in BMAd-Nr3c1+/+ mice (WT).
We next investigated whether loss of GR in BMAds alters BMAT volume and/or tibial bone variables. Female BMAd-Nr3c1+/+ and BMAd-Nr3c1-/- mice (31-39 weeks old) on a NCD were euthanized and a necropsy performed. As expected, no significant differences were observed in body weight (Supplementary Figure 1A) or tissue weights of the sWAT, periovarian WAT (poWAT), liver, or spleen of BMAd-Nr3c1-/- mice compared to controls (Supplementary Figure 1B). We also did not observe histological changes to the WAT (Supplementary Figure 1C). Next, we determined if loss of GR in BMAds alters BMAT volume. Histological analyses showed no observable differences in BMAT histology in the tibiae or caudal vertebrae of BMAd-Nr3c1-/- mice compared to controls (Figure 2A). Qualitative histological analysis suggested a slight reduction in the proximal trabecular metaphyseal bone in the femur of female BMAd-Nr3c1-/- mice. To determine quantitatively whether the lack of GR in BMAds alters bone parameters, we performed μCT on the tibiae of BMAd-Nr3c1+/+ and BMAd-Nr3c1-/- mice. Female BMAd-Nr3c1-/- mice had a small but significant increase in proximal trabecular metaphyseal bone volume fraction and trabecular thickness (Figure 2B). No differences were observed in the mid-cortical region of the tibiae, where few BMAds are typically present (Figure 2C). Female BMAd-Nr3c1-/- mice also had a small but significant increase in cortical bone volume in the distal tibiae (Figure 2D). Although histological analysis suggested a slight reduction in trabecular bone in distal femur, male BMAd-Nr3c1-/- mice did not have differences in bone histology in tibiae or caudal vertebrae (Supplementary Figure 2A). Consistent with histological results, μCT did not reveal differences in b one parameters (Supplementary Figures 2B-D). These data indicate that at baseline, GR plays a dispensable role in size and number of BMAds and a minor role in inhibiting tibial bone mass in female but not male mice.
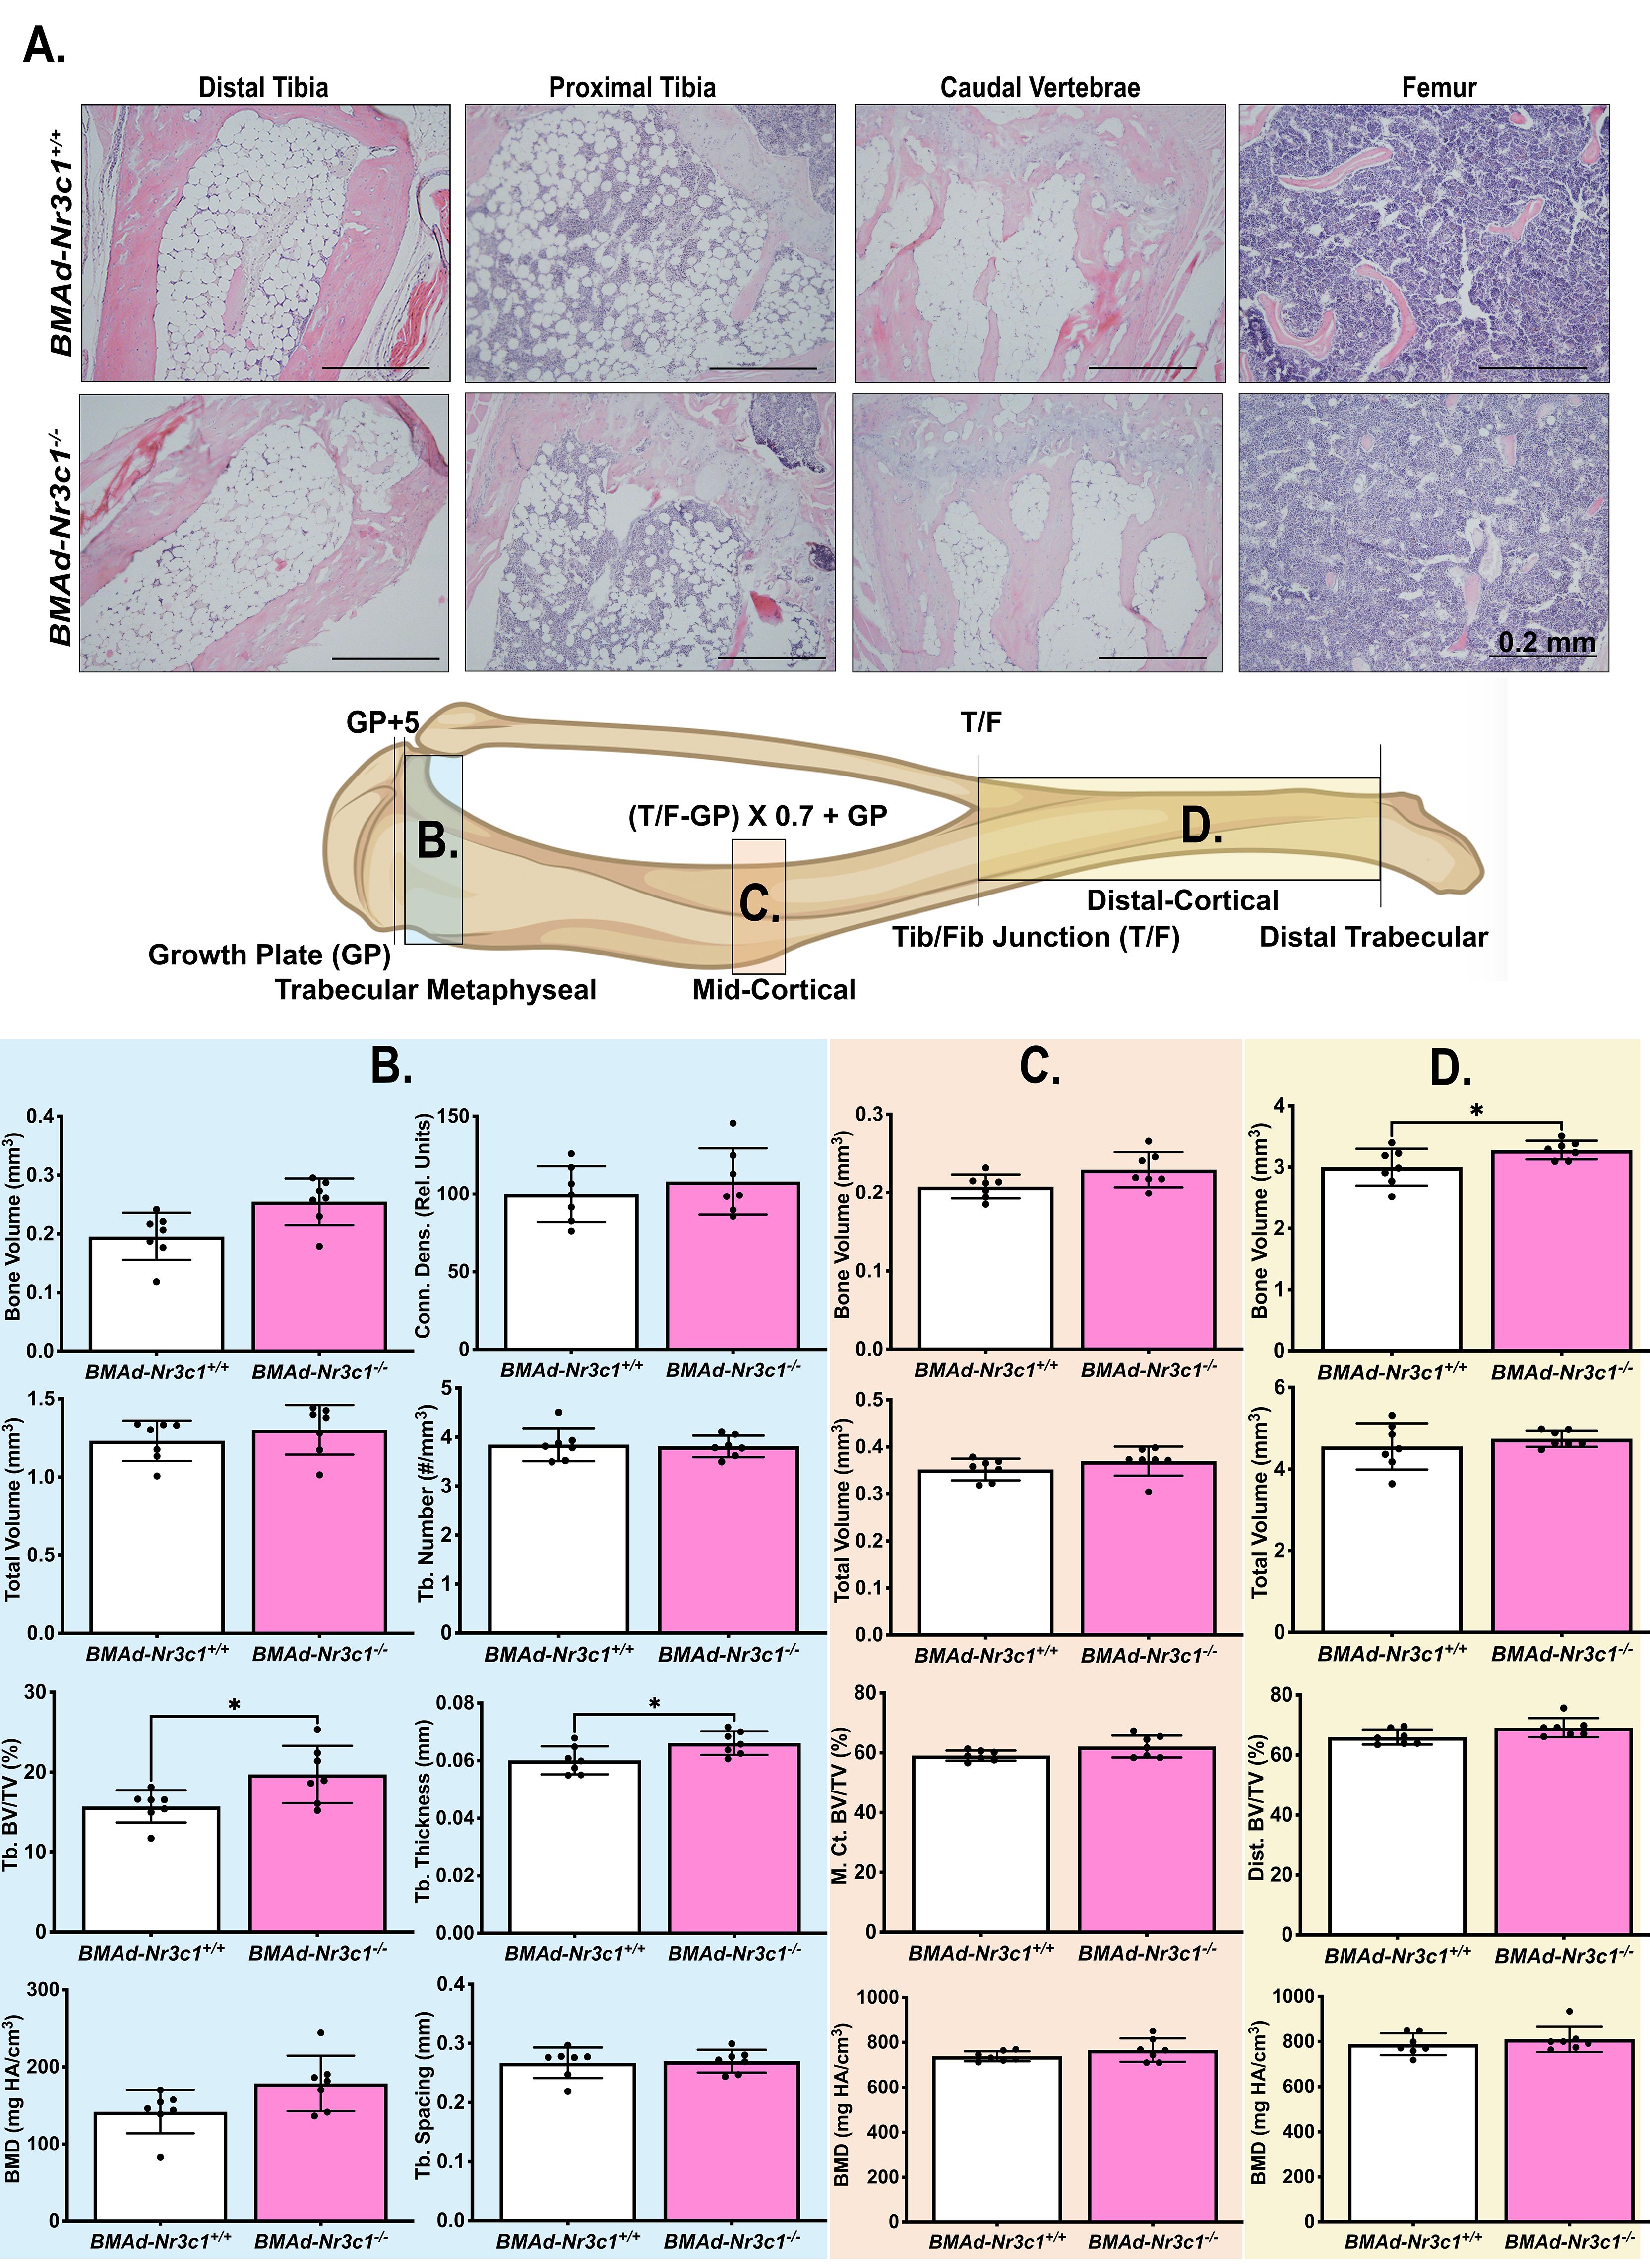
Figure 2 Female BMAd-Nr3c1-/- mice have slightly elevated tibial bone variables. (A) Female mice at 31–39 weeks of age were euthanized. Tibiae, tail, and femurs were decalcified, embedded, paraffin-sectioned, and stained with H&E. Representative photos are shown. Scale bar: 0.22 mm. (B–D) A schematic of the tibia illustrating locations of µCT slices. Tibiae were analyzed by µCT for (B) proximal trabecular metaphyseal, (C) mid-cortical, and (D) distal cortical bone variables. Tb: Trabecular, BV: Bone Volume, TV: Total Volume, Conn. Dens.: Connective Density, M. Ct.: Mid-Cortical, Dist., Ct.: Distal Cortical. Statistical analysis was performed using an unpaired t-test. *p<0.05.
Deletion of Nr3c1 in BMAds does not alter BMAT accumulation with CR
In addition to increased BMAT volume, circulating concentrations of GC are elevated with CR in mice (26). We next sought to determine if GR is required for BMAT expansion following CR. Developing (10-16 weeks old) male BMAd-Nr3c1+/+ and BMAd-Nr3c1-/- mice were fed ad libitum or were provided a 30% CR diet for 6 weeks. Because no significant changes in BMAT were observed in male BMAd-Nr3c1-/- mice at baseline (Supplementary Figure 2), all BMAd-Nr3c1-/- mice were placed on a 30% CR diet. As expected, CR mice had significant decreases in body and tissue weights (Figures 3A, B). CR mice also had significant decreases in length of tibiae and femurs (Figures 3C, D), with an increase in trabecular connective density (Figure 3E). Changes in the mid- or distal cortical bone were not observed (Figures 3F, G).
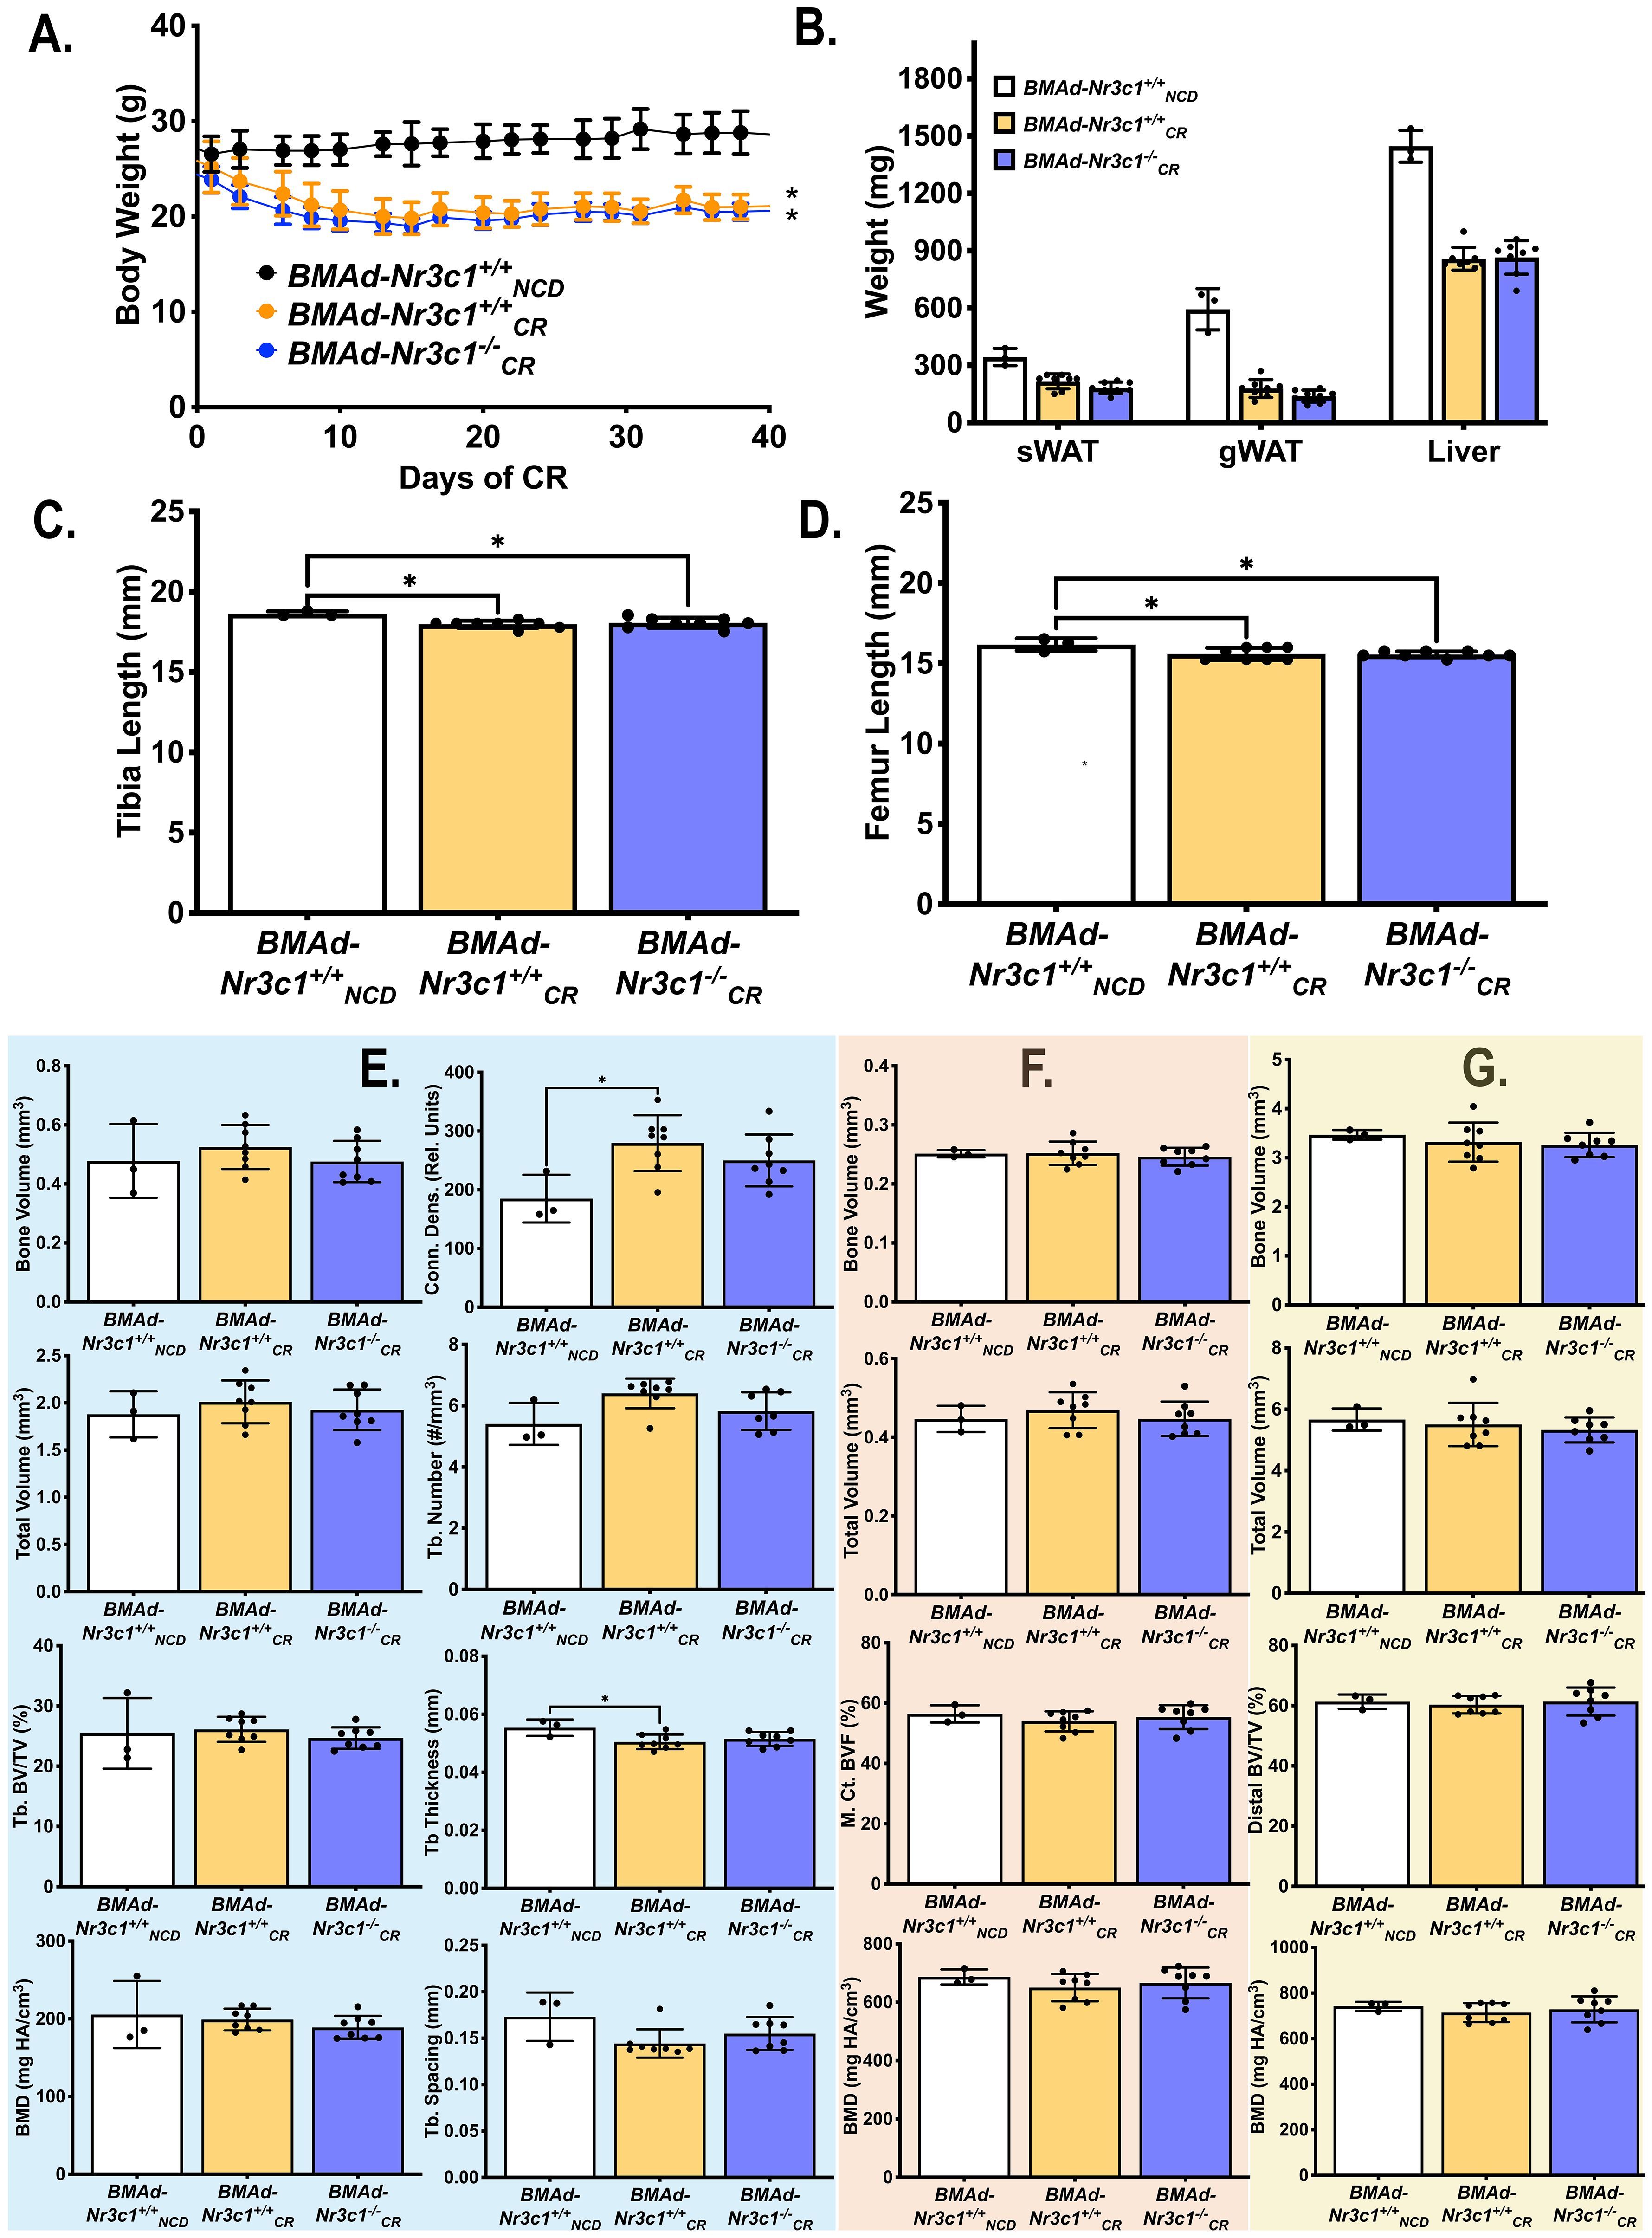
Figure 3 CR leads to decreased bone length in developing male mice independent of GR in BMAd. Male mice (10-16 weeks old) were fed ad libitum (NCD) or placed on a 30% CR diet for 6 weeks. (A) B ody weights of mice were measured throughout the experiment. Statistical analysis was performed using a two-way ANOVA. *p<0.05 compared to BMAd-Nr3c1+/+NCD. (B) At the time of euthanasia, tissue weights of sWAT, eWAT, and liver were measured. (C, D) Following necropsy, the length of the tibia (C) and femur (D) were measured. Tibiae were analyzed by μCT for (E) proximal trabecular metaphyseal, (F) mid-cortical, and (G) distal cortical bone variables. Tb: Trabecular, BV: Bone Volume, TV: Total Volume, Conn. Dens.: Connective Density, M. Ct.: Mid-Cortical, Dist. Ct.: Distal Cortical. Statistical analysis was performed using a one-way ANOVA with a Tukey multiple comparison post hoc test. *p<0.05.
Due to decreased length of both the tibia and femur with CR, we concluded that CR blunts development of bone in growing mice. Therefore, we performed an additional CR study using adult male mice (34-41 weeks old) (Figure 4). CR mice lost ~26% of their body weight (Figure 4A) and had reductions in sWAT, eWAT, liver, and spleen mass (Supplementary Figure 3A). Importantly, we observed that CR induced a 7-fold increase in circulating corticosterone concentrations in both BMAd-Nr3c1+/+ and BMAd-Nr3c1-/- adult mice (Figure 4B). Histological analysis showed CR leads to an increase in the number of BMAds in tibiae and femurs of mice placed on CR (Figure 4C), but differences in BMAT volume were not observed between BMAd-Nr3c1+/+ and BMAd-Nr3c1-/- mice on CR. There were also no significant differences in adipocyte size in tibiae from BMAd-Nr3c1+/+CR and BMAd-Nr3c1-/-CR mice (Figures 4D, E). Quantification of BMAT volume using osmium tetroxide and μCT demonstrated a significant increase in proximal tibial BMAT with CR (Figures 4F–H). Neither CR nor the loss of GR in BMAds altered tibial bone parameters quantified by µCT (Supplementary Figures 3B-D).
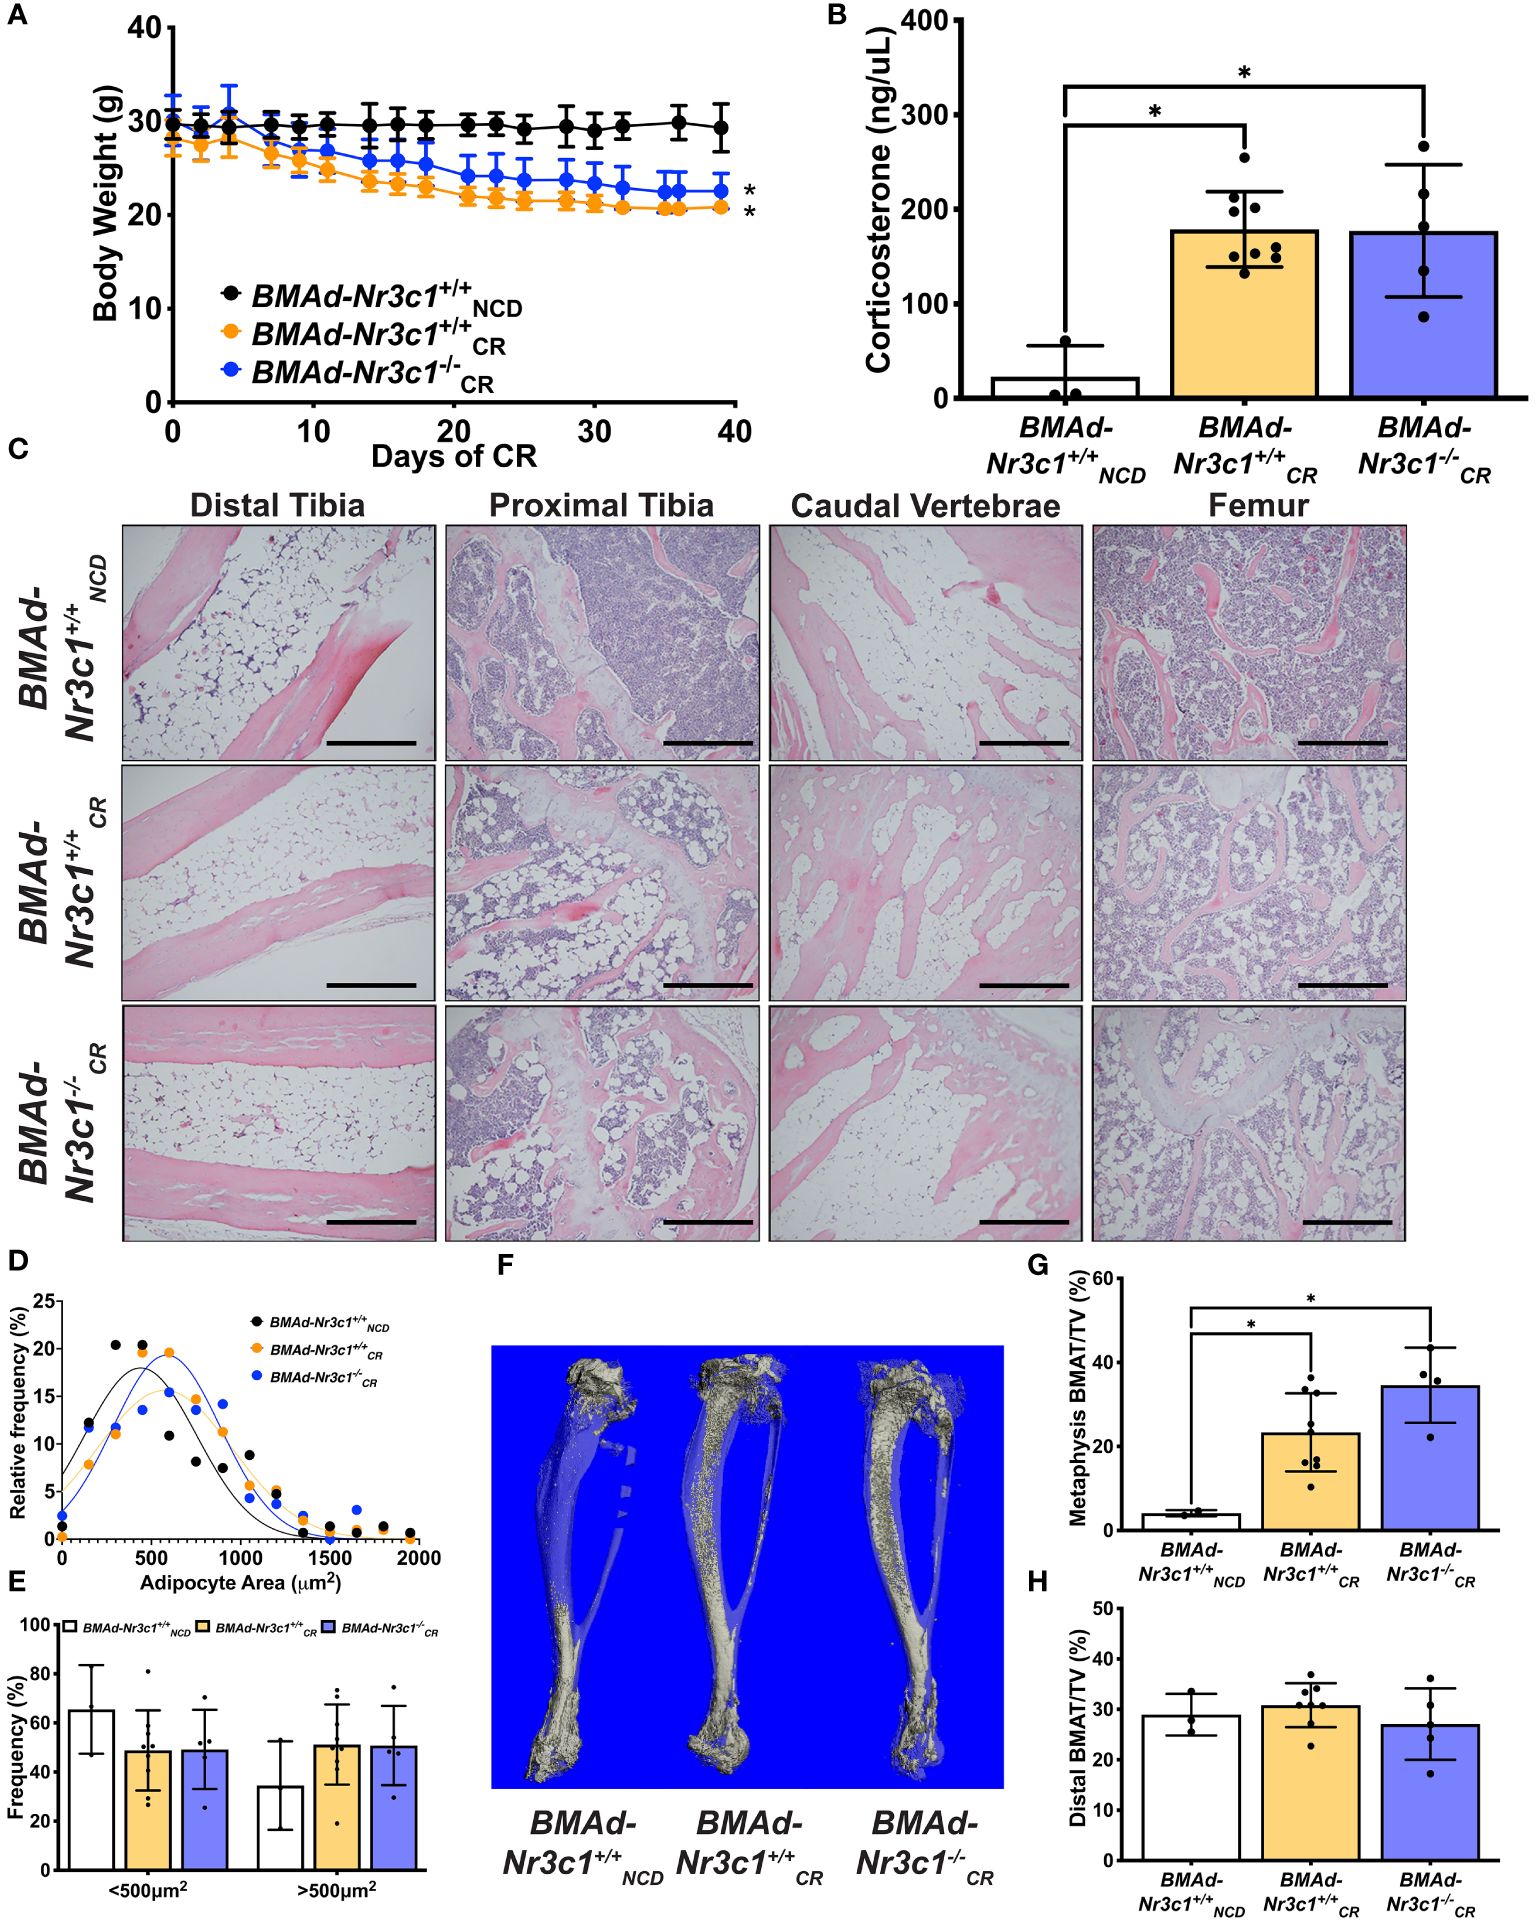
Figure 4 Loss of GR in BMAds of male mice does not alter BMAT responses to CR. Male mice (34-41 weeks old) were fed ad libitum or placed on a 30% CR diet for 6 weeks. (A) Body weight of mice was measured throughout the experiment. Statistical analysis was performed using a two-way ANOVA. *p<0.05 compared to BMAd-Nr3c1+/+NCD. (B) At the time of euthanasia, blood was isolated, and circulating corticosterone concentrations were measured. (C) Tibiae, caudal vertebrae, and femurs were decalcified, embedded, paraffin-sectioned, and stained with H&E. Representative photos are shown. Scale bar: 0.22 mm. (D, E) BMAd size was calculated using MetaMorph. (F) Using osmium tetroxide and μCT, a three-dimensional reconstruction of tibial BMAT was generated. BMAT volume in tibial (G) metaphasis and (H) distal cortical regions was determined.Statistical analysis was performed using a one-way ANOVA with a Tukey multiple comparison post hoc test. *p<0.05.
Deletion of Nr3c1 in BMAds alters circulating white blood cell counts
In addition to impacting bone biology, BMAds and GC have independent effects on hematopoiesis (39–42). To determine if loss of GR in BMAds impacts hematopoiesis, we measured complete blood counts from male and female BMAd-Nr3c1+/+ and BMAd-Nr3c1-/- mice. Previous reports have shown that both GC and blood cell concentrations vary greatly with time of day (43, 44). Therefore, we measured blood cell parameters during the day (ZT5) and in the evening (ZT17). As expected, all blood cell populations were lower during the evening (Figures 5A–H). Our results demonstrated that both male and female BMAd-Nr3c1-/- mice have reduced white blood cell counts compared to BMAd-Nr3c1+/+ mice (Figures 5A, E). Specifically, female BMAd-Nr3c1-/- mice showed a significant reduction in numbers of circulating lymphocytes (Figure 5B), whereas male mice showed a significant reduction in circulating monocytes (Figure 5H). Loss of GR in BMAds did not alter red blood cell parameters or platelets (Supplementary Figure 4). After observing changes to circulating blood cell populations, we next investigated whether this observation could be a result of changes to the bone marrow cell composition. Therefore, we measured hematopoietic progenitor cell populations within bone marrow compartments of femurs and tibiae. Our results demonstrated that BMAd-Nr3c1-/- mice had fewer short-term reconstituting hematopoietic stem cells (ST-HSC) in the femur. However, we did not observe changes in common myeloid progenitors (CMP) or common lymphoid progenitors (CLP). We also did not observe altered frequencies of progenitor cell populations in the tibia of BMAd-Nr3c1-/- mice compared to control (Figures 5I, J).
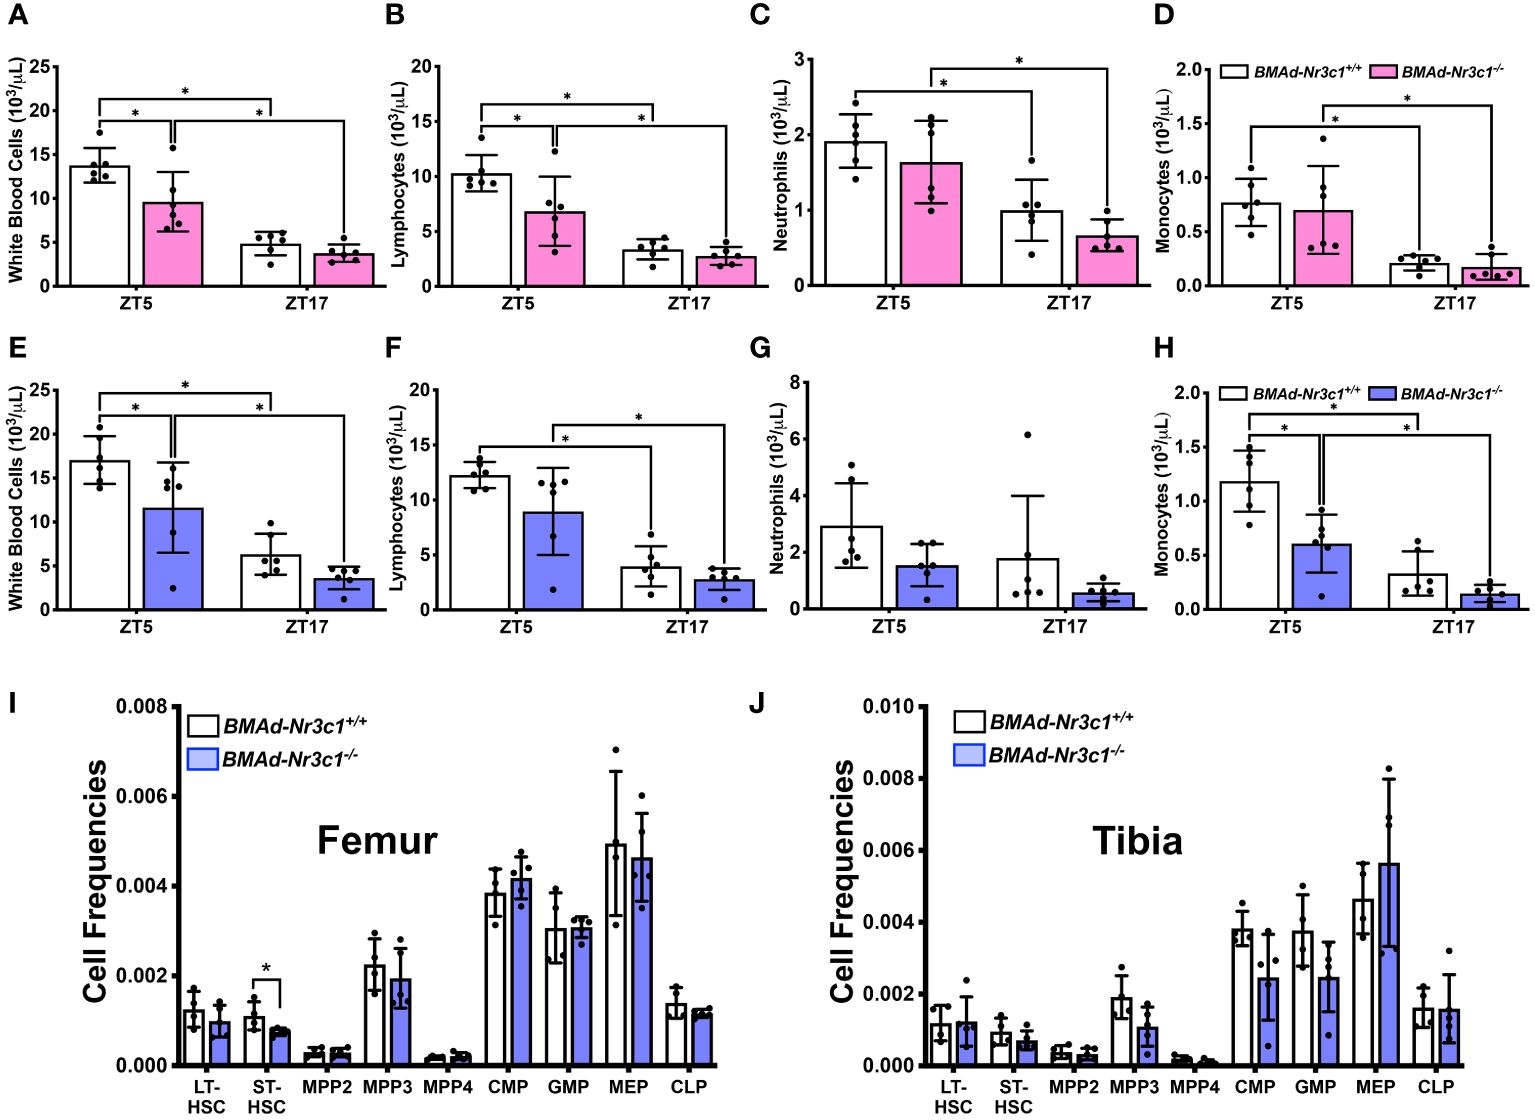
Figure 5 Loss of GR in BMAds reduces circulating white blood cell counts in female and male mice during the light cycle. Circulating blood cell populations were measured in (A–D) female and (E–H) male BMAd-Nr3c1-/- and control mice at ZT5 and, following a 48-hour recovery period, at ZT17. Statistical analyses of panels A-H were performed using a two-way ANOVA with a Sidak’s multiple comparison’s post hoc test. *p<0.05. Hematopoietic progenitor cell populations were measured in bone marrow isolated from the (I) femur and (J) tibia of BMAd-Nr3c1-/- or control mice. Statistical analysis of panels I and J was performed using an unpaired t-test. *p<0.05.
Discussion
BMAds are a unique group of adipocytes residing within the bone marrow microenvironment. rBMAT volume expands under a variety of physiological and pathological conditions including CR (20) and anorexia nervosa (4, 45, 46). The molecular mechanisms during CR leading to increased BMAT are unknown. Previous studies using mouse models have shown that BMAT expansion occurs when circulating GC are elevated (26). Both excess synthetic and endogenous GCs are known to cause bone loss (47). In general, an inverse relationship exists between BMAT volume and bone mass, including in patients with anorexia nervosa (48–50). Together these results suggest that excess GC during CR may lead to increased BMAT and subsequent bone loss (51, 52). Indeed, work from Pierce et al. have shown that GR-deficiency in Osx-expressing cells led to loss of cortical and trabecular bone mass in mice fed ad libitum or CR (53). However, previous studies using adipocyte-specific deletion of GR have not investigated changes to bone mass (31, 33–35). Indeed, in these studies, the direct effects of GR in BMAd would not be distinguishable from potential indirect effects caused by the deletion of GR in other adipose depots.
In this study, our results suggest that GRs in BMAds are not required for the expansion of BMAT with CR. One explanation is that GR plays an important role in the early differentiation of BMAds, and the BMAd-Cre model used in these studies targets only mature BMAds (11). Another possibility is that the loss of GR in BMAds is compensated by other GC-responsive proteins such as the mineralocorticoid receptor (MR), which can also directly bind to GC. However, evidence for robust compensation by MR has not been observed in adipocyte-specific GR-KO models (33, 54). In the current studies, we also did not observe significant changes to MR expression levels in BMAd-Nr3c1-/- mice (data not shown). Several groups have targeted GC activity through knock-out of the enzymes involved in their activation, such as 11β-HSD1, a major regulator of the tissue-specific effects of GC (55, 56). Previous work has shown that global deletion of 11β-HSD1 produces a favorable metabolic state (57–59); however, the impact of 11β-HSD1-deficiency in BMAds has not been evaluated. With the recent invention of genetic tools like the BMAd-Cre mouse (11), future experiments can investigate this hypothesis that 11β-HSD1 is important for BMAT responses to GC. It is possible that GR in BMAds is important with other stressors that lead to BMAT expansion such as aging or obesity (60). Alternatively, it may be that elevated GC and BMAd-GR do not contribute to BMAT expansion following CR.
Whereas our results did not suggest a critical role for GR in BMAd in expansion of BMAT during CR, we did observe a small but significant increase in trabecular bone volume fraction and thickness as well as distal cortical bone volume in the tibiae of adult female BMAd-Nr3c1-/- mice at baseline. Sex-specific differences in bone parameters are well documented (61, 62), and 6 weeks of 30% CR did not lead to loss of tibial bone mass in adult male mice. Indeed, the clinical data surrounding bone loss from CR is variable. One study showed that six months of CR in young adults does not lead to significant bone loss (63). However, similar studies in adults show a significant reduction in bone following CR (64, 65). Amongst these conflicting findings, one consensus is that patients with anorexia nervosa are at an increased fracture risk due to bone loss (66–69). Of note, anorexia nervosa is a condition of more severe caloric deficiency than that achieved in most CR studies. In mouse and rabbit models, results have also been mixed. One common observation is that CR results in stunted bone growth and low bone mass in some regions of the skeleton of young mice (21) and rabbits (26). Indeed, our studies support this finding, which is why we then chose to investigate CR in adult mice (34+ weeks). In adult animals, most studies suggest that CR leads to bone loss (21, 70). However, results have been variable both in terms of the severity of bone loss and the location of bone loss within the skeleton (21, 70). One study showed that bone loss occurs with 6 weeks of CR, even when performed in combination with exercise (71), which typically positively supports bone health (72). Interestingly, some studies suggest that long-term CR may protect against or delay age-related bone loss (73, 74). Several factors could influence the impact of CR on bone mass including sex, age, length of CR, strain of mice, and region of the skeleton being investigated. While our CR diet includes micronutrient supplementation, in other dietary restriction studies (21), the availability of calcium and other essential minerals is of concern.
Due to its location within the marrow niche, as well as its endocrine functions, many studies have aimed to investigate the roles of BMAd on hematopoiesis. Several studies suggest an inverse relationship between BMAT and hematopoiesis (10, 15, 16, 18). However, others suggest a supportive role for BMAds in hematopoiesis (11, 18, 75). In our study, loss of GR from BMAds led to a significant decrease in circulating white blood cells. Female BMAd-Nr3c1-/- mice showed a decrease in lymphocytes, while male mice showed a significant reduction in monocytes. These changes were only significant when the blood draw was performed during the day (ZT5). Confirming previous studies showing that hematopoiesis is circadian (43), nearly all blood cell populations were reduced when the blood draw was performed at night (ZT17). We did not observe changes in circulating red blood cells in BMAd-Nr3c1-/- mice. While GR has previously been shown to mediate stress erythropoiesis (41), we hypothesize that the lack of changes in circulating red blood cells in BMAd-Nr3c1-/- mice is because this process mostly occurs in the spleen (76). In WAT, adipocyte GR suppresses the immune system, maintaining immune homeostasis (77, 78). While circulating white blood cells were decreased during the day in BMAd-Nr3c1-/- mice, we did not observe differences in the abundance of bone marrow progenitor cell populations in the tibiae of BMAd-Nr3c1-/- mice. We observed a subtle but significant change in ST-HSCs in the femur of BMAd-Nr3c1-/- mice, but the frequency of CMP or CLP populations was not different. BMAds locally interact with hematopoietic cells and contribute to whole-body metabolism through the secretion of adipokines (79, 80). Lipodystrophic A-ZIP/F1 mice, which lack BMAT, have delayed hematopoietic regeneration in the long bones following irradiation (5), a process that involves the secretion of stem cell factor (SCF) from BMAds (5, 80, 81). Loss of SCF from BMAT reduces the bone marrow cellularity, hematopoietic stem and progenitor cells, common myeloid progenitors, megakaryocyte-erythrocyte progenitors, and granulocyte-monocyte progenitors (81). Supporting this hypothesis, there is a depletion of BMAT accompanied by a decrease in bone marrow erythroid cells and anemia following bariatric surgery (10). Our data suggests that loss of GR from BMAd lowers circulating white blood cells without altering bone marrow hematopoietic progenitor cell populations.
Our experiments demonstrate that loss of GR in BMAd of female mice led to a small but significant increase in trabecular bone volume fraction and trabecular thickness. Loss of GR in BMAd of male mice showed no changes to bone parameters. CR in young mice resulted in a decrease in tibial and femur lengths as sufficient caloric intake is important for growth in developing bones. CR studies in both young and adult male mice demonstrated that GR in BMAd is not required for BMAT expansion following CR. This study has several limitations. One caveat to the BMAd- Cre mouse model is that the insertion of a flipped Cre gene in the 3’ untranslated region of adiponectin leads to a small, but significant, decrease in circulating adiponectin concentrations (11). To confirm that excess GC do not work directly on BMAds to promote BMAT expansion during CR, future mouse models should target other aspects of the GC pathway, such as deletion of MR or 11β-HSD1. It is also highly likely that GC induce BMAT expansion by promoting the differentiation of new adipocytes, and the BMAd-Cre model used herein targets mature adipocytes. In conclusion, our data suggest that BMAd-GR is not required for BMAT expansion following CR.
Data availability statement
The raw data supporting the conclusions of this article will be made available by the authors, without undue reservation.
Ethics statement
The animal study was approved by Institutional Animal Care & Use Committee University of Michigan. The study was conducted in accordance with the local legislation and institutional requirements.
Author contributions
RS: Conceptualization, Data curation, Formal analysis, Funding acquisition, Investigation, Writing – original draft, Writing – review & editing. JV: Data curation, Writing – review & editing. MA: Data curation, Writing – review & editing. ZL: Data curation, Writing – review & editing. KL: Data curation, Writing – review & editing. AM-H: Data curation, Writing – review & editing. KH: Data curation, Writing – review & editing. JM: Data curation, Writing – review & editing. RU: Data curation, Writing – review & editing. HH: Data curation, Writing – review & editing. IH: Data curation, Writing – review & editing. HM: Data curation, Writing – review & editing. OM: Writing – original draft, Writing – review & editing.
Funding
The author(s) declare financial support was received for the research, authorship, and/or publication of this article. The work was supported by grants from the NIH to OAM (AG069795; DK121759, DK137798), RLS (T32 DK101357; F32 DK123887), KTL (T32 DK071212, F32 DK122654), JNM (T32 HD007505, F31 DK135181) and by a grant from the American Diabetes Association to ZL (1-18-PDF-087).
Acknowledgments
The authors would like to thank Drs. William Cawthorn (University of Edinburgh) and Clifford Rosen (Maine Medical Center) for their scientific guidance. This research was also supported by core facilities at the University of Michigan including the Unit for Laboratory Animal Medicine Pathology, the University of Michigan School of Dentistry MicroCT Core, and the MNORC Adipose Tissue Core (P30 DK089503). We would also like to thank Tanu Soni (University of Michigan, Computational Medicine and Bioinformatics) and the University of Michigan’s Consulting for Statistics, Computing, & Analytics Research Office for support and guidance on statistical analysis.
Conflict of interest
The authors declare that the research was conducted in the absence of any commercial or financial relationships that could be construed as a potential conflict of interest.
Publisher’s note
All claims expressed in this article are solely those of the authors and do not necessarily represent those of their affiliated organizations, or those of the publisher, the editors and the reviewers. Any product that may be evaluated in this article, or claim that may be made by its manufacturer, is not guaranteed or endorsed by the publisher.
Supplementary material
The Supplementary Material for this article can be found online at: https://www.frontiersin.org/articles/10.3389/fendo.2024.1397081/full#supplementary-material
Supplemental Figure 1 | Deletion of GR from BMAds of female mice does not alter WAT, liver, or spleen weights. Female mice at 31–39 weeks of age were euthanized and (A) body weights and (B) tissue weights of sWAT, poWAT, liver, and spleen were determined. Statistical analysis was performed using an unpaired t-test. (C) sWAT and poWAT were fixed, paraffin-sectioned, and stained with H&E. Scale bar: 0.22 mm.
Supplemental Figure 2 | Deletion of GR from BMAds of male mice does not alter BMAT or bone variables. (A) Male mice at 29–36 weeks of age were euthanized. Tibiae, caudal vertebrae, and femurs were decalcified, embedded, paraffin-sectioned, and stained with H&E. Representative photos are shown. Scale bar: 0.22 mm. Tibiae were analyzed by μCT for (B) proximal trabecular metaphyseal, (C) mid-cortical, and (D) distal cortical bone variables. Tb: Trabecular, BV: Bone Volume, TV: Total Volume, Conn. Dens.: Connective Density, M. Ct.: Mid-Cortical, Dist. Ct.: Distal Cortical. Statistical analysis was performed using an unpaired t-test.
Supplemental Figure 3 | Calorie restriction of BMAd-Nr3c1-/- mice leads to loss of WAT but does not alter tibial bone variables. Male mice were euthanized and (A) tissue weights of sWAT, eWAT, liver, and spleen were determined. Statistical analysis was performed using a one-way ANOVA with a Tukey multiple comparison post hoc test. *p<0.05. Tibiae were analyzed by μCT for (B) proximal trabecular metaphyseal, (C) mid-cortical, and (D) distal cortical bone variables. Tb: Trabecular, BV: Bone Volume, TV: Total Volume, Conn. Dens.: Connective Density, M. Ct.: Mid-Cortical, Dist. Ct.: Distal Cortical.
Supplemental Figure 4 | Deletion of GR from BMAds does not alter circulating red blood cell populations. Circulating blood cell populations were measured in (A–D) female and (E–H) male BMAd-Nr3c1-/- and control mice at ZT5 and, following a 48-hour recovery period, at ZT17. Statistical analysis was performed using a one-way ANOVA. *p<0.05.
References
1. Nandy A, Rendina-Ruedy E. Bone marrow adipocytes - Good, bad, or just different? Best Pract Res Clin Endocrinol Metab. (2021) 35:101550. doi: 10.1016/j.beem.2021.101550
2. Scheller EL, Doucette CR, Learman BS, Cawthorn WP, Khandaker S, Schell B, et al. Region-specific variation in the properties of skeletal adipocytes reveals regulated and constitutive marrow adipose tissues. Nat Commun. (2015) 6:7808. doi: 10.1038/ncomms8808
3. Li Z, Hardij J, Bagchi DP, Scheller EL, MacDougald OA. Development, regulation, metabolism and function of bone marrow adipose tissues. Bone. (2018) 110:134–40. doi: 10.1016/j.bone.2018.01.008
4. Cawthorn WP, Scheller EL, Learman BS, Parlee SD, Simon BR, Mori H, et al. Bone marrow adipose tissue is an endocrine organ that contributes to increased circulating adiponectin during caloric restriction. Cell Metab. (2014) 20:368–75. doi: 10.1016/j.cmet.2014.06.003
5. Zhou BO, Yu H, Yue R, Zhao Z, Rios JJ, Naveiras O, et al. Bone marrow adipocytes promote the regeneration of stem cells and haematopoiesis by secreting SCF. Nat Cell Biol. (2017) 19:891–903. doi: 10.1038/ncb3570
6. Takeshita S, Fumoto T, Naoe Y, Ikeda K. Age-related marrow adipogenesis is linked to increased expression of RANKL. J Biol Chem. (2014) 289:16699–710. doi: 10.1074/jbc.M114.547919
7. Fazeli PK, Horowitz MC, MacDougald OA, Scheller EL, Rodeheffer MS, Rosen CJ, et al. Marrow fat and bone–new perspectives. J Clin Endocrinol Metab. (2013) 98:935–45. doi: 10.1210/jc.2012-3634
8. Doucette CR, Horowitz MC, Berry R, MacDougald OA, Anunciado-Koza R, Koza RA, et al. A high fat diet increases bone marrow adipose tissue (MAT) but does not alter trabecular or cortical bone mass in C57BL/6J mice. J Cell Physiol. (2015) 230:2032–7. doi: 10.1002/jcp.24954
9. Scheller EL, Khoury B, Moller KL, Wee NK, Khandaker S, Kozloff KM, et al. Changes in Skeletal Integrity and Marrow Adiposity during High-Fat Diet and after Weight Loss. Front Endocrinol (Lausanne). (2016) 7:102. doi: 10.3389/fendo.2016.00102
10. Li Z, Hardij J, Evers SS, Hutch CR, Choi SM, Shao Y, et al. G-CSF partially mediates effects of sleeve gastrectomy on the bone marrow niche. J Clin Invest. (2019) 129:2404–16. doi: 10.1172/JCI126173
11. Li Z, Bowers E, Zhu J, Yu H, Hardij J, Bagchi DP, et al. Lipolysis of bone marrow adipocytes is required to fuel bone and the marrow niche during energy deficits. Elife. (2022) 11. doi: 10.7554/eLife.78496
12. Komori T. Regulation of osteoblast differentiation by Runx2. Adv Exp Med Biol. (2010) 658:43–9. doi: 10.1007/978-1-4419-1050-9_5
13. Liu Q, Li M, Wang S, Xiao Z, Xiong Y, Wang G. Recent advances of osterix transcription factor in osteoblast differentiation and bone formation. Front Cell Dev Biol. (2020) 8:601224. doi: 10.3389/fcell.2020.601224
14. Rosen ED, Walkey CJ, Puigserver P, Spiegelman BM. Transcriptional regulation of adipogenesis. Genes Dev. (2000) 14:1293–307. doi: 10.1101/gad.14.11.1293
15. Naveiras O, Nardi V, Wenzel PL, Hauschka PV, Fahey F, Daley GQ. Bone-marrow adipocytes as negative regulators of the haematopoietic microenvironment. Nature. (2009) 460:259–63. doi: 10.1038/nature08099
16. Polineni S, Resulaj M, Faje AT, Meenaghan E, Bredella MA, Bouxsein M, et al. Red and white blood cell counts are associated with bone marrow adipose tissue, bone mineral density, and bone microarchitecture in premenopausal women. J Bone Miner Res. (2020) 35:1031–9. doi: 10.1002/jbmr.3986
17. Boyd AL, Reid JC, Salci KR, Aslostovar L, Benoit YD, Shapovalova Z, et al. Acute myeloid leukaemia disrupts endogenous myelo-erythropoiesis by compromising the adipocyte bone marrow niche. Nat Cell Biol. (2017) 19:1336–47. doi: 10.1038/ncb3625
18. Li Z, Bagchi DP, Zhu J, Bowers E, Yu H, Hardij J, et al. Constitutive bone marrow adipocytes suppress local bone formation. JCI Insight. (2022) 7. doi: 10.1172/jci.insight.160915
19. Bales CW, Kraus WE. Caloric restriction: implications for human cardiometabolic health. J Cardiopulm Rehabil Prev. (2013) 33:201–8. doi: 10.1097/HCR.0b013e318295019e
20. Devlin MJ. Why does starvation make bones fat? Am J Hum Biol. (2011) 23:577–85. doi: 10.1002/ajhb.21202
21. Devlin MJ, Cloutier AM, Thomas NA, Panus DA, Lotinun S, Pinz I, et al. Caloric restriction leads to high marrow adiposity and low bone mass in growing mice. J Bone Miner Res. (2010) 25:2078–88. doi: 10.1002/jbmr.82
22. Nedvidkova J, Krykorkova I, Bartak V, Papezova H, Gold PW, Alesci S, et al. Loss of meal-induced decrease in plasma ghrelin levels in patients with anorexia nervosa. J Clin Endocrinol Metab. (2003) 88:1678–82. doi: 10.1210/jc.2002-021669
23. Misra M, Miller KK, Cord J, Prabhakaran R, Herzog DB, Goldstein M, et al. Relationships between serum adipokines, insulin levels, and bone density in girls with anorexia nervosa. J Clin Endocrinol Metab. (2007) 92:2046–52. doi: 10.1210/jc.2006-2855
24. Inagaki T, Dutchak P, Zhao G, Ding X, Gautron L, Parameswara V, et al. Endocrine regulation of the fasting response by PPARalpha-mediated induction of fibroblast growth factor 21. Cell Metab. (2007) 5:415–25. doi: 10.1016/j.cmet.2007.05.003
25. Cangemi R, Friedmann AJ, Holloszy JO, Fontana L. Long-term effects of calorie restriction on serum sex-hormone concentrations in men. Aging Cell. (2010) 9:236–42. doi: 10.1111/j.1474-9726.2010.00553.x
26. Cawthorn WP, Scheller EL, Parlee SD, Pham HA, Learman BS, Redshaw CM, et al. Expansion of bone marrow adipose tissue during caloric restriction is associated with increased circulating glucocorticoids and not with hypoleptinemia. Endocrinology. (2016) 157:508–21. doi: 10.1210/en.2015-1477
27. Monder C, Shackleton CH. 11 beta-Hydroxysteroid dehydrogenase: fact or fancy? Steroids. (1984) 44:383–417. doi: 10.1016/S0039-128X(84)80001-X
28. Albiston AL, Obeyesekere VR, Smith RE, Krozowski ZS. Cloning and tissue distribution of the human 11 beta-hydroxysteroid dehydrogenase type 2 enzyme. Mol Cell Endocrinol. (1994) 105:R11–7. doi: 10.1016/0303-7207(94)90176-7
29. Slavin BG, Ong JM, Kern PA. Hormonal regulation of hormone-sensitive lipase activity and mRNA levels in isolated rat adipocytes. J Lipid Res. (1994) 35:1535–41. doi: 10.1016/S0022-2275(20)41151-4
30. Villena JA, Roy S, Sarkadi-Nagy E, Kim KH, Sul HS. Desnutrin, an adipocyte gene encoding a novel patatin domain-containing protein, is induced by fasting and glucocorticoids: ectopic expression of desnutrin increases triglyceride hydrolysis. J Biol Chem. (2004) 279:47066–75. doi: 10.1074/jbc.M403855200
31. Lee RA, Harris CA, Wang JC. Glucocorticoid receptor and adipocyte biology. Nucl Receptor Res. (2018) 5. doi: 10.32527/2018/101373
32. Zhao X, Hu H, Wang C, Bai L, Wang Y, Wang W, et al. A comparison of methods for effective differentiation of the frozen-thawed 3T3-L1 cells. Anal Biochem. (2019) 568:57–64. doi: 10.1016/j.ab.2018.12.020
33. Desarzens S, Faresse N. Adipocyte glucocorticoid receptor has a minor contribution in adipose tissue growth. J Endocrinol. (2016) 230:1–11. doi: 10.1530/JOE-16-0121
34. Park YK, Ge K. Glucocorticoid Receptor Accelerates, but Is Dispensable for, Adipogenesis. Mol Cell Biol. (2017) 37:e00260–16. doi: 10.1128/MCB.00260-16
35. Bauerle KT, Hutson I, Scheller EL, Harris CA. Glucocorticoid receptor signaling is not required for in vivo adipogenesis. Endocrinology. (2018) 159:2050–61. doi: 10.1210/en.2018-00118
36. Mueller KM, Hartmann K, Kaltenecker D, Vettorazzi S, Bauer M, Mauser L, et al. Adipocyte glucocorticoid receptor deficiency attenuates aging- and HFD-induced obesity and impairs the feeding-fasting transition. Diabetes. (2017) 66:272–86. doi: 10.2337/db16-0381
37. Mittelstadt PR, Monteiro JP, Ashwell JD. Thymocyte responsiveness to endogenous glucocorticoids is required for immunological fitness. J Clin Invest. (2012) 122:2384–94. doi: 10.1172/JCI63067
38. Scheller EL, Troiano N, Vanhoutan JN, Bouxsein MA, Fretz JA, Xi Y, et al. Use of osmium tetroxide staining with microcomputerized tomography to visualize and quantify bone marrow adipose tissue in vivo. Methods Enzymol. (2014) 537:123–39. doi: 10.1016/B978-0-12-411619-1.00007-0
39. Ambrosi TH, Scialdone A, Graja A, Gohlke S, Jank AM, Bocian C, et al. Adipocyte accumulation in the bone marrow during obesity and aging impairs stem cell-based hematopoietic and bone regeneration. Cell Stem Cell. (2017) 20:771–84 e6. doi: 10.1016/j.stem.2017.02.009
40. von Lindern M, Zauner W, Mellitzer G, Steinlein P, Fritsch G, Huber K, et al. The glucocorticoid receptor cooperates with the erythropoietin receptor and c-Kit to enhance and sustain proliferation of erythroid progenitors in vitro. Blood. (1999) 94:550–9. doi: 10.1182/blood.V94.2.550.414k39_550_559
41. Bauer A, Tronche F, Wessely O, Kellendonk C, Reichardt HM, Steinlein P, et al. The glucocorticoid receptor is required for stress erythropoiesis. Genes Dev. (1999) 13:2996–3002. doi: 10.1101/gad.13.22.2996
42. Quatrini L, Tumino N, Besi F, Ciancaglini C, Galaverna F, Grasso AG, et al. Glucocorticoids inhibit human hematopoietic stem cell differentiation toward a common ILC precursor. J Allergy Clin Immunol. (2022) 149:1772–85. doi: 10.1016/j.jaci.2021.10.012
43. Mendez-, Chow A, Merad M, Frenette PS. Circadian rhythms influence hematopoietic stem cells. Curr Opin Hematol. (2009) 16:235–42. doi: 10.1097/MOH.0b013e32832bd0f5
44. Lightman SL, Wiles CC, Atkinson HC, Henley DE, Russell GM, Leendertz JA, et al. The significance of glucocorticoid pulsatility. Eur J Pharmacol. (2008) 583:255–62. doi: 10.1016/j.ejphar.2007.11.073
45. Bredella MA, Fazeli PK, Miller KK, Misra M, Torriani M, Thomas BJ, et al. Increased bone marrow fat in anorexia nervosa. J Clin Endocrinol Metab. (2009) 94:2129–36. doi: 10.1210/jc.2008-2532
46. Fazeli PK, Klibanski A. The paradox of marrow adipose tissue in anorexia nervosa. Bone. (2019) 118:47–52. doi: 10.1016/j.bone.2018.02.013
47. Canalis E, Delany AM. Mechanisms of glucocorticoid action in bone. Ann N Y Acad Sci. (2002) 966:73–81. doi: 10.1111/j.1749-6632.2002.tb04204.x
48. Beresford JN, Bennett JH, Devlin C, Leboy PS, Owen ME. Evidence for an inverse relationship between the differentiation of adipocytic and osteogenic cells in rat marrow stromal cell cultures. J Cell Sci. (1992) 102:341–51. doi: 10.1242/jcs.102.2.341
49. Meunier P, Aaron J, Edouard C, Vignon G. Osteoporosis and the replacement of cell populations of the marrow by adipose tissue. A quantitative study of 84 iliac bone biopsies. Clin Orthop Relat Res. (1971) 80:147–54. doi: 10.1097/00003086-197110000-00021
50. Di Iorgi N, Rosol M, Mittelman SD, Gilsanz V. Reciprocal relation between marrow adiposity and the amount of bone in the axial and appendicular skeleton of young adults. J Clin Endocrinol Metab. (2008) 93:2281–6. doi: 10.1210/jc.2007-2691
51. Bensreti H, Alhamad DW, Gonzalez AM, Pizarro-Mondesir M, Bollag WB, Isales CM, et al. Update on the role of glucocorticoid signaling in osteoblasts and bone marrow adipocytes during aging. Curr Osteoporos Rep. (2023) 21:32–44. doi: 10.1007/s11914-022-00772-5
52. Sharma AK, Shi X, Isales CM, McGee-Lawrence ME. Endogenous glucocorticoid signaling in the regulation of bone and marrow adiposity: Lessons from metabolism and cross talk in other tissues. Curr Osteoporos Rep. (2019) 17:438–45. doi: 10.1007/s11914-019-00554-6
53. Pierce JL, Sharma AK, Roberts RL, Yu K, Irsik DL, Choudhary V, et al. The glucocorticoid receptor in osterix-expressing cells regulates bone mass, bone marrow adipose tissue, and systemic metabolism in female mice during aging. J Bone Miner Res. (2022) 37:285–302. doi: 10.1002/jbmr.4468
54. Shen Y, Roh HC, Kumari M, Rosen ED. Adipocyte glucocorticoid receptor is important in lipolysis and insulin resistance due to exogenous steroids, but not insulin resistance caused by high fat feeding. Mol Metab. (2017) 6:1150–60. doi: 10.1016/j.molmet.2017.06.013
55. Morgan SA, McCabe EL, Gathercole LL, Hassan-Smith ZK, Larner DP, Bujalska IJ, et al. 11beta-HSD1 is the major regulator of the tissue-specific effects of circulating glucocorticoid excess. Proc Natl Acad Sci U.S.A. (2014) 111:E2482–91. doi: 10.1073/pnas.1323681111
56. Chapman K, Holmes M, Seckl J. 11beta-hydroxysteroid dehydrogenases: intracellular gate-keepers of tissue glucocorticoid action. Physiol Rev. (2013) 93:1139–206. doi: 10.1152/physrev.00020.2012
57. Kotelevtsev Y, Holmes MC, Burchell A, Houston PM, Schmoll D, Jamieson P, et al. 11beta-hydroxysteroid dehydrogenase type 1 knockout mice show attenuated glucocorticoid-inducible responses and resist hyperglycemia on obesity or stress. Proc Natl Acad Sci U.S.A. (1997) 94:14924–9. doi: 10.1073/pnas.94.26.14924
58. Morton NM, Holmes MC, Fievet C, Staels B, Tailleux A, Mullins JJ, et al. Improved lipid and lipoprotein profile, hepatic insulin sensitivity, and glucose tolerance in 11beta-hydroxysteroid dehydrogenase type 1 null mice. J Biol Chem. (2001) 276:41293–300. doi: 10.1074/jbc.M103676200
59. Morton NM, Paterson JM, Masuzaki H, Holmes MC, Staels B, Fievet C, et al. Novel adipose tissue-mediated resistance to diet-induced visceral obesity in 11 beta-hydroxysteroid dehydrogenase type 1-deficient mice. Diabetes. (2004) 53:931–8. doi: 10.2337/diabetes.53.4.931
60. Horton JA, Beck-Cormier S, van Wijnen AJ. Editorial: Bone marrow adiposity - contributions to bone, aging and beyond. Front Endocrinol (Lausanne). (2023) 14:1144163. doi: 10.3389/fendo.2023.1144163
61. Hogler W, Blimkie CJ, Cowell CT, Inglis D, Rauch F, Kemp AF, et al. Sex-specific developmental changes in muscle size and bone geometry at the femoral shaft. Bone. (2008) 42:982–9. doi: 10.1016/j.bone.2008.01.008
62. Choi KH, Lee JH, Lee DG. Sex-related differences in bone metabolism in osteoporosis observational study. Med (Baltimore). (2021) 100:e26153. doi: 10.1097/MD.0000000000026153
63. Villareal DT, Fontana L, Das SK, Redman L, Smith SR, Saltzman E, et al. Effect of two-year caloric restriction on bone metabolism and bone mineral density in non-obese younger adults: A randomized clinical trial. J Bone Miner Res. (2016) 31:40–51. doi: 10.1002/jbmr.2701
64. Villareal DT, Fontana L, Weiss EP, Racette SB, Steger-May K, Schechtman KB, et al. Bone mineral density response to caloric restriction-induced weight loss or exercise-induced weight loss: a randomized controlled trial. Arch Intern Med. (2006) 166:2502–10. doi: 10.1001/archinte.166.22.2502
65. Sukumar D, Ambia-Sobhan H, Zurfluh R, Schlussel Y, Stahl TJ, Gordon CL, et al. Areal and volumetric bone mineral density and geometry at two levels of protein intake during caloric restriction: a randomized, controlled trial. J Bone Miner Res. (2011) 26:1339–48. doi: 10.1002/jbmr.318
66. Lawson EA, Miller KK, Bredella MA, Phan C, Misra M, Meenaghan E, et al. Hormone predictors of abnormal bone microarchitecture in women with anorexia nervosa. Bone. (2010) 46:458–63. doi: 10.1016/j.bone.2009.09.005
67. Mika C, Holtkamp K, Heer M, Gunther RW, Herpertz-Dahlmann B. A 2-year prospective study of bone metabolism and bone mineral density in adolescents with anorexia nervosa. J Neural Transm (Vienna). (2007) 114:1611–8. doi: 10.1007/s00702-007-0787-4
68. Clarke J, Peyre H, Alison M, Bargiacchi A, Stordeur C, Boizeau P, et al. Abnormal bone mineral density and content in girls with early-onset anorexia nervosa. J Eat Disord. (2021) 9:9. doi: 10.1186/s40337-020-00365-6
69. Lucas AR, Melton LJ 3rd, Crowson CS, O'Fallon WM. Long-term fracture risk among women with anorexia nervosa: a population-based cohort study. Mayo Clin Proc. (1999) 74:972–7. doi: 10.4065/74.10.972
70. Devlin MJ, Brooks DJ, Conlon C, Vliet M, Louis L, Rosen CJ, et al. Daily leptin blunts marrow fat but does not impact bone mass in calorie-restricted mice. J Endocrinol. (2016) 229:295–306. doi: 10.1530/JOE-15-0473
71. McGrath C, Sankaran JS, Misaghian-Xanthos N, Sen B, Xie Z, Styner MA, et al. Exercise degrades bone in caloric restriction, despite suppression of marrow adipose tissue (MAT). J Bone Miner Res. (2020) 35:106–15. doi: 10.1002/jbmr.3872
72. Benedetti MG, Furlini G, Zati A, Letizia Mauro G. The effectiveness of physical exercise on bone density in osteoporotic patients. BioMed Res Int. (2018) 2018:4840531. doi: 10.1155/2018/4840531
73. Behrendt AK, Kuhla A, Osterberg A, Polley C, Herlyn P, Fischer DC, et al. Dietary restriction-induced alterations in bone phenotype: Effects of lifelong versus short-term caloric restriction on femoral and vertebral bone in C57BL/6 mice. J Bone Miner Res. (2016) 31:852–63. doi: 10.1002/jbmr.2745
74. Hamrick MW, Ding KH, Ponnala S, Ferrari SL, Isales CM. Caloric restriction decreases cortical bone mass but spares trabecular bone in the mouse skeleton: implications for the regulation of bone mass by body weight. J Bone Miner Res. (2008) 23:870–8. doi: 10.1359/jbmr.080213
75. Mattiucci D, Maurizi G, Izzi V, Cenci L, Ciarlantini M, Mancini S, et al. Bone marrow adipocytes support hematopoietic stem cell survival. J Cell Physiol. (2018) 233:1500–11. doi: 10.1002/jcp.26037
76. Broudy VC, Lin NL, Priestley GV, Nocka K, Wolf NS. Interaction of stem cell factor and its receptor c-kit mediates lodgment and acute expansion of hematopoietic cells in the murine spleen. Blood. (1996) 88:75–81. doi: 10.1182/blood.V88.1.75.75
77. Amatya S, Tietje-Mckinney D, Mueller S, Petrillo MG, Woolard MD, Bharrhan S, et al. Adipocyte glucocorticoid receptor inhibits immune regulatory genes to maintain immune cell homeostasis in adipose tissue. Endocrinology. (2023) 164. doi: 10.1210/endocr/bqad143
78. Rocamora-Reverte L, Villunger A, Wiegers GJ. Cell-specific immune regulation by glucocorticoids in murine models of infection and inflammation. Cells. (2022) 11:2126. doi: 10.3390/cells11142126
79. Herrmann M. Marrow fat-secreted factors as biomarkers for osteoporosis. Curr Osteoporos Rep. (2019) 17:429–37. doi: 10.1007/s11914-019-00550-w
80. Li Z, MacDougald OA. Stem cell factor: the bridge between bone marrow adipocytes and hematopoietic cells. Haematologica. (2019) 104:1689–91. doi: 10.3324/haematol.2019.224188
Keywords: glucocorticoids (GC), glucocorticoid receptor (GR), bone marrow adipose tissue (BMAT), caloric restriction (CR), bone, hematopoiesis
Citation: Schill RL, Visser J, Ashby ML, Li Z, Lewis KT, Morales-Hernandez A, Hoose KS, Maung JN, Uranga RM, Hariri H, Hermsmeyer IDK, Mori H and MacDougald OA (2024) Deficiency of glucocorticoid receptor in bone marrow adipocytes has mild effects on bone and hematopoiesis but does not influence expansion of marrow adiposity with caloric restriction. Front. Endocrinol. 15:1397081. doi: 10.3389/fendo.2024.1397081
Received: 06 March 2024; Accepted: 14 May 2024;
Published: 03 June 2024.
Edited by:
Giuseppina Storlino, University of Foggia, ItalyReviewed by:
Biagio Palmisano, Sapienza University of Rome, ItalyRobert Brommage, BoneGenomics, United States
Copyright © 2024 Schill, Visser, Ashby, Li, Lewis, Morales-Hernandez, Hoose, Maung, Uranga, Hariri, Hermsmeyer, Mori and MacDougald. This is an open-access article distributed under the terms of the Creative Commons Attribution License (CC BY). The use, distribution or reproduction in other forums is permitted, provided the original author(s) and the copyright owner(s) are credited and that the original publication in this journal is cited, in accordance with accepted academic practice. No use, distribution or reproduction is permitted which does not comply with these terms.
*Correspondence: Ormond A. MacDougald, bWFjZG91Z2FAdW1pY2guZWR1