 Zhengrong Jiang1†
 Huibin Huang
95% of researchers rate our articles as excellent or good
Learn more about the work of our research integrity team to safeguard the quality of each article we publish.
Find out more
ORIGINAL RESEARCH article
Front. Endocrinol. , 22 August 2024
Sec. Thyroid Endocrinology
Volume 15 - 2024 | https://doi.org/10.3389/fendo.2024.1364782
This article is part of the Research Topic Recent Advances in Thermal and Nonthermal Ablative Technologies of the Thyroid View all 11 articles
Background: T-cell exhaustion (Tex) can be beneficial in autoimmune diseases, but its role in Graves’ disease (GD), an autoimmune disorder of the thyroid, remains unknown. This study investigated Tex-related gene expression in GD patients to discern the potential contributions of these genes to GD pathogenesis and immune regulation.
Methods: Through gene landscape analysis, a protein–protein interaction network of 40 Tex-related genes was constructed. mRNA expression levels were compared between GD patients and healthy control (HCs). Unsupervised clustering categorized GD cases into subtypes, revealing distinctions in gene expression, immune cell infiltration, and immune responses. Weighted gene co-expression network analysis and differential gene expression profiling identified potential therapeutic targets. RT-qPCR validation of candidate gene expression was performed using blood samples from 112 GD patients. Correlations between Tex-related gene expression and clinical indicators were analyzed.
Results: Extensive Tex-related gene interactions were observed, with six genes displaying aberrant expression in GD patients. This was associated with atypical immune cell infiltration and regulation. Cluster analysis delineated two GD subtypes, revealing notable variations in gene expression and immune responses. Screening efforts identified diverse drug candidates for GD treatment. The Tex-related gene CBL was identified for further validation and showed reduced mRNA expression in GD patients, especially in cases of relapse. CBL mRNA expression was significantly lower in patients with moderate-to-severe thyroid enlargement than in those without such enlargement. Additionally, CBL mRNA expression was negatively correlated with the disease-specific indicator thyrotropin receptor antibodies.
Conclusion: Tex-related genes modulate GD pathogenesis, and their grouping aids subtype differentiation and exploration of therapeutic targets. CBL represents a potential marker for GD recurrence.
Graves’ disease (GD) is a prevalent autoimmune thyroid disorder that affects an estimated 0.5–2% of the global population (1). GD commonly manifests as symptomatic thyrotoxicosis, dysregulated hormone levels, and the presence of thyrotropin receptor antibodies (TRAb), conditions that can lead to life-threatening hyperthyroid crisis in some cases, leading to considerable morbidity and mortality (2). A thorough understanding of the etiology and pathogenesis of GD is necessary for the development of precise diagnostic methods and effective therapeutic interventions. Central to GD pathology is discernible derangement of T-cell functionality, which prompts a cascade of events that lead to the breakdown of immune tolerance, aberrant immunoregulation, heightened B-cell reactivity, and ultimately injury to the thyroid and associated tissues (3). However, the nuanced mechanisms responsible for the alterations in T-cell function observed in GD remain incompletely understood.
T lymphocytes, commonly referred to as T cells, assume a central role as effectors in the immune system and are mobilized in response to antigenic stimuli. This orchestrated response entails rapid T-cell proliferation and differentiation, culminating in the development of both effector T cells and memory T cells—a process indispensable for the preservation of immune homeostasis. Dysregulation of T-cell function is intricately associated with the onset of autoimmune pathologies (4). Specifically, T-cell exhaustion (Tex) represents a consequential deviation in T-cell differentiation, evoked by prolonged exposure to antigenic stimulation and/or inflammation (5). Hallmarks of Tex include progressive functional decline, sustained elevation of inhibitory receptors, alterations in transcription factor expression and utilization, and metabolic perturbations. Importantly, exhausted T cells lack the antigen-independent homeostatic proliferative capacity exhibited by memory T cells (6). The well-established connection of Tex with viral infections and compromised anti-tumor responses highlights its pivotal role. Within the tumor microenvironment, Tex may contribute to a waning anti-tumor immune response, fostering immune tolerance. Conversely, in autoimmune diseases, Tex may be beneficial, as depleted T cells modulate autoimmune responses through immunoregulatory mechanisms, thereby contributing to the restoration of immune homeostasis (7). Existing research underscores the correlation between the transcriptional profile of Tex and the therapeutic efficacy and prognosis across diverse autoimmune diseases, including systemic lupus erythematosus (SLE), type 1 diabetes mellitus, antineutrophil cytoplasmic antibody-associated vasculitis disease, rheumatoid arthritis (RA), and idiopathic pulmonary fibrosis (8). Although Tex has been studied in many autoimmune diseases, little evidence for its role in GD can be found in the current literature. An in-depth exploration of Tex within the context of GD would provide important insight into the precise mechanisms that underlie abnormal T-cell function in this specific autoimmune thyroid disorder.
In the present study, we first delineated molecular subtypes of GD by scrutinizing the expression profiles of Tex-related genes in the peripheral blood mononuclear cells (PBMCs) of GD patients. Through a meticulous analysis of Tex-related gene expression, we elucidated distinctive immune characteristics across these identified subtypes. For these subtypes, we performed co-expression analyses to identify key molecules that could serve as targets for potential molecularly-targeted drugs. This pioneering approach not only sheds light on the intricate immune landscape in GD but also introduces a novel research avenue for the prospective diagnosis and treatment of this autoimmune thyroid disorder.
For use in this study, the GSE71956 dataset was retrieved from the NCBI’s GEO database (https://www.ncbi.nlm.nih.gov/geo/). This microarray dataset, focusing on Homo sapiens, includes gene expression data collected from the PBMCs of 31 GD patients and 18 healthy controls (HCs), for a total of 49 samples (9, 10).
Data processing involved translating probes into symbols based on platform-specific correspondences. Probes corresponding to multiple genes were carefully removed, and those converging on the same symbol were consolidated into a median value. Subsequently, 40 Tex-related genes were identified (11). Gene sets from the GOBP and KEGG pathways, obtained from the MSigDb database (https://www.gsea-msigdb.org/gsea/msigdb/, version msigdb_v2023.1.Hs_GMTs), were included in further analysis using the ssGSEA algorithm to quantify pathway activity scores. Concurrently, we retrieved a set of 17 immune response genes from the Immport database (https://www.immport.org/shared/genelists). Utilizing the ssGSEA algorithm, immune response scores were computed for each sample in the GSE71956 dataset. The study also included 17 human leukocyte antigen (HLA) genes (12), and correlation analyses were conducted for 13 relevant genes. The four genes not included in the latter analyses were HLA-J and HLA-DRB6, which were absent from the GSE71956 dataset, and HLA-A and HLA-B, which were previously identified as key drivers in Tex.
Interactions among Tex-related genes were systematically explored using the STRING protein interactions database (https://www.string-db.org/). These interactions formed the basis for constructing PPI networks.
The Wilcoxon rank-sum test, with a stringent significance threshold set at P<0.05, was applied to identify differential expression of Tex-related genes between two delineated groups.
Unsupervised cluster analysis, utilizing the ConsensusClusterPlus package, identified different disease subtypes based on the expression profiles of Tex-related genes. The clustering method employed Euclidean distance, with km clustering and 1000 replications to ensure stability. Differences in pathway activity, immune response score, HLA gene expression, immune cell infiltration score, and T-cell depletion-related gene expression were examined between subtypes.
To construct scale-free co-expression gene networks by weighted gene co-expression network analysis (WGCNA), stringent criteria included setting scale-free R2 to 0.8 and a minimum threshold of 30 genes within a module. Subsequently, correlation analyses evaluated the relationship between modules and sample phenotypic features, using Pearson’s correlation coefficients for Module Eigenvectors (MEs), signifying the most emblematic genes within each module. Core genes, integral to different subtypes, were identified through rigorous screening based on gene significance (GS) ≥0.6 and module membership (MM) ≥0.8.
The R-package limma identified differentially expressed genes (DEGs) within diverse subtype samples, employing stringent criteria of |log2FC| ≥1 and adj. P<0.05.
Functional annotation of DEGs between subtypes was completed using the R package clusterProfiler, with parameters including pvalueCutoff = 0.05 and pAdjustMethod = “BH.” This facilitated the annotation of potential functions of genes that diverged between subtypes, predicting their molecular functions.
WGCNA was performed to identify core genes for each subtype. Then PPI networks were constructed based on core DEGs. Subtype hub genes were selected based on those with the top 5 connectivity, and interactions between these genes and drugs were investigated using the DGIdb database (https://www.dgidb.org/, v4.2.0). Sankey diagrams were prepared to provide concise and informative visualization of the interactions between drugs and genes.
Peripheral blood samples were systematically collected from 112 GD patients and 47 HCs at the Second Hospital of Fujian Medical University between June 2023 and November 2023. The diagnostic criteria for GD encompassed clinical manifestations of thyrotoxicity, elevated serum thyrotropin receptor antibodies (TRAb), reduced serum thyrotropin (TSH), and other pertinent indicators (13). Individuals in the HC group had normal thyroid function and thyroid autoantibody levels, and individuals were excluded if they had a chronic inflammatory or autoimmune disorder, a prior thyroid condition or surgery, an infectious disease, or a malignant tumor, or if they were pregnant or breastfeeding.
Within the GD patient cohort, 70 cases were primary, signifying the patients had not received previous treatment for thyroid or ocular conditions. Based on the degree of thyroid enlargement (confirmed by palpation and ultrasound), these 70 patients were categorized into two groups: those without thyroid enlargement or with Grade I enlargement were included in the non-severe thyroid enlargement GD group (NSTEGD), while those with Grade II-III enlargement were included in the severe thyroid enlargement GD group (STEGD). In contrast, 42 cases were recurrent, marked by the recurrence of symptoms and serological changes meeting the diagnostic criteria for GD within 2 years of discontinuing prescribed medication, as directed by the treating physician (14).
Ethical approval was obtained from the Ethics Committee of the Second Hospital of Fujian Medical University (Ethics No. 2023-488). The general information of the study participants is presented in Supplementary Table S1. PBMCs were isolated through concentration gradient centrifugation and cryopreserved in serum-free cryopreservative for backup.
Total RNA was isolated from PBMCs using TRIzol (Thermo Fisher Scientific, Waltham, MA, USA) for reverse transcription. The resulting RNA was transcribed into cDNA using the PrimeScript RT Master Mix kit (Takara, Dalian, China), and then cDNA amplification was achieved using the TB Green Premix Ex Taq II kit (Takara). Primers targeting the CBL gene and GAPDH were synthesized by Shanghai Sangon (Shanghai, China). The experiment was repeated three times. The specific primer sequences were:
CBL-forward:5’-ACTGCTTCTAAGGCTGCTTCTGG-3’,R:5’-GGCGGTGGTGGTGGAAGATC-3’.GAPDH-forward:5’-TGCCACTCCTCCACCTTTG-3’,R:5’-CGAACCACCCTGTTGCTGT-3’.
Bioinformatics analyses were conducted using R version 4.1.2. Test for significance included the Wilcoxon rank-sum test for two-group comparisons and the Kruskal–Wallis tests for multiple-group comparisons. The chromosomal distribution of Tex-related genes across 23 chromosome pairs was visualized using the R package RCircos.
Target gene validation was performed using IBM SPSS Statistics 23.0 and GraphPad Prism 8.0, employing the 2-ΔCt method for relative gene expression in clinical samples. Normal data distribution was confirmed with the Shapiro–Wilk test, and data variance was assessed with the F-test. Normally distributed data were expressed as mean ± standard deviation, with between-group comparisons performed using the Student’s test or corrected t-test (Welch’s method). Non-normally distributed data were presented as median and quartiles, and between-group comparisons were performed used the Mann–Whitney test.
Correlations between the candidate gene CBL and FT3, FT4, and TSH levels were examined by Pearson’s correlation analysis, while the correlation between the candidate gene CBL and TRAb level was investigated by Spearman’s rank correlation analysis.
This study began with a comprehensive analysis of 40 Tex-related genes, and the results revealed an even distribution across chromosomes, indicating genome-wide dispersion (Figure 1A). Subsequent PPI network analysis highlighted extensive interactions, emphasizing notable connectivity among genes such as IL7R, CCR7, JAK1, and CBL (Figure 1B), suggesting their potential importance in Tex-related gene interactions. Spearman’s correlation analysis demonstrated significant correlations in gene expression. The most pronounced was a positive correlation between IL7R and B2M expression, and a negative correlation between IL7R and MET exhibited the largest absolute value (Figure 1C), implying shared functional roles for these genes.
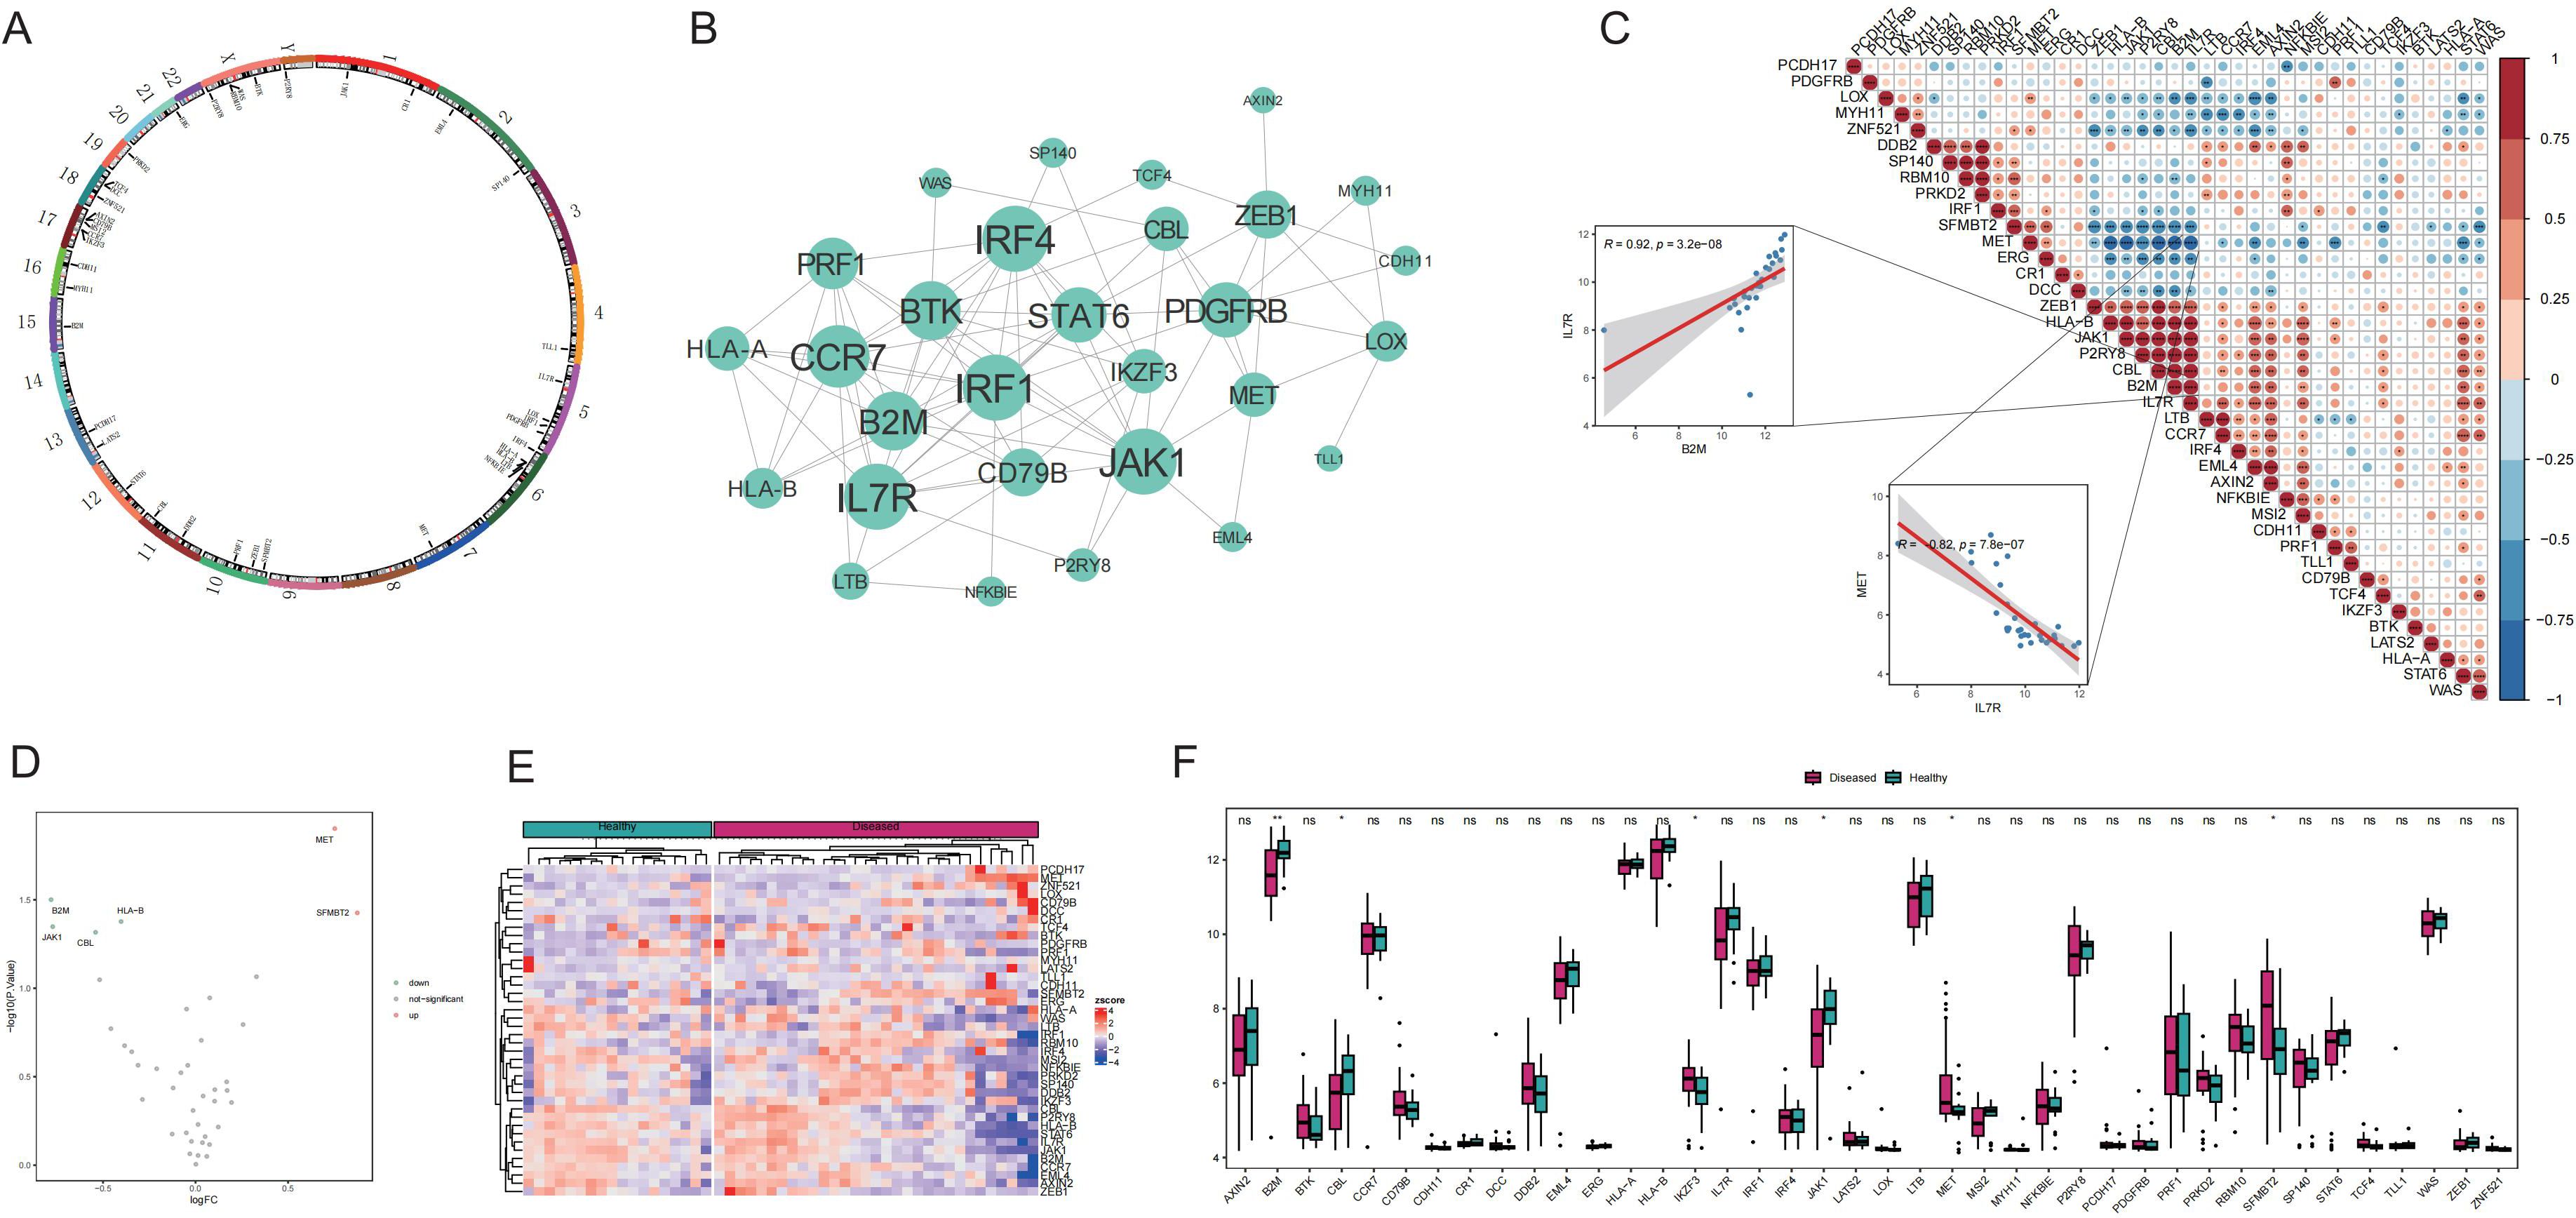
Figure 1. Expression of T-cell exhaustion (Tex)-related genes in the Graves’ disease (GD) genetic landscape. A: Chromosomal distribution of Tex-related genes. B: Protein–protein interaction (PPI) network of Tex-related genes. C: Heat map depicting expression correlation of Tex-related genes in disease samples. D: Volcano map illustrating differences in Tex-related gene expression between the healthy control (HC) and GD groups. E: Heat map displaying the expression levels of Tex-related genes in the HC and GD groups. F: Expression distribution map of differentially expressed Tex-related genes. ns (p>0.05), *P<0.05, **P<0.01.
Comparison of the mRNA expression levels of Tex-related genes between healthy and GD samples revealed upregulation of two genes (MET and SFMBT2) and downregulation of four genes (JAK1, CBL, B2M, and HLA-B) in GD (Figures 1D-F).
The potential roles of Tex-related genes in the pathogenesis of GD were investigated through a systematic analysis. Initial comparisons focused on HLA gene expression, immune cell infiltration scores, and immune response scores in different normal and GD patient samples. Spearman correlation analyses were performed to assess the relationships of HLA gene expression, immune cell infiltration scores, and immune response scores with Tex-related gene expression in GD patient samples. The results revealed down-regulation of three HLA genes (HLA-C, HLA-E, and HLA-F) in GD patient samples (Figure 2A). Further analyses demonstrated significant correlations between the expression of most aberrantly expressed HLA genes in GD and Tex-related genes (Figure 2B). Compared with HC samples, GD patient samples exhibited significantly higher infiltration scores for five immune cell types, specifically activated B cells, activated dendritic cells, central memory CD8 T cells, macrophages, and neutrophils (Figure 3A). Substantial correlations were observed between the immune cell infiltration scores in GD patient samples and the expression levels of Tex-associated genes. Notably, CBL, a Tex-related gene found to be differentially expressed in GD, showed a significant negative correlation with immune cell enrichment in GD (Figure 3B).
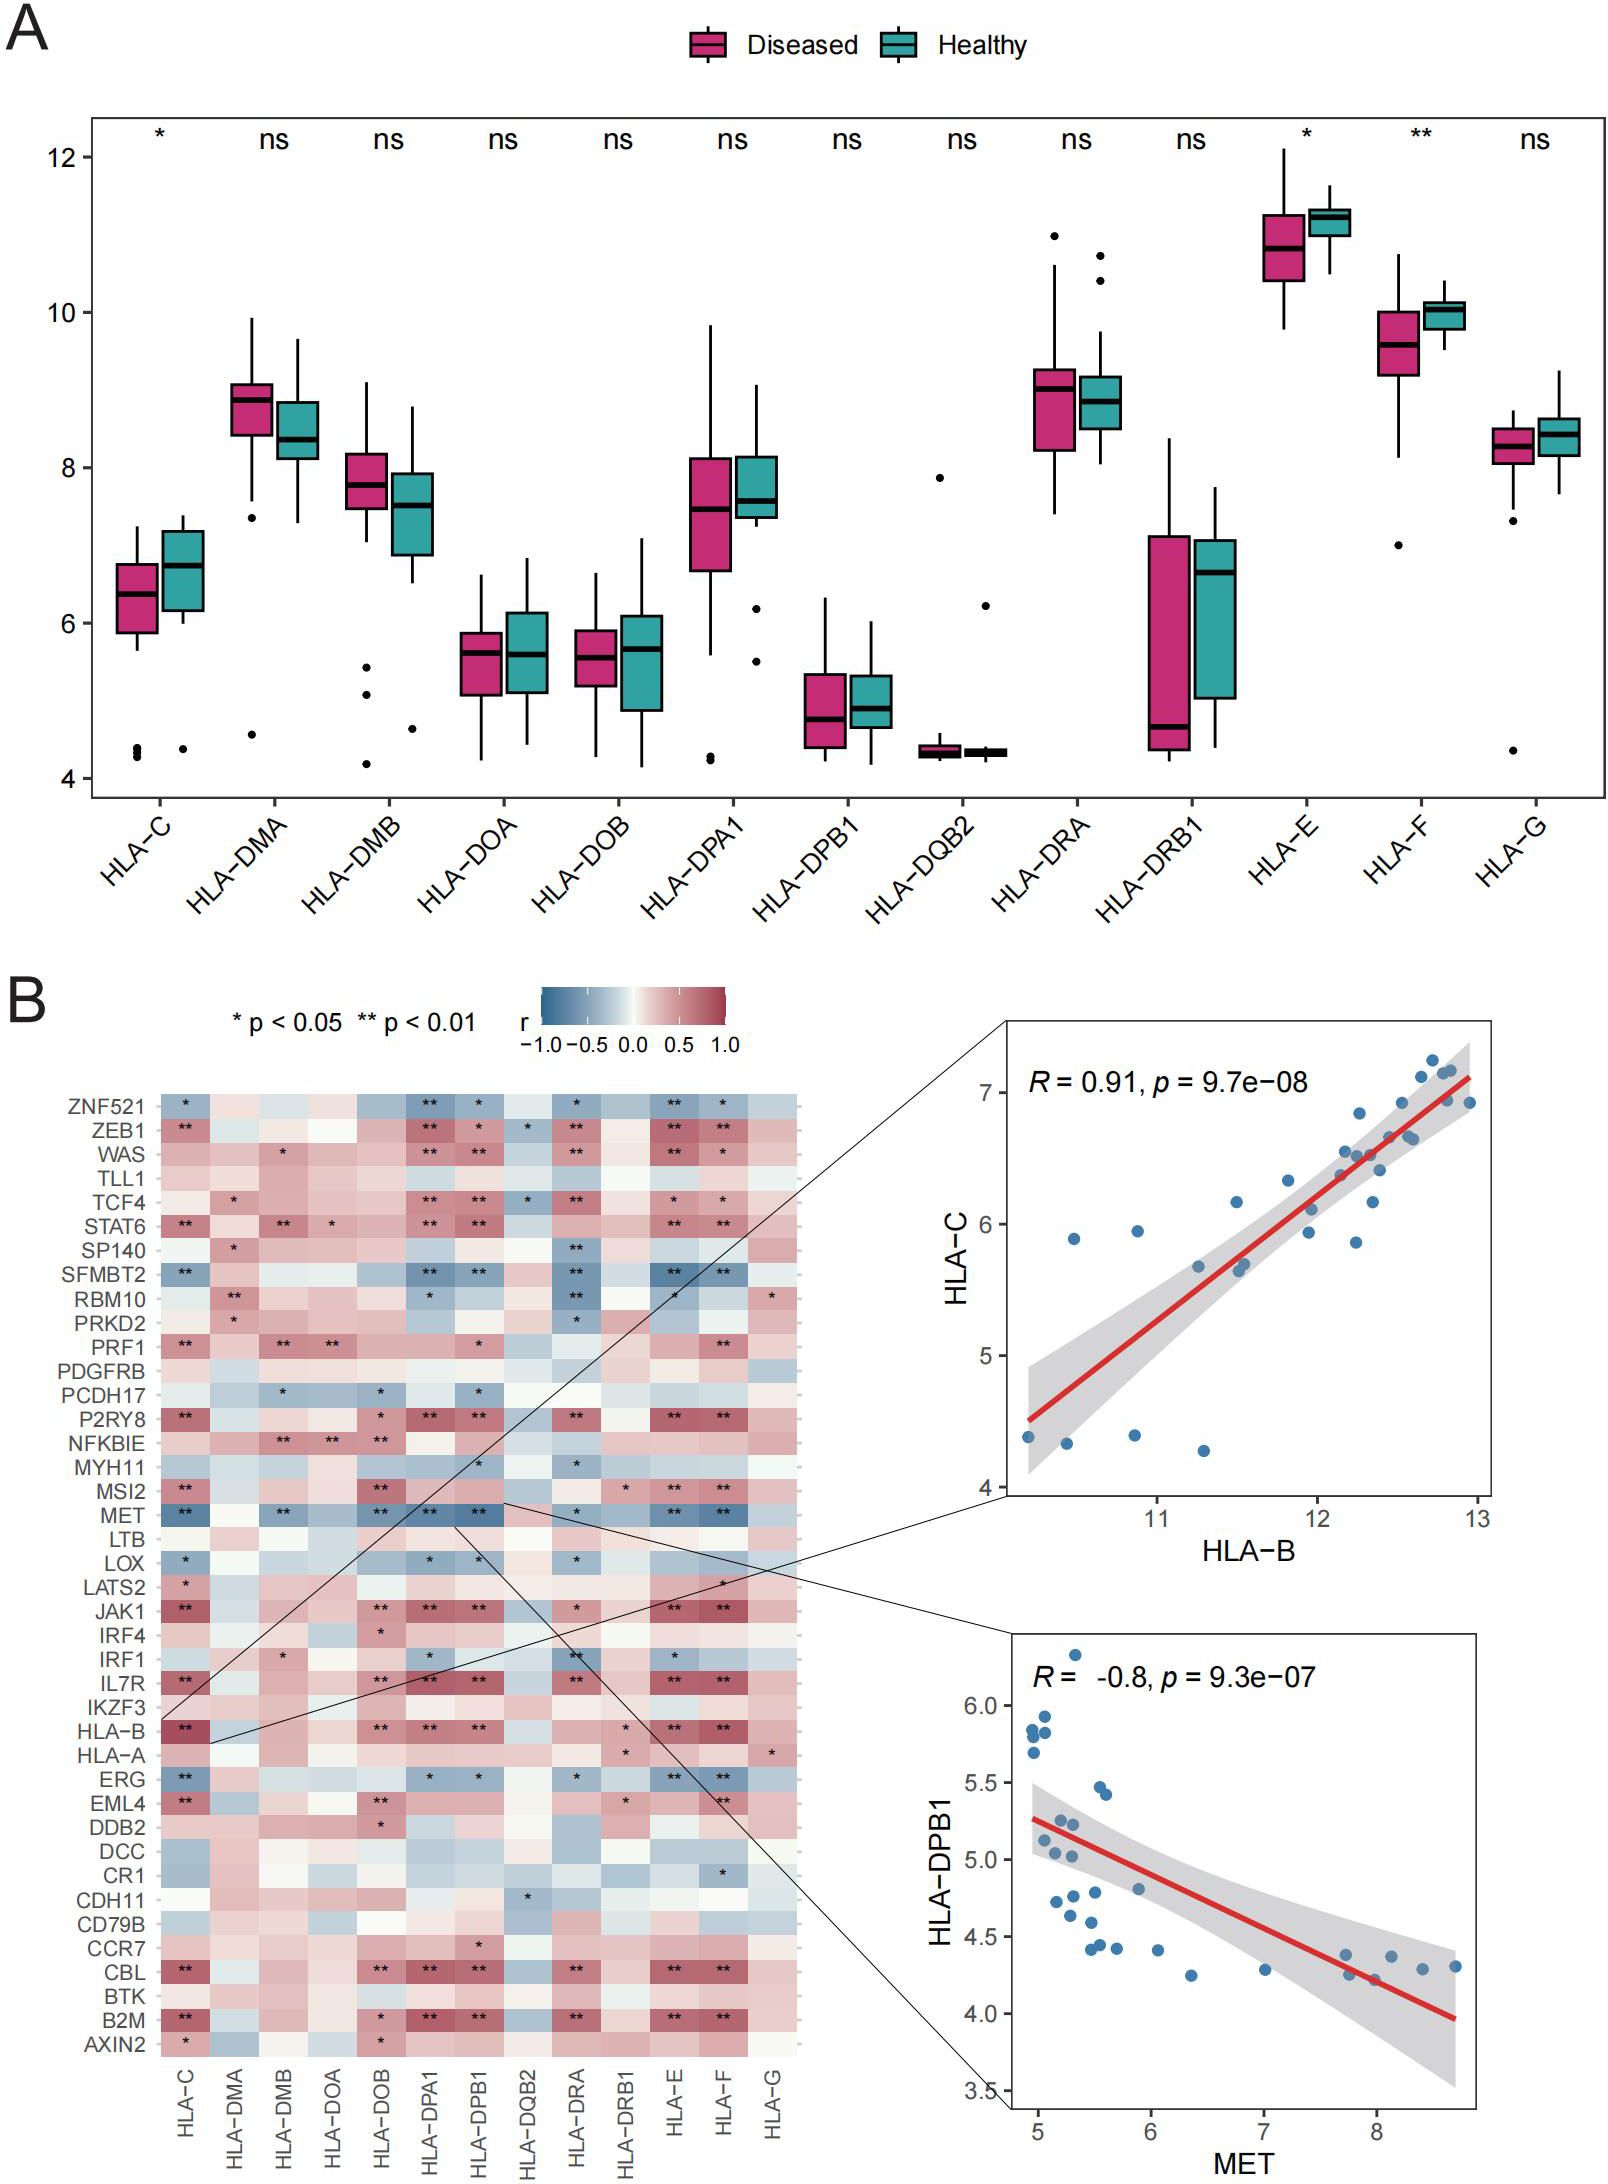
Figure 2. HLA gene analysis. A: Box plot showing gene expression differences between the HC and GD groups. B: Spearman correlation of Tex-related gene expression in GD samples. ns (p>0.05), *P<0.05, **P<0.01.
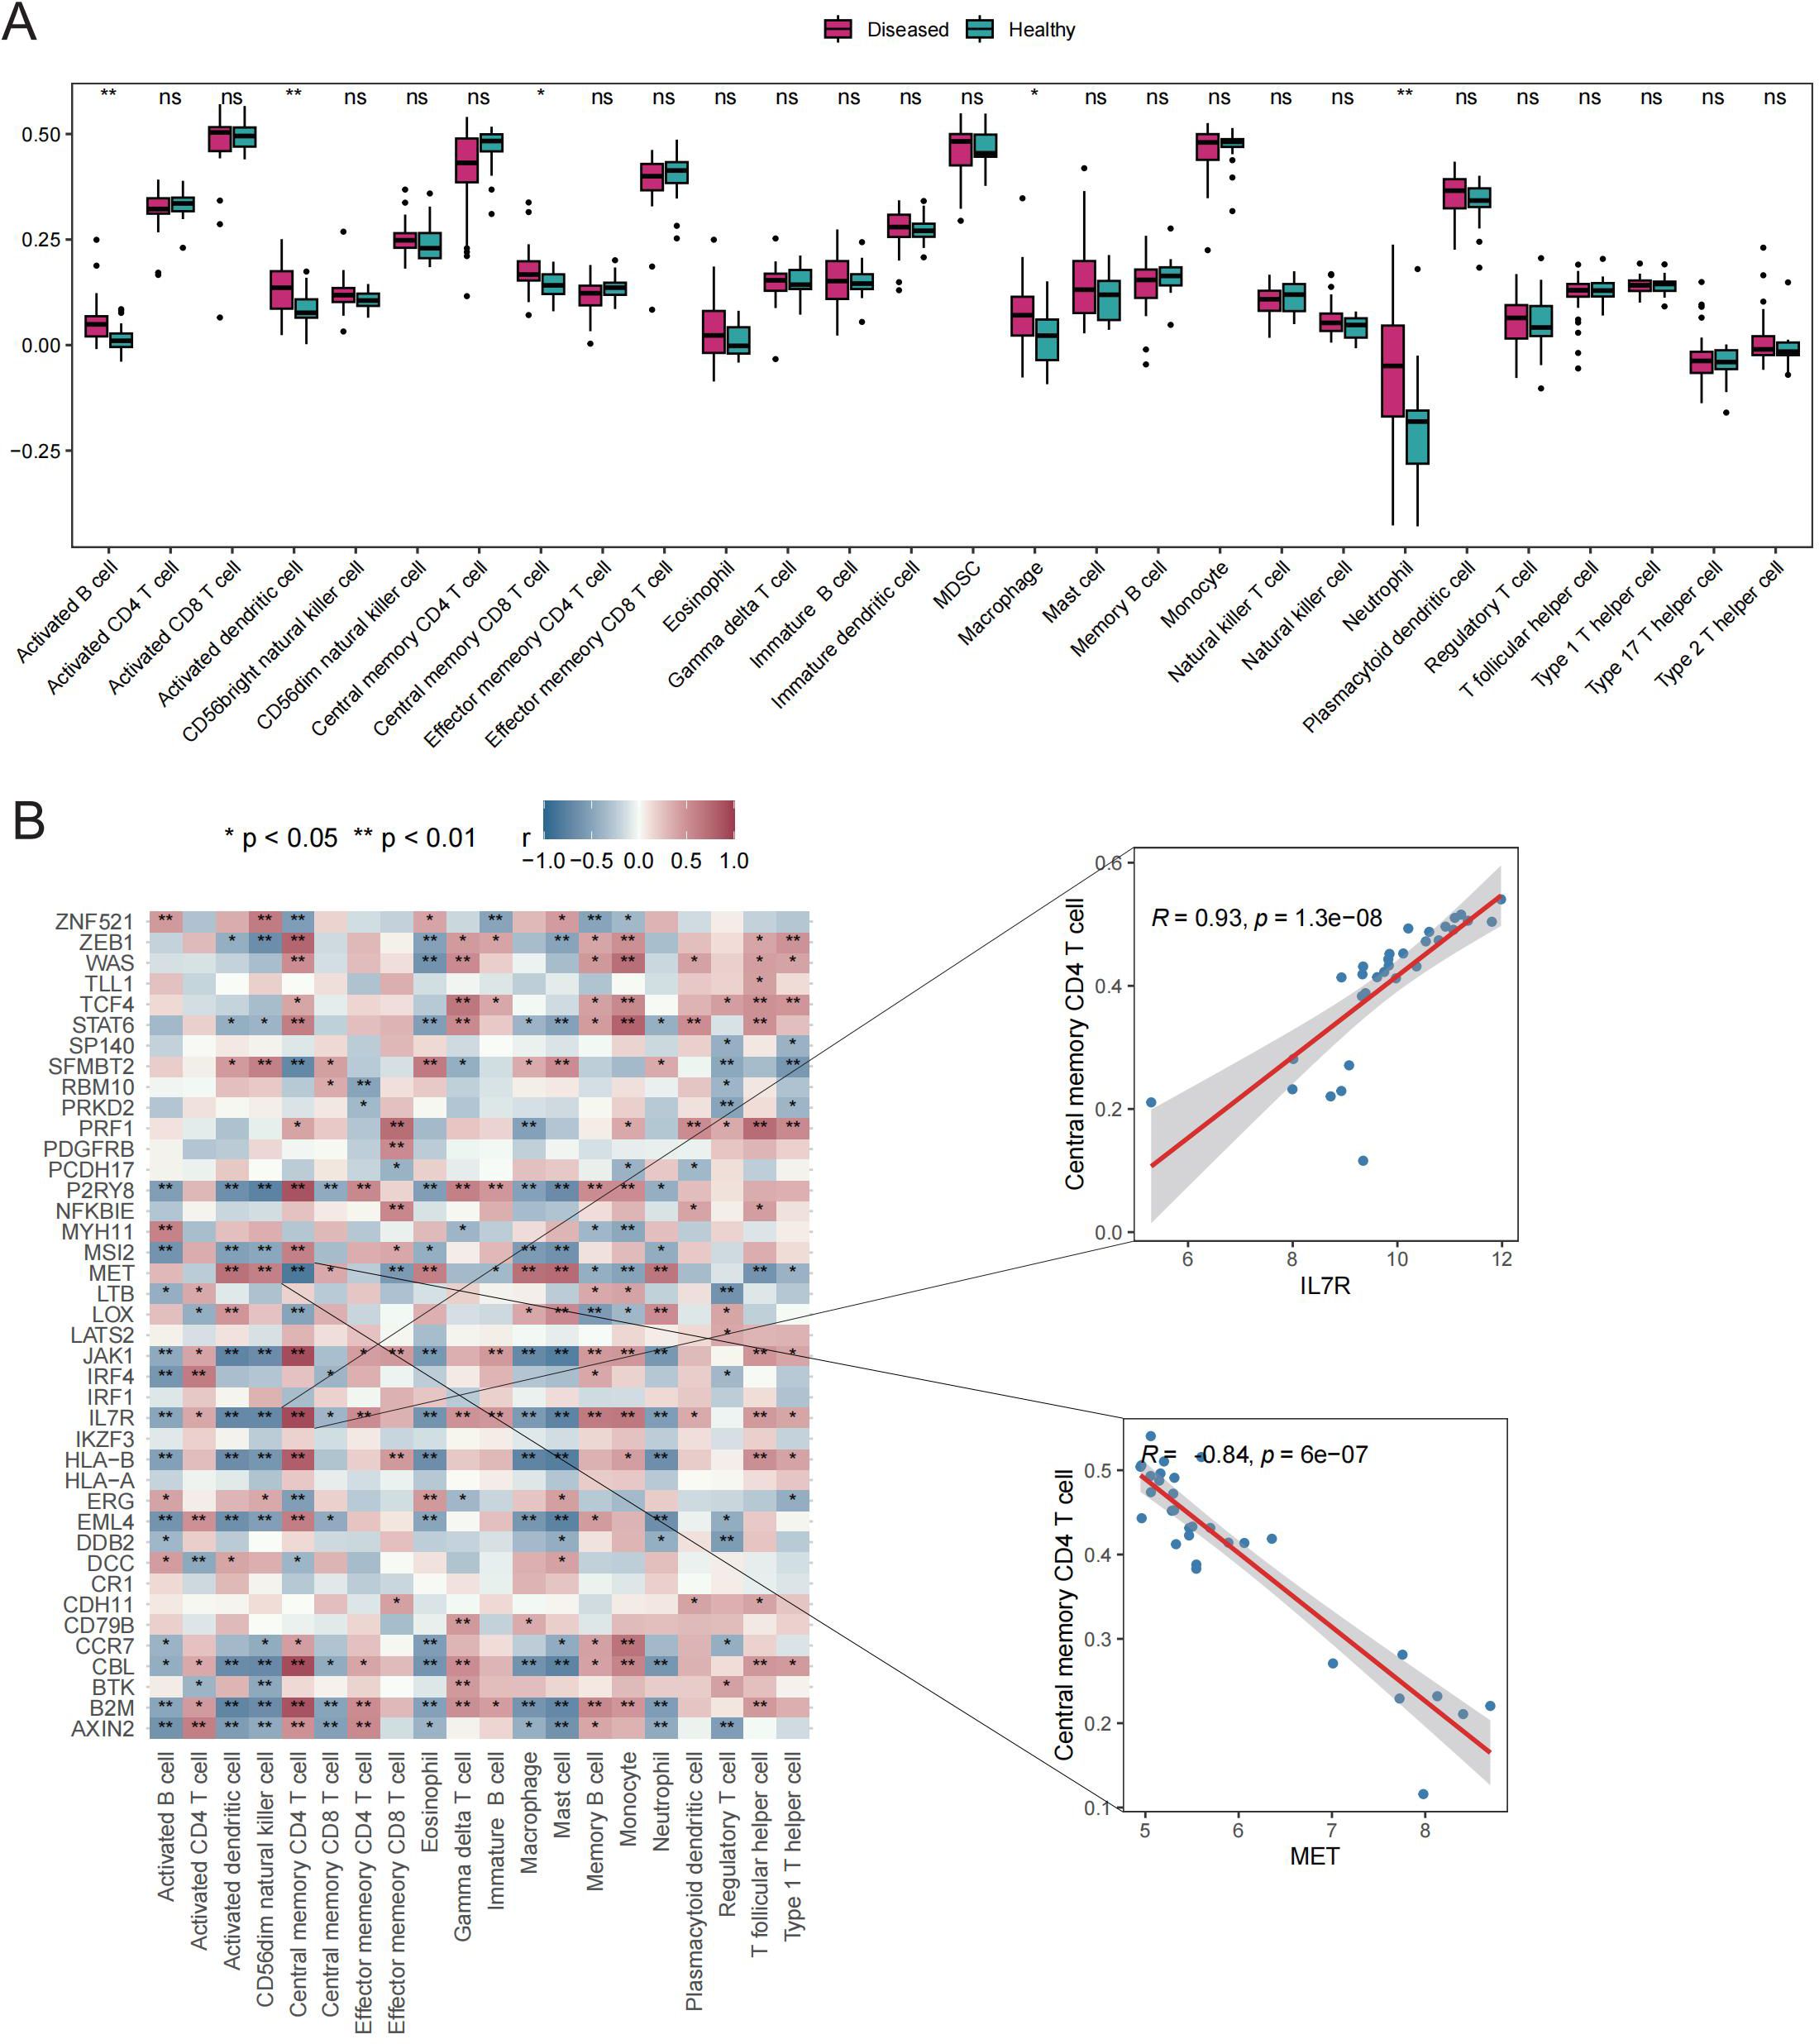
Figure 3. Immune cell infiltration scores. A: Box plot depicting expression of top 20 genes in the HC vs. GD groups. B: Spearman correlation of gene expression related to Tex in GD samples. ns (p>0.05), *P<0.05, **P<0.01.
Six immune response scores, including those for Chemokine Receptors, Cytokine Receptors, Interleukin Receptors, TGFβ Family Members, and TNF Family Members Receptors, were significantly different between GD patient samples and HC samples (Figure 4A). Significant correlations were found between immune response scores and the expression of Tex-related genes. Of particular interest was a close correlation between CBL expression and the significantly enriched immune responses in samples from GD patients (Figure 4B). These results suggest that the expression of Tex-related genes may impact GD progression through immunomodulatory effects.
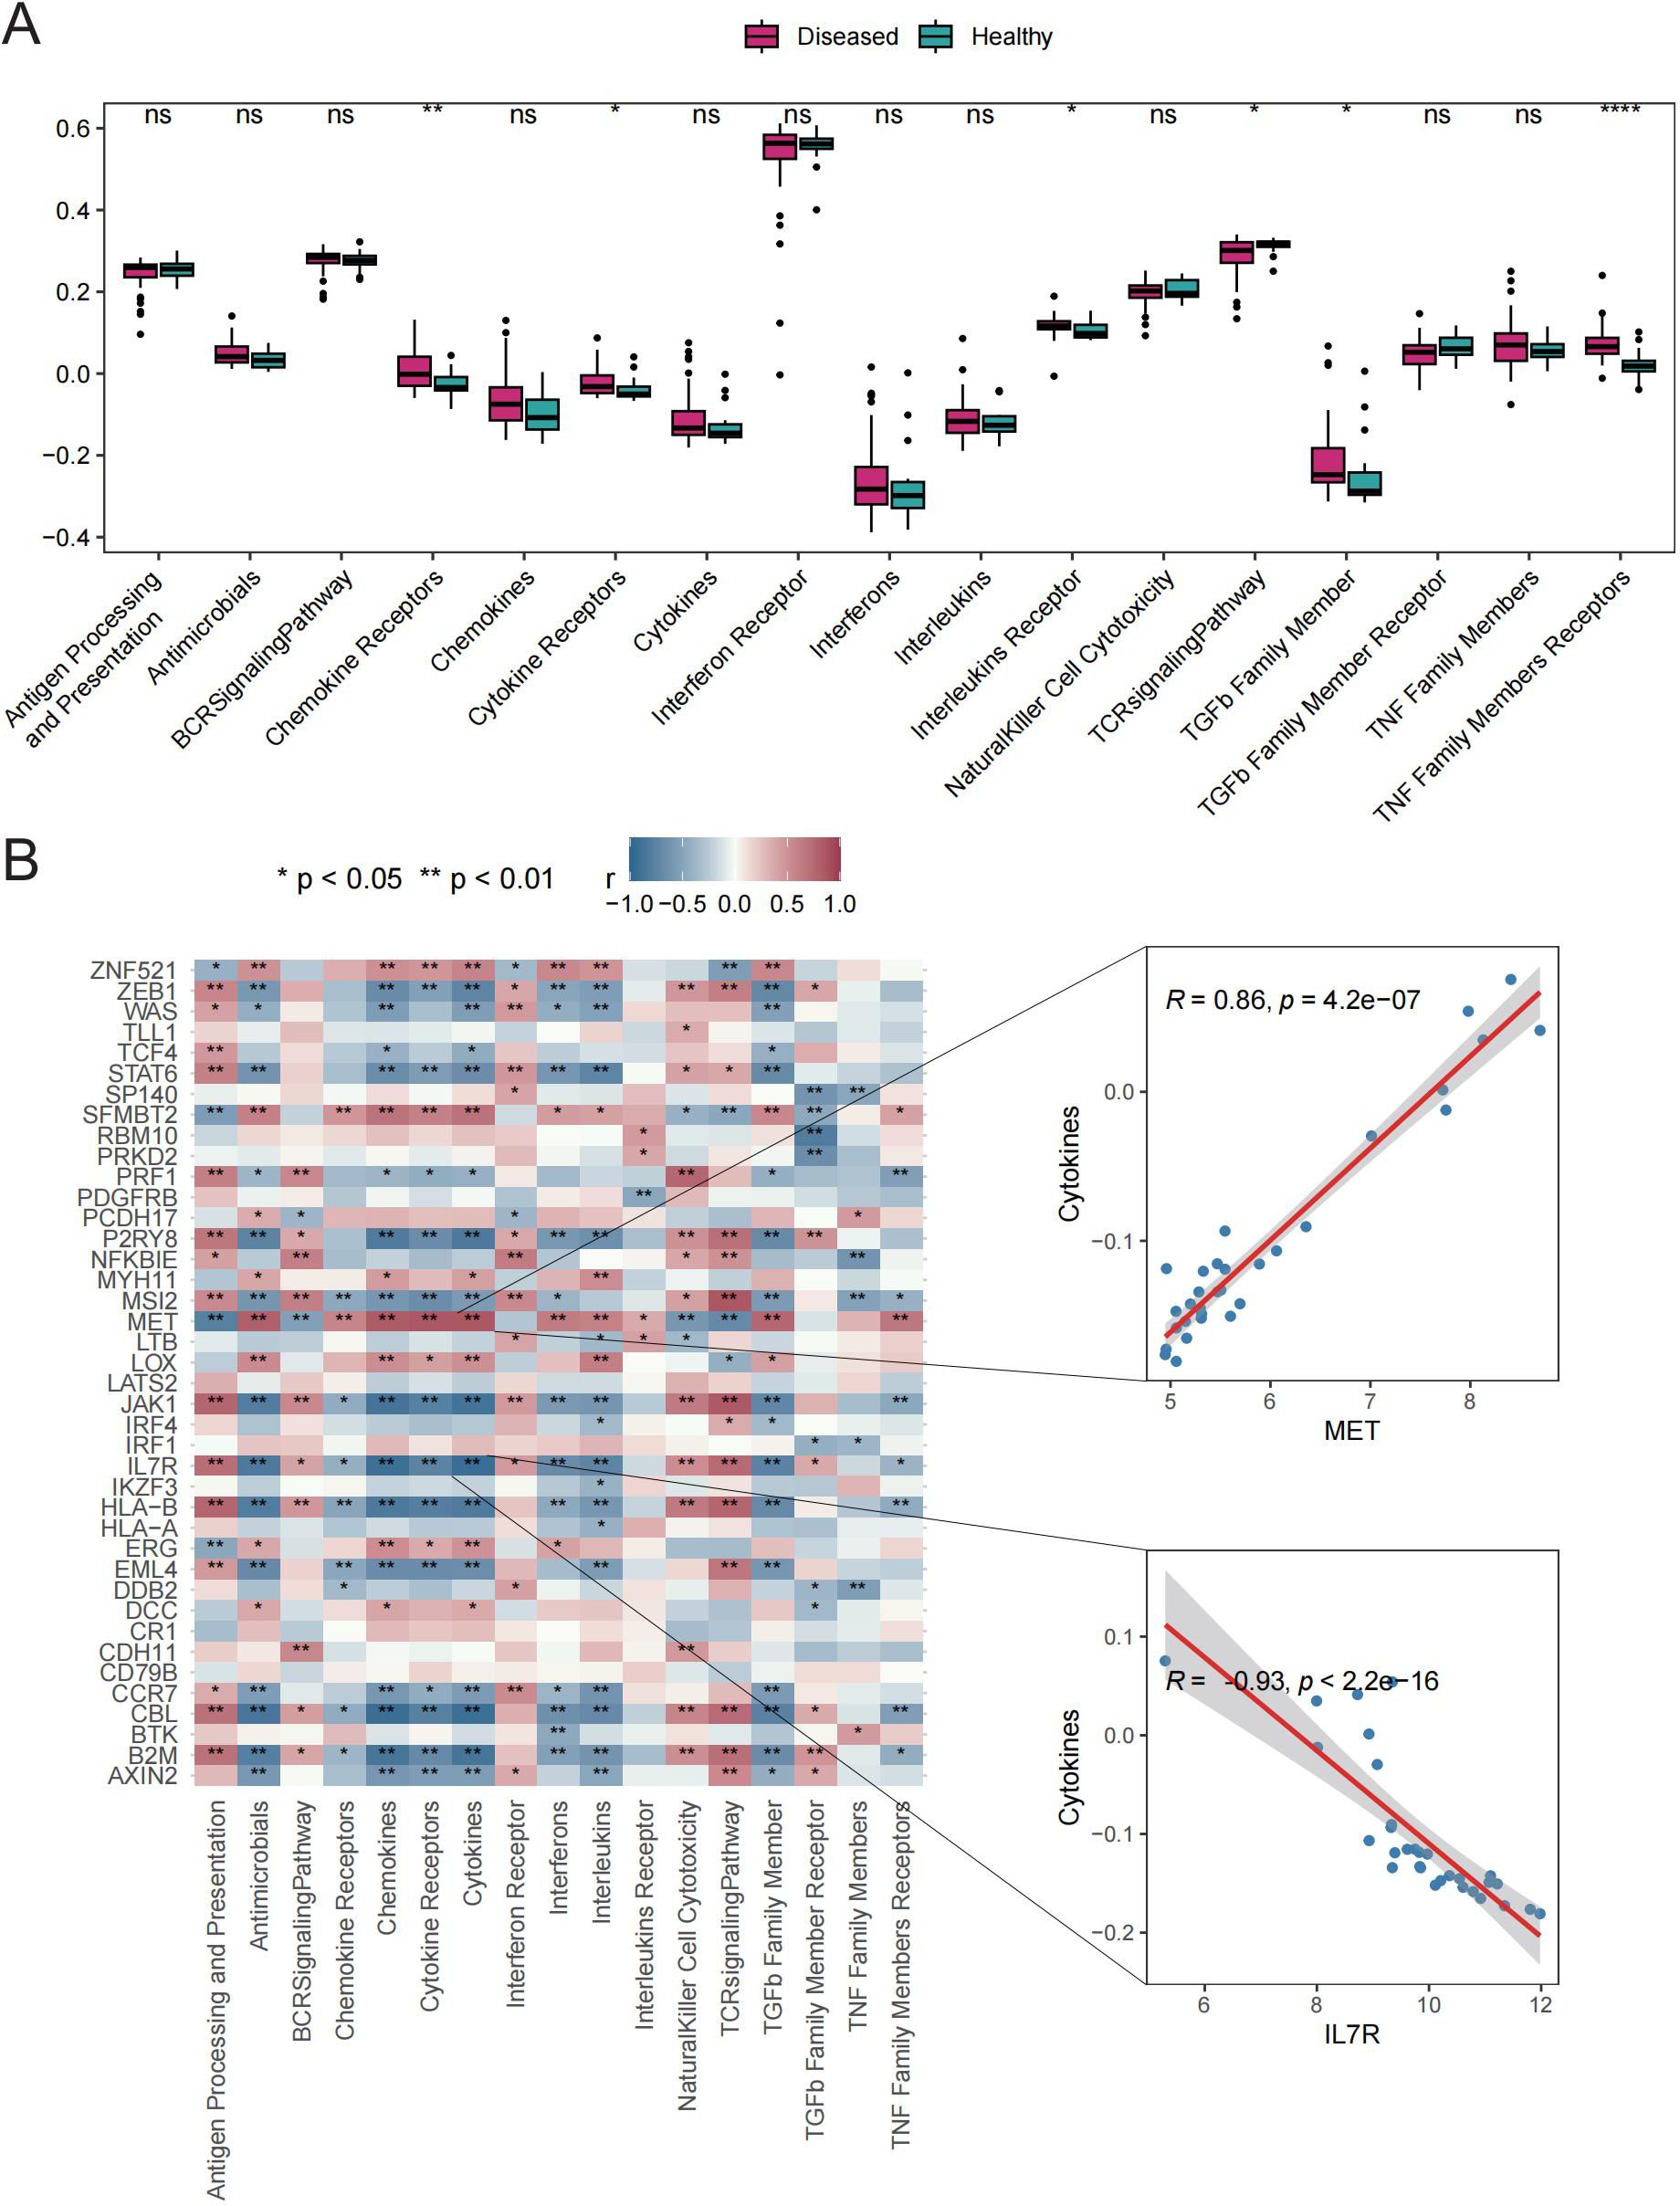
Figure 4. Immune response scores. A: Box plot showing differences in immune response scores between the HC and GD groups. B: Spearman correlation analysis for Tex-related gene expression in GD samples. ns (p>0.05), *P<0.05, **P<0.01, ****P<0.0001.
To elucidate the expression patterns of Tex-related genes associated with GD, we performed unsupervised cluster analysis, which classified 31 GD patient samples into two subtypes: Subtype1 (n=25) and Subtype2 (n=6), based on the expression profiles of 40 Tex-related genes (Figures 5A-C). The two disease subtypes were effectively determined by expression of T cell depletion-related genes (Figure 5D), with 21 Tex-related genes showing significantly differential expression, including notably CBL, which exhibited abnormally high expression in Subtype1 (Figure 5E).
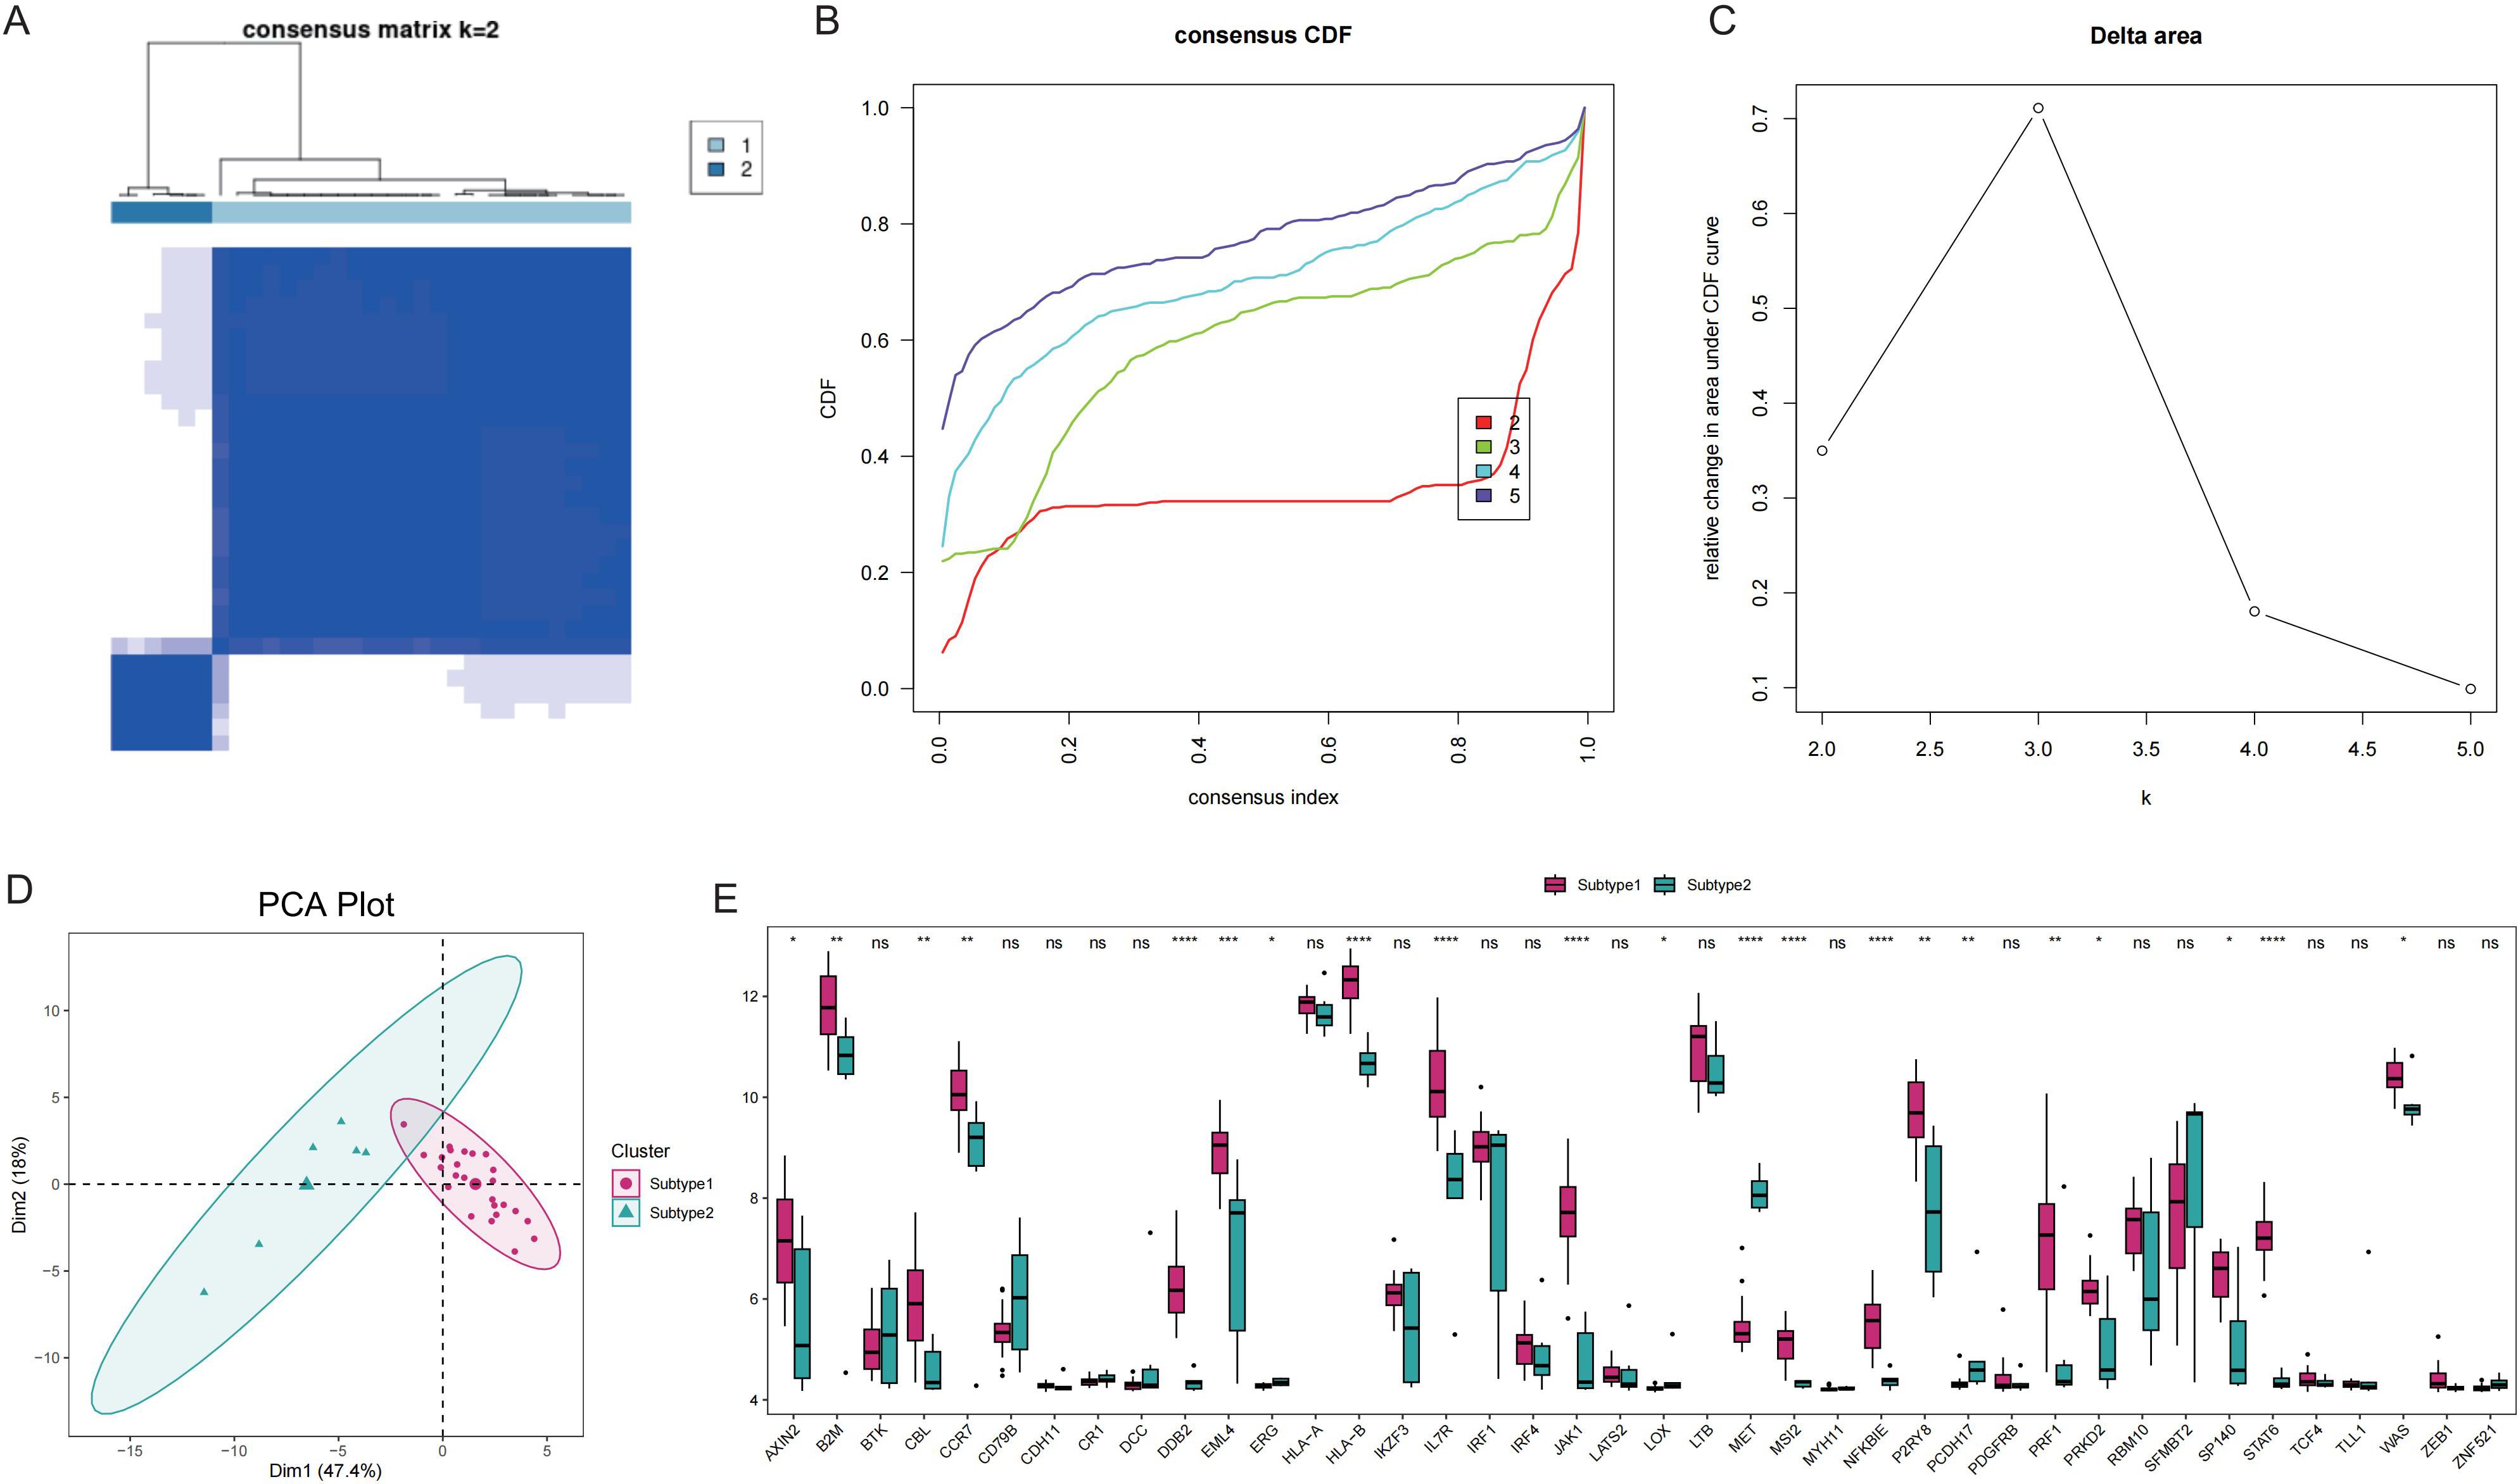
Figure 5. Disease subtype analysis. A: Consistent clustering of Tex-related genes; Subtype1 and Subtype2 represent two subgroups. B: Cumulative distribution function (CDF) plot; C: Delta Area Plot; D: Principal component analysis of T cell exhaustion-related genes; E: Box plots of Tex-related gene expression in the two subtypes. ns (p>0.05), *P<0.05, **P<0.01, ***P<0.001, and ****P<0.0001.
Comparisons between subtypes revealed differences in pathway activity, HLA gene expression, immune cell infiltration score, and immune response score. Specifically, the results revealed significant distinctions in the pathway activities of the ECM RECEPTOR INTERACTION, ERBB SIGNALING PATHWAY, and MTOR SIGNALING PATHWAY between the subtypes (Figures 6A, B). Additionally, 17 immune cell infiltration scores, including those for activated B cells, activated dendritic cells, and activated CD8+ T cells, differed significantly between the subtypes (Figure 6C). The expression of 8 HLA genes and immune response scores related to cytokine receptors, natural killer cells, cytotoxicity, and the T-cell receptor (TCR) signaling pathway also showed significant differences between the two subtypes (Figures 6D, E). These findings suggest the presence of two distinct disease subtypes within GD that have divergent immunological characteristics based on the distinct expression patterns of Tex-related genes.
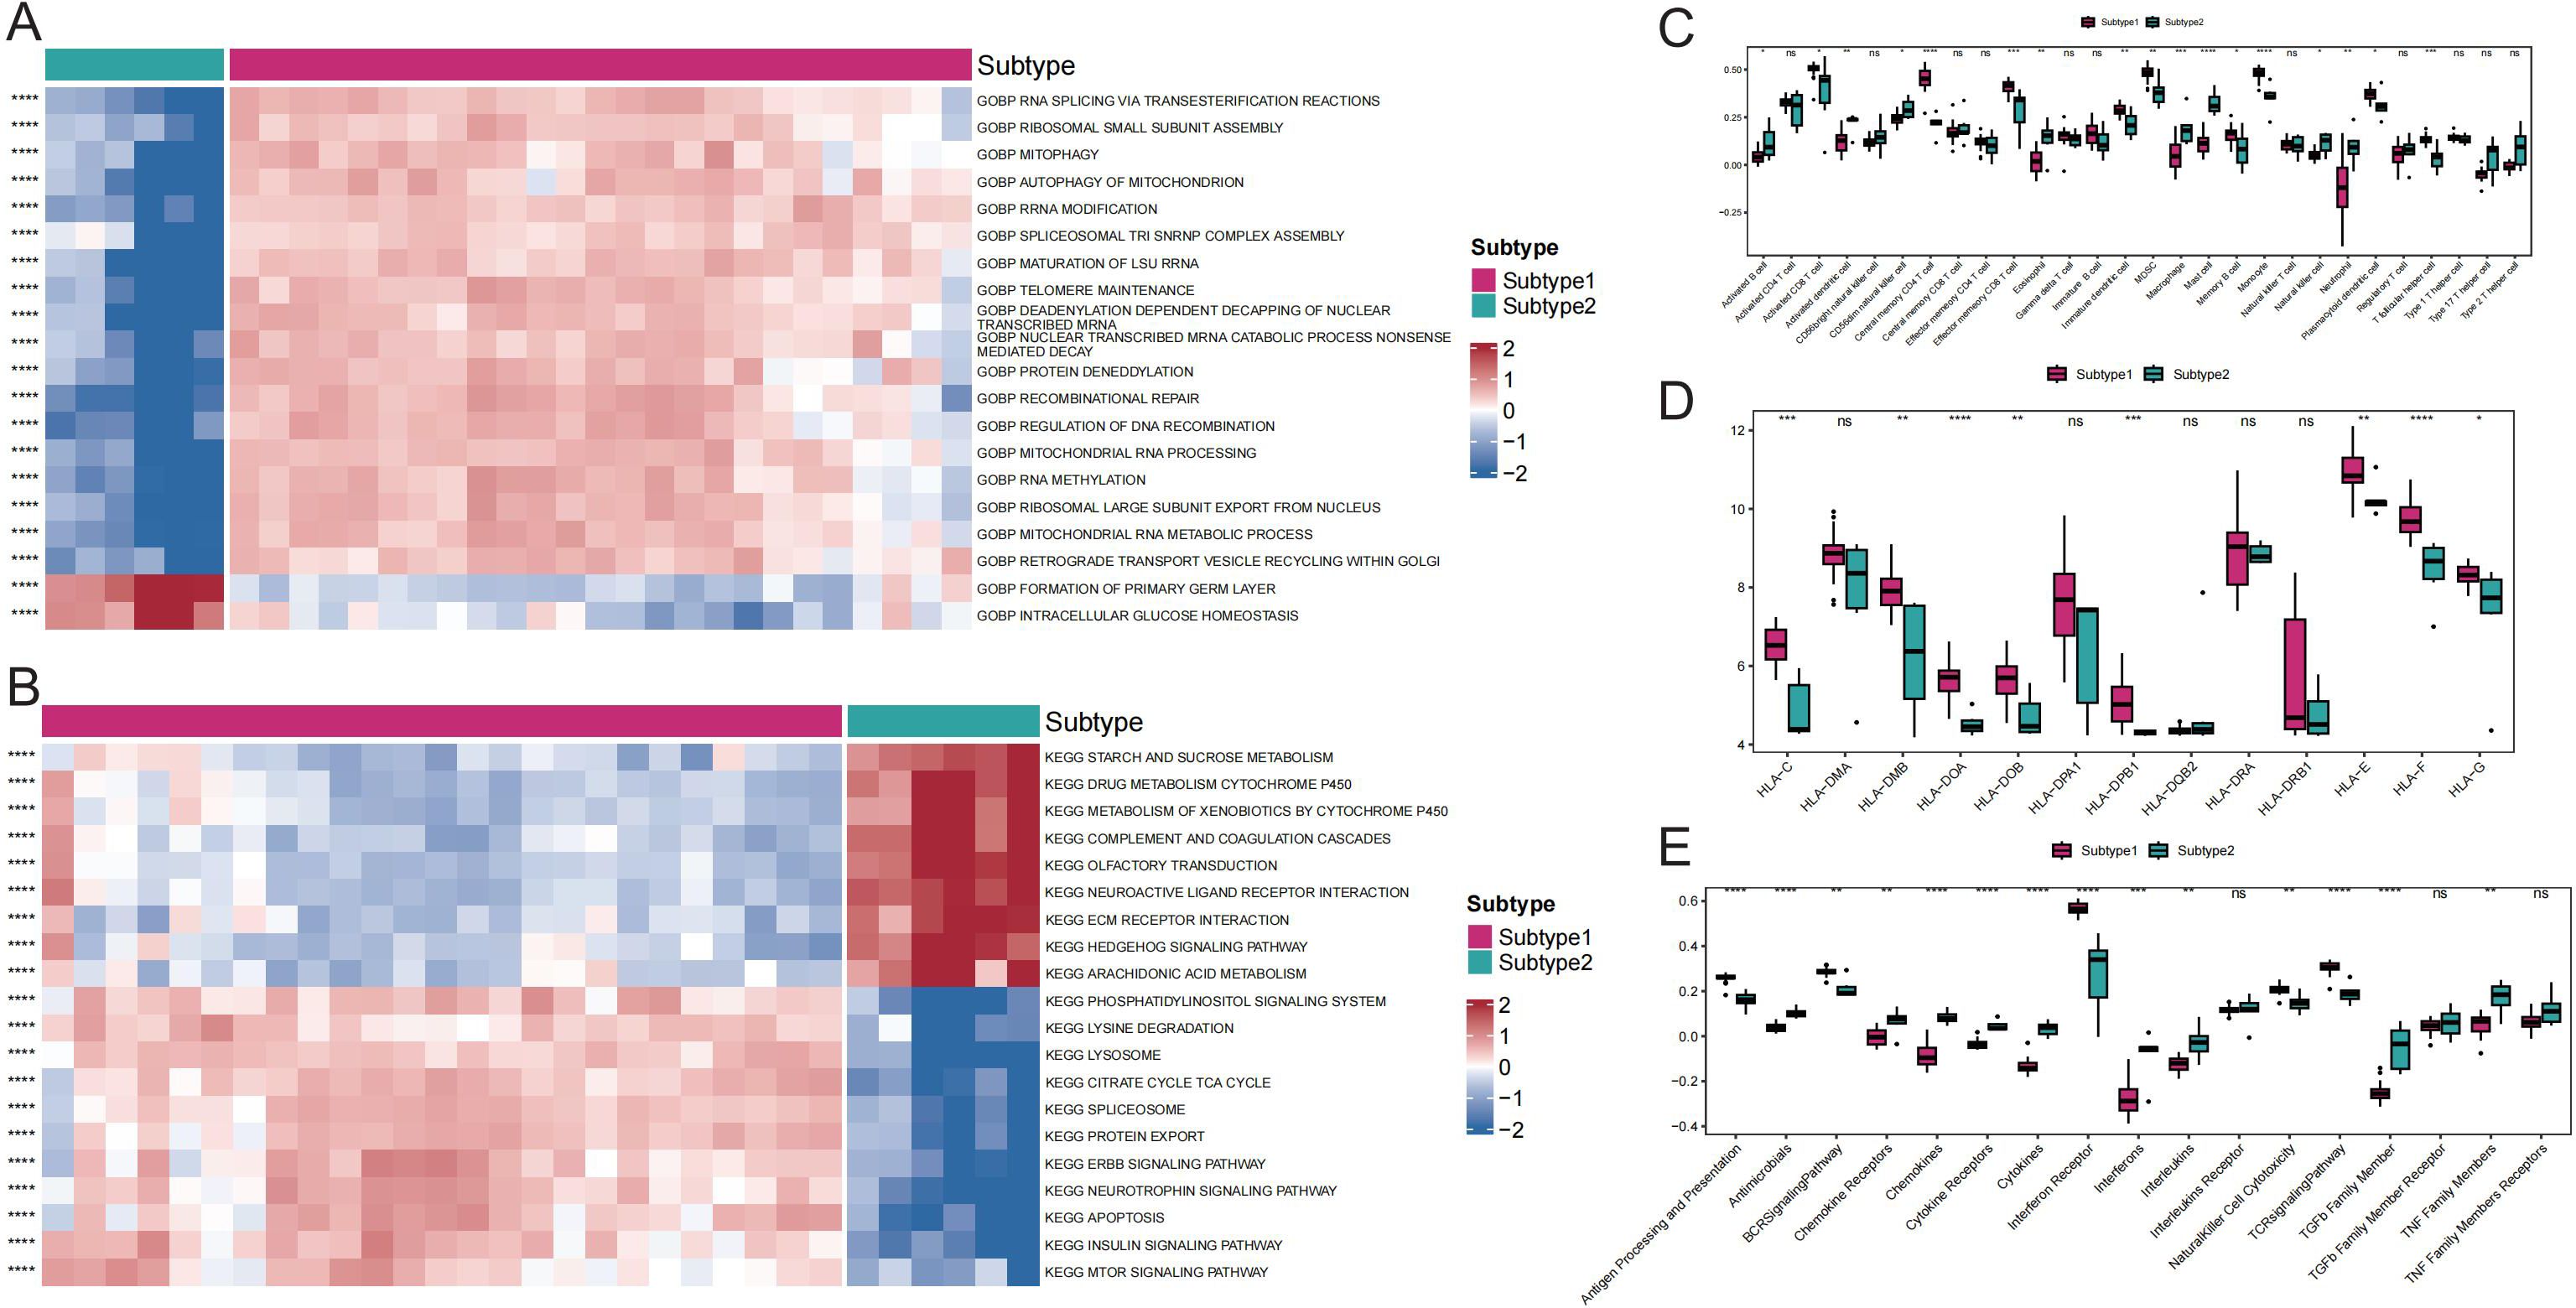
Figure 6. Comparison of immune responses between subtypes of GD. A: Heat map of differential gene ontology biological process (GOBP) pathway activity between GD subtypes. B: Heat map of differential Kyoto Encyclopedia of Genes and Genomes (KEGG) pathway activity between GD subtypes. C: Differential immune cell infiltration scores between GD subtypes. D: Comparison of HLA gene expression between GD subtypes. E: Differential immunoreactivity scores between GD subtypes. ns (p>0.05), *P<0.05, **P<0.01, ***P<0.001, and ****P<0.0001.
To explore key molecules associated with the GD subtypes, WGCNA was performed on the top 50% of genes and identified 21 modules (Figures 7A, B). Based on the calculated correlation coefficient, the turquoise module was most positively correlated with Subtype1, and the magenta module was most positively correlated with Subtype2 (Figure 7C). These modules were considered key modules for Subtype1 and Subtype2, respectively, and 1441 and 59 module core genes were screened based on GS and MM, respectively (Figures 7D, E).
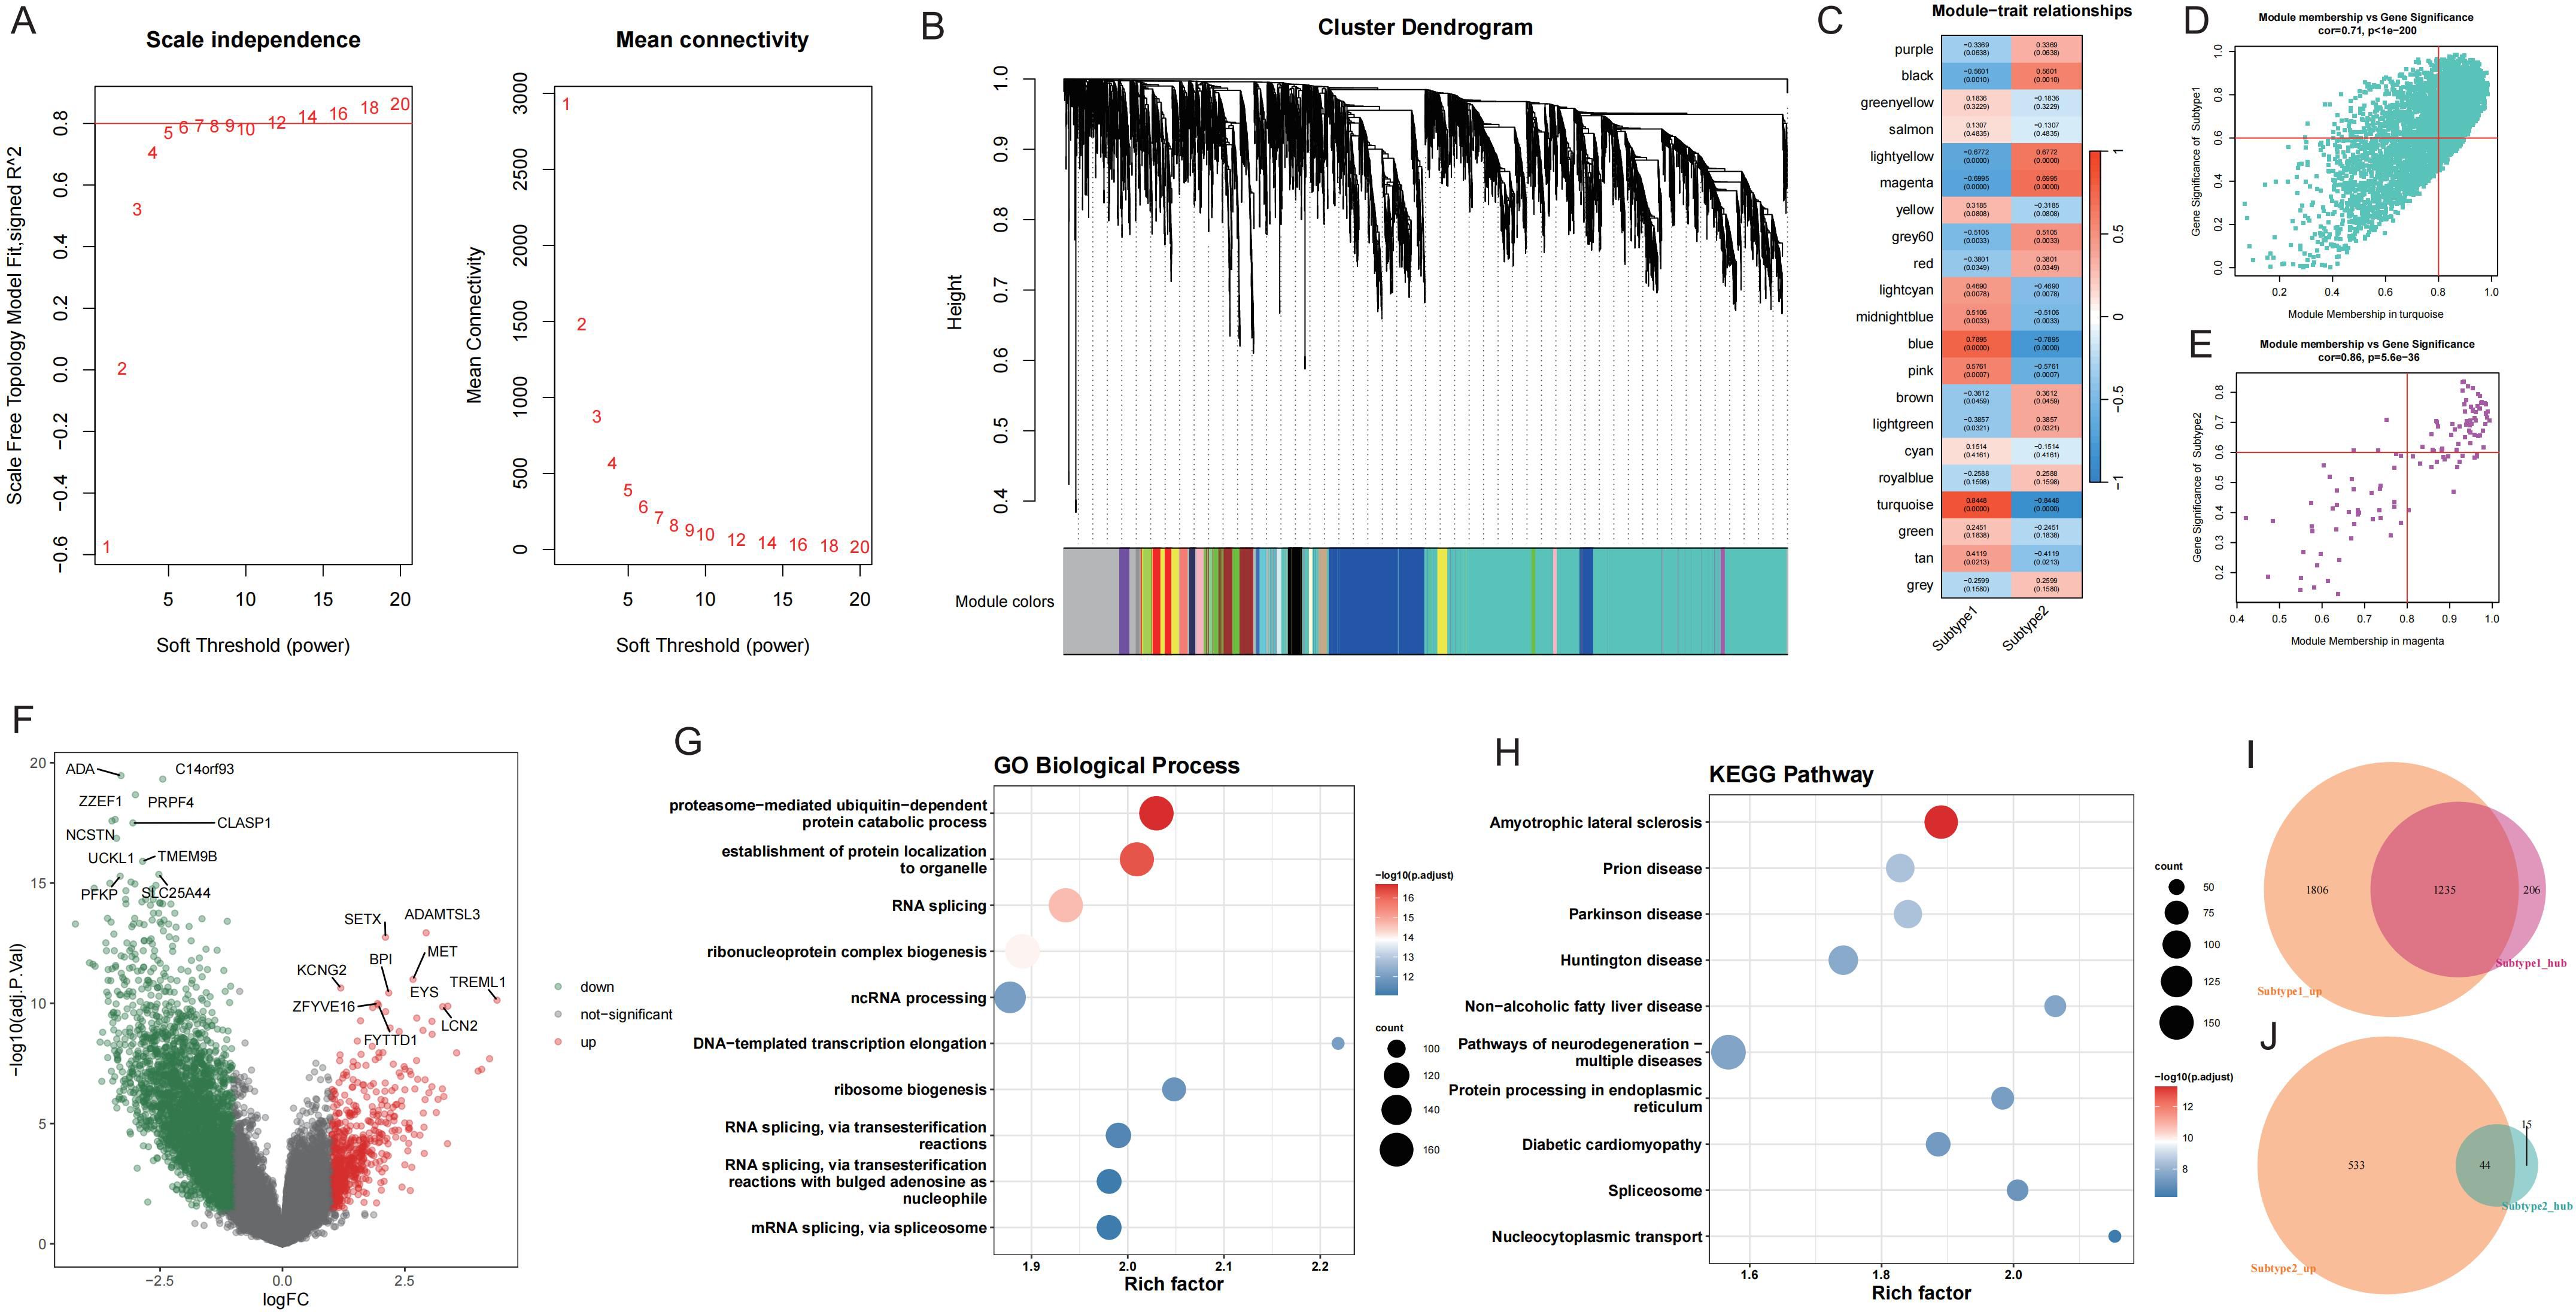
Figure 7. WGCNA screening of core genes for key modules of each GD subtype. A: Analysis of network topology for various soft-thresholding powers. B: Gene dendrogram and module colors. C: Module-feature correlation. D-E: Turquoise and magenta module screening for core genes. F: Volcano map of differentially expressed genes between GD subtypes; Subtype1 is control. G-H: Enrichment analysis of differentially expressed genes between GD subtypes. I-J: Wayne's diagram of core genes and upregulated genes in each subtype.
Upon application of the limma package, 3041 DEGs with upregulated expression in Subtype1 and 577 DEGs with upregulated expression in Subtype2 were identified (Figure 7F). Enrichment analysis was conducted on these DEGs (Figures 7G, H), and the intersection of core genes with upregulated genes in each subtype yielded 1235 core DEGs in Subtype1 (Figure 7I) and 44 core DEGs in Subtype2 (Figure 7J).
To identify potential therapeutic targets and drugs, subtype hub genes and drug molecules were screened using the PPI network and DGIdb database. From the constructed PPI networks for Subtype1 and Subtype2, the top 5 hub genes were selected based on node connectivity (Figures 8A, C). The hub genes for Subtype1 were HSPA5, MYC, EEF2, EP300, and POLR2B, while those for Subtype2 were RAX2, P2R2B, and P2R2B. Queries of interactions between hub genes and drugs in the DGIdb database revealed interactions of MYC and EIF2AK4 with various drugs (Figures 8B, D). Examples include novobiocin, glutamine, and thioguanine for MYC and haloperidol, Hesperadin, and quetiapine for EIF2AK4.
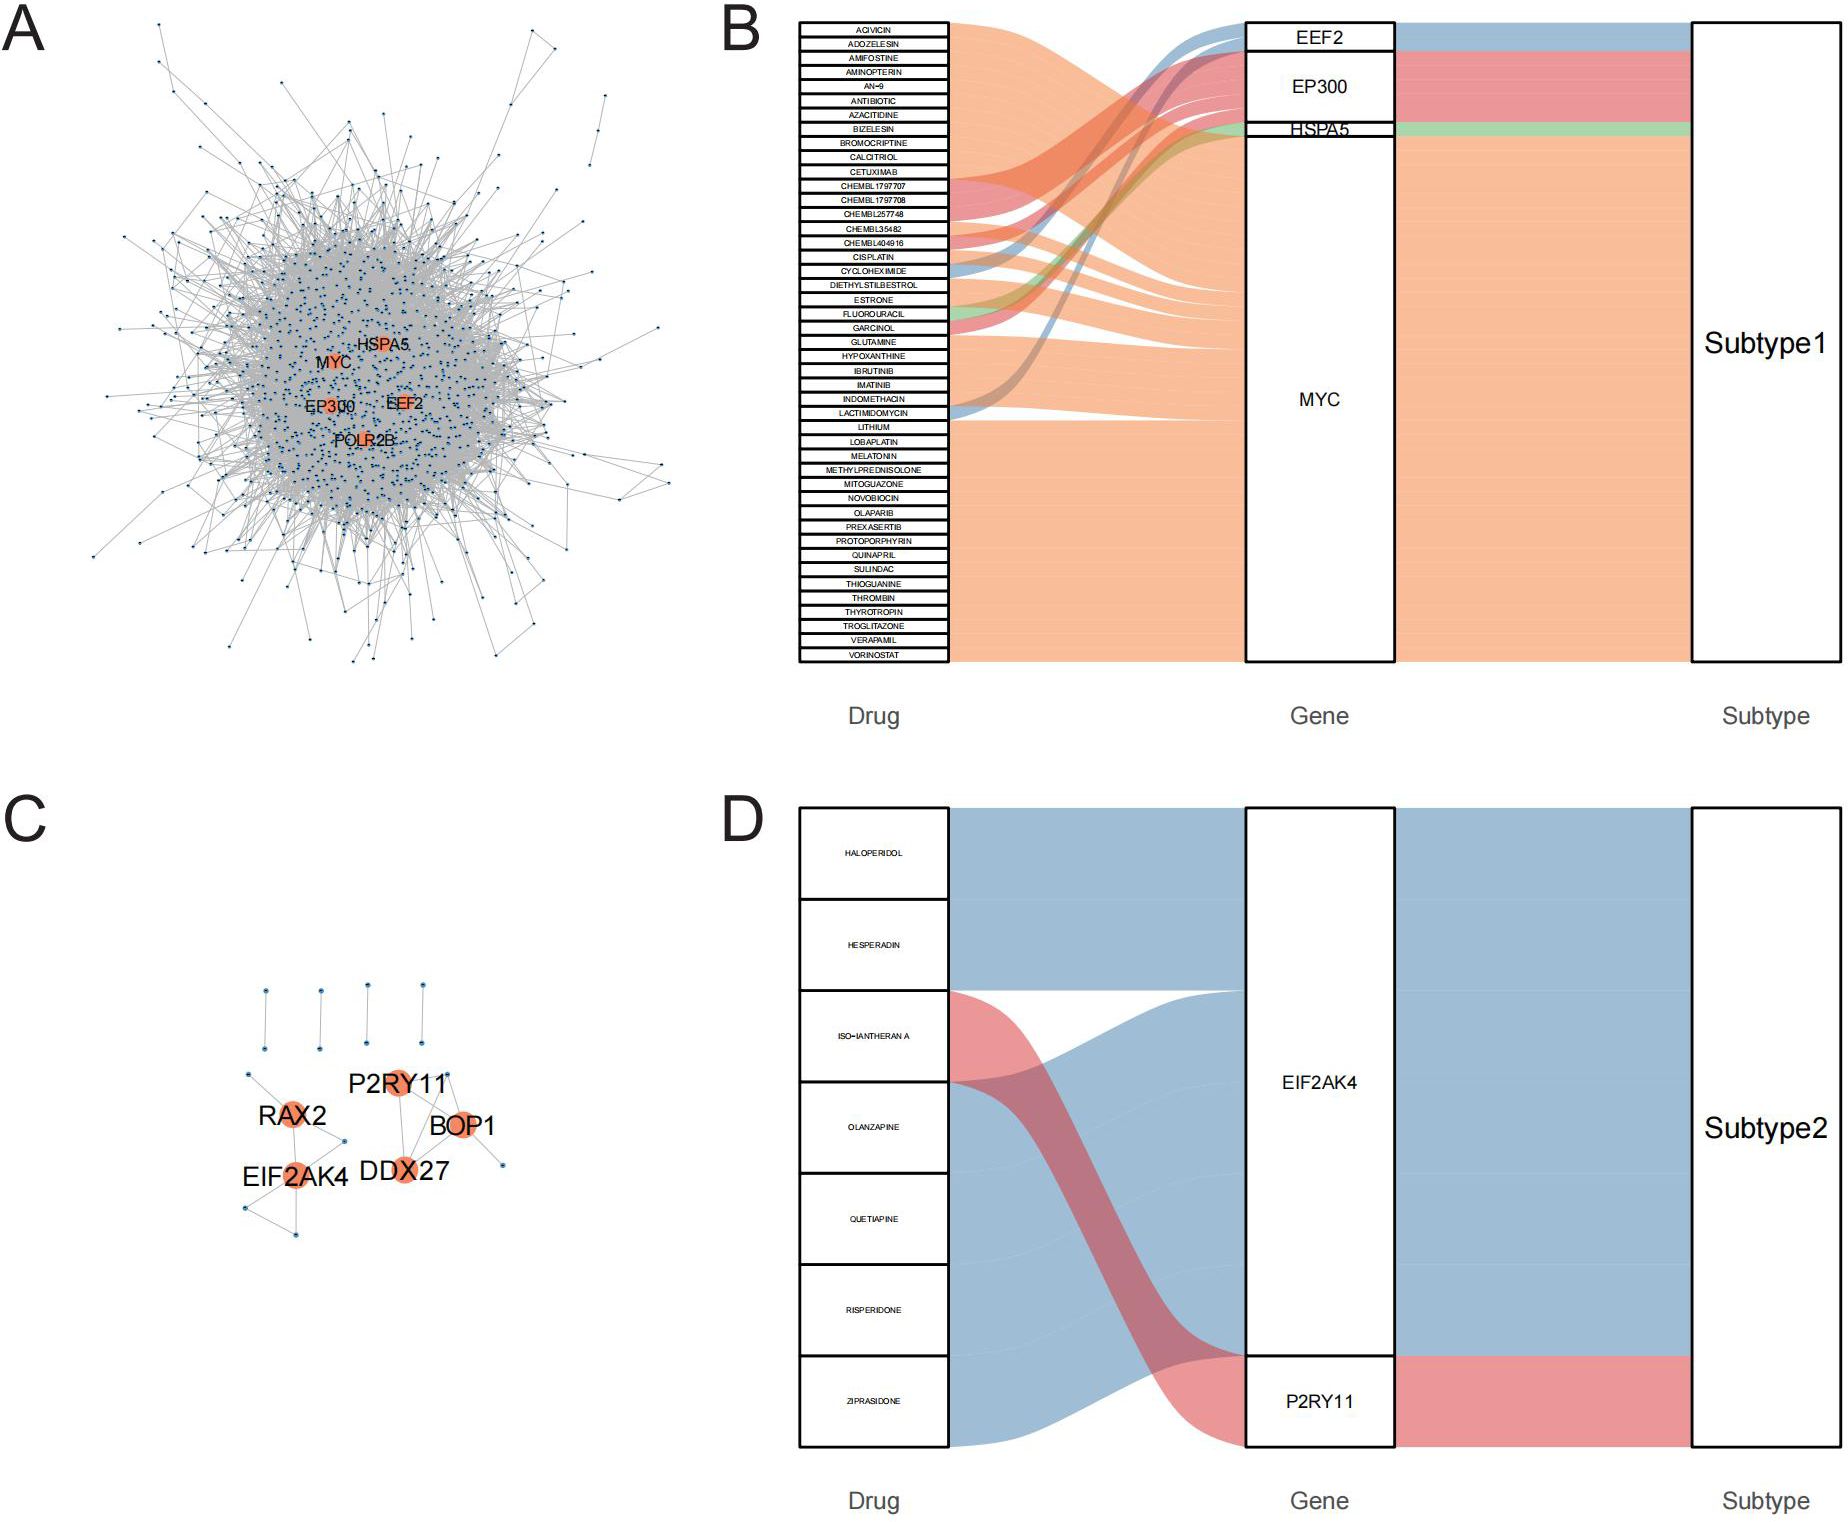
Figure 8. PPI networks identify hub genes for mining of potential drugs. A-C: PPI networks of core differentially expressed genes (DEGs) between the GD subtypes; A is Subtype1, C is Subtype2. B-D: Interactions of hub genes of GD subtypes with drugs.
Based on the general association of Tex with a favorable prognosis in autoimmune diseases (7), we examined whether Tex-related driver genes are abnormally downregulated in GD patient samples. Considering the results of a literature review, the CBL gene was chosen for validation of its expression in GD patient-derived PBMCs. CBL mRNA demonstrated abnormally downregulated expression in GD patients (Figure 9A, P=0.043). Furthermore, compared with that in samples from the primary group, CBL mRNA expression was lower in samples from the recurrent group (Figure 9B, P=0.020). CBL mRNA expression was significantly lower in GD patients with moderate-to-severe thyroid enlargement than in those without such enlargement (Figure 9C, P=0.002). Correlation analysis revealed a negative correlation between CBL mRNA expression and TRAb levels in GD patients. However, no significant associations were observed between CBL expression and the levels of FT3, FT4, and TSH (Table 1). These findings suggest that the Tex-related gene CBL may play a crucial immunoregulatory role in the pathogenesis of GD.
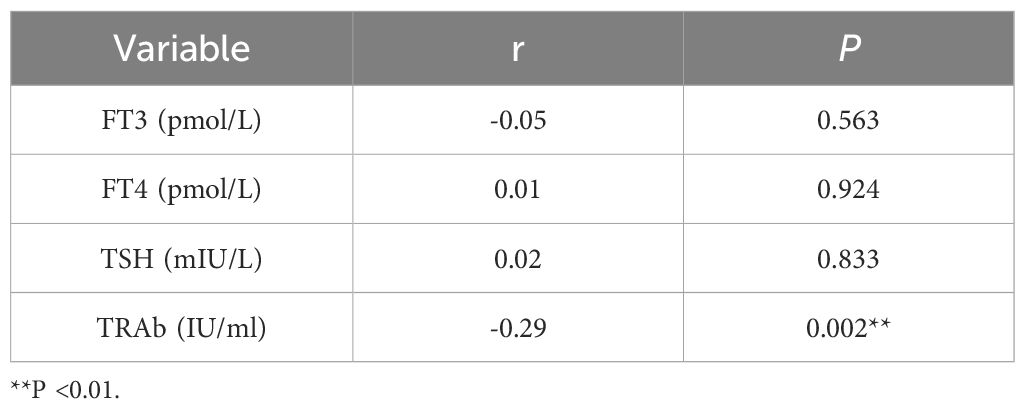
Table 1. Correlation analysis between CBL expression and laboratory indicators.
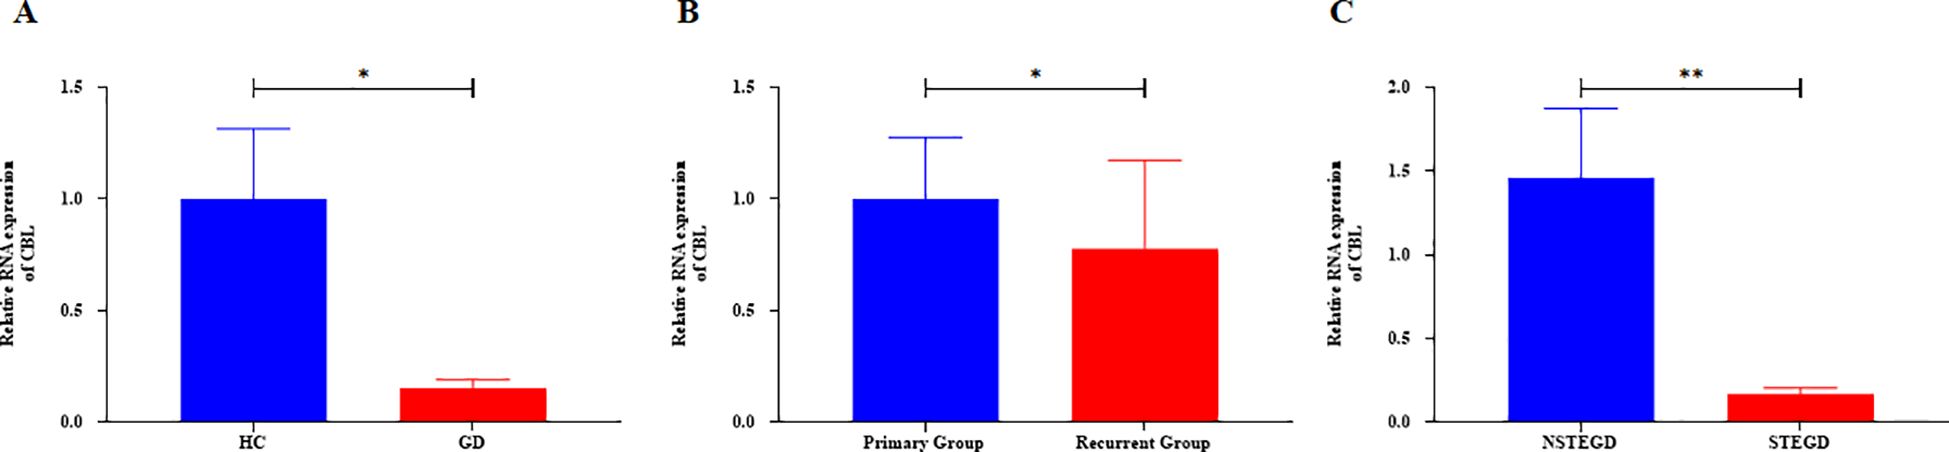
Figure 9. Expression of Tex-related gene CBL in PBMCs of GD patients. A: Abnormal downregulation of CBL mRNA expression in GD patients. B: Lower CBL mRNA expression in the recurrent group compared with the primary group. C: Lower CBL mRNA expression in GD patients with moderate-to-severe thyroid enlargement compared to those without such enlargement. The error bars presented on multiple panels represent the Standard Error of the Mean (SEM), *P<0.05, **P<0.01. GD: Graves' disease patient group, HC: healthy control group, NSTEGD: those without thyroid enlargement or with Grade I enlargement GD, STEGD: those with Grade II-III enlargement GD.
GD is an autoimmune thyroid disorder characterized by elevated TRAb levels, lymphocytic infiltration, and tissue hyperactivation, with effects on multiple systems (2). T-cell dysfunction is pivotal in GD pathogenesis and progression, and Tex, a distinct T-cell functional state, has been implicated in various autoimmune disorders (15). This study explored alterations of Tex-related gene expression in GD, and the results provide insight on the Tex phenotype and potential regulatory mechanisms. By identifying hub genes associated with different subtypes of GD, potential therapeutic avenues are revealed, offering theoretical support and guiding future investigations into the roles of Tex-related genes in GD pathogenesis.
In autoimmune diseases, a complex interplay of factors, including prolonged antigenic stimulation, restricted CD4+ T-cell responses, limited co-stimulation during initial T-cell activation, diminished gamma-chain cytokine signaling, and characteristics of the tissue microenvironment (e.g., hypoxia, nutrient deficiencies, pH abnormalities), contributes to T-cell differentiation along exhaustion pathways (16). Tex results in substantial alterations in effector function, cytokine responses, and metabolic profiles, accompanied by specific transcriptional changes (17). Recent investigations have identified Tex in several autoimmune diseases, which exhibit abnormal expression of inhibitory receptors and altered gene profiles. For instance, Tex phenotype manifestation has been observed in pancreatic islet-specific CD8 T cells in type 1 diabetes (18). Frenz et al. demonstrated increased expression of inhibitory receptors programmed cell death protein 1 (PD-1) and cytotoxic T-lymphocyte associated protein 4 (CTLA-4) in CD4+ T cells from RA patients (19), while another study in ANCA-associated vasculitis patients revealed dysregulated expression of Tex-related genes in CD8+ T cells (20). Additionally, A et al. reported a depleted T regulatory cell 2 (Treg2) cell phenotype and elevated expression of Tex-related genes in SLE patients (21). The present investigation aimed to elucidate the intricate interactions of Tex-related genes in GD, and the results reveal aberrant expression of Tex-related genes in PBMCs of GD patients, suggesting a potential role for Tex in GD pathogenesis.
Marked by the expression of inhibitory receptors like programmed death ligand 1 (PD-L1), lymphocyte activation gene 3 (LAG-3), T-cell immunoglobulin and mucin domain 3 (TIM-3), cluster of differentiation 244 (CD244), CD160, and T cell immunoglobulin and ITIM domain (TIGIT), crucially modulate autoimmune responses, negatively regulating immunopathological pathways through adjustments in their transcriptional expression profiles (8). Tex is integral to maintaining immune homeostasis, although it does not alter the initial disease progression direction. For example, the elevated PD-L1 expression in synovial tissue and fluid of RA patients suggests the key role of the PD-1/PD-L1 co-inhibitory pathway in immune homeostasis regulation in RA (22). In Crohn’s disease, functional enrichment of Tex-related genes indicates their significance in various lymphocyte and immune activation pathways. Conversely, in SLE patients, aberrant expression of Tex-related genes in Tregs is associated with the nuclear factor kappa B (NF-κB) signaling pathway (21). These insights underscore the pivotal regulatory role of Tex in diverse autoimmune diseases. Previous studies implicated activated dendritic cells, macrophages, and neutrophils in the autoimmune and inflammatory responses of GD. These cells contribute through antigen presentation, cytokine secretion, and inflammatory mediator release. Furthermore, B cells activated by helper CD4+ T cells produce autoantibodies, intensifying the autoimmune response (23). Our study reveals that Tex-related gene expression in GD patients may regulate the recruitment of immune cells, such as activated dendritic cells, macrophages, neutrophils, and activated B cells, thereby participating in chemokine and cytokine receptor-mediated immune responses. Accordingly, we hypothesize that aberrantly expressed Tex-related genes in GD may influence disease development and progression by modulating the GD immune response. However, further functional experimental studies are required to confirm this hypothesis.
In our comprehensive exploration of the relationship between clinical phenotypes and Tex-related genes in GD patients, unsupervised cluster analysis revealed 40 Tex-related genes capable of classifying sequenced GD cases into two subtypes. These subtypes exhibited significant disparities in gene expression, immune cell infiltration, and immune response enrichment, consistent with previous findings (21). These findings suggest the involvement of Tex-related genes in the phenotypic variation of GD patients through immunomodulatory functions. Furthermore, through the identification of core genes expressed in different GD subtypes, we pinpointed potential therapeutic agents such as novobiocin, glutamine, thioguanine, haloperidol, Hesperadin, and quetiapine. Specifically, glutamine, which is known for its immune-modulating properties, has demonstrated modulatory effects in RA (24). Thioguanin, a nucleoside analog widely used in immunomodulatory therapies, has applications in treating Crohn’s disease, autoimmune hepatitis, lupus nephritis, and transplant rejection prevention (25). Haloperidol, an antipsychotic, exhibits a potential modulating effect on pro-inflammatory T-cell function and has shown therapeutic efficacy in a rat model of RA, despite being primarily indicated for psychiatric disorders (26). Hesperadin, an antioxidant, has demonstrated efficacy in treating RA and experimental allergic encephalomyelitis (27). Quetiapine has been reported to reduce autoimmune-mediated demyelination by inhibiting T-cell responses (28). While the use of these drugs in GD remains unreported, drawing from previous studies, we posit that these drugs targeting Tex-associated genes may present novel avenues for GD treatment.
For further analysis in GD patients, CBL was selected as a candidate gene due to its abnormally low expression in GD samples and its role in negatively regulating the immune infiltration of various cell types and immune responses. RT-qPCR analysis confirmed the abnormally low expression of CBL in PBMCs of GD patients, consistent with microarray sequencing results, and revealed a negative correlation with the level of TRAb—a crucial diagnostic indicator for GD involving the aberrant activation of pro-inflammatory lymphocytes, including T cells. These findings support the results of our comprehensive bioinformatics analysis, suggesting a potential role for the Tex-related gene CBL in the abnormal immune regulation of GD. When GD cases were categorized into primary and relapse groups, significantly lower CBL mRNA expression was observed in the relapse group. In patients with newly diagnosed GD, clinical phenotypes can be separated according to the presence of moderate-to-severe thyroid enlargement and the absence of such enlargement. We found that CBL mRNA expression was significantly downregulated in the former group. CBL encodes an E3 ubiquitin-protein ligase, acting as a negative regulator in various signaling pathways (29). Previous studies have reported a pro-Tex role for CBL in diseases such as esophageal cancer, in which CBL interacts with SPRY1 to promote Tex, contributing a pro-cancer effect. Additionally, studies on CBLB, a closely related homolog of CBL, have demonstrated its promotion of Tex (30). Therefore, we hypothesize that the low expression of CBL in GD patients may promote GD relapse and thyroid enlargement by inhibiting Tex. However, mechanistic studies are required to further validate this hypothesis.
Our study has some limitations. Our findings were primarily derived from comprehensive bioinformatics analyses, and initial validation through RT-qPCR was conducted for only one Tex-related gene. Additionally, the small sample size necessitates additional functional experimental validation and expansion of the clinical sample size. These steps are crucial for a comprehensive assessment of the exact role of Tex-related genes in the pathogenesis and prognosis of GD. Recent advancements in technologies such as single-cell sequencing, multiparameter flow cytometry, and high-dimensional mass cytometry offer opportunities to explore T-cell heterogeneity, various phenotypes, functions, and transcriptional programs. Our group plans to conduct in-depth studies in these areas for a more nuanced understanding of the role of Tex in GD.
In summary, Tex may be integral to the pathogenesis and prognostic mechanisms of GD. Our study provides initial insights, indicating that the Tex-related gene CBL is associated with immunomodulatory functions and holds promise as a prognostic biomarker for disease relapse. However, this finding requires further validation in more comprehensive studies.
The original contributions presented in the study are included in the article/Supplementary Materials. Further inquiries can be directed to the corresponding author.
The studies involving humans were approved by the Medical Ethics Committee of the Second Affiliated Hospital of Fujian Medical University (Ethics No. 2023-488). The studies were conducted in accordance with the local legislation and institutional requirements. The participants provided their written informed consent to participate in this study.
ZJ: Writing – original draft, Writing – review & editing. HH: Writing – original draft, Writing – review & editing. HC: Writing – review & editing. YL: Data curation, Formal analysis, Writing – review & editing. RL: Validation, Writing – review & editing. LC: Validation, Writing – review & editing.
The author(s) declare financial support was received for the research, authorship, and/or publication of this article. This study was supported by the Startup Fund for scientific research, Fujian Medical University (Grant number: 2021QH1117), the Quanzhou Guiding Science and Technology Programme projects in the field of medical and health care (Grant number: 2021N019S) and the Fujian Natural Science Foundation Project (Grant number: 2021J01252).
We also thank all of the participants.
The authors declare that the research was conducted in the absence of any commercial or financial relationships that could be construed as a potential conflict of interest.
All claims expressed in this article are solely those of the authors and do not necessarily represent those of their affiliated organizations, or those of the publisher, the editors and the reviewers. Any product that may be evaluated in this article, or claim that may be made by its manufacturer, is not guaranteed or endorsed by the publisher.
The Supplementary Material for this article can be found online at: https://www.frontiersin.org/articles/10.3389/fendo.2024.1364782/full#supplementary-material
1. Smith TJ, Hegedüs L. Graves' Disease. N Engl J Med. (2016) 375:1552–65. doi: 10.1056/NEJMra1510030
2. Antonelli A, Fallahi P, Elia G, Ragusa F, Paparo SR, Ruffilli I, et al. Graves' disease: Clinical manifestations, immune pathogenesis (cytokines and chemokines) and therapy. Best Pract Res Clin Endocrinol Metab. (2020) 34:101388. doi: 10.1016/j.beem.2020.101388
3. Hansen M, Cheever A, Weber KS, O'Neill KL. Characterizing the interplay of lymphocytes in graves' Disease. Int J Mol Sci. (2023) 24. doi: 10.3390/ijms24076835
4. Chopp L, Redmond C, O'Shea JJ, Schwartz DM. From thymus to tissues and tumors: A review of T-cell biology. J Allergy Clin Immunol. (2023) 151:81–97. doi: 10.1016/j.jaci.2022.10.011
5. Álvarez-Sierra D, Marín-Sánchez A, Gómez-Brey A, Bello I, Caubet E, Moreno-Llorente P, et al. Lymphocytic thyroiditis transcriptomic profiles support the role of checkpoint pathways and B cells in pathogenesis. Thyroid. (2022) 32:682–93. doi: 10.1089/thy.2021.0694
6. Wherry EJ, Kurachi M. Molecular and cellular insights into T cell exhaustion. Nat Rev Immunol. (2015) 15:486–99. doi: 10.1038/nri3862
7. Osum KC, Burrack AL, Martinov T, Sahli NL, Mitchell JS, Tucker CG, et al. Interferon-gamma drives programmed death-ligand 1 expression on islet β cells to limit T cell function during autoimmune diabetes. Sci Rep. (2018) 8:8295. doi: 10.1038/s41598-018-26471-9
8. Collier JL, Weiss SA, Pauken KE, Sen DR, Sharpe AH. Not-so-opposite ends of the spectrum: CD8(+) T cell dysfunction across chronic infection, cancer and autoimmunity. Nat Immunol. (2021) 22:809–19. doi: 10.1038/s41590-021-00949-7
9. Limbach M, Saare M, Tserel L, Kisand K, Eglit T, Sauer S, et al. Epigenetic profiling in CD4+ and CD8+ T cells from Graves' disease patients reveals changes in genes associated with T cell receptor signaling. J Autoimmun. (2016) 67:46–56. doi: 10.1016/j.jaut.2015.09.006
10. Zhang Y, Wei J, Zhou H, Li B, Chen Y, Qian F, et al. Identification of two potential immune-related biomarkers of Graves' disease based on integrated bioinformatics analyses. Endocrine. (2022) 78:306–14. doi: 10.1007/s12020-022-03156-y
11. Zhang Z, Chen L, Chen H, Zhao J, Li K, Sun J, et al. Pan-cancer landscape of T-cell exhaustion heterogeneity within the tumor microenvironment revealed a progressive roadmap of hierarchical dysfunction associated with prognosis and therapeutic efficacy. EBioMedicine. (2022) 83:104207. doi: 10.1016/j.ebiom.2022.104207
12. Zhang X, Zhang S, Yan X, Shan Y, Liu L, Zhou J, et al. m6A regulator-mediated RNA methylation modification patterns are involved in immune microenvironment regulation of periodontitis. J Cell Mol Med. (2021) 25:3634–45. doi: 10.1111/jcmm.16469
13. Ross DS, Burch HB, Cooper DS, Greenlee MC, Laurberg P, Maia AL, et al. 2016 american thyroid association guidelines for diagnosis and management of hyperthyroidism and other causes of thyrotoxicosis. Thyroid. (2016) 26:1343–421. doi: 10.1089/thy.2016.0229
14. Cho YY, Chung YJ. Vitamin D supplementation does not prevent the recurrence of Graves' disease. Sci Rep. (2020) 10:16. doi: 10.1038/s41598-019-55107-9
15. Belk JA, Daniel B, Satpathy AT. Epigenetic regulation of T cell exhaustion. Nat Immunol. (2022) 23:848–60. doi: 10.1038/s41590-022-01224-z
16. Ogura H, Preston-Hurlburt P, Perdigoto AL, Amodio M, Krishnaswamy S, Clark P, et al. Identification and analysis of islet antigen-specific CD8(+) T cells with T cell libraries. J Immunol. (2018) 201:1662–70. doi: 10.4049/jimmunol.1800267
17. Laban S, Suwandi JS, Unen van V, Pool J, Wesselius J, Höllt T, et al. Heterogeneity of circulating CD8 T-cells specific to islet, neo-antigen and virus in patients with type 1 diabetes mellitus. PloS One. (2018) 13:e0200818. doi: 10.1371/journal.pone.0200818
18. Linsley PS, Long SA. Enforcing the checkpoints: harnessing T-cell exhaustion for therapy of T1D. Curr Opin Endocrinol Diabetes Obes. (2019) 26:213–8. doi: 10.1097/MED.0000000000000488
19. Frenz T, Grabski E, Buschjäger D, Vaas LA, Burgdorf N, Schmidt RE, et al. CD4(+) T cells in patients with chronic inflammatory rheumatic disorders show distinct levels of exhaustion. J Allergy Clin Immunol. (2016) 138:586–589.e10. doi: 10.1016/j.jaci.2016.04.013
20. McKinney EF, Lee JC, Jayne DR, Lyons PA, Smith KG. T-cell exhaustion, co-stimulation and clinical outcome in autoimmunity and infection. Nature. (2015) 523:612–6. doi: 10.1038/nature14468
21. Guo C, Liu Q, Zong D, Zhang W, Zuo Z, Yu Q, et al. Single-cell transcriptome profiling and chromatin accessibility reveal an exhausted regulatory CD4+ T cell subset in systemic lupus erythematosus. Cell Rep. (2022) 41:111606. doi: 10.1016/j.celrep.2022.111606
22. Globig AM, Mayer LS, Heeg M, Andrieux G, Ku M, Otto-Mora P, et al. Exhaustion of CD39-expressing CD8(+) T cells in crohn's disease is linked to clinical outcome. Gastroenterology. (2022) 163:965–981.e31. doi: 10.1053/j.gastro.2022.06.045
23. Purnamasari D, Soewondo P, Djauzi S. Dendritic cells in Graves' disease. Acta Med Indones. (2015) 47:61–9.
24. Nakaya M, Xiao Y, Zhou X, Chang JH, Chang M, Cheng X, et al. Inflammatory T cell responses rely on amino acid transporter ASCT2 facilitation of glutamine uptake and mTORC1 kinase activation. Immunity. (2014) 40:692–705. doi: 10.1016/j.immuni.2014.04.007
25. Legué C, Legros L, Kammerer-Jacquet S, Jézequel C, Houssel-Debry P, Uguen T, et al. Safety and efficacy of 6-thioguanine as a second-line treatment for autoimmune hepatitis. Clin Gastroenterol Hepatol. (2018) 16:290–1. doi: 10.1016/j.cgh.2017.07.032
26. Fahmy Wahba MG, Shehata Messiha BA, Abo-Saif AA. Ramipril and haloperidol as promising approaches in managing rheumatoid arthritis in rats. Eur J Pharmacol. (2015) 765:307–15. doi: 10.1016/j.ejphar.2015.08.026
27. Qi W, Lin C, Fan K, Chen Z, Liu L, Feng X, et al. Hesperidin inhibits synovial cell inflammation and macrophage polarization through suppression of the PI3K/AKT pathway in complete Freund's adjuvant-induced arthritis in mice. Chem Biol Interact. (2019) 306:19–28. doi: 10.1016/j.cbi.2019.04.002
28. Mei F, Guo S, He Y, Wang L, Wang H, Niu J, et al. Quetiapine, an atypical antipsychotic, is protective against autoimmune-mediated demyelination by inhibiting effector T cell proliferation. PloS One. (2012) 7:e42746. doi: 10.1371/journal.pone.0042746
29. Lock P, S.T. I, Straffon AF, Schieb H, Hovens CM, Stylli SS. Spred-2 steady-state levels are regulated by phosphorylation and Cbl-mediated ubiquitination. Biochem Biophys Res Commun. (2006) 351:1018–23. doi: 10.1016/j.bbrc.2006.10.150
Keywords: Graves’ disease, T-cell exhaustion, weighted gene co-expression network analysis, CBL, enlargement of thyroid gland
Citation: Jiang Z, Cai H, Lin Y, Lin R, Chen L and Huang H (2024) T-cell exhaustion-related genes in Graves’ disease: a comprehensive genome mapping analysis. Front. Endocrinol. 15:1364782. doi: 10.3389/fendo.2024.1364782
Received: 03 January 2024; Accepted: 25 July 2024;
Published: 22 August 2024.
Edited by:
Pia Pace-Asciak, University of Toronto, CanadaReviewed by:
Subhash Kumar Tripathi, Seattle Children’s Research Institute, United StatesCopyright © 2024 Jiang, Cai, Lin, Lin, Chen and Huang. This is an open-access article distributed under the terms of the Creative Commons Attribution License (CC BY). The use, distribution or reproduction in other forums is permitted, provided the original author(s) and the copyright owner(s) are credited and that the original publication in this journal is cited, in accordance with accepted academic practice. No use, distribution or reproduction is permitted which does not comply with these terms.
*Correspondence: Huibin Huang, aHVpYmluaHVhbmdAYWxpeXVuLmNvbQ==
†These authors have contributed equally to this work
‡ORCID: Huibin Huang, orcid.org/0000-0001-6487-7029
Disclaimer: All claims expressed in this article are solely those of the authors and do not necessarily represent those of their affiliated organizations, or those of the publisher, the editors and the reviewers. Any product that may be evaluated in this article or claim that may be made by its manufacturer is not guaranteed or endorsed by the publisher.
Research integrity at Frontiers
Learn more about the work of our research integrity team to safeguard the quality of each article we publish.