 Run Wang
 Xiaobing Cheng
94% of researchers rate our articles as excellent or good
Learn more about the work of our research integrity team to safeguard the quality of each article we publish.
Find out more
ORIGINAL RESEARCH article
Front. Endocrinol. , 16 July 2024
Sec. Cardiovascular Endocrinology
Volume 15 - 2024 | https://doi.org/10.3389/fendo.2024.1362667
Background: The association between insulin resistance and cardiovascular diseases (CVD) is of significant interest. However, there is limited published research on the relationship between CVD and the triglyceride glucose-body mass index (TyG-BMI). This study aims to examine the association between TyG-BMI and CVD in US adults.
Method: We analyzed data from 11016 adults collected through the 2011-2020 NHANES. Employing weighted generalized linear models, subgroup analysis, sensitivity analysis, and receiver operating characteristic curves, we examined the association between the TyG-BMI index and CVD. Nonlinear associations were investigated using restricted cubic splines.
Results: Higher TyG-BMI values were significantly associated with an increased prevalence of CVD (P<0.001). Weighted generalized linear models consistently demonstrated a positive association across all models. Specifically, individuals in the highest tertile of TyG-BMI had a 38% higher CVD prevalence than those in the lowest quartile (OR=1.380; 95% CI=1.080, 1.763). Unweighted logistic regression models further confirmed these findings. Sex, race, education, family income to poverty ratio, smoking, hypertension, and diabetes did not modify this positive association (P for interaction >0.05). Incorporating the TyG-BMI index into traditional risk factor models marginally improved the prediction of CVD prevalence (P for comparison <0.05).
Conclusions: The TyG-BMI index, an indicator of insulin resistance, is significantly positive associated with a higher prevalence of CVD. These findings underscore the importance of managing insulin resistance to prevent CVD and highlight the need for further research into the underlying mechanisms of this association.
Globally, cardiovascular disease (CVD) stands as a primary contributor to adult morbidity and mortality (1). In 2020, approximately 928,741 Americans succumbed to CVD, marking the highest annual death toll in recent years (2). In the US, the financial cost of CVD is enormous, totaling hundreds of billions of dollars annually (2).
Insulin resistance is a pathological condition characterized by reduced sensitivity and responsiveness to insulin’s actions, primarily affecting the metabolism of sugar, fat, and energy (IR) (3–5). The triglyceride glucose body mass index (TyG-BMI) and the hyperinsulinemic-euglycemic clamp technique have comparable specificity and sensitivity, according to recent research (6, 7), providing a simpler and more cost-effective means of assessing IR (8). The TyG-BMI index and diabetes and hypertension have a high relationship in several studies (9–11), especially noteworthy, a substantial relationship with the risk of heart failure in those with diabetes or pre-diabetes (12). Moreover, cohort studies including patients receiving peritoneal dialysis have demonstrated a separate association between elevated rates of CVD morbidity and all-cause death and the TyG-BMI index (13). Despite these results, the connection between CVD in general individuals and the TyG-BMI index is unknown.
Therefore, our study aimed to investigate the association between TyG-BMI and CVD in US adults using data from the 2011 to 2020 NHANES database. The potential of the TyG-BMI index as a novel biomarker for predicting cardiovascular disease in the general population warrants in-depth assessment. This could provide more precise information for the early prevention of cardiovascular disease.
An important program of the National Center for Health Statistics (NCHS) is the National Health and Nutrition Examination Survey (NHANES), used to assess the nutritional and general health of adult and pediatric populations in the US.
Due to the complex probability stratified sampling design of the NHANES database, we adhered to the NHANES guidelines for complex sampling weight calculations, to ensure robust and representative statistical analysis. NHANES survey data, detailed experimental methods, and consent forms are available at www.cdc.gov/nchs/nhanes/
In the study, we analyzed data from 45,462 participants from the NHANES database covering 2011 to 2020. We excluded 19,182 participants younger than 20 years old. We excluded 58 participants with missing education levels and smoking status. Furthermore, the analysis excluded 15211 participants due to incomplete questionnaire data and incomplete TyG-BMI data, which was essential for diagnosing cardiovascular diseases and calculating TyG-BMI. Eventually, we employed 11,016 participants in the analysis.
Figure 1 shows a flow diagram for the research individuals and details the methodical process of participant selection.
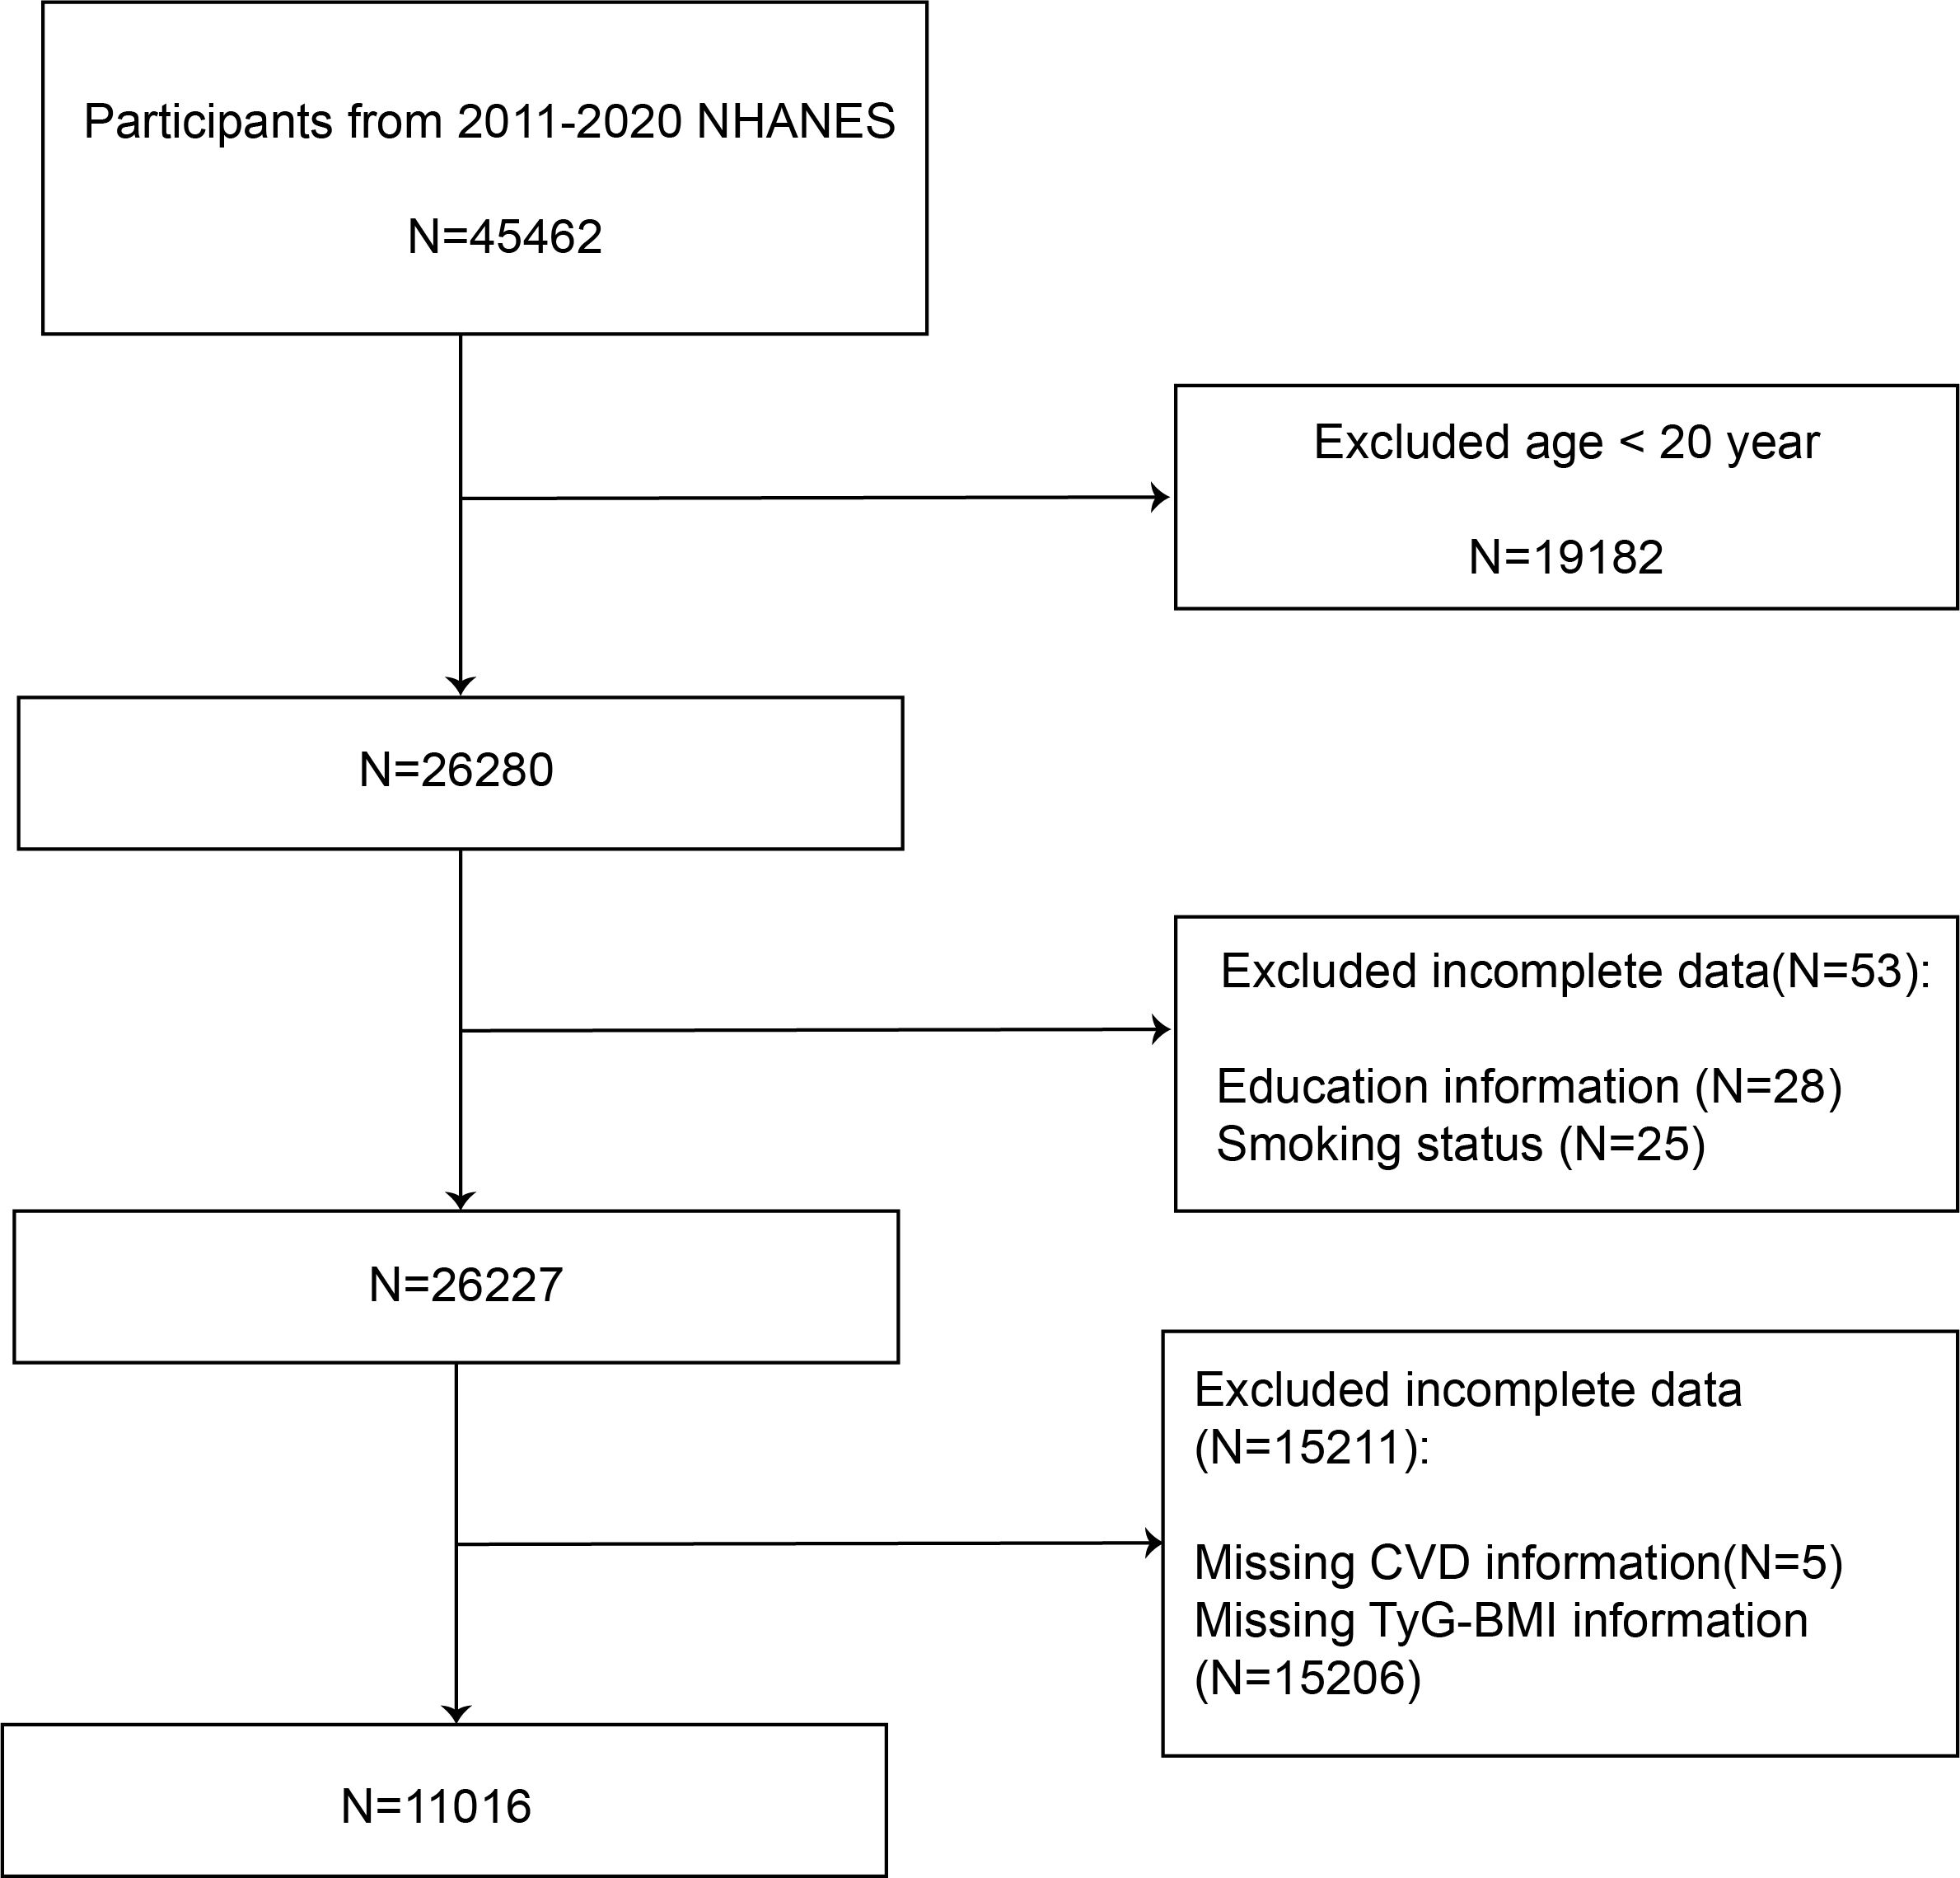
Figure 1 The process flow diagram for the systematic selection method.
The definition of CVD in this study was derived from survey questionnaire replies. Any of the following conditions reported by a participant were used to classify them as CVD: angina, myocardial infarction (MI), stroke, congestive heart failure (CHF), or coronary heart disease (CHD). Any response that was positive to these questions was thought to be indicative of CVD.
The purpose of TyG-BMI in our study was to be an exposure variable (14, 15).
A wide range of factors were investigated in this study, such as age, gender, educational achievement, racial background patterns of alcohol and cigarette consumption, and estimated glomerular filtration rate (eGFR). Clinical conditions including hypertension, diabetes mellitus, and hyperlipidemia were also taken into account. Based on educational background, three groups were established: less than high school, high school or its equivalent, and college education or above. Three groups were established based on the family income-to-poverty ratio (PIR): low (PIR<1.3), middle (≥1.3 and <3.5), and high-income (PIR≥3.5) (16). eGFR was computed using the creatinine equation for CKD-EPI (17). Alcohol consumption was defined as excessive at four or more drinks per day for men and three or more for women, moderate at two drinks per day for women and three for men, with any additional intake considered minimal (18). Smoking status was determined by a history of consuming over a hundred cigarettes in a year (19). Hyperlipidemia was defined using specific thresholds: total cholesterol ≥ 200 mg/dL, triglycerides ≥ 150 mg/dL, high-density lipoprotein ≤ 40 mg/dL in men and ≤ 50 mg/dL in women, or low-density lipoprotein ≥ 130 mg/dL (20, 21). Hypertension is defined as the average of the previous three blood pressures with a systolic blood pressure ≥ 140 mmHg, and or diastolic blood pressure ≥ 90 mmHg or a use of antihypertensive drugs or a history of documented hypertension. A fasting plasma glucose level of 126 mg/dL or above, glycated hemoglobin (HbA1c) readings of 6.5% or above, or the use of insulin or hypoglycemic drugs were the criteria used to diagnose diabetes. For the study, every measurable clinical parameter and laboratory result was painstakingly gathered.
To ensure national representation, particular sample weights (WTMEC2YR and WTMECPRP), strata (SDMVSTRA), and clusters (SDMVPSU) were applied. We multiply interpolated a portion of the missing data. Continuous variables were reported as means with 95% confidence intervals (CIs), while categorical variables were described as proportions with 95% CIs. Participants were divided into tertiles based on their TyG-BMI for the baseline characteristics analysis. The association between CVD and TyG-BMI was examined using weighted generalized linear models. The first model (Model 1) included no adjustments. The second model (Model 2) adjusted for demographic factors including sex, age, and race. The third model (Model 3) further adjusted for socioeconomic and lifestyle factors such as education, PIR, smoking status, alcohol use, hypertension, hyperlipidemia, and diabetes. Nonlinear associations were explored using restricted cubic spline curves. Weighted subgroup analyses were conducted to evaluate the robustness of the association between TyG-BMI and CVD. Validation of our findings was performed using unweighted logistic regression analysis. To determine if the TyG-BMI index increases the prediction ability of models that include conventional risks, we finally constructed receiver operating characteristic (ROC) curves were finally constructed. The DeLong test was used to compare the area under the curve (AUC) between the models. R version 3.4.3 and Empower software were used for all statistical analyses. A two-sided P<0.05 was used to establish statistical significance.
This study encompassed 11016 participants, characterized by an average age of 49.97 ± 17.45 years, with a slight majority of females (51.55%) over males (48.45%). The median TyG-BMI is 242.03, with a cardiovascular disease prevalence of 11.40%.
As detailed in Table 1, participants were categorized into tertiles based on TyG-BMI values. A significant trend emerged, with the weighted prevalence of CVD increasing across TyG-BMI tertiles (P<0.001). Furthermore, statistically significant variations were observed among the three tertiles in terms of gender, age, race, education level, PIR, alcohol consumption level, eGFR, hyperlipidemia, hypertension, and diabetes mellitus (P<0.001).
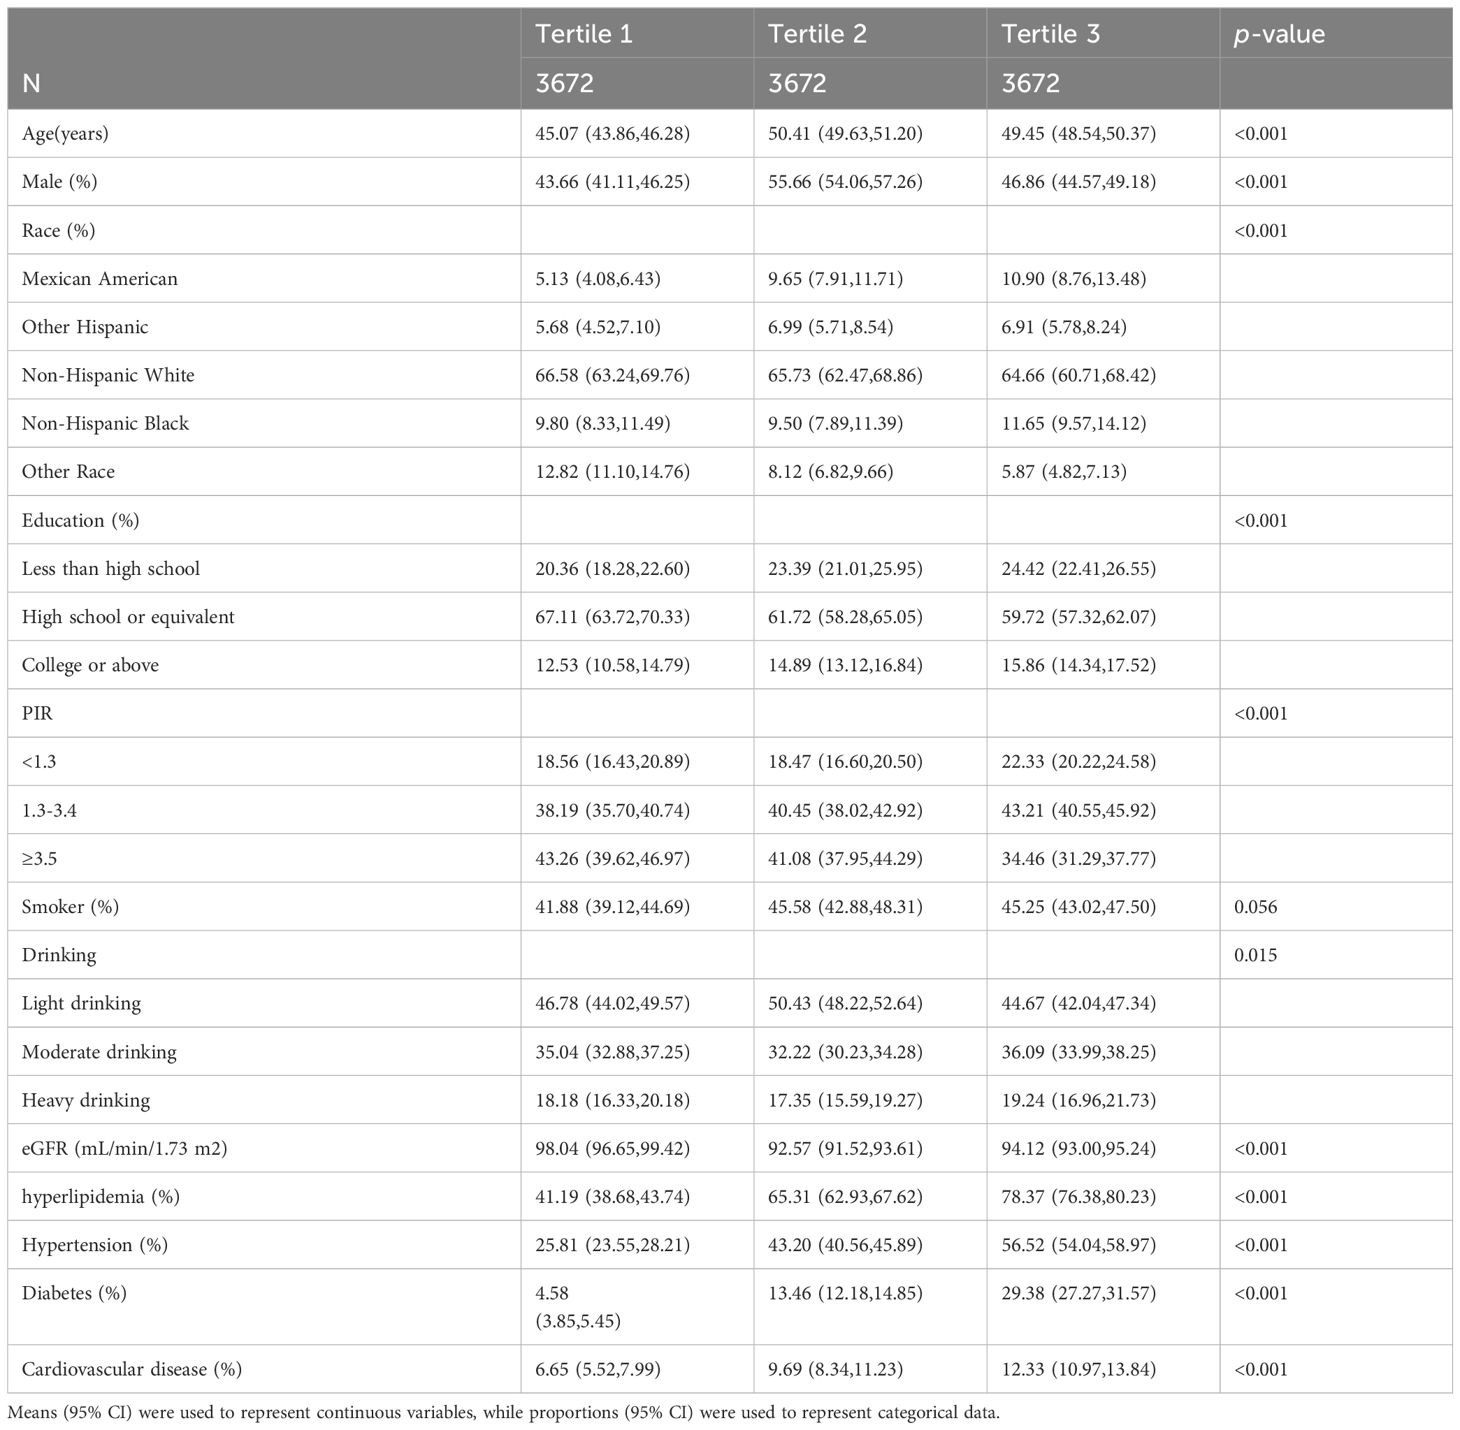
Table 1 Initial characteristics of individuals according to TyG-BMI tertiles.
Because of the high percentage of missing values, Supplementary Table S1 compares baseline demographic and health indicators for the excluded and included groups. There was no significant difference in the prevalence of cardiovascular disease between these two groups(P>0.05).
Table 2 demonstrates a significant positive association between TyG-BMI and CVD. This association remains robust when TyG-BMI is analyzed as a continuous or category variable, showing statistically significant association in unadjusted, partially adjusted, and fully adjusted models (P<0.001). Specifically, in the models, the third tertile of TyG-BMI consistently displayed a higher CVD prevalence than the first tertile. Notably, in the fully adjusted Model 3, the prevalence of CVD in the third tertile was 38% higher than in the first tertile [1.380(1.080,1.763), P=0.013]. The test for trend is also statistically significant in all models(P<0.05).
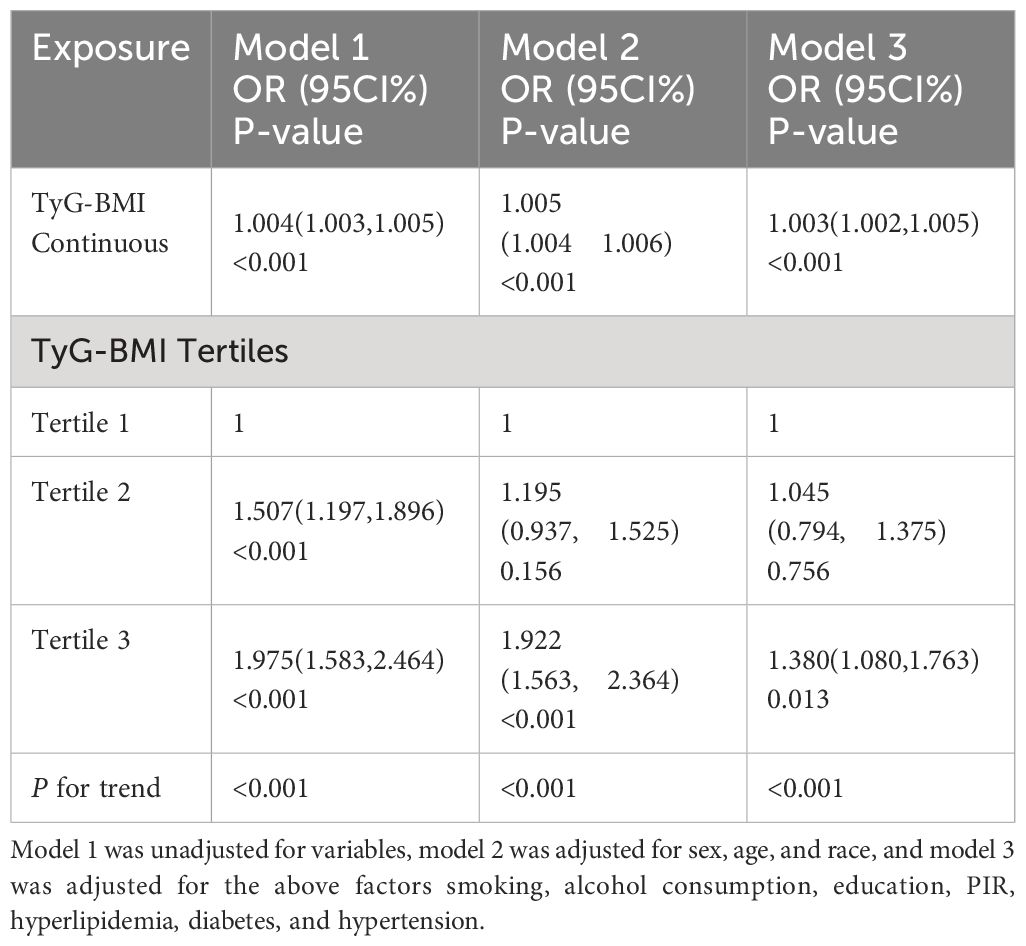
Table 2 The association between weighted TyG-BMI and cardiovascular disease.
Additionally, Figure 2 illustrates the nonlinear association between TyG-BMI and the prevalence of cardiovascular disease.
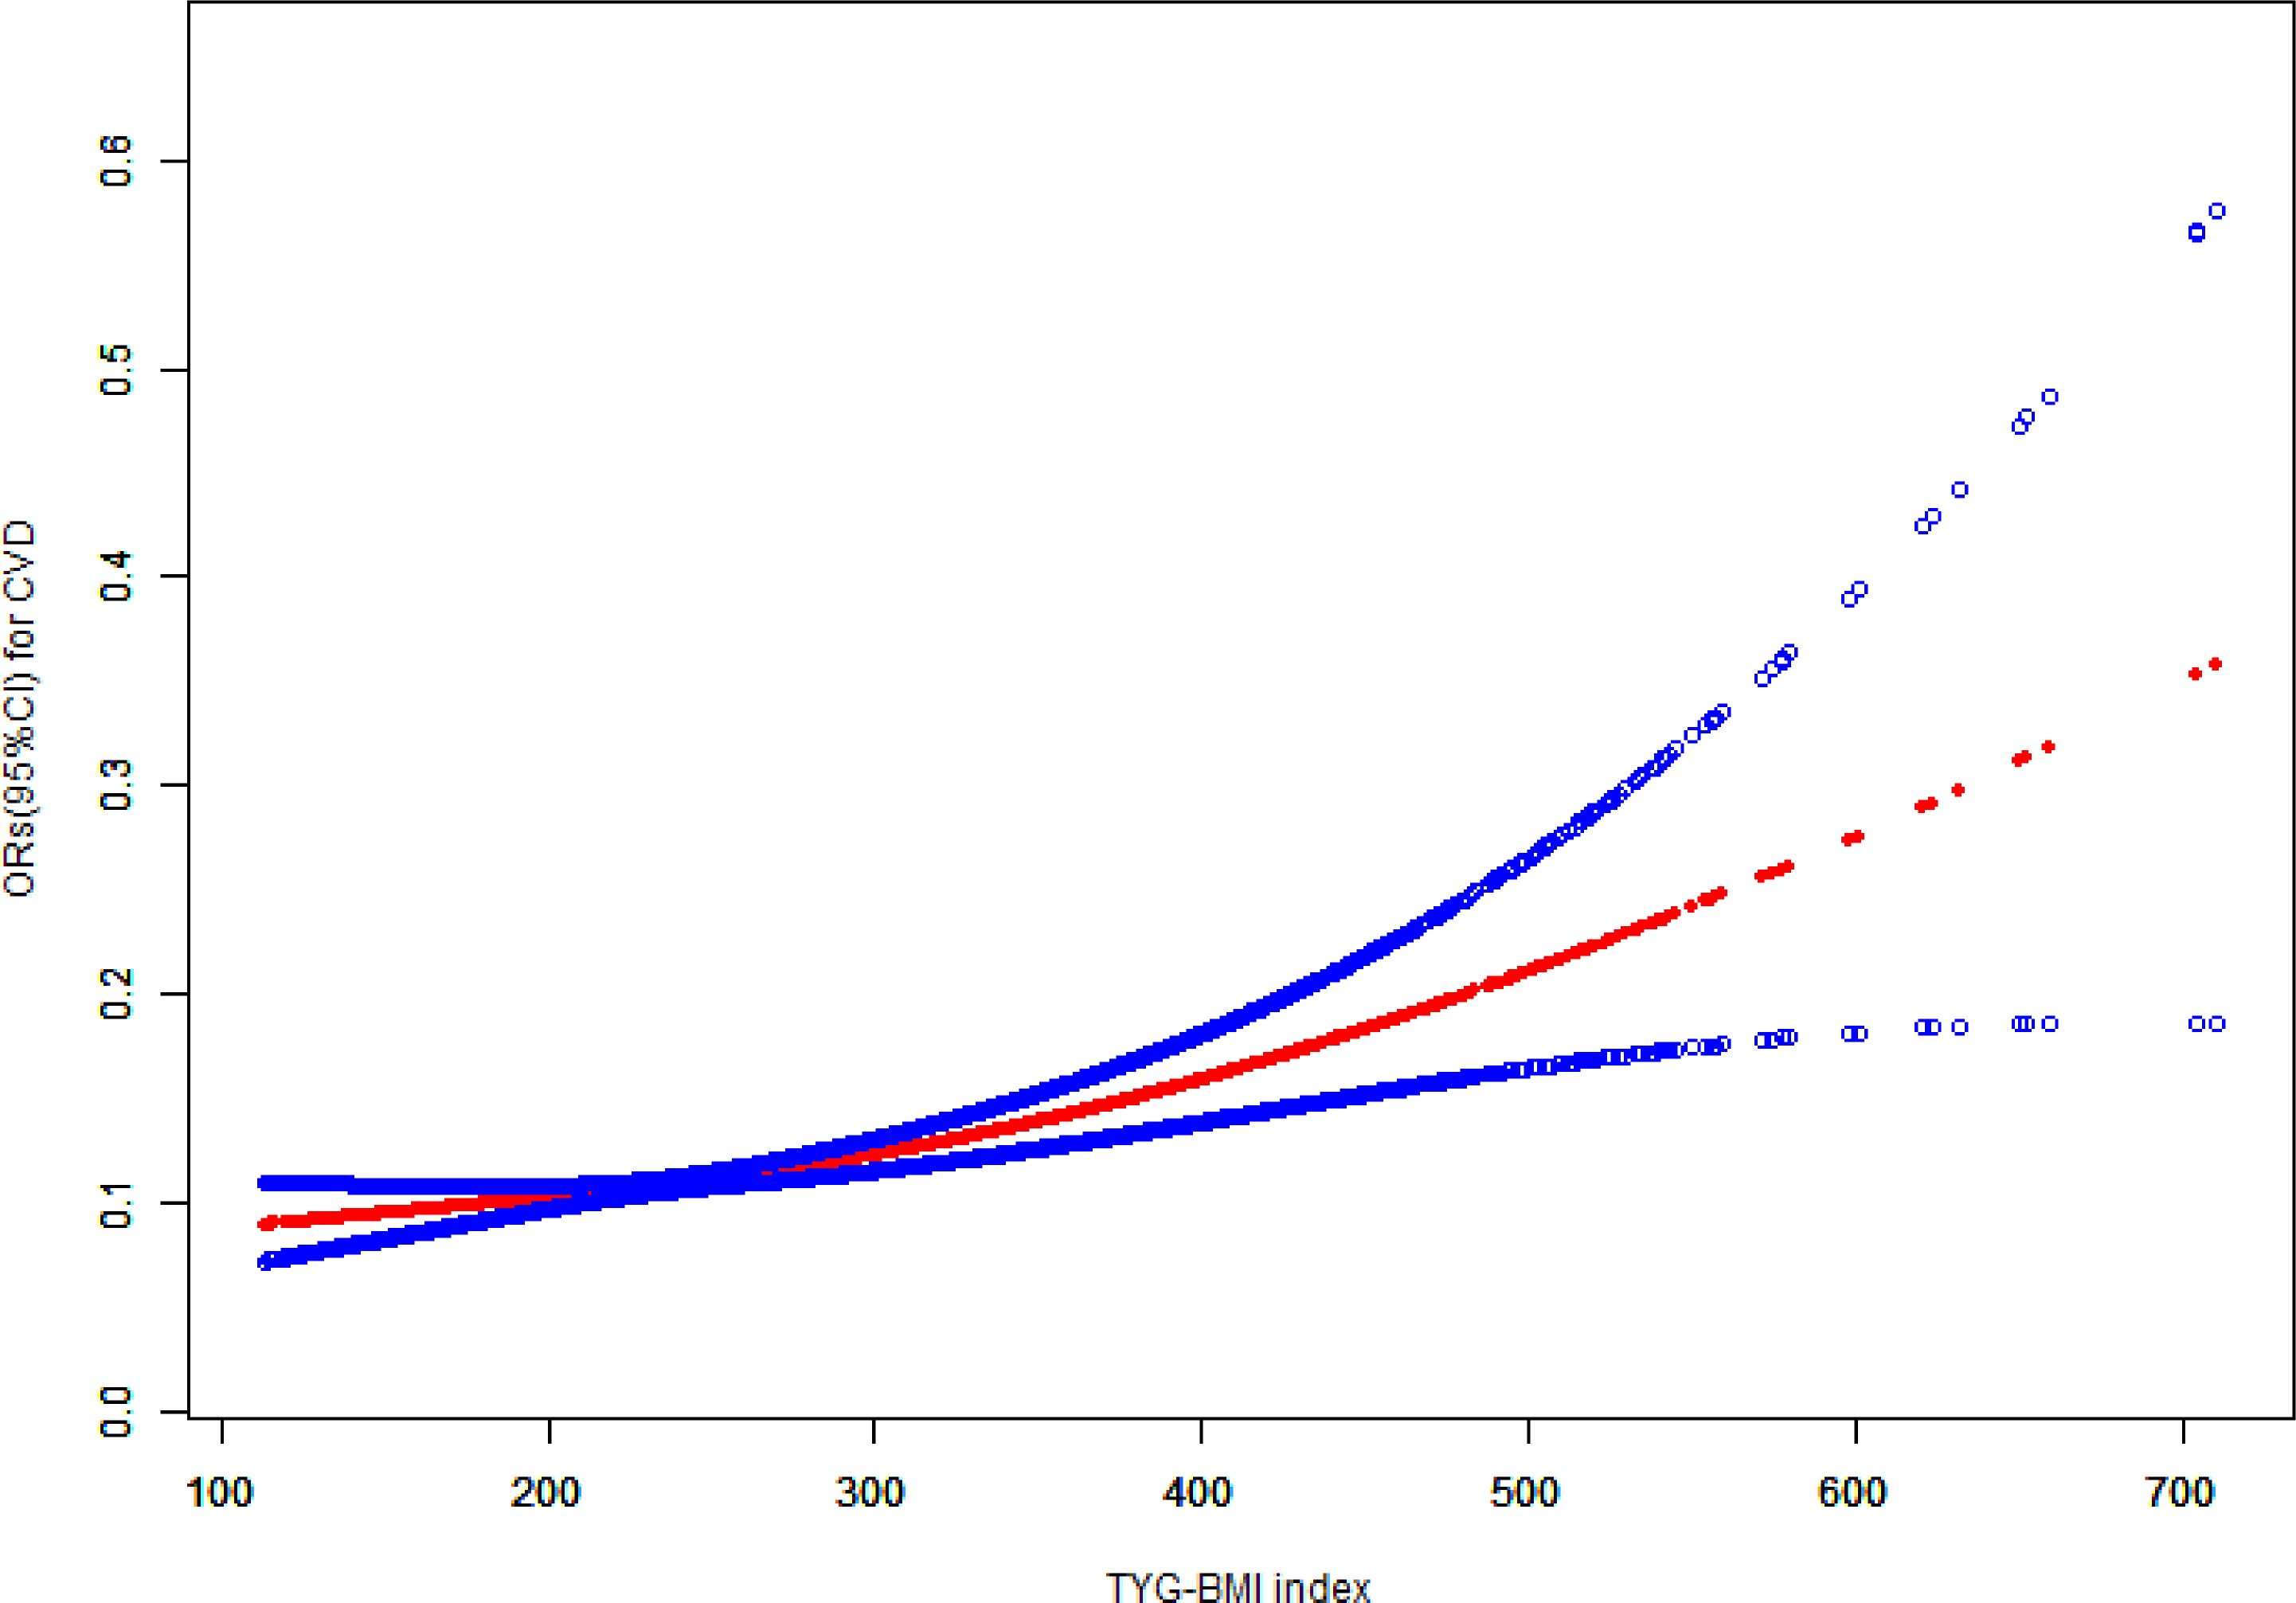
Figure 2 The association between TyG-BMI and cardiovascular disease. TyG-BMI, triglyceride glucose-body mass index; CVD, cardiovascular disease; CI, confidence interval; OR, odds ratio.
Subgroup analyses, based on factors such as age, gender, race, education, PIR, smoking, hyperlipidemia, hypertension, and diabetes were conducted to assess the potential association between the TyG-BMI and CVD. Interaction analysis showed that the positive association between TyG-BMI and cardiovascular disease was not affected by gender, race, education, PIR, smoking, hypertension, and diabetes factors (P>0.05). However, statistically significant differences were found between age, and hyperlipidemia subgroups (P<0.05) (Table 3).
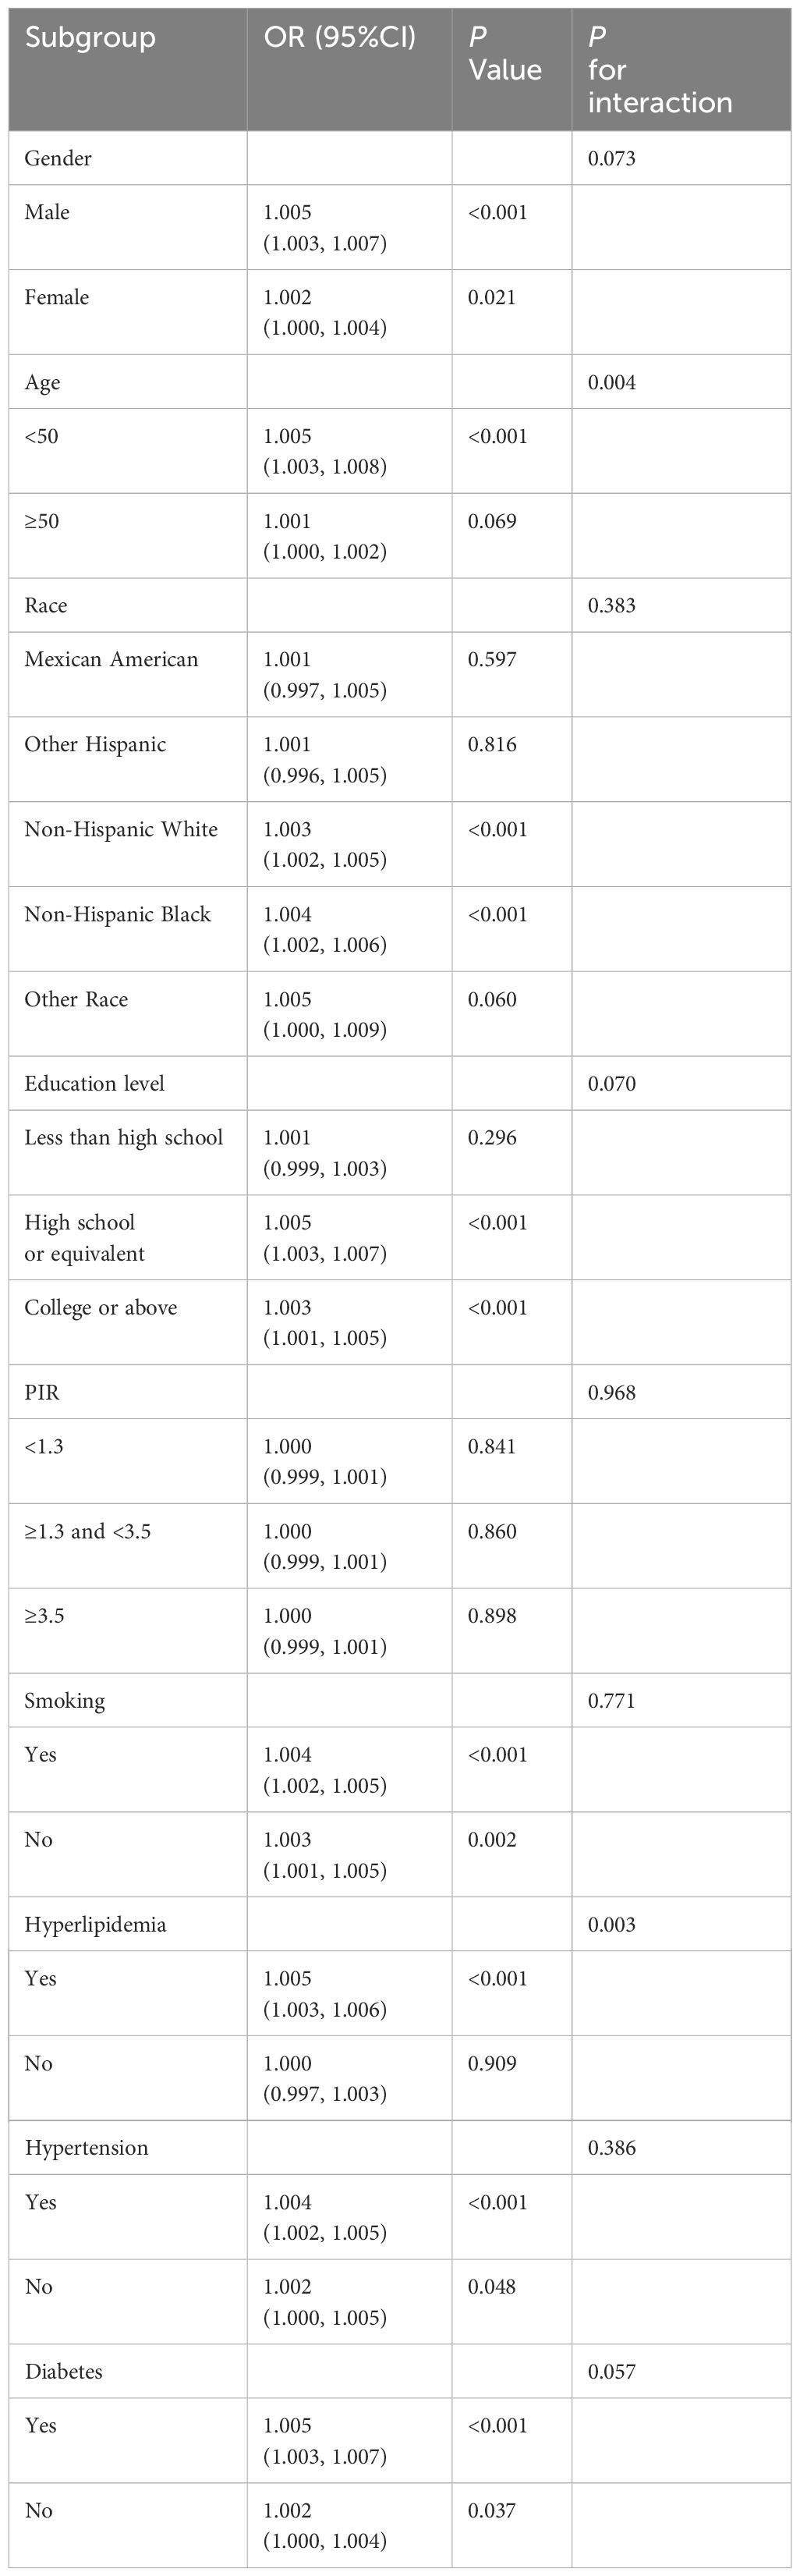
Table 3 Subgroup analysis of the association between weighted TyG-BMI and cardiovascular disease.
In Table 4, we performed sensitivity analyses using unweighted logistic analyses, TyG-BMI was positively associated with the prevalence of cardiovascular disease in all models, both as a continuous and categorical variable(P<0.05). These findings are consistent with those reported in Table 2.

Table 4 The association between TyG-BMI and cardiovascular disease in a sensitivity analysis using unweighted logistic regression analysis.
We evaluated baseline risk model ROC curves for all participants, including traditional CVD risk factors (age, gender, smoking, hyperlipidemia, diabetes, and hypertension) as well as the TyG-BMI index. The baseline risk model showed an AUC of 0.824, while the model including the TyG-BMI index showed an AUC of 0.826. This difference was statistically significant (p = 0.047) (Figure 3).
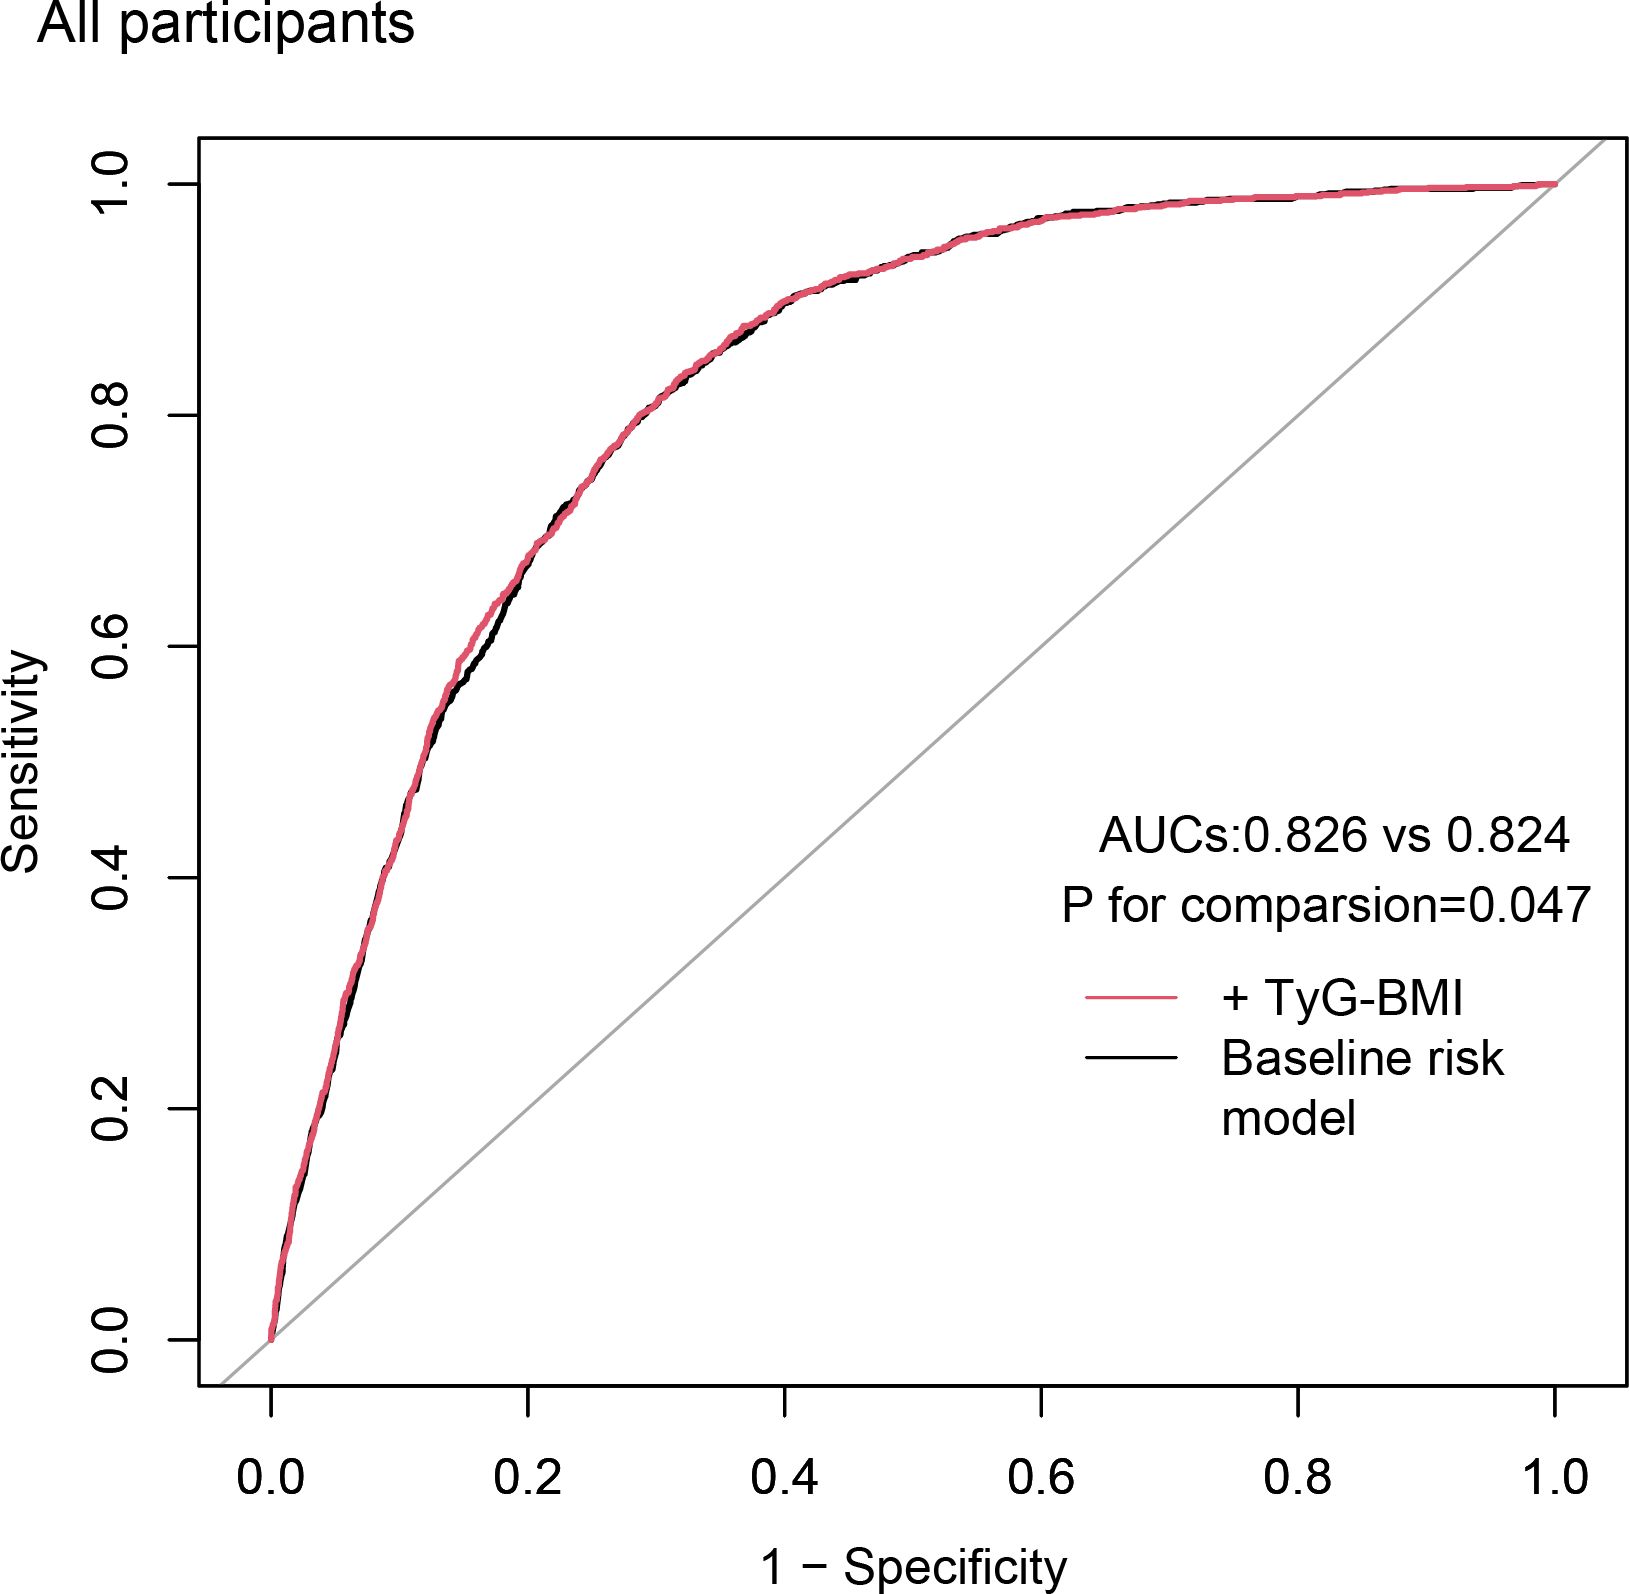
Figure 3 Incremental effect of the TyG-BMI for predicting CVD. The baseline risk model includes age, gender, smoking, hyperlipidemia, diabetes, and hypertension; TyG-BMI, triglyceride glucose-body mass index; CVD, cardiovascular disease; AUC, area under curve.
To the best of our knowledge, this study is the first to explore the relationship between the prevalence of cardiovascular disease and the novel biomarker TyG-BMI. Using data from 11,016 participants in the NHANES database from 2011 to 2020, we found that TyG-BMI levels were significantly associated with an increased prevalence of cardiovascular disease, both as a continuous and categorical variable (P<0.05). This association persisted even after adjusting for basic demographic characteristics, lifestyle factors, and prior medical history. Furthermore, the robustness of our findings was confirmed through sensitivity analyses, which yielded results consistent with the weighted analyses (P<0.05).The TyG-BMI value has been validated by earlier studies as a trustworthy proxy indicator for IR (22–24). Given the public health implications of IR and CVD (25), recent investigations have linked IR to inflammation, oxidative stress, altered microRNA expression, disruptions in insulin metabolism signaling pathways, and mitochondrial dysfunction. These factors contribute to various cardiovascular risks, including lipid disorders, coronary artery disease, hypertension, vascular calcification, heart failure, and cardiomyopathy (26–29). The study by Yamazoe independently links the prevalence of coronary artery calcification and IR (29). In contrast, a sizable prospective cohort research which followed up for 5.5 years, shows that in 17.9% of participants with diabetes, it is linked to an increase peripheral in artery disease and heart failure (30). Moreover, a well-established link exists between IR and atherosclerosis (31), a key CVD risk factor, with the TyG-BMI index as an effective CVD predictor. A study by Yi Hu indicates an L-shaped association between TyG-BMI and all-cause mortality in patients with atrial fibrillation admitted to the ICU (15). According to surveys, individuals with heart failure can also utilize the TyG-BMI index to predict their one-year all-cause mortality (32). Additionally, a higher TyG-BMI index has been linked to prehypertension in Chinese adults (33). In our research, according to the fully adjusted model of our analysis, compared to individuals in the lowest tertile, those in the greatest TyG-BMI tertile exhibited a substantially greater likelihood of cardiovascular disease (OR=1.380; 95%CI=1.080,1.763). The adverse effects of IR on cardiovascular health are highlighted by this research. Moreover, interaction studies indicate that the positive association between the TyG-BMI value and CVD was not substantially affected by gender, race, education level, PIR, smoking, hypertension, hyperlipidemia, and diabetes (all P for interaction > 0.05). The ROC curves showed that the model with the addition of TyG-BMI had an incremental effect on predicting the prevalence of cardiovascular disease. However, A retrospective study indicated that a high TyG-BMI was positively associated with the incidence of major adverse cardiac and cerebrovascular events (MACCEs). it did not enhance the predictive power for MACCEs in elderly patients and female patients (34). The discrepancy between the results of the two studies may arise from differences in the populations and outcome variables. Our study focused on the general U.S. adult participants, and CVD defined using data from the NHANES database questionnaire. In contrast, the retrospective study examined patients in Henan Province, China, who underwent Percutaneous coronary intervention (PCI) and were treated with drug-eluting stent (DES), with the outcome defined as a composite of MACCEs at follow-up.
However, in our subgroup analysis of this study, age, and hyperlipidemia significantly influence the association between TyG-BMI and the prevalence of cardiovascular disease (P for interaction <0.05). In younger individuals, the TyG-BMI may better reflect cardiovascular risk due to their heightened sensitivity to metabolic changes (35). Conversely, in older adults, the presence of more significant cardiovascular risk factors may attenuate the impact of TyG-BMI. Hyperlipidemia, an independent risk factor for CVD, is closely associated with IR and metabolic syndrome (36), thereby enhancing the predictive power of TyG-BMI. Therefore, additional studies are required to validate these associations and investigate the underlying mechanisms. The advantages of our study include the use of the NHANES database, known for its large sample size and representativeness, and adjustments for some confounding covariates, enhancing the reliability of our results. We also performed subgroup analyses and sensitivity analyses to further investigate the robustness of the association between TyG-BMI index and cardiovascular disease (CVD). Nevertheless, there are limitations to acknowledge. Firstly, Because of our cross-sectional methodology, it is not feasible to establish a causal association between the TyG-BMI values and the prevalence of cardiovascular disease. Secondly, participants with missing TyG-BMI data were excluded to maintain data completeness. The Supplementary Table presents a comparison of baseline characteristics between the included and excluded groups. Additionally, weighted and sensitivity analyses were conducted to mitigate potential bias. Despite these efforts, the exclusion of these participants may still impact the generalizability of our findings. Thirdly, residual confounding cannot be ruled out despite adjusting for multiple covariates, including potential medication effects or other comorbidities. Finally, certain variables potentially relevant to CVD were unavailable in the NHANES dataset, possibly impacting result accuracy. Therefore, to support and build on our findings, further extensive prospective studies involving several centers should be conducted.
The TyG-BMI provides a practical approach to assessing cardiovascular disease risk in adults. Its simplicity and accessibility highlight its potential clinical value. However, prospective studies are necessary to validate its predictive reliability and explore broader applications.
The datasets presented in this study can be found in online repositories. The names of the repository/repositories and accession number(s) can be found in the article/Supplementary Material.
The studies involving humans were approved by NCHS Ethics Review Board, the ERB is affiliated with the National Center for Health Statistics. The studies were conducted in accordance with the local legislation and institutional requirements. The participants provided their written informed consent to participate in this study. Written informed consent was obtained from the individual(s) for the publication of any potentially identifiable images or data included in this article.
RW: Software, Methodology, Investigation, Data curation, Conceptualization, Writing – review & editing, Writing – original draft. XC: Writing – review & editing, Supervision, Methodology, Funding acquisition. WT: Writing – review & editing, Supervision, Methodology.
The author(s) declare financial support was received for the research, authorship, and/or publication of this article. This research was funded by the Anhui Medical University Research of China (Grant no. 2023xkj238) and the Municipal Health and Wellness Committee 2023 Applied Medical Research Program of Hefei (Grant no. Hwk2023yb024).
The authors declare that the research was conducted in the absence of any commercial or financial relationships that could be construed as a potential conflict of interest.
All claims expressed in this article are solely those of the authors and do not necessarily represent those of their affiliated organizations, or those of the publisher, the editors and the reviewers. Any product that may be evaluated in this article, or claim that may be made by its manufacturer, is not guaranteed or endorsed by the publisher.
The Supplementary Material for this article can be found online at: https://www.frontiersin.org/articles/10.3389/fendo.2024.1362667/full#supplementary-material
1. GBD 2019 Risk Factors Collaborators. Global burden of 87 risk factors in 204 countries and territories, 1990-2019: a systematic analysis for the Global Burden of Disease Study 2019. Lancet. (2020) 396:1223–49. doi: 10.1016/s0140-6736(20)30752-2
2. Tsao CW, Aday AW, Almarzooq ZI, Anderson CAM, Arora P, Avery CL, et al. Heart disease and stroke statistics-2023 update: A report from the American heart association. Circulation. (2023) 147:e93–e621. doi: 10.1161/cir.0000000000001123
3. Lee SH, Park SY, Choi CS. Insulin resistance: from mechanisms to therapeutic strategies. Diabetes Metab J. (2022) 46:15–37. doi: 10.4093/dmj.2021.0280
4. Tahapary DL, Pratisthita LB, Fitri NA, Marcella C, Wafa S, Kurniawan F, et al. Challenges in the diagnosis of insulin resistance: Focusing on the role of HOMA-IR and Tryglyceride/glucose index. Diabetes Metab Syndr. (2022) 16:102581. doi: 10.1016/j.dsx.2022.102581
5. Gasmi A, Noor S, Menzel A, Doşa A, Pivina L, Bjørklund G. Obesity and insulin resistance: associations with chronic inflammation, genetic and epigenetic factors. Curr Med Chem. (2021) 28:800–26. doi: 10.2174/0929867327666200824112056
6. Park SY, Gautier JF, Chon S. Assessment of insulin secretion and insulin resistance in human. Diabetes Metab J. (2021) 45:641–54. doi: 10.4093/dmj.2021.0220
7. Lyu L, Wang X, Xu J, Liu Z, He Y, Zhu W, et al. Association between triglyceride glucose-body mass index and long-term adverse outcomes of heart failure patients with coronary heart disease. Cardiovasc Diabetol. (2024) 23:162. doi: 10.1186/s12933-024-02213-2
8. Yang X, Li K, Wen J, Yang C, Li Y, Xu G, et al. Association of the triglyceride glucose-body mass index with the extent of coronary artery disease in patients with acute coronary syndromes. Cardiovasc Diabetol. (2024) 23:24. doi: 10.1186/s12933-024-02124-2
9. Wang X, Liu J, Cheng Z, Zhong Y, Chen X, Song W. Triglyceride glucose-body mass index and the risk of diabetes: a general population-based cohort study. Lipids Health Dis. (2021) 20:99. doi: 10.1186/s12944-021-01532-7
10. Song B, Zhao X, Yao T, Lu W, Zhang H, Liu T, et al. Triglyceride glucose-body mass index and risk of incident type 2 diabetes mellitus in Japanese people with normal glycemic level: A population-based longitudinal cohort study. Front Endocrinol (Lausanne). (2022) 13:907973. doi: 10.3389/fendo.2022.907973
11. Deng D, Chen C, Wang J, Luo S, Feng Y. Association between triglyceride glucose-body mass index and hypertension in Chinese adults: A cross-sectional study. J Clin Hypertens (Greenwich). (2023) 25:370–9. doi: 10.1111/jch.14652
12. Yang S, Shi X, Liu W, Wang Z, Li R, Xu X, et al. Association between triglyceride glucose-body mass index and heart failure in subjects with diabetes mellitus or prediabetes mellitus: a cross-sectional study. Front Endocrinol (Lausanne). (2023) 14:1294909. doi: 10.3389/fendo.2023.1294909
13. Zhan C, Peng Y, Ye H, Diao X, Yi C, Guo Q, et al. Triglyceride glucose-body mass index and cardiovascular mortality in patients undergoing peritoneal dialysis: a retrospective cohort study. Lipids Health Dis. (2023) 22:143. doi: 10.1186/s12944-023-01892-2
14. Hoshino T, Mizuno T, Ishizuka K, Takahashi S, Arai S, Toi S, et al. Triglyceride-glucose index as a prognostic marker after ischemic stroke or transient ischemic attack: a prospective observational study. Cardiovasc Diabetol. (2022) 21:264. doi: 10.1186/s12933-022-01695-2
15. Hu Y, Zhao Y, Zhang J, Li C. The association between triglyceride glucose-body mass index and all-cause mortality in critically ill patients with atrial fibrillation: a retrospective study from MIMIC-IV database. Cardiovasc Diabetol. (2024) 23:64. doi: 10.1186/s12933-024-02153-x
16. Zhou H, Li T, Li J, Zheng D, Yang J, Zhuang X. Linear association of compound dietary antioxidant index with hyperlipidemia: a cross-sectional study. Front Nutr. (2024) 11:1365580. doi: 10.3389/fnut.2024.1365580
17. Levey AS, Stevens LA, Schmid CH, Zhang YL, Castro AF, 3rd Feldman HI, et al. A new equation to estimate glomerular filtration rate. Ann Intern Med. (2009) 150:604–12. doi: 10.7326/0003-4819-150-9-200905050-00006
18. Phillips JA. Dietary guidelines for Americans, 2020-2025. Workplace Health Saf. (2021) 69:395. doi: 10.1177/21650799211026980
19. Paul I E, Bruce AD, Liang W, Gary DS, Gina OT-E, Wenche SB, et al. Update on prevalence of periodontitis in adults in the United States: NHANES 2009 to 2012. J Periodontol. (2015) 86:611–22. doi: 10.1902/jop.2015.140520
20. Nayili M, Xiyue J, Naijian Z, Chuanlang L, Changping L, Zhuang C, et al. Association between systemic immunity-inflammation index and hyperlipidemia: A population-based study from the NHANES (2015-2020). Nutrients. (2023) 15:1177. doi: 10.3390/nu15051177
21. National Cholesterol Education Program (NCEP) Expert Panel on Detection, Evaluation, and Treatment of High Blood Cholesterol in AdultsThird Report of the National Cholesterol Education Program (NCEP) Expert Panel on Detection, Evaluation, and Treatment of High Blood Cholesterol in Adults (Adult Treatment Panel III) final report. Circulation. (2002) 106:3143–421. doi: 10.1161/circ.106.25.3143
22. Jiang C, Yang R, Kuang M, Yu M, Zhong M, Zou Y. Triglyceride glucose-body mass index in identifying high-risk groups of pre-diabetes. Lipids Health Dis. (2021) 20:161. doi: 10.1186/s12944-021-01594-7
23. Wang R, Dai L, Zhong Y, Xie G. Usefulness of the triglyceride glucose-body mass index in evaluating nonalcoholic fatty liver disease: insights from a general population. Lipids Health Dis. (2021) 20:77. doi: 10.1186/s12944-021-01506-9
24. Peng N, Kuang M, Peng Y, Yu H, Zhang S, Xie G, et al. Associations between TyG-BMI and normal-high blood pressure values and hypertension: cross-sectional evidence from a non-diabetic population. Front Cardiovasc Med. (2023) 10:1129112. doi: 10.3389/fcvm.2023.1129112
25. Balakumar P, Maung UK, Jagadeesh G. Prevalence and prevention of cardiovascular disease and diabetes mellitus. Pharmacol Res. (2016) 113:600–9. doi: 10.1016/j.phrs.2016.09.040
26. Eckel RH, Grundy SM, Zimmet PZ. The metabolic syndrome. Lancet. (2005) 365:1415–28. doi: 10.1016/s0140-6736(05)66378-7
27. Hill MA, Yang Y, Zhang L, Sun Z, Jia G, Parrish AR, et al. Insulin resistance, cardiovascular stiffening and cardiovascular disease. Metabolism. (2021) 119:154766. doi: 10.1016/j.metabol.2021.154766
28. Saotome M, Ikoma T, Hasan P, Maekawa Y. Cardiac insulin resistance in heart failure: the role of mitochondrial dynamics. Int J Mol Sci. (2019) 20:3552. doi: 10.3390/ijms20143552
29. Yamazoe M, Hisamatsu T, Miura K, Kadowaki S, Zaid M, Kadota A, et al. Relationship of insulin resistance to prevalence and progression of coronary artery calcification beyond metabolic syndrome components: shiga epidemiological study of subclinical atherosclerosis. Arterioscler Thromb Vasc Biol. (2016) 36:1703–8. doi: 10.1161/atvbaha.116.307612
30. Shah AD, Langenberg C, Rapsomaniki E, Denaxas S, Pujades-Rodriguez M, Gale CP, et al. Type 2 diabetes and incidence of cardiovascular diseases: a cohort study in 1·9 million people. Lancet Diabetes Endocrinol. (2015) 3:105–13. doi: 10.1016/s2213-8587(14)70219-0
31. Di Pino A, DeFronzo RA. Insulin resistance and atherosclerosis: implications for insulin-sensitizing agents. Endocr Rev. (2019) 40:1447–67. doi: 10.1210/er.2018-00141
32. Dou J, Guo C, Wang Y, Peng Z, Wu R, Li Q, et al. Association between triglyceride glucose-body mass and one-year all-cause mortality of patients with heart failure: a retrospective study utilizing the MIMIC-IV database. Cardiovasc Diabetol. (2023) 22:309. doi: 10.1186/s12933-023-02047-4
33. Zeng ZY, Liu SX, Xu H, Xu X, Liu XZ, Zhao XX. Association of triglyceride glucose index and its combination of obesity indices with prehypertension in lean individuals: A cross-sectional study of Chinese adults. J Clin Hypertens (Greenwich). (2020) 22:1025–32. doi: 10.1111/jch.13878
34. Cheng Y, Fang Z, Zhang X, Wen Y, Lu J, He S, et al. Association between triglyceride glucose-body mass index and cardiovascular outcomes in patients undergoing percutaneous coronary intervention: a retrospective study. Cardiovasc Diabetol. (2023) 22:75. doi: 10.1186/s12933-023-01794-8
35. Wagenknecht LE, Lawrence JM, Isom S, Jensen ET, Dabelea D, Liese AD, et al. Trends in incidence of youth-onset type 1 and type 2 diabetes in the USA, 2002-18: results from the population-based SEARCH for Diabetes in Youth study. Lancet Diabetes Endocrinol. (2023) 11:242–50. doi: 10.1016/s2213-8587(23)00025-6
Keywords: cardiovascular disease, TyG-BMI, insulin resistance, NHANES, cross-sectional studies
Citation: Wang R, Cheng X and Tao W (2024) Association between triglyceride glucose body mass index and cardiovascular disease in adults: evidence from NHANES 2011- 2020. Front. Endocrinol. 15:1362667. doi: 10.3389/fendo.2024.1362667
Received: 28 December 2023; Accepted: 03 July 2024;
Published: 16 July 2024.
Edited by:
Paola Di Pietro, University of Salerno, ItalyReviewed by:
Hong Zhu, Tianjin Medical University, ChinaCopyright © 2024 Wang, Cheng and Tao. This is an open-access article distributed under the terms of the Creative Commons Attribution License (CC BY). The use, distribution or reproduction in other forums is permitted, provided the original author(s) and the copyright owner(s) are credited and that the original publication in this journal is cited, in accordance with accepted academic practice. No use, distribution or reproduction is permitted which does not comply with these terms.
*Correspondence: Run Wang, d3J1bjIwMjNAMTYzLmNvbQ==
Disclaimer: All claims expressed in this article are solely those of the authors and do not necessarily represent those of their affiliated organizations, or those of the publisher, the editors and the reviewers. Any product that may be evaluated in this article or claim that may be made by its manufacturer is not guaranteed or endorsed by the publisher.
Research integrity at Frontiers
Learn more about the work of our research integrity team to safeguard the quality of each article we publish.