 Xianhua Li
 Wenqing Hao1,2
 Nailong Yang
- 1Department of Endocrinology and Metabolism, The Affiliated Hospital of Qingdao University, Qingdao, China
- 2Department of Nursing and Hospital Infection Management, The Affiliated Hospital of Qingdao University, Qingdao, China
- 3Department of Endocrinology and Diabetes Department, Shouguang People’s Hospital, Weifang, Shandong, China
Objective: This study aimed to explore the association between the aspartate aminotransferase to alanine aminotransferase ratio (AST/ALT ratio) and diabetic retinopathy (DR) in patients with type 2 diabetes.
Methods: In this cross-sectional study, clinical data from 3002 patients with type 2 diabetes admitted to the Department of Endocrinology of our hospital between January 1, 2021, and December 1, 2022, were retrospectively collected. Measurements of AST and ALT were conducted and diabetes-related complications were screened. The association between AST/ALT ratio and diabetic retinopathy was assessed using multivariate logistic regression, and a generalized additive model (GAM) was used to investigate nonlinear relationships. Subgroup analyses and interaction tests were also conducted.
Results: Among the 3002 patients, 1590 (52.96%) were male and 1412 (47.04%) were female. The mean AST/ALT ratio was 0.98 ± 0.32, ranging from 0.37 (Min) to 2.17 (Max). Diabetic retinopathy was present in 40.47% of the patients. After multivariate adjustments, for each 0.1 unit increase in AST/ALT ratio, the risk of DR increased by 4% (OR = 1.04, 95% CI: 1.01–1.07, p=0.0053). Higher AST/ALT ratio quartiles were associated with Higher prevalence of DR (OR vs. Q1: Q4 = 1.34 (CI: 1.03–1.75, p=0.0303).The GAM and smoothed curve fit indicated a linear relationship between AST/ALT ratio and DR risk, with no significant interaction effects across different subgroups.
Conclusion: Our study demonstrates a positive correlation between the AST/ALT ratio and diabetic retinopathy risk in type 2 diabetes, suggesting its potential role in assessing DR risk.
1 Introduction
Type 2 diabetes mellitus (T2DM) represents a significant global health challenge, affecting nearly half a billion people worldwide (1). Its prevalence is projected to increase dramatically, marking an escalating public health concern (2, 3). A prevalent microvascular complication of T2DM, diabetic retinopathy (DR), stands as a leading cause of blindness globally (4, 5). In China, the prevalence of DR among diabetic individuals exhibits considerable variation, with estimates ranging from 18.45% to 31.8%. This variation may reflect differences in study methodologies or demographic variations across regions, highlighting the complexity of managing DR within diverse populations (6, 7). Despite advancements in the understanding of DR, significant challenges in its early diagnosis and treatment remain (8, 9).
Liver enzymes, particularly Alanine aminotransferase(ALT) and Aspartate aminotransferase (AST), are emerging as significant markers (10, 11). The AST/ALT ratio, introduced by De Ritis in 1957, is a known indicator of liver function and has been associated with various systemic diseases, including cardiovascular, renal, and oncological conditions (12–15). Recent studies have also linked AST/ALT ratio with gestational diabetes and metabolic syndrome in children, expanding its relevance beyond liver diseases (16, 17). However, the relationship between AST/ALT ratio and DR in T2D patients remains under-explored.
Considering the roles of AST and ALT in metabolic and inflammatory processes (18–21), investigating their relationship with DR may unveil new proxies for early diagnosis and risk stratification. This is particularly crucial for patients with T2DM, where early detection and accurate risk assessment of DR are essential to prevent severe vision loss (22, 23). Moreover, given the predictive value of the AST/ALT ratio in other systemic diseases (15, 24, 25), exploring its potential association with DR could offer fresh insights into the complexity of T2DM complications and facilitate personalized patient management strategies.
This study aims to address this gap by examining the association between the AST/ALT ratio and DR in T2DM patients. By understanding this relationship, we seek to contribute to the early detection and risk stratification of DR, a crucial step towards improving patient outcomes in T2DM.
2 Methods
2.1 Research setting and population
This single-center, cross-sectional study was conducted at the Endocrinology Department of Qingdao University Affiliated Hospital, between January 1, 2021, and December 1, 2022. Inpatients aged 18 and above, diagnosed with Type 2 Diabetes Mellitus (T2DM) as per the American Diabetes Association’s 2021 guidelines, were included. Exclusion criteria were meticulously defined to mitigate potential confounding factors, including:
Presence of severe systemic or ocular conditions (e.g., uveitis, glaucoma) that could affect the study outcomes.
Recent ocular treatments or surgeries within the past three months.
Significant liver diseases or unexplained AST and ALT elevations exceeding 2.5 times the upper limit.
Use of medications known to affect liver function significantly.
Malignant neoplasms, due to their profound systemic health impact and potential confounding effect.
Figure 1 illustrates the inclusion and exclusion criteria application.
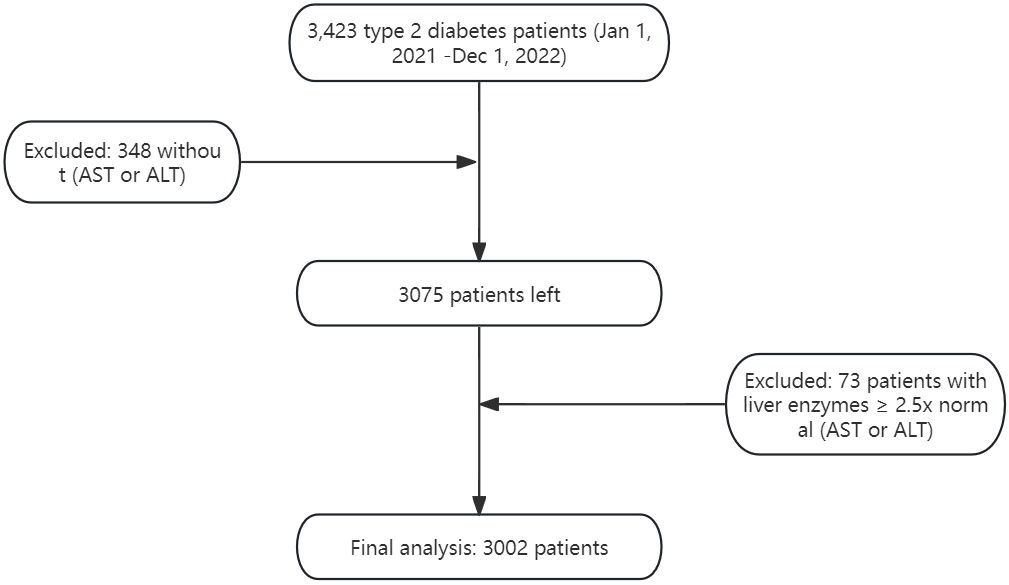
Figure 1 Flowchart of study population.
2.2 Ethics statement
Adhering to the Declaration of Helsinki, informed consent was obtained from all participants. The study received ethical approval from the Ethics Committee of Qingdao University Affiliated Hospital (Approval No. QYFY WZLL 28254).
2.3 Measurement of AST and ALT
Blood samples were collected following an overnight fast to ensure accuracy. AST and ALT were quantified using the Hitachi 7600 analyzer, a method based on kinetic enzyme assay techniques. The established reference ranges were 15-40 U/L for AST and 9-50 U/L for ALT, aligning with clinical standards.
2.4 Diagnosis of diabetic retinopathy
The diagnosis of diabetic retinopathy (DR) in our study was rigorously conducted using a multi-modal imaging approach. Initial assessments involved slit lamp microscopy and optical coherence tomography to identify retinopathy changes during funduscopic examinations. This was followed by confirmatory diagnosis using 45° four-field stereoscopic digital photography with a Carl Zeiss Fundus Camera, which allowed for the detailed capture of images from both eyes across designated fields, eliminating the need for mydriasis (26).
Experienced ophthalmologists then evaluated these images, classifying DR according to the International Clinical Diabetic Retinopathy Disease Severity Scale into four severity levels. The identification of any severity lesion based on this scale was considered diagnostic of DR (26), ensuring an accurate and comprehensive diagnostic process (27).
2.5 Covariates
2.5.1 Demographic and Clinical Data
Included variables were gender, age, diabetes duration, and complications.
2.5.2 Anthropometrics
Measurements of height, weight, and body mass index (BMI) were conducted, with BMI calculated as weight in kilograms divided by height in meters squared. In aligning with specific regional considerations, we applied the WHO BMI Asian cutoffs to classify participants: <23 as underweight or normal, 23-25 as overweight, and >=25 as obese (28).
2.5.3 Lifestyle Factors
Smoking and alcohol consumption were evaluated, with alcohol consumption defined as intake of 30 g or more weekly for over a year, and smoking defined by a history of 100 or more cigarettes smoked in one’s lifetime (29).
2.5.4 Biochemical Analyses
Fasting blood samples enabled creatinine, fasting plasma glucose, liver function tests, HbA1c.All assessments, apart from HbA1c, utilized the Hitachi 7600 analyzer. Fatty liver diagnosis was ultrasound-based (30). Hypertension was identified through blood pressure measurements, following established criteria (31). The eGFR calculation employed the Andrew S. Levey formula (32), with diabetic nephropathy confirmed per KDIGO guidelines when urinary ACR ≥ 30 mg/mmol or eGFR < 60 mL/min/1.73m^2 (33). Diabetic Peripheral Neuropathy (DPN) Diagnosis: A comprehensive assessment integrated clinical, neurological examinations, and nerve conduction studies, adhering to recognized guidelines (34). DPN diagnosis utilized a structured approach: Clinically Evident DPN: Required at least two positive findings among sensory symptoms, signs, or reflex abnormalities consistent with distal symmetrical polyneuropathy. Abnormal Nerve Conduction Studies: Mandated at least one abnormal parameter (amplitude, latency, F-wave, or nerve conduction velocity) in two or more specific nerves.
2.6 Statistical methods
Continuous variables were reported as means and standard deviations if normally distributed, and medians with interquartile ranges (IQRs) for skewed distributions. Categorical variables were expressed as percentages. We utilized the Chi-square (χ^2) test for categorical variables, Student’s t-test for normally distributed continuous variables, and the Mann-Whitney U test for skewed continuous variables to evaluate differences in diabetic retinopathy status among participants. Additionally, differences among AST/ALT ratio quartiles were analyzed using the χ^2 test for categorical variables, One-Way ANOVA for normally distributed variables, and the Kruskal-Wallis H test for variables with skewed distributions.
The AST/ALT ratio was treated both as a continuous variable, assessed in increments of 0.1 units for a detailed examination of its relationship with diabetic retinopathy (DR) risk, and as a categorical variable through quartile conversion to facilitate group comparisons.
To identify variables potentially associated with diabetic retinopathy (DR), we initially conducted univariate logistic regression analysis. Following this, we employed logistic regression analysis, systematically adjusting for potential confounders across distinct models: Non-adjusted model: No adjustments were applied. Model I: Adjustments were made for essential demographic and clinical factors, including Age, Sex, and Body Mass Index (BMI).Model II: This model provided a comprehensive adjustment for an extended set of variables: Age, Sex, BMI, Duration of Diabetes, Fasting Blood Glucose (FBG), Glycated Hemoglobin (HbA1c), Diabetic Nephropathy (DN), and Diabetic Peripheral Neuropathy (DPN).
To assess non-linear relationships between the AST/ALT ratio and DR risk, Generalized Additive Models (GAM) were utilized. Additionally, subgroup analyses and interaction tests were conducted to investigate the effects of the AST/ALT ratio across different patient subgroups.
Statistical analyses were conducted using R software (The R Foundation) and EmpowerStats (http://www.empowerstats.com, X&Y Solutions, Inc., Boston, MA), ensuring the use of robust and reliable tools. Significance was determined by a two-sided P-value of less than 0.05, maintaining a standard criterion for statistical significance.
3 Results
In Table 1, our cross-sectional study included 3002 type 2 diabetes patients, divided into 1787 without diabetic retinopathy (Non-Diabetic Retinopathy group) and 1215 with the condition (Diabetic Retinopathy group). Key differences emerged in demographic and clinical measures.
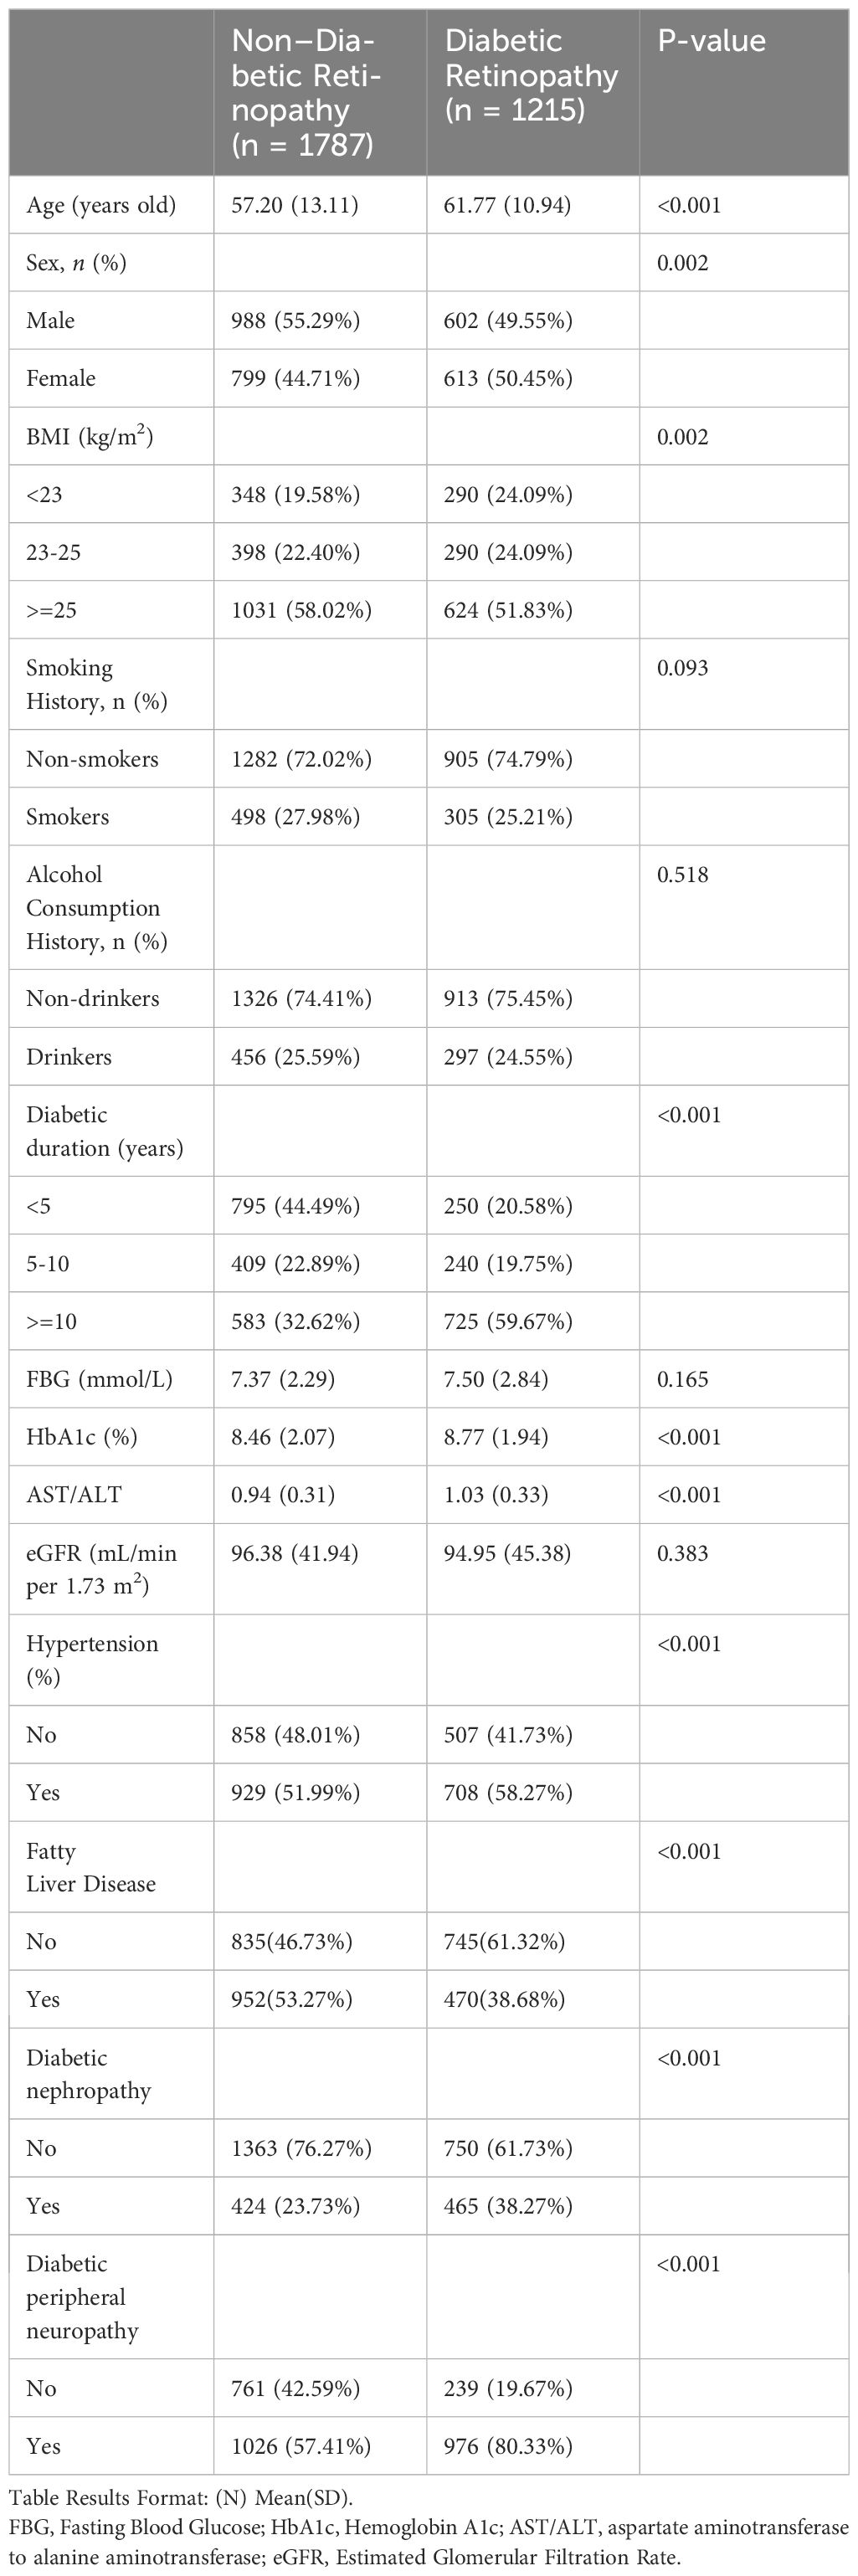
Table 1 Baseline characteristics of participants.
Significantly, the Diabetic Retinopathy group was older and had a higher proportion of females. The duration of diabetes was notably longer in this group.
Clinically, the Diabetic Retinopathy group showed higher levels of Glycated Hemoglobin (HbA1c) and a significant difference in the AST/ALT ratio, reflecting a potential link to retinopathy severity. Prevalences of hypertension and diabetic nephropathy were also higher in the Diabetic Retinopathy group, underscoring the comorbidity burden in these patients. In Supplementary Material 1, we present the baseline characteristics of patients with Type 2 Diabetes Mellitus (T2DM), stratified by quartiles of the AST/ALT ratio.
In our preliminary univariate logistic regression analysis(Table 2), we observed a significant correlation between the AST/ALT ratio and the risk of diabetic retinopathy (DR) in patients with Type 2 Diabetes Mellitus (T2DM). Notably, the AST/ALT ratio, both as a continuous variable (OR: 1.98, 95% CI: 1.61 – 2.42, p < 0.0001) and when categorized into quartiles, showed a strong, positive association with DR risk, escalating across quartiles (Q1 as reference: Q2 OR: 1.55, Q3 OR: 1.64, Q4 OR: 2.16; all p < 0.0001). Other factors, such as age, female sex, longer diabetes duration, higher HbA1c levels, hypertension, fatty liver disease, diabetic nephropathy, and diabetic peripheral neuropathy, were also significantly associated with increased DR risk.
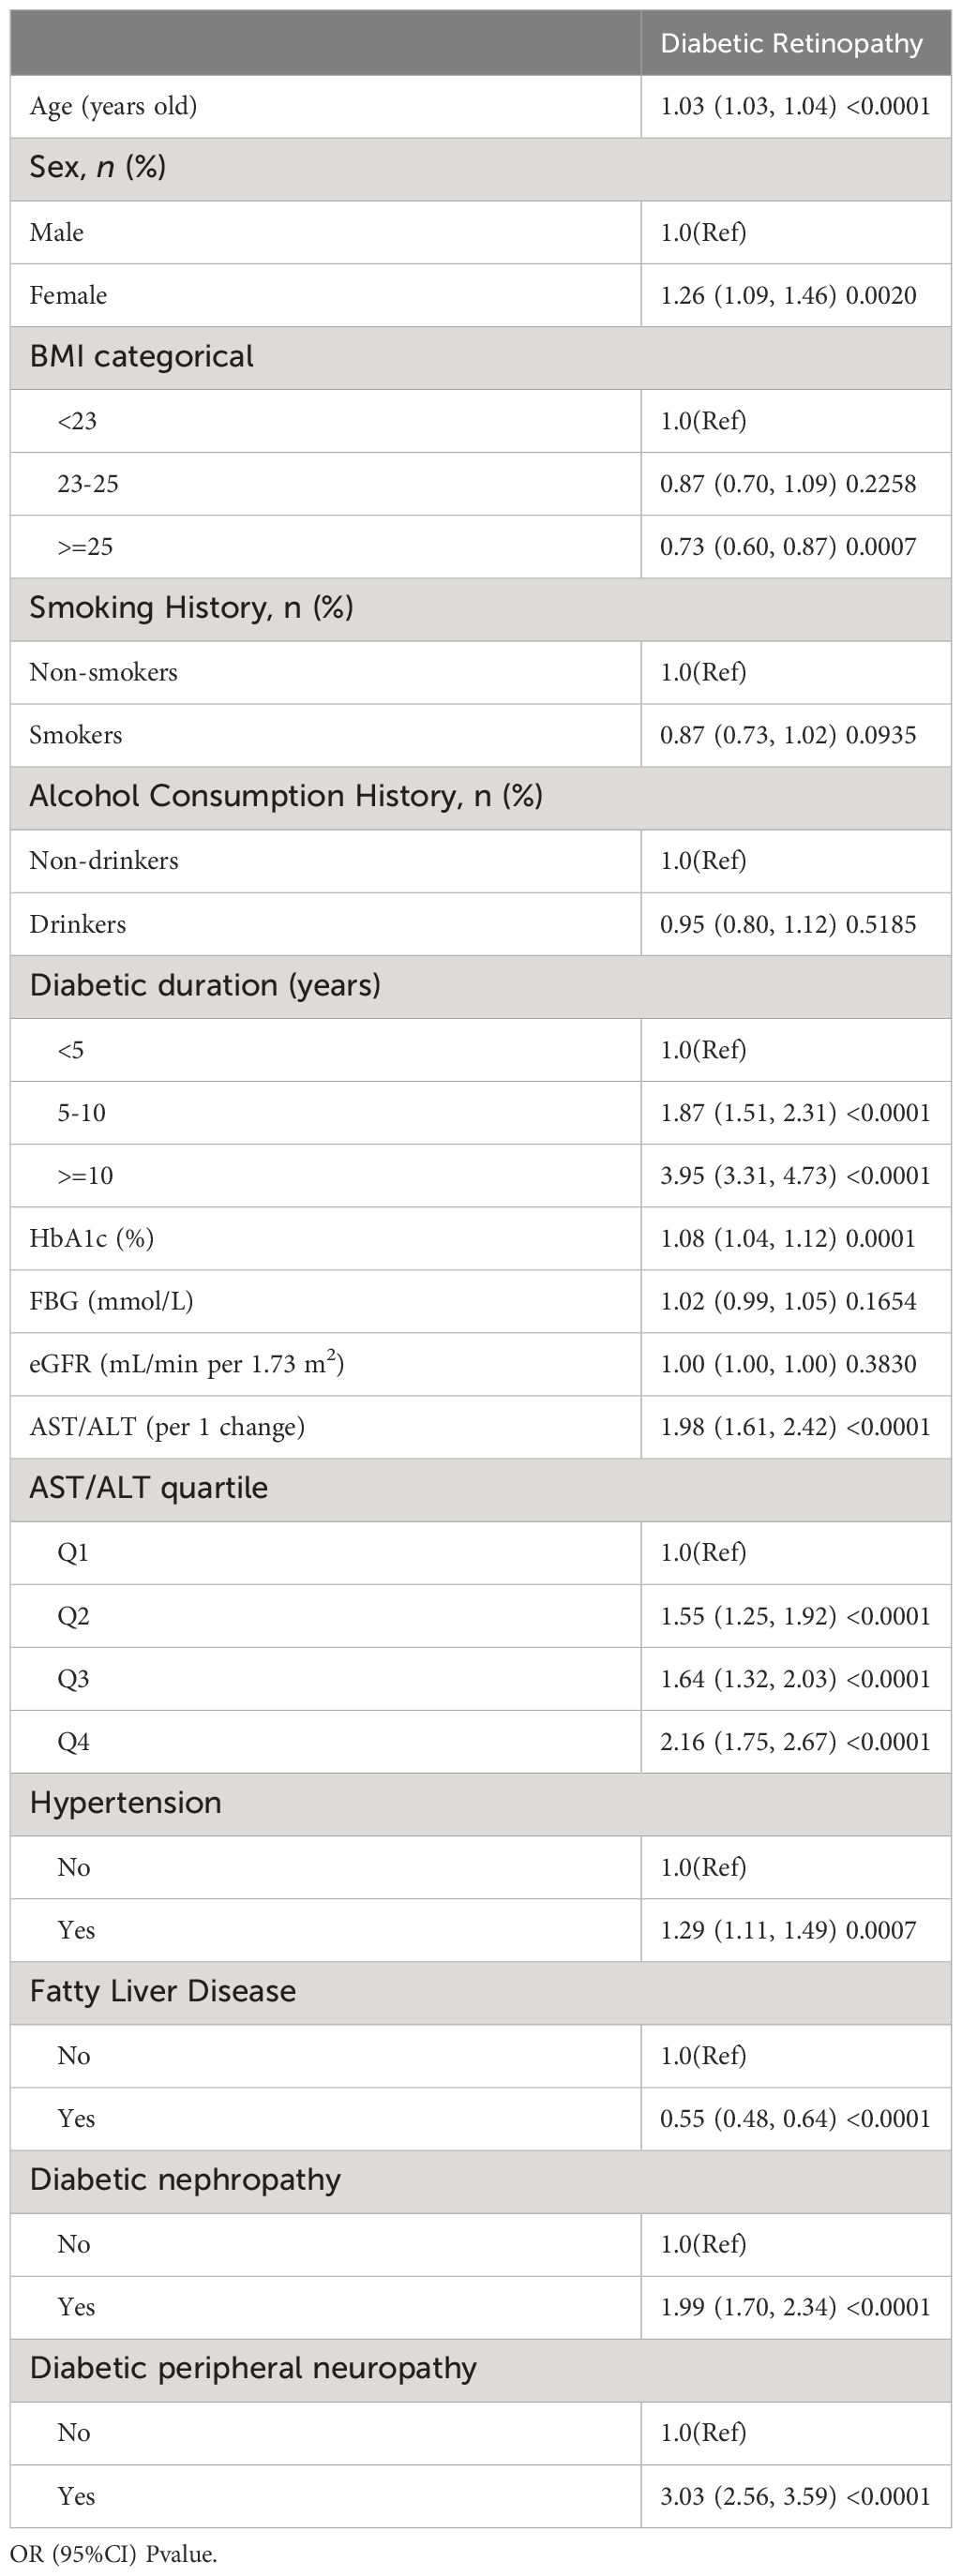
Table 2 Univariate logistic regression analysis: factors correlated with diabetic retinopathy.
In our logistic regression analysis, as detailed in Table 3, we systematically adjusted for potential confounders to evaluate the association between the AST/ALT ratio and the risk of diabetic retinopathy (DR) across several models. Analyzing the AST/ALT ratio as a continuous variable, the unadjusted model revealed a significant association (OR: 1.09, 95% CI: 1.07 - 1.12, p < 0.0001). The association’s strength was slightly attenuated upon adjusting for age, sex, and BMI in Model I (OR: 1.05, 95% CI: 1.03 - 1.08, p < 0.0001). Further adjustments in Model II, incorporating variables such as duration of diabetes, fasting blood glucose, HbA1c, diabetic nephropathy, and diabetic peripheral neuropathy, continued to show a positive association, albeit reduced (OR: 1.04, 95% CI: 1.01 - 1.07, p = 0.0053). These findings suggest that the AST/ALT ratio was consistently associated with higher odds of DR in type 2 diabetes, even after accounting for various confounding factors.
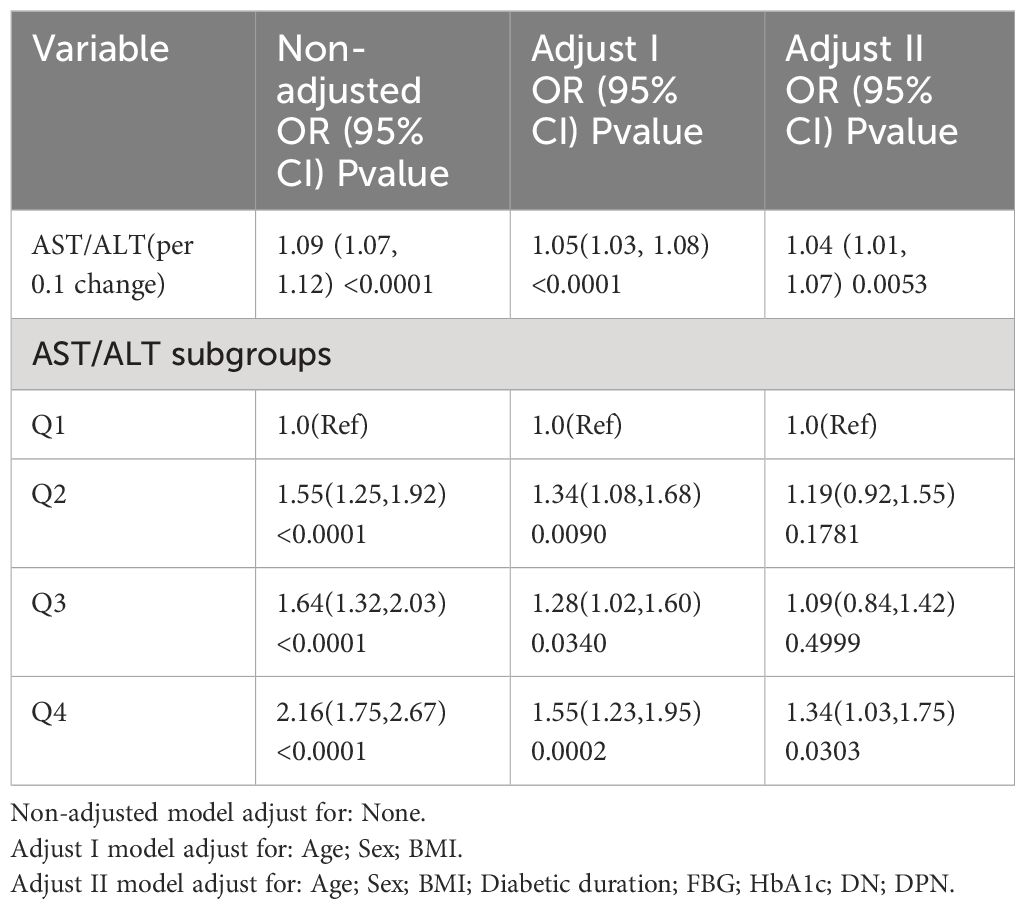
Table 3 Relationship between AST/ALT and DR in different models.
When analyzing the AST/ALT ratio as a variable categorized into quartiles, we observed that higher AST/ALT ratio quartiles were associated with an increased prevalence of DR in Model II, illustrating a gradient of risk across quartiles (OR vs. Q1: Q2 = 1.19, 95% CI: 0.92–1.55; Q3 = 1.09, 95% CI: 0.84–1.42; and Q4 = 1.34, 95% CI: 1.03–1.75).
In our study, we utilized generalized additive models (GAM) to explore the potential non-linear relationship between the AST/ALT ratio and diabetic retinopathy (DR), given the continuous nature of the AST/ALT ratio as depicted in Figure 2. Our analysis, however, identified a linear relationship between the AST/ALT ratio and DR risk. This finding was determined after comprehensive adjustments for a range of critical variables, including age, sex, body mass index (BMI), duration of diabetes, fasting blood glucose (FBG), Hemoglobin A1c (HbA1c), diabetic nephropathy (DN), and diabetic peripheral neuropathy (DPN).
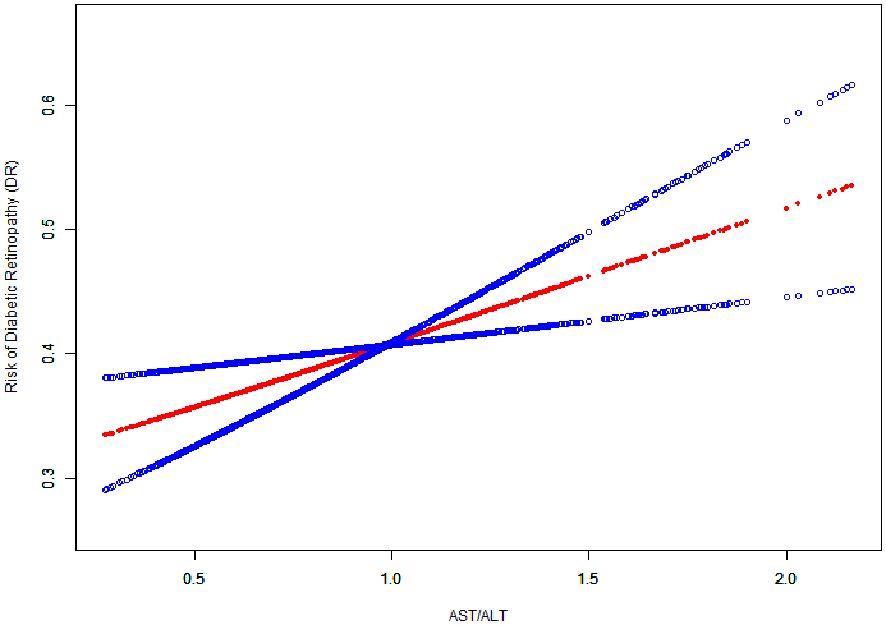
Figure 2 The Linear Relationship Between the AST/ALT Ratio and the Risk of Diabetic Retinopathy. Image Annotation: The generalized additive model plot delineates the association between AST/ALT Ratio (X-axis) and Risk of Diabetic Retinopathy (DR) (Y-axis).
In our investigation, depicted in Figure 3, we performed stratified analyses to examine the association between the AST/ALT ratio and diabetic retinopathy (DR) risk across diverse subgroups. These subgroups were defined by several key characteristics. The results, illustrated in a forest plot, indicated a consistent association between the AST/ALT ratio and diabetic retinopathy across our subgroups. Notably, this association was evaluated based on a per 1 unit increase in the AST/ALT ratio. Despite variations in demographic and clinical characteristics, the interaction p-values all exceeded 0.05, suggesting a stable and robust relationship between AST/ALT ratio and diabetic retinopathy risk that is not significantly influenced by these stratifying factors.
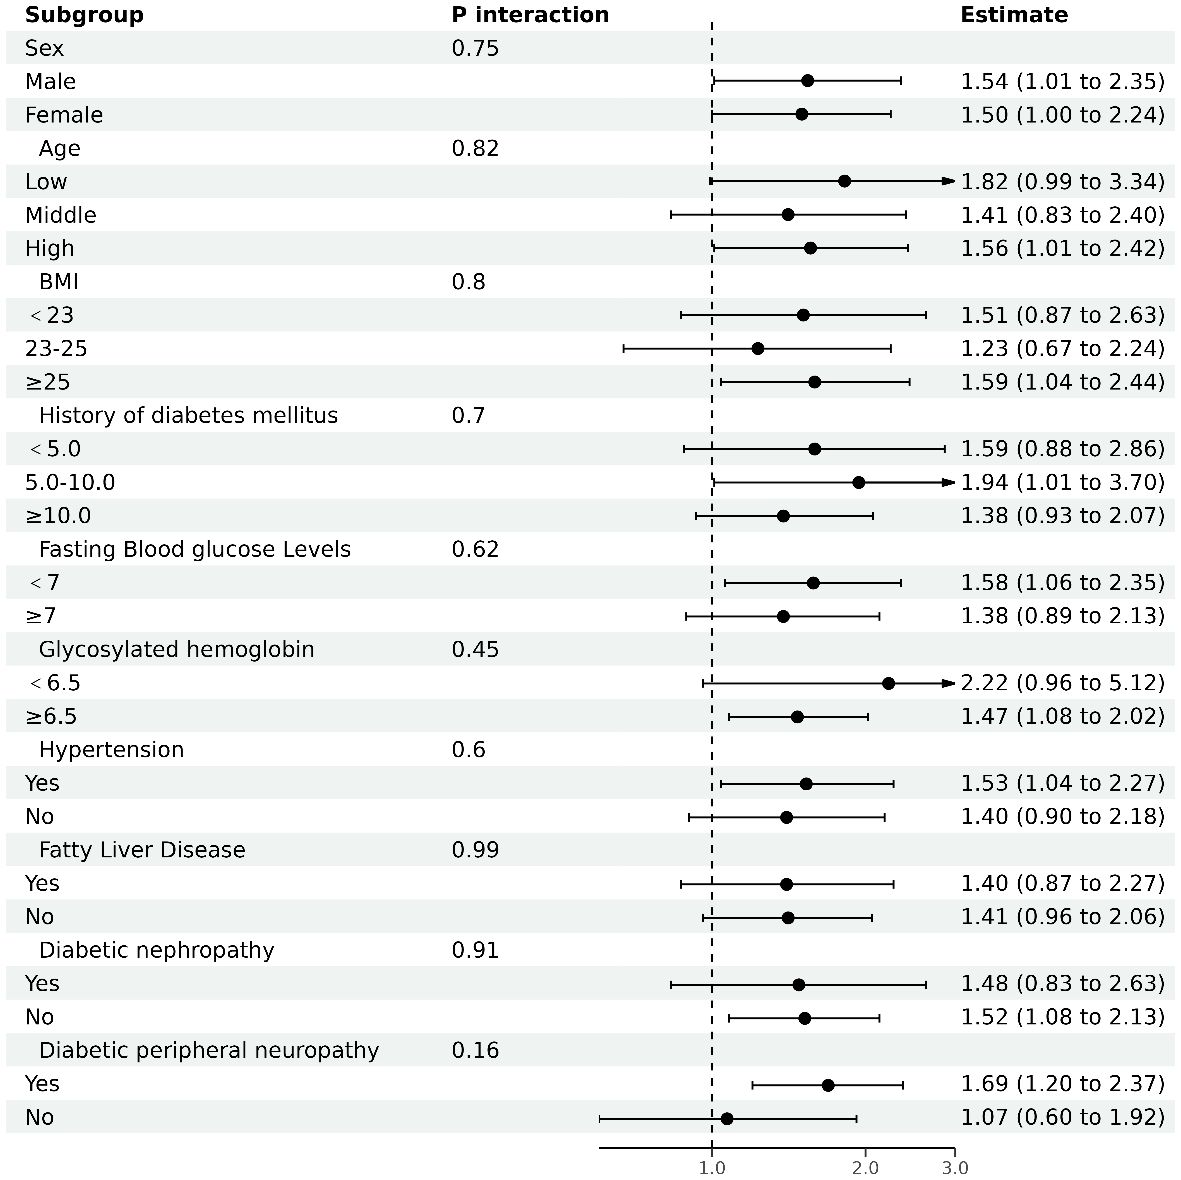
Figure 3 The results of subgroup analyses. Analysis adjusted for age, sex, body mass index (BMI), duration of diabetes, fasting blood glucose (FBG), Hemoglobin A1c (HbA1c), diabetic nephropathy (DN), and diabetic peripheral neuropathy (DPN), excluding the variable specific to each subgroup under investigation.
4 Discussion
Our study’s primary findings indicate a positive correlation between the AST/ALT ratio and the risk of diabetic retinopathy (DR) in patients with type 2 diabetes. This suggests that patients with higher AST/ALT ratios should be promptly screened for diabetic retinopathy, aiding in the improved management of type 2 diabetic retinopathy. These results provide novel insight into the relationship between liver enzymes and diabetic complications, highlighting the importance of the AST/ALT ratio in the clinical assessment of diabetes patients.
The pathophysiology of DR encompasses oxidative stress, chronic inflammation, and altered metabolic pathways. Intriguingly, the AST/ALT ratio, indicative of changes in liver enzyme levels, is associated with these same pathophysiological factors, including oxidative stress, systemic inflammation, and insulin resistance (35, 36). This association suggests that altered AST/ALT ratios could play a role in the progression of DR.
Further, our findings are in line with other research that highlights the significance of AST/ALT ratios in various diabetic complications like peripheral neuropathy and nephropathy. These studies underscore the systemic impact of altered liver enzyme levels in diabetes (35, 37).
A notable strength of our study is the use of GAM, which effectively demonstrates the linear relationship between AST/ALT ratios and DR. Through rigorous statistical adjustments and consistent findings across different subgroups, our study suggests that each 0.1 unit increase in the AST/ALT ratio is associated with a 4% increase in the risk of DR.
Additionally, our comprehensive search of the PubMed database did not reveal any similar studies, highlighting the originality of our research. This study preliminarily suggests a potential association between the AST/ALT ratio and diabetic retinopathy (DR), thereby offering a new dimension in understanding possible biomarkers for diabetes and its complications.
However, this study still has some limitations. Being a cross-sectional analysis, it offers associative insights but cannot confirm causality (38). Additionally, the applicability of our results may be restricted to the Chinese population and might not extend to those with AST/ALT ratios beyond the 0.37 to 2.17 range.
In conclusion, our research sheds light on the AST/ALT ratio as a potential indicator associated with the risk of diabetic retinopathy in type 2 diabetes patients. These initial findings suggest that the AST/ALT ratio could be further investigated as a biomarker for assessing DR risk. Such investigations are important to validate these findings and explore the underlying biological mechanisms in more diverse populations and through prospective studies.
5 Conclusion
This study reveals a positive correlation between the AST/ALT ratio and the risk of diabetic retinopathy in type 2 diabetes patients. Further studies are essential to confirm these findings and investigate the underlying mechanisms across diverse populations.
Data availability statement
The raw data supporting the conclusions of this article will be made available by the authors, without undue reservation.
Ethics statement
This research was conducted in accordance with the principles set forth in the Declaration of Helsinki. Informed consent was obtained from all participants. The study received the endorsement of the Ethics Committee of the Affiliated Hospital of Qingdao University (Approval No. QYFY WZLL 28254).
Author contributions
XL: Data curation, Formal analysis, Writing – original draft. WH: Data curation, Supervision, Writing – review & editing. SL: Data curation, Formal analysis, Writing – review & editing. NY: Supervision, Writing – review & editing.
Funding
The author(s) declare that no financial support was received for the research, authorship, and/or publication of this article.
Conflict of interest
The authors declare that the research was conducted in the absence of any commercial or financial relationships that could be construed as a potential conflict of interest.
Publisher’s note
All claims expressed in this article are solely those of the authors and do not necessarily represent those of their affiliated organizations, or those of the publisher, the editors and the reviewers. Any product that may be evaluated in this article, or claim that may be made by its manufacturer, is not guaranteed or endorsed by the publisher.
Supplementary material
The Supplementary Material for this article can be found online at: https://www.frontiersin.org/articles/10.3389/fendo.2024.1361707/full#supplementary-material
References
1. Sun H, Saeedi P, Karuranga S, Pinkepank M, Ogurtsova K, Duncan BB, et al. IDF Diabetes Atlas: Global, regional and country-level diabetes prevalence estimates for 2021 and projections for 2045. Diabetes Res Clin Pract. (2022) 183:109119. doi: 10.1016/j.diabres.2021.109119
2. Lin YK, Gao B, Liu L, Ang L, Mizokami-Stout K, Pop-Busui R, et al. The prevalence of diabetic microvascular complications in China and the USA. Curr Diabetes Rep. (2021) 21:16. doi: 10.1007/s11892-021-01387-3
3. Saeedi P, Petersohn I, Salpea P, Malanda B, Karuranga S, Unwin N, et al. Global and regional diabetes prevalence estimates for 2019 and projections for 2030 and 2045: Results from the International Diabetes Federation Diabetes Atlas, 9(th) edition. Diabetes Res Clin Pract. (2019) 157:107843. doi: 10.1016/j.diabres.2019.107843
4. Zhang X, Saaddine JB, Chou CF, Cotch MF, Cheng YJ, Geiss LS, et al. Prevalence of diabetic retinopathy in the United States, 2005-2008. Jama. (2010) 304:649–56. doi: 10.1001/jama.2010.1111
5. Cai K, Liu YP, Wang D. Prevalence of diabetic retinopathy in patients with newly diagnosed type 2 diabetes: A systematic review and meta-analysis. Diabetes/metabolism Res Rev. (2023) 39:e3586. doi: 10.1002/dmrr.3586
6. Zhang X, Huang Y, Xu N, Feng W, Qiao J, Liu M. Low serum dehydroepiandrosterone levels are associated with diabetic retinopathy in patients with type 2 diabetes mellitus. J Diabetes Invest. (2023) 14:675–85. doi: 10.1111/jdi.13997
7. Liu J, Hu H, Qiu S, Wang D, Liu J, Du Z, et al. The prevalence and risk factors of diabetic retinopathy: screening and prophylaxis project in 6 provinces of China. Diabetes Metab syndrome Obes Targets Ther. (2022) 15:2911–25. doi: 10.2147/DMSO.S378500
8. Vujosevic S, Aldington SJ, Silva P, Hernández C, Scanlon P, Peto T, et al. Screening for diabetic retinopathy: new perspectives and challenges. Lancet Diabetes Endocrinol. (2020) 8:337–47. doi: 10.1016/S2213-8587(19)30411-5
9. Kárason KT, Vo D, Grauslund J, Rasmussen ML. Comparison of different methods of retinal imaging for the screening of diabetic retinopathy: a systematic review. Acta ophthalmologica. (2022) 100:127–35. doi: 10.1111/aos.14767
10. Mandato C, Vajro P. Isolated aspartate aminotransferase elevation: Is it liver disease or what else? Acta paediatrica (Oslo Norway 1992). (2022) 111:459–61. doi: 10.1111/apa.16213
11. Kulecka M, Wierzbicka A, Paziewska A, Mikula M, Habior A, Janczyk W, et al. A heterozygous mutation in GOT1 is associated with familial macro-aspartate aminotransferase. J Hepatol. (2017) 67:1026–30. doi: 10.1016/j.jhep.2017.07.003
12. Schupp T, Rusnak J, Weidner K, Ruka M, Egner-Walter S, Dudda J, et al. Prognostic value of the AST/ALT ratio versus bilirubin in patients with cardiogenic shock. J Clin Med. (2023) 12:5275. doi: 10.3390/jcm12165275
13. Liu X, Liu P. Elevated AST/ALT ratio is associated with all-cause mortality in patients with stable coronary artery disease: a secondary analysis based on a retrospective cohort study. Sci Rep. (2022) 12:9231. doi: 10.1038/s41598-022-13355-2
14. Liu H, Zha X, Ding C, Hu L, Li M, Yu Y, et al. AST/ALT ratio and peripheral artery disease in a chinese hypertensive population: A cross-sectional study. Angiology. (2021) 72:916–22. doi: 10.1177/00033197211004410
15. Zhou J, He Z, Ma S, Liu R. AST/ALT ratio as a significant predictor of the incidence risk of prostate cancer. Cancer Med. (2020) 9:5672–7. doi: 10.1002/cam4.3086
16. An R, Ma S, Zhang N, Lin H, Xiang T, Chen M, et al. AST-to-ALT ratio in the first trimester and the risk of gestational diabetes mellitus. Front Endocrinol. (2022) 13:1017448. doi: 10.3389/fendo.2022.1017448
17. Çelik N, Ünsal G, Taştanoğlu H. Predictive markers of metabolically healthy obesity in children and adolescents: can AST/ALT ratio serve as a simple and reliable diagnostic indicator? Eur J Pediatr. (2023) 183:243–51. doi: 10.21203/rs.3.rs-3258211/v1
18. He Y, Ding F, Yin M, Zhang H, Hou L, Cui T, et al. High serum AST/ALT ratio and low serum INS*PA product are risk factors and can diagnose sarcopenia in middle-aged and older adults. Front Endocrinol. (2022) 13:843610. doi: 10.3389/fendo.2022.843610
19. Jiang T, Li Y, Li L, Liang T, Du M, Yang L, et al. Bifidobacterium longum 070103 fermented milk improve glucose and lipid metabolism disorders by regulating gut microbiota in mice. Nutrients. (2022) 14:4050. doi: 10.3390/nu14194050
20. Cao C, Zhang X, Yuan J, Zan Y, Zhang X, Xue C, et al. Nonlinear relationship between aspartate aminotransferase to alanine aminotransferase ratio and the risk of prediabetes: A retrospective study based on chinese adults. Front Endocrinol. (2022) 13:1041616. doi: 10.3389/fendo.2022.1041616
21. Lin MS, Lin HS, Chang ML, Tsai M-H, Hsieh Y-Y, Lin Y-S, et al. Alanine aminotransferase to aspartate aminotransferase ratio and hepatitis B virus on metabolic syndrome: a community-based study. Front Endocrinol. (2022) 13:922312. doi: 10.3389/fendo.2022.922312
22. Muqit MMK, Kourgialis N, Jackson-Degraffenried M, Talukder Z, Khetran ER, Rahman A, et al. Trends in diabetic retinopathy, visual acuity, and treatment outcomes for patients living with diabetes in a fundus photograph-based diabetic retinopathy screening program in Bangladesh. JAMA network Open. (2019) 2:e1916285. doi: 10.1001/jamanetworkopen.2019.16285
23. Preston FG, Meng Y, Burgess J, Ferdousi M, Azmi S, Petropoulos IN, et al. Artificial intelligence utilising corneal confocal microscopy for the diagnosis of peripheral neuropathy in diabetes mellitus and prediabetes. Diabetologia. (2022) 65:457–66. doi: 10.1007/s00125-021-05617-x
24. Åberg F, Danford CJ, Thiele M, Talbäck M, Rasmussen DN, Jiang ZG, et al. A dynamic aspartate-to-alanine aminotransferase ratio provides valid predictions of incident severe liver disease. Hepatol Commun. (2021) 5:1021–35. doi: 10.1002/hep4.1700
25. Wang L, Xu Y, Zhang S, Bibi A, Xu Y, Li T. The AST/ALT ratio (De ritis ratio) represents an unfavorable prognosis in patients in early-stage SFTS: an observational cohort study. Front Cell infection Microbiol. (2022) 12:725642. doi: 10.3389/fcimb.2022.725642
26. Wilkinson CP, Ferris FL 3rd, Klein RE, Lee PP, Agardh CD, Davis M, et al. Proposed international clinical diabetic retinopathy and diabetic macular edema disease severity scales. Ophthalmology. (2003) 110:1677–82. doi: 10.1016/S0161-6420(03)00475-5
27. Wu Z, Yu S, Kang X, Liu Y, Xu Z, Li Z, et al. Association of visceral adiposity index with incident nephropathy and retinopathy: a cohort study in the diabetic population. Cardiovasc Diabetol. (2022) 21:32. doi: 10.1186/s12933-022-01464-1
28. WHO Expert Consultation. Appropriate body-mass index for Asian populations and its implications for policy and intervention strategies. Lancet (London England). (2004) 363:157–63. doi: 10.1016/S0140-6736(03)15268-3
29. Yang Q, Xu H, Zhang H, Li Y, Chen S, He D, et al. Serum triglyceride glucose index is a valuable predictor for visceral obesity in patients with type 2 diabetes: a cross-sectional study. Cardiovasc Diabetol. (2023) 22:98. doi: 10.1186/s12933-023-01834-3
30. Leivas G, Maraschin CK, Blume CA, Telo GH, Trindade MRM, Trindade EN, et al. Accuracy of ultrasound diagnosis of nonalcoholic fatty liver disease in patients with classes II and III obesity: A pathological image study. Obes Res Clin Pract. (2021) 15:461–5. doi: 10.1016/j.orcp.2021.09.002
31. Whelton PK, Flack JM, Jennings G, Schutte A, Wang J, Touyz RM, et al. Editors' Commentary on the 2023 ESH management of arterial hypertension guidelines. Hypertension (Dallas Tex 1979). (2023) 80:1795–9. doi: 10.1161/HYPERTENSIONAHA.123.21592
32. Miller WG. Perspective on new equations for estimating glomerular filtration rate. Clin Chem. (2021) 67:820–2. doi: 10.1093/clinchem/hvab029
33. Stevens PE, Levin A. Evaluation and management of chronic kidney disease: synopsis of the kidney disease: improving global outcomes 2012 clinical practice guideline. Ann Internal Med. (2013) 158:825–30. doi: 10.7326/0003-4819-158-11-201306040-00007
34. Martin CL, Albers JW, Pop-Busui R. Neuropathy and related findings in the diabetes control and complications trial/epidemiology of diabetes interventions and complications study. Diabetes Care. (2014) 37:31–8. doi: 10.2337/dc13-2114
35. Xu J, Shi X, Pan Y. The association of aspartate aminotransferase/alanine aminotransferase ratio with diabetic nephropathy in patients with type 2 diabetes. Diabetes Metab syndrome Obes Targets Ther. (2021) 14:3831–7. doi: 10.2147/DMSO.S330741
36. Simental-Mendía LE, Rodríguez-Morán M, Gómez-Díaz R, Wacher NH, Rodríguez-Hernández H, Guerrero-Romero F. Insulin resistance is associated with elevated transaminases and low aspartate aminotransferase/alanine aminotransferase ratio in young adults with normal weight. Eur J Gastroenterol Hepatol. (2017) 29:435–40. doi: 10.1097/MEG.0000000000000811
37. Yan P, Wu Y, Dan X, Wu X, Tang Q, Chen X, et al. Aspartate aminotransferase/alanine aminotransferase ratio was associated with type 2 diabetic peripheral neuropathy in a Chinese population: A cross-sectional study. Front Endocrinol. (2023) 14:1064125. doi: 10.3389/fendo.2023.1064125
Keywords: aspartate aminotransferases, alanine transaminase, diabetic retinopathy, diabetes mellitus, type 2, correlation
Citation: Li X, Hao W, Lin S and Yang N (2024) Association between AST/ALT ratio and diabetic retinopathy risk in type 2 diabetes: a cross-sectional investigation. Front. Endocrinol. 15:1361707. doi: 10.3389/fendo.2024.1361707
Received: 26 December 2023; Accepted: 15 March 2024;
Published: 03 April 2024.
Edited by:
Mohd Imtiaz Nawaz, King Saud University, Saudi ArabiaReviewed by:
Rizaldy Taslim Pinzon, Duta Wacana Christian University, IndonesiaXinrong Zhang, Stanford University, United States
Copyright © 2024 Li, Hao, Lin and Yang. This is an open-access article distributed under the terms of the Creative Commons Attribution License (CC BY). The use, distribution or reproduction in other forums is permitted, provided the original author(s) and the copyright owner(s) are credited and that the original publication in this journal is cited, in accordance with accepted academic practice. No use, distribution or reproduction is permitted which does not comply with these terms.
*Correspondence: Nailong Yang, bmFpbG9uZ3lAMTYzLmNvbQ==