
94% of researchers rate our articles as excellent or good
Learn more about the work of our research integrity team to safeguard the quality of each article we publish.
Find out more
ORIGINAL RESEARCH article
Front. Endocrinol. , 30 May 2024
Sec. Renal Endocrinology
Volume 15 - 2024 | https://doi.org/10.3389/fendo.2024.1357294
 Yongze Zhang1,2,3,4,5,6†
 Biao Zheng1,2,3,4,5,6†
 Yimei Li1,2,3,4,5,6Ximei Shen1,2,3,4,5,6Lingning Huang1,2,3,4,5,6Fengying Zhao1,2,3,4,5,6
 Sunjie Yan1,2,3,4,5,6*
Objective: To investigate the correlation between vibration sensory threshold (VPT) and renal function, including glomerulus and renal tubule, in patients with type 2 diabetes mellitus (T2DM).
Methods: A total of 1274 patients with T2DM who were enrolled in the Department of Endocrinology of the First Affiliated Hospital of Fujian Medical University between January 2017 and June 2020 were included. Patients were grouped according to VPT levels and divided into three groups, including the normal VPT group (VPT<15V), the mild-moderate elevated VPT group (VPT15~25V), and the severely elevated VPT group (VPT≥25 V). Linear correlation analysis was used to analyze the correlation between VPT and renal functions, including glomerulus markers urine microalbumin (MA) and urinary immunoglobulin G (U-IgG), and renal tubule marker α1-microglobulin (α1-MG). Chronic kidney disease (CKD) was defined according to Kidney Disease Improving Global Outcomes (KDIGO) criteria. The binary logistic regression of the relation between VPT and CKD, eGFR<60 ml/min, and UACR >30 mg/g were expressed.
Results: In the mild-moderate and severely elevated VPT group, injury biomarkers of glomerulus (MA and U-IgG), renal tubule (α1-MG), and the incidence of CKD, eGFR<60 ml/min, and UACR > 30 mg/g were gradually increased compared with the normal VPT group. Furthermore, patients with diabetes and severely elevated VPT had significantly higher levels of MA (β=197.54, p=0.042) and α1-MG (β=11.69, p=0.023) compared to those with normal VPT. Also, patients with mild-moderate elevated VPT demonstrate significantly higher levels of MA (β=229.02, p=0.005). Patients in mild-moderate elevated VPT group (OR=1.463, 95% CI 1.005–2.127; OR=1.816, 95% CI 1.212–2.721) and severely elevated VPT group (OR=1.704, 95% CI 1.113–2.611; OR=2.027, 95% CI 1.248–3.294) are at a higher incidence of CKD and elevated levels of UACR>30mg/g compared to those in the VPT normal group. Moreover, the incidence of positive Upro was notably higher in the severely elevated VPT group (OR=1.738, 95% CI 1.182–2.556). However, this phenomenon was not observed in the incidence of eGFR <60 ml/min.
Conclusion: A higher VPT is positively associated with the incidence of CKD in patients with T2DM, particularly with elevated UACR. VPT may serve as a marker for glomerulus and renal tubule injury.
Despite available therapies, chronic kidney disease (CKD) is the leading cause of mortality in diabetic patients, characterized by the progressive decrease in GFR, the incidence of albuminuria, and ultimately irreversible end-stage renal disease (ESRD) (1, 2). However, the optimal timing of treatment may be missed due to the lack of understanding of the potential underlying effect of renal glomerulus and renal tubule on renal function in clinical practice (3). Hence, a systematic assessment of diabetes nephropathy in clinical practice is of utmost importance not only to detect early disease but also to monitor its rate of progression to more advanced disease (4).
Vibratory sensory threshold (VPT) is a vital measure in quantitative sensory examination, primarily indicating lesions in myelinated Aα and Aβ sensory nerve fibers (5). Previous studies have demonstrated that VPT can quickly and accurately identify diabetic peripheral neuropathy (DPN) in clinical settings or primary care, reflecting the impairment of large nerve fibers (6). Due to its non-invasive nature, ease of use, and high patient compliance, VPT examination is increasingly employed in clinical studies of diabetic complications. Recent clinical research has highlighted the clinical significance of VPT in the diagnosis of diabetic peripheral neuropathy (DPN) and diabetic foot ulcers. Additionally, it can serve as an index for assessing cardiac autonomic neuropathy, coronary artery disease, cerebrovascular disease, and hepatic fibrosis in non-alcoholic fatty liver disease among diabetic patients (7, 8). These findings demonstrate the multifaceted clinical applications of VPT. Additionally, the urinary microalbumin (MA) and immunoglobulin G (U-IgG) excretion rates have been widely accepted as markers of glomerular lesions, while α1-microglobulin (α1-MG) possesses the characteristics of a marker for tubular damage (9, 10).
To date, limited research has examined the association between VPT levels and renal dysfunction in patients with T2DM. Additionally, no studies have comprehensively assessed kidney function by evaluating the glomerulus and tubule system (11). The present study investigated the relationship between VPT levels and renal dysfunction, as assessed by glomerulus and tubule in T2DM patients. We anticipate that this research could contribute to identifying novel and promising markers for CKD in individuals with T2DM.
This retrospective study enrolled 1274 inpatients with type 2 diabetes (688 male and 586 female subjects) from the First Affiliated Hospital of Fujian Medical University (Fuzhou, China). All participants who met the American Diabetes Association (ADA) diagnostic criteria for type 2 diabetes were included in this study (12, 13). Exclusion criteria encompassed individuals with diabetes other than type 2 diabetes, such as type 1 diabetes or gestational diabetes mellitus. Additionally, patients with short-term diabetes complications, including diabetic ketoacidosis and hyperosmolarity, were excluded. Those with severe cardiac or liver failure, malnutrition, or sarcopenia were also excluded (14). Subsequently, an age- and gender-matched non-diabetic control group was identified in the hospital, comprising 108 subjects. These patients were selected from our medical record data system and were sourced from non-diabetic patients who had previously visited our hospital. The group of ‘non-diabetes comparators (non-DM)’ was used for comparison, as depicted in Figure 1.
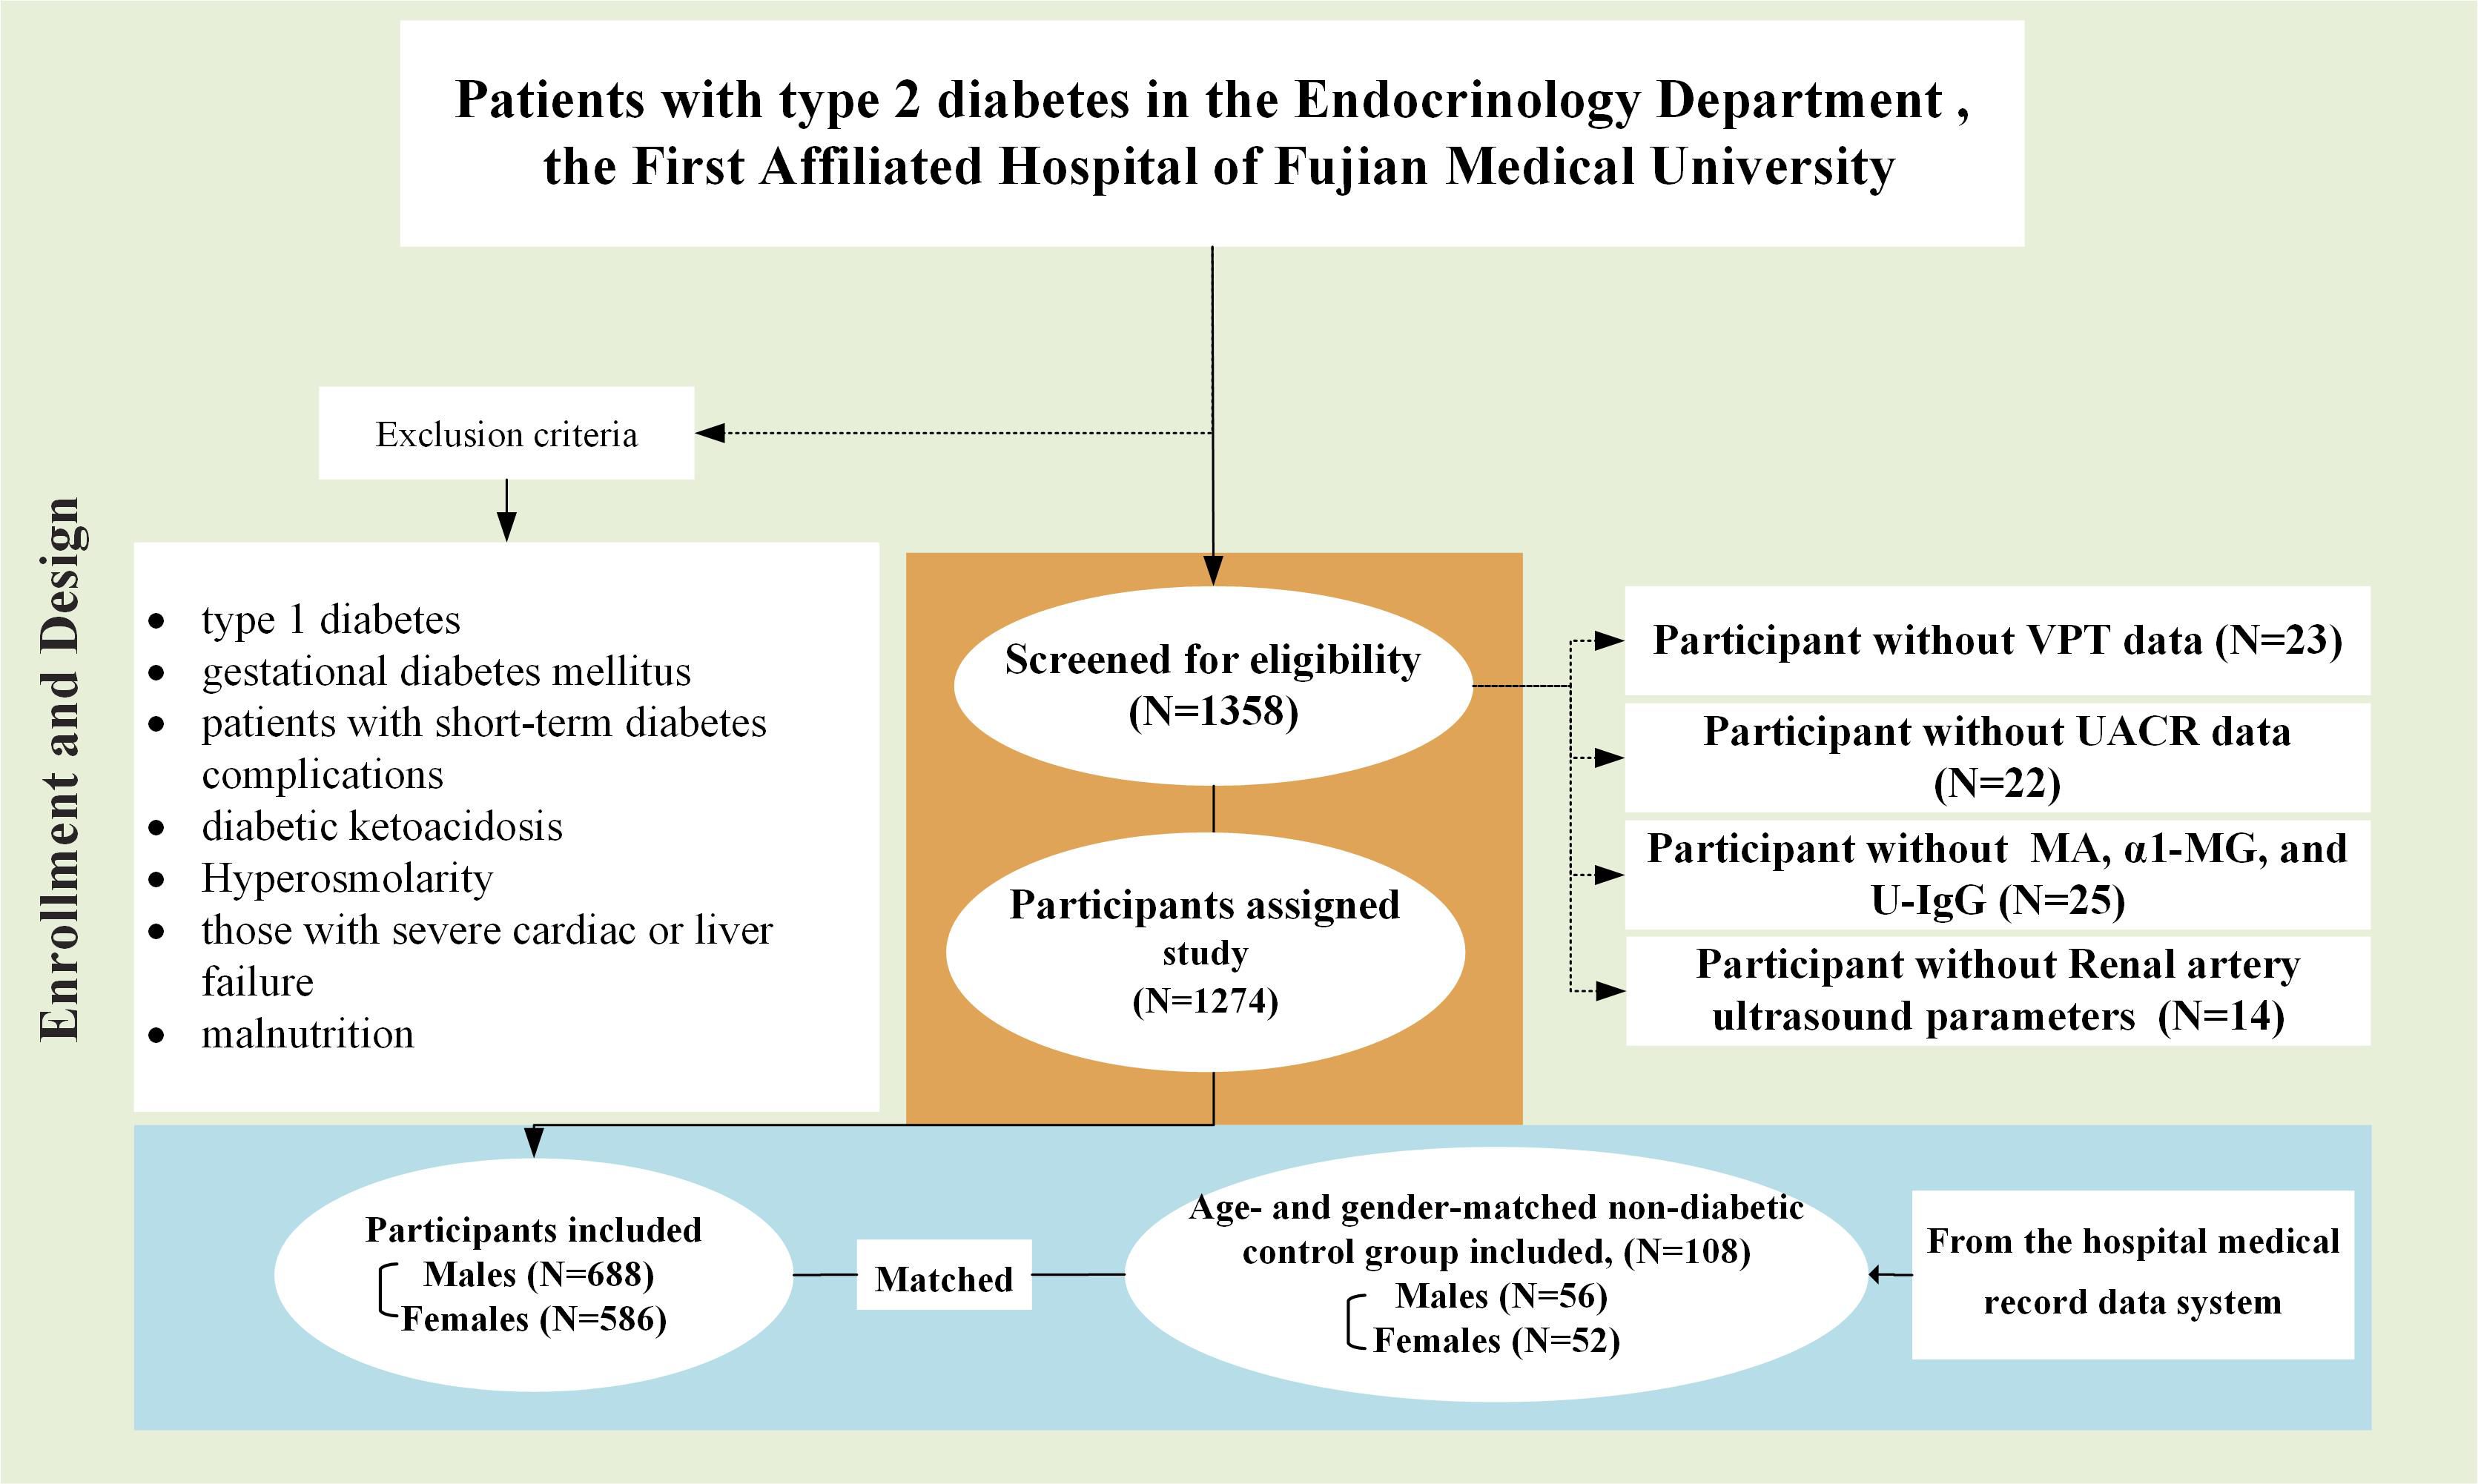
Figure 1 Study design and patient disposition diagram.
Demographic characteristics and medical history were meticulously documented, which included age, sex, duration of diabetes, smoking history, and alcohol intake. Participants’ weight and height were also measured, allowing for the calculation of body mass index (BMI) by dividing weight in kilograms by height in square meters. Systolic blood pressure (SBP) and diastolic blood pressure (DBP) were measured using an automated device after a 15-minute rest period to ensure accuracy.
After a 10-hour fasting period, plasma samples were collected for biochemical indicator analysis. Various parameters were measured, including total cholesterol (TCH), triglycerides (TG), high-density lipoprotein cholesterol (HDL-C), low-density lipoprotein cholesterol (LDL-C), urea nitrogen (BUN), uric acid (UA), and creatinine (Cr). A standard 75-gram oral glucose tolerance test (OGTT) was also performed. The concentration of glycated hemoglobin (HbA1c, measured as a percentage) was determined using high-performance liquid chromatography (VARIANTTM II, BIO-RAD, CA, USA).
Creatinine (Cr) levels were determined using the Benedict-Behre chemical reaction, and the estimated glomerular filtration rate (eGFR) was calculated using the Modification of Diet in Renal Disease (MDRD) formula: eGFR = 186 ×(Cr)-1.154 × (age) - 0.203× (0.742 if female). The urinary albumin/creatinine ratio (UACR, MA/Cr) was calculated as the ratio of urinary microalbumin concentration (mg/L) to creatinine concentration (g/L). Early morning urine samples were collected to measure urinary protein (Upro) and specific proteins, including urinary microalbumin (MA), α1-microglobulin (α1-MG), and urinary immunoglobulin G (U-IgG). In this study, the normal ranges for urinary-specific proteins were defined as follows: MA ranged from 0 to 19 mg/L, α1-MG ranged from 0 to 12.5 mg/L, and U-IgG ranged from 0 to 8 mg/L. Calculating the urinary-specific protein to creatinine ratio serves as a modified estimation of the excretion rate and can help mitigate differences between men and women to some extent. Therefore, the UACR, i.e., microalbumin/creatinine ratio (MA/Cr), α1-microglobulin/creatinine ratio (α1-MG/Cr), and immunoglobulin G/creatinine ratio (U-IgG/Cr) were also calculated (15). The VPT examinations were conducted by professional technicians using the American Bio-Thesiometer sensory quantification examiner, following the guidelines of the International Working Group on the Diabetic Foot (16, 17). The patients were examined in a reclined position with their eyes closed in a quiet, relaxed environment. The amplitude of the vibration knob gradually increases until it can be perceived by the person being examined, and the voltage value at this point is read three times continuously, and the average of the three times is taken as the VPT result on that side. According to the level of VPT value, 0~15V indicated normal condition, ≥15~25V mild-moderate lesion, and ≥25V severe lesion; 15V and 25V were used as the dividing point: 0~15V for normal VPT group, ≥15~25V for mild-moderate elevated VPT group, ≥25V for severely elevated VPT group (18). This study used the side with high results for relevant data analysis.
Criteria for T2DM were defined following the guideline for ADA diagnostic criteria as the presence of symptoms of diabetes (polyphagia, polyphagia, polyuria, weight loss) plus random venous plasma glucose of 11.1 mmol/L, or fasting glucose of 7.0 mmol/L, or 2 h glucose load of 11.1 mmol/L, or glycated hemoglobin of 6.5% or higher (12).
Hypertension was defined as systolic blood pressure (SBP) at rest > 140 mmHg or diastolic blood pressure (DBP) at rest > 90 mmHg or use of antihypertensive drug (19).
According to Kidney Disease: Improving Global Outcomes (KDIGO) criteria (2012), CKD was defined as structural or functional abnormalities of the kidney for > 3 months, including 1) pathologic abnormalities or markers of damage (albuminuria, abnormal urine sediment, tubular-related lesions, histology and imaging abnormality) or history of renal transplant or dialysis with or without a decrease in GFR; 2) an unexplained decrease in GFR (<60 ml/min) for > 3 months (20).
Statistical analyses were performed using the R software, version 4.3.0. Quantitative data were presented as means (standard deviations) or medians (interquartile ranges), and categorical data as proportions. The chi-square test was used for categorical variables, and the ANOVA and nonparametric tests were used for continuous variables. Correlations between glomerular markers (MA and U-IgG), tubular markers (α1-MG), and VPT were established by linear correlation analysis, and binary logistic regression was used to analyze the correlation between different levels of VPT and CKD, eGFR<60 ml/min, and UACR >30 mg/g. Restricted cubic spline was used to flexibly model and visualize the relationship between VPT and CKD, eGFR<60 ml/min, and UACR >30 mg/g, and an average VPT level of 15V served as a reference without adjustment. P value < 0.05 represented statistical significance.
As shown in Table 1, the abnormal VPT group exhibited a higher UACR (>30mg/g) or a higher detection rate of CKD, irrespective of the presence of DM. Statistically significant differences were observed among the different VPT groups in terms of glomerular markers (MA and U-IgG), tubular marker (α1-MG), and the incidence of chronic kidney disease (CKD), eGFR <60 ml/min, and UACR >30 mg/g, as shown in Table 2. Additionally, there were statistically significant differences among the three groups in terms of age, duration of T2DM, family history of diabetes, alcohol consumption, SBP, DBP, HT, TG, BUN, UA, Upro, and medication history, including α-glycosidase inhibitors, TZDs, insulin therapy, β-blockers, calcium channel blockers, ACEI, ARB. However, no significant differences were observed among the three groups with respect to gender, BMI, LDL-C, HDL-C, TCH, FPG, 2hPG, HbA1c, PSV, and medication history, including metformin, sulfonylurea, and glinides.
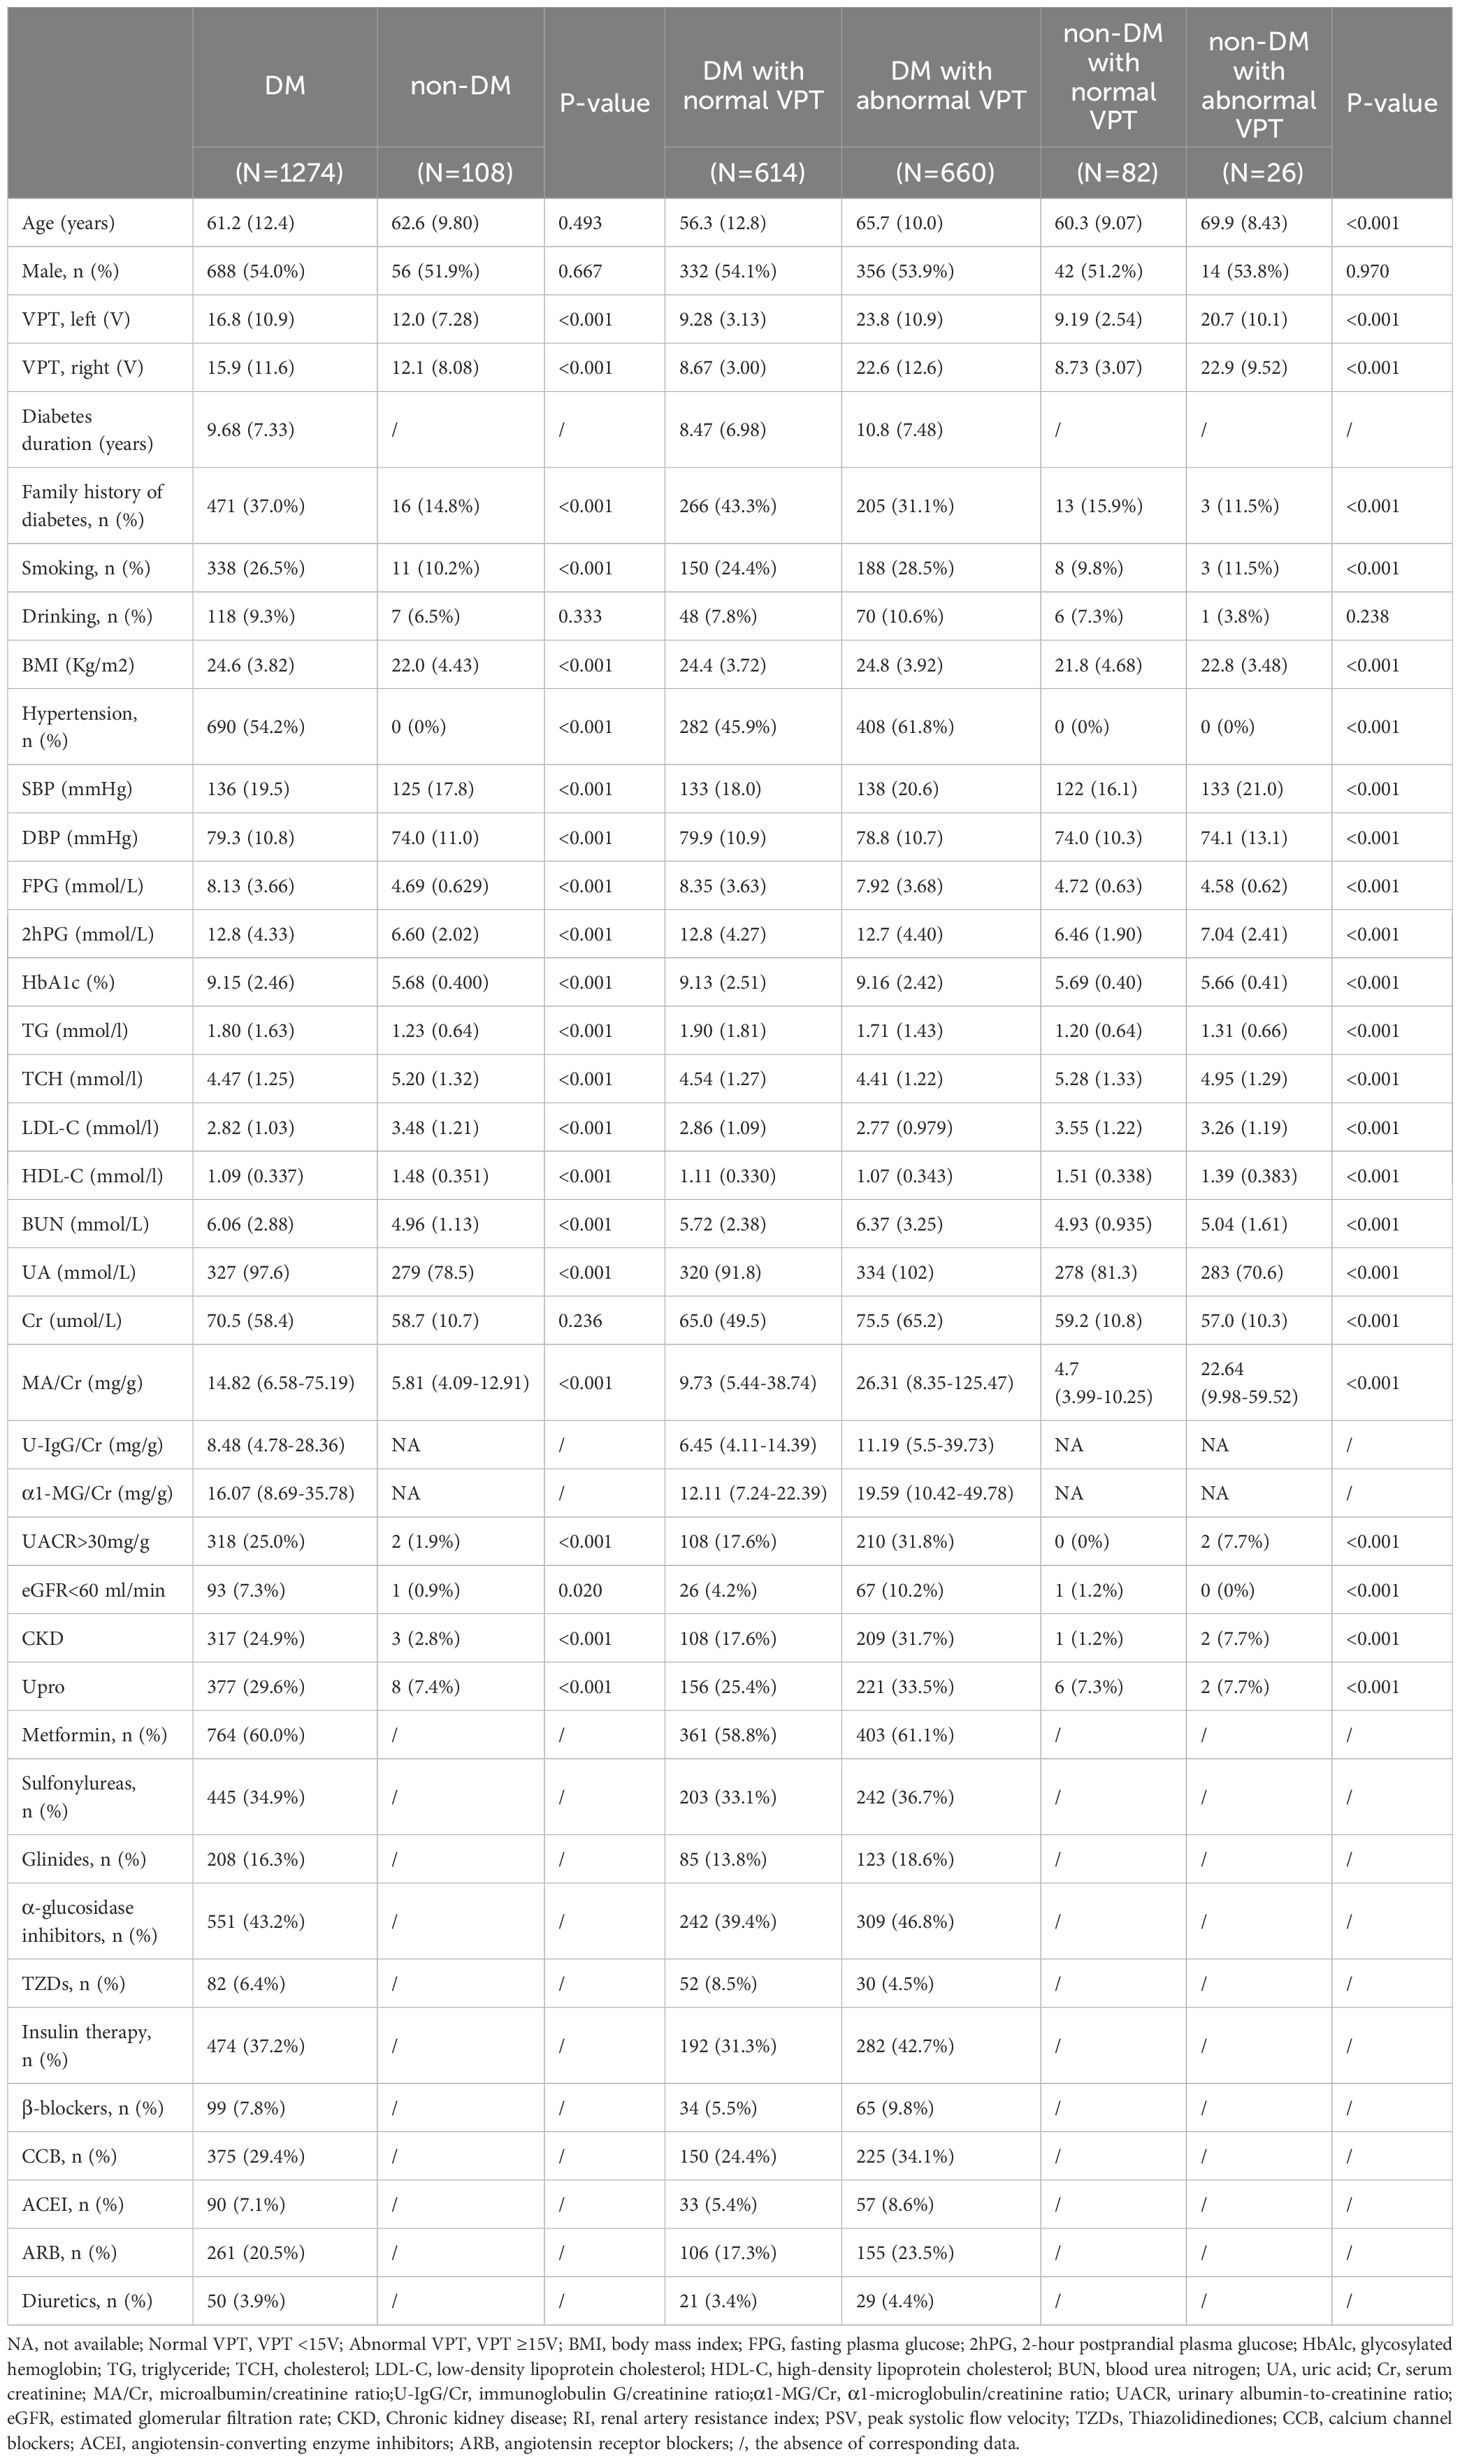
Table 1 Baseline characteristics of patients with and without type 2 diabetes mellitus.
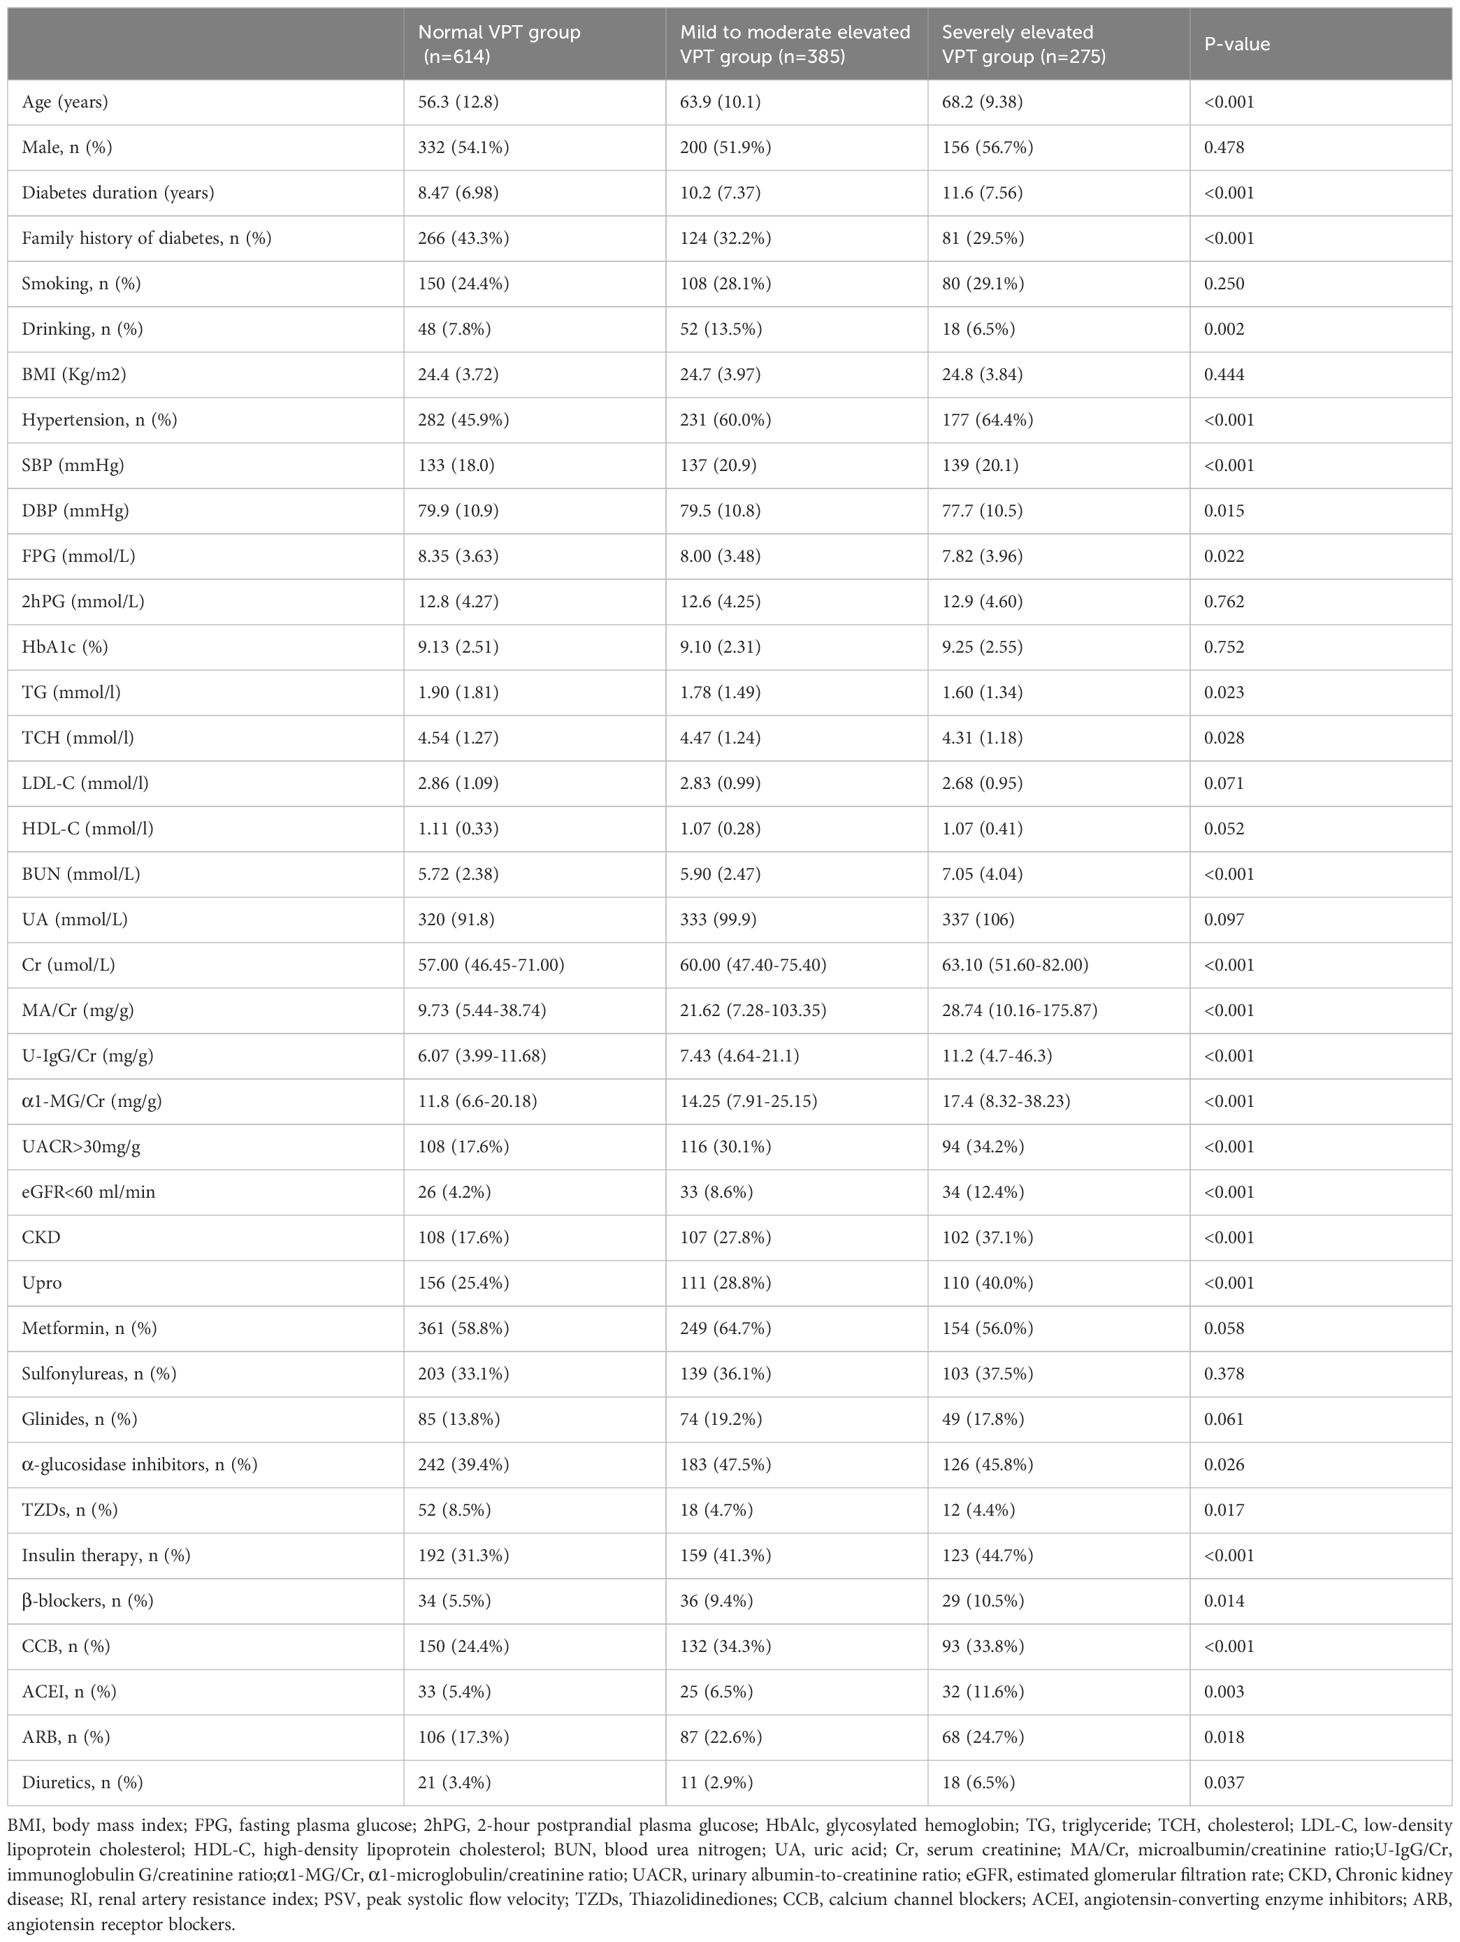
Table 2 Baseline characteristics of 1274 patients with type 2 diabetes mellitus stratified by VPT.
As shown in Table 2, the incidence of CKD (17.6% vs. 27.8% vs. 37.1%, P=0.000), the proportion of UACR > 30 mg/g (27.7% vs. 43.0% vs. 49.0%, P<0.001), the proportion of eGFR < 60 ml/min (4.6% vs. 9.0% vs. 13.7%, P<0.001), and the proportion of positive Upro (27.3% vs 30.4% vs 45.1%, P<0.001) among the three groups were significantly different. As shown in Figure 2, we used restricted cubic splines to flexibly model and visualize the relationship between VPT and CKD, eGFR <60 ml/min, UACR >30 mg/g, and positive Upro. The detection rate of CKD, eGFR <60 ml/min, UACR >30 mg/g was relatively flat until around 15V of VPT, after which it started to rapidly decrease forward and increase afterward (P for nonlinearity <0.05). However, a nonlinear trend was not observed in positive Upro outcomes, suggesting that even when the VPT was < 15V, there could still be differences in the risk of developing CKD, eGFR <60 ml/min, and UACR >30 mg/g.
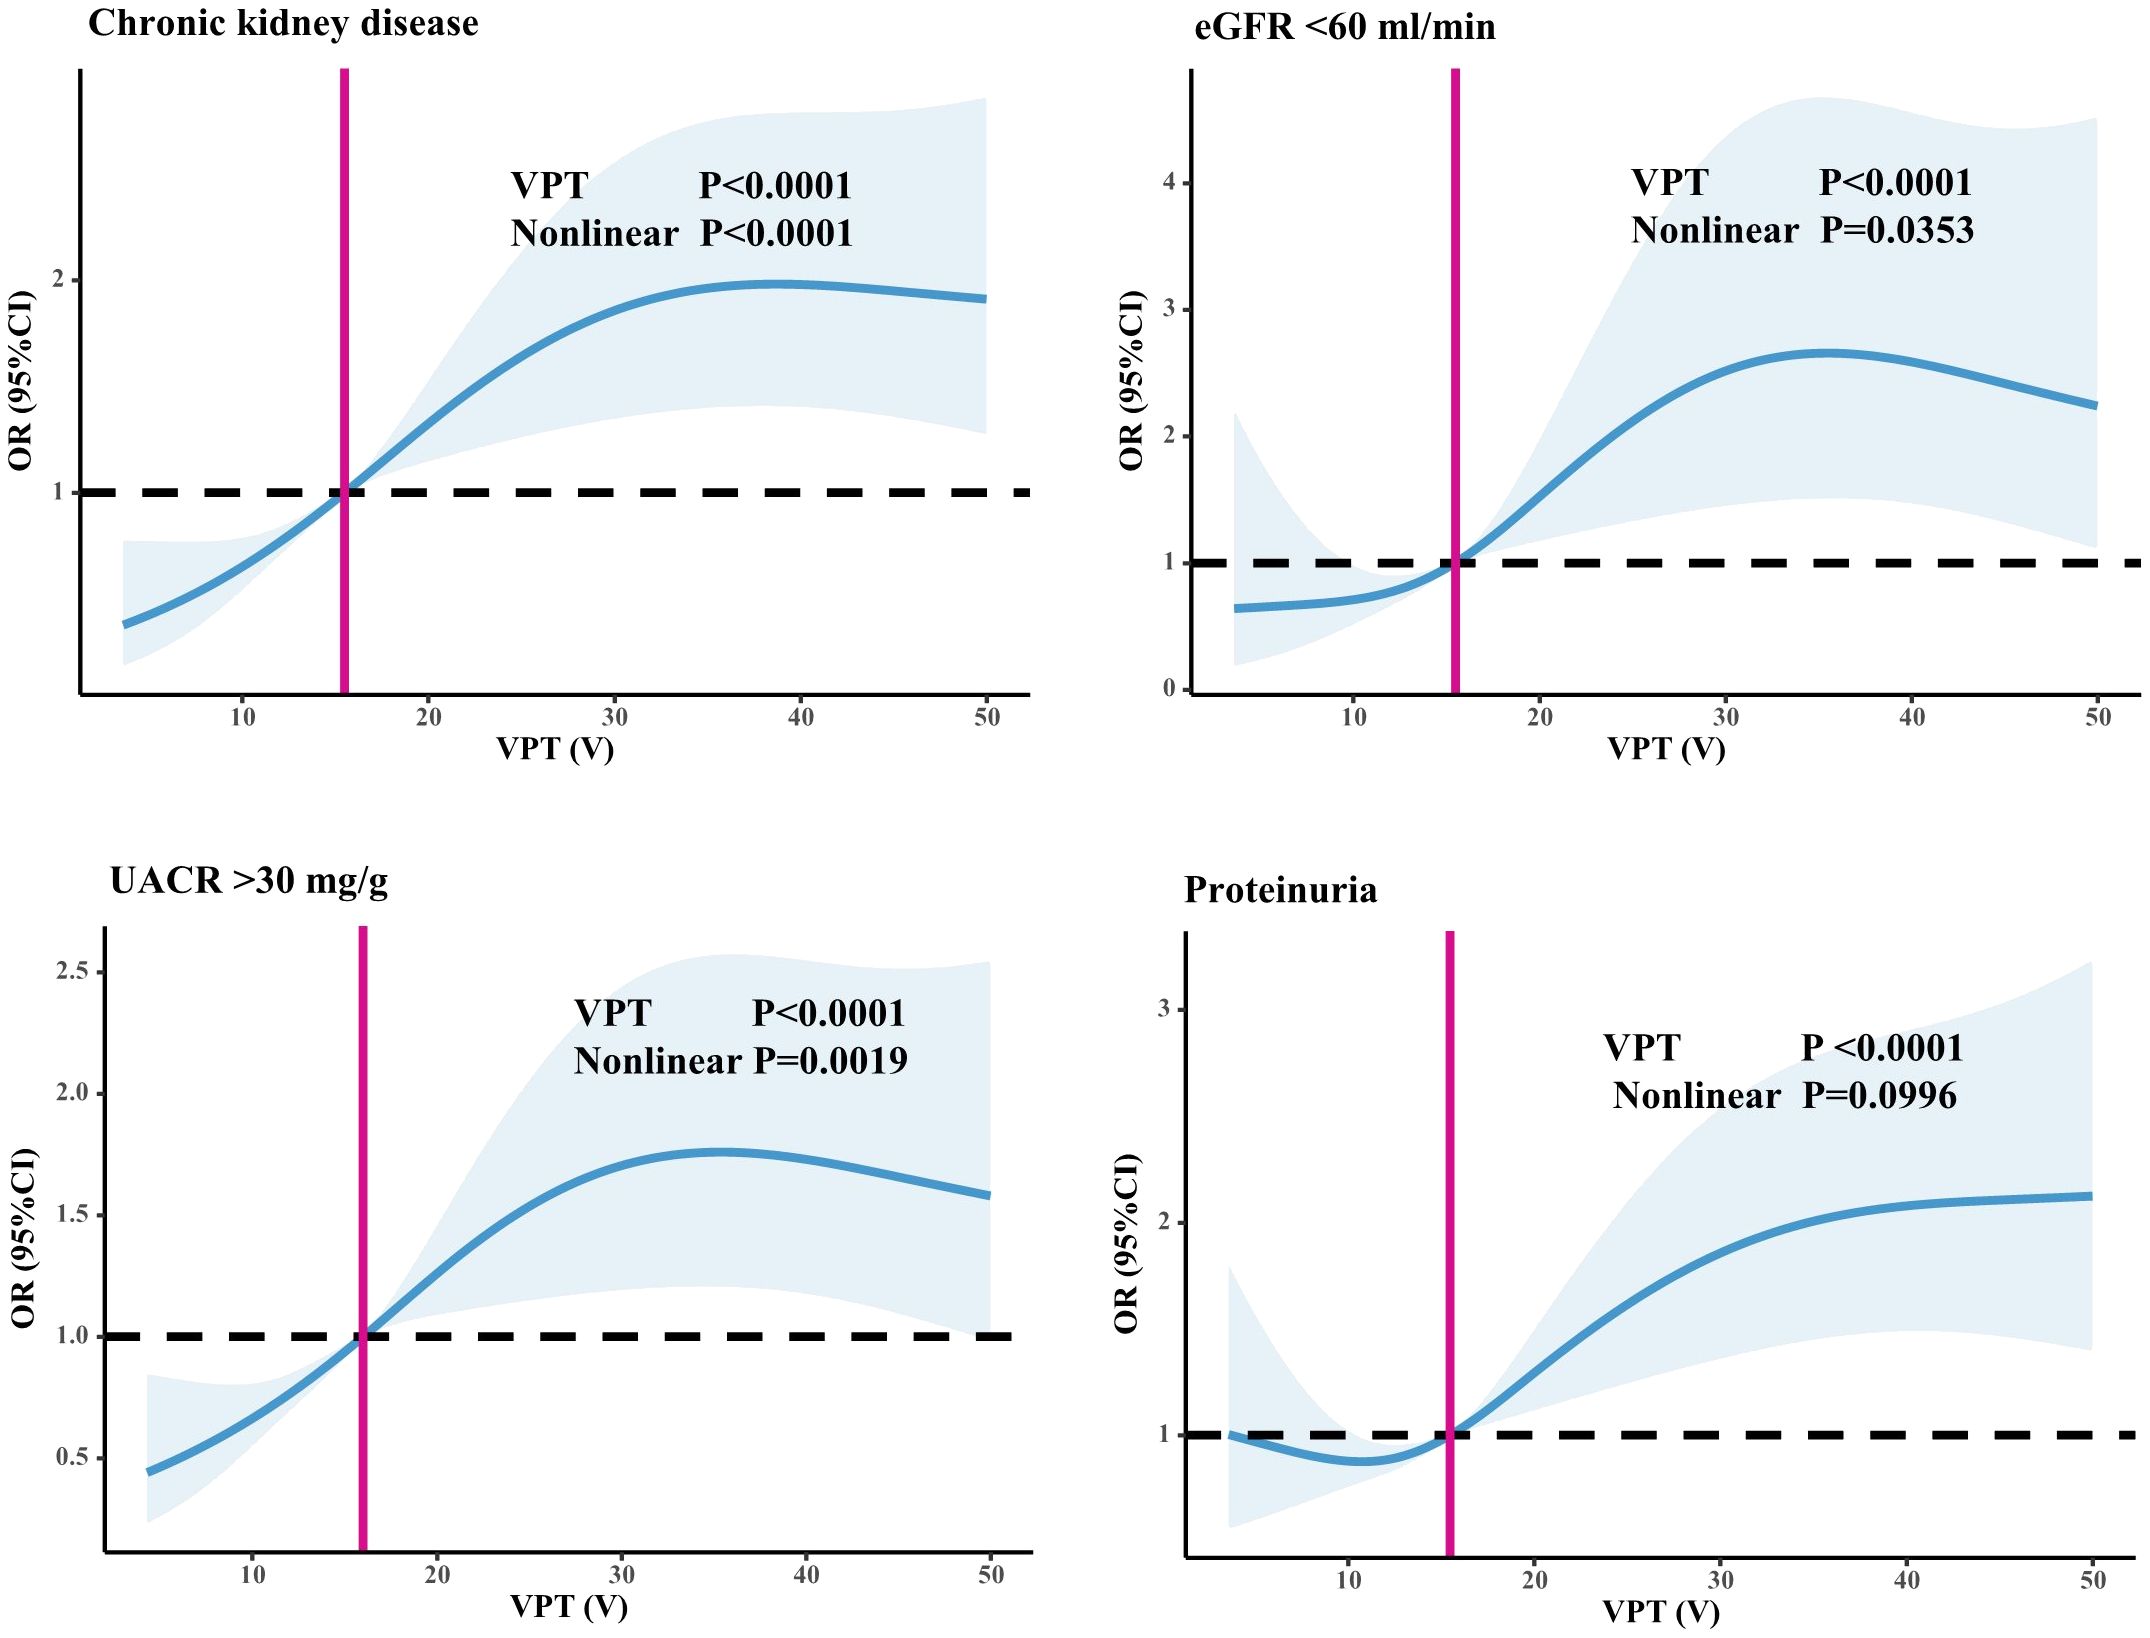
Figure 2 Relationship between VPT and CKD, eGFR <60 ml/min, and UACR >30 mg/g. Restricted cubic splines to flexibly model and visualize the relationship between VPT and CKD, eGFR <60 ml/min, UACR >30 mg/g, and positive Upro. An average VPT level of 15V served as a reference.
To investigate further whether VPT is an independent factor associated with CKD in patients with T2DM, we conducted a multifactorial logistic regression analysis, as detailed in Table 3. This analysis was performed after adjusting for potential confounding factors, including age, duration of diabetes, family history of diabetes, SBP, DBP, HT, TG, FPG, BUN, UA, Cr, smoking history of alcohol consumption, and medication use history. As expected, the results showed that patients in the VPT mild-moderate elevated group (OR=1.463, 95% CI=1.005–2.127, P=0.047) and VPT severely elevated group (OR=1.704, 95% CI=1.113–2.611, P=0.014) were at a higher risk of CKD compared to those in the VPT normal group. Furthermore, after adjusting for the confounding factors, the risk of UACR >30 mg/g was elevated in both the VPT mild-moderate elevated group (OR=1.816, 95% CI=1.212–2.721, P=0.004) and the VPT severely elevated group (OR=2.027, 95% CI=1.248–3.294, P=0.004), when compared to the VPT normal group. However, no statistically significant differences were found in the incidence of eGFR <60 ml/min among the three VPT groups. Additionally, compared with the VPT normal group, the incidence of positive Upro was notably higher in the VPT severely elevated group (OR=1.738, 95% CI=1.182–2.556, P=0.005).
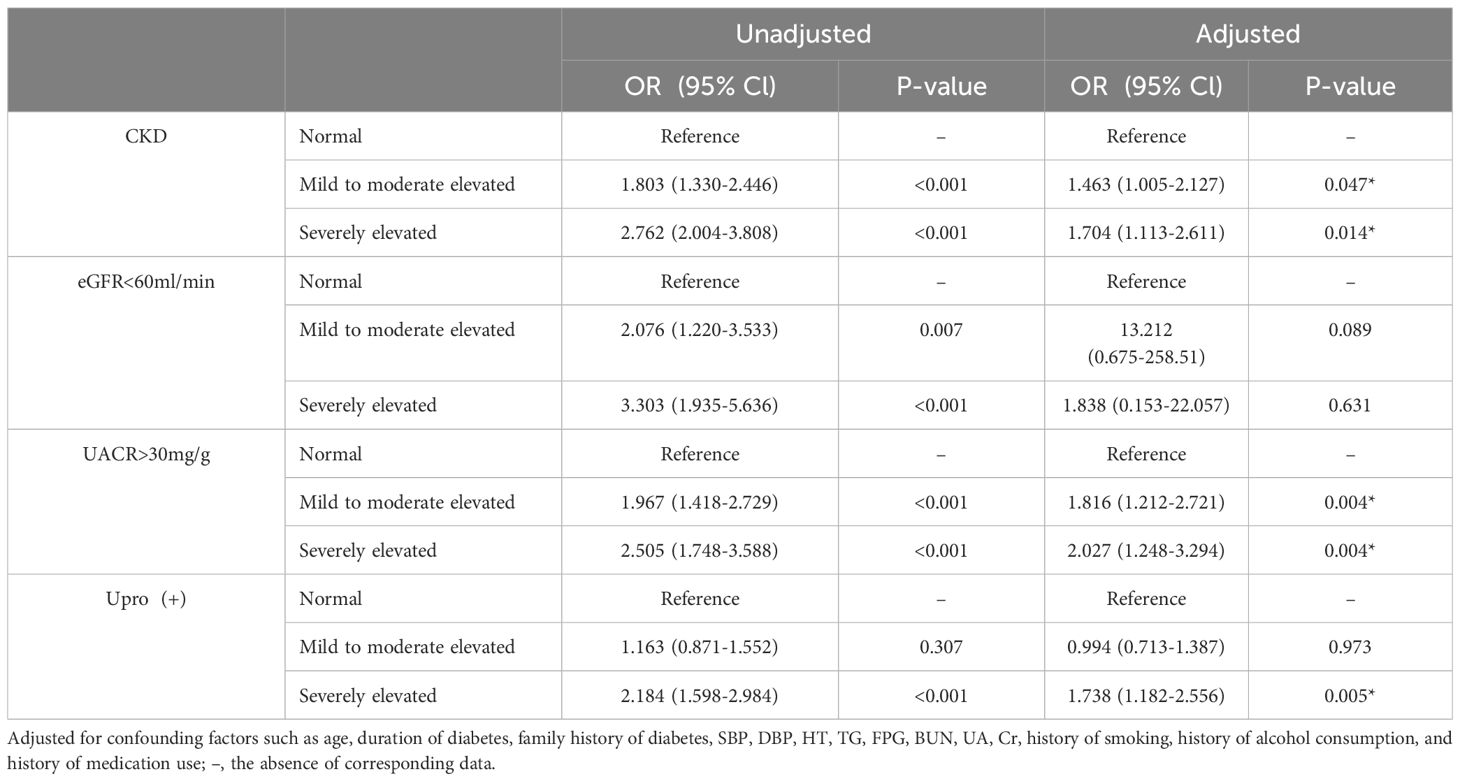
Table 3 Relationship between VPT and CKD, eGFR <60 ml/min, and UACR >30 mg/g.
Correlation analysis without adjustment showed VPT showed a positive correlation between MA/Cr (Rs=0.255, p<0.001), U-IgG/Cr (Rs=0.268, P<0.001), and α1-MG/Cr levels (Rs=0.272, p<0.001), as shown in Figure 3. For the VPT severely elevated group, linear correlation analysis revealed a strong positive correlation between VPT levels and MA/Cr (β=197.54, p=0.042), and α1-MG/Cr levels (β=11.69, p=0.023), after correcting for confounding factors. However, no association was found between VPT and U-IgG/Cr, as shown in Figure 4.

Figure 3 Correlation between VPT and MA/Cr, U-IgG/Cr, andα1-MG/Cr.
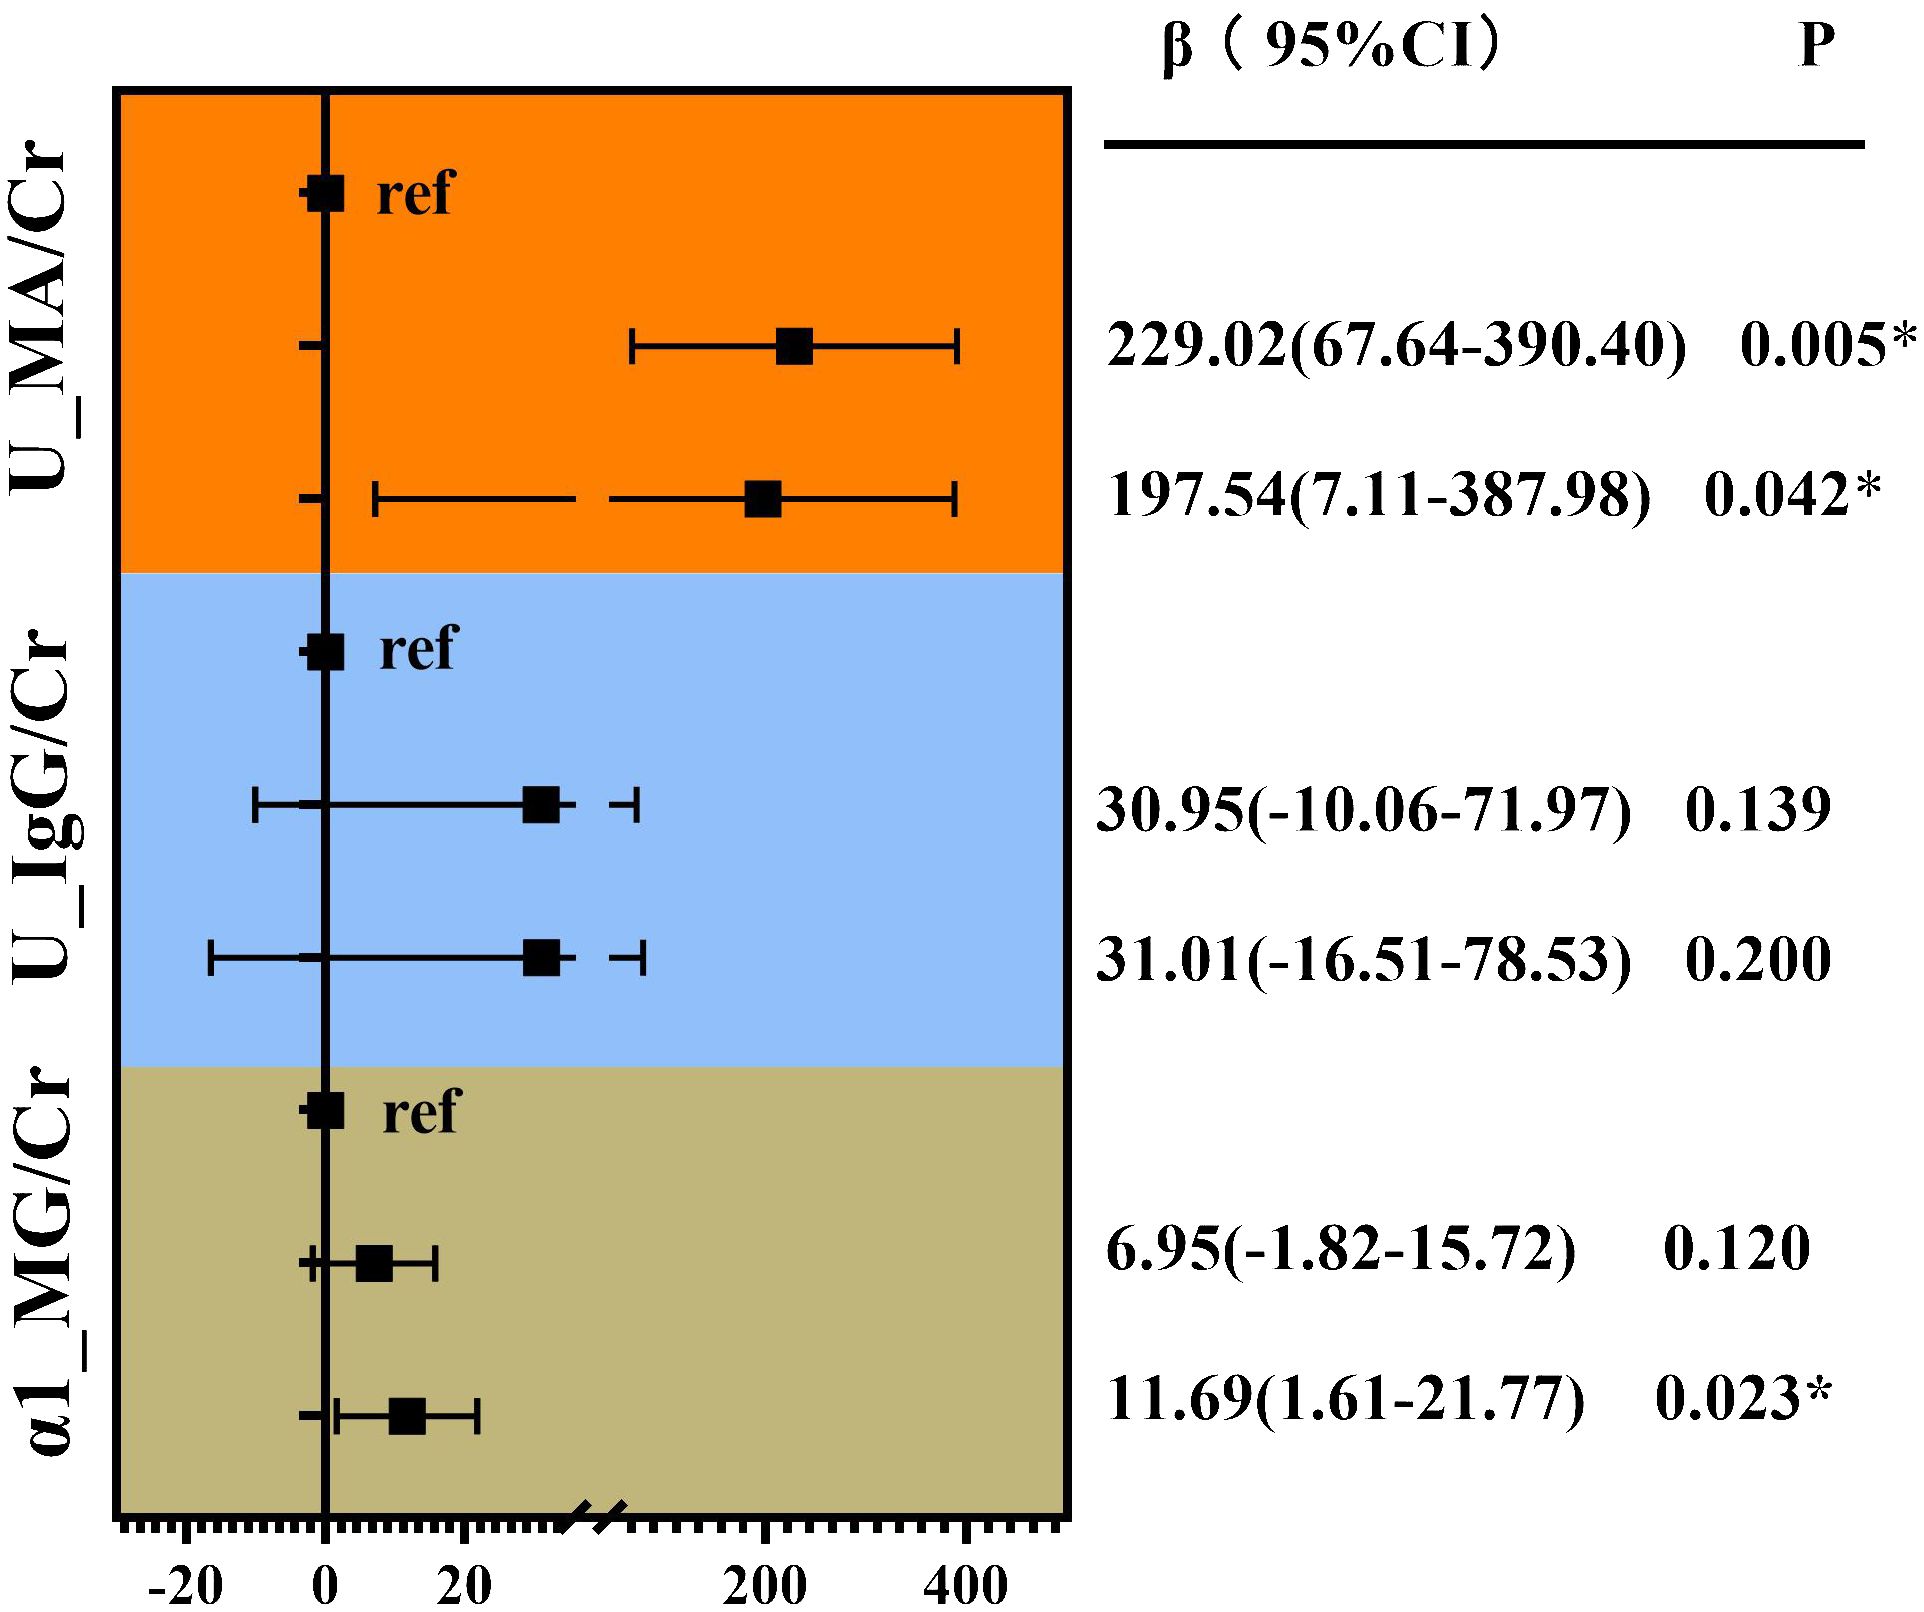
Figure 4 Linear correlation analysis of VPT with glomerular, tubular, and renal artery damage indicators. Adjusted for age, duration of diabetes, family history of diabetes, SBP, DBP, HT, TG, BUN, UA, Cr, history of alcohol consumption, and medication use history. *P<0.05.
The present study aimed to provide a comprehensive understanding of the relationship between VPT and renal function in Chinese patients with T2DM, including glomerular and tubular function indicators. Our findings revealed a positive correlation between VPT and the incidence of CKD, with a stronger association observed between VPT and UACR. Furthermore, VPT was identified as an independent factor associated with tubular and glomerular damage and functional decline.
Chronic complications associated with T2DM often coexist due to shared risk factors such as older age, smoking, longer duration of diabetes, and a history of hypertension and dyslipidemia. The pathogenesis of these complications involves genetic factors, glucose, lipid dysmetabolism, and oxidative stress (21, 22). Both diabetic nephropathy and neuropathy are influenced by hyperglycemia-induced processes such as the formation of advanced glycation end-products, regulation of fatty acids, lipid β-oxidation, mitochondrial dysfunction, and inflammation mediated by lipids (21). The assessment of VPT is a rapid and cost-effective method for evaluating large fiber nerve function, which can help identify individuals with T2DM who may be at risk of foot ulceration and diabetic neuropathy (6).
There is limited knowledge regarding the clinical significance of VPT and its association with the risk of CKD in patients with T2DM. Additionally, the evaluation of renal function solely based on glomerular filtration overlooks significant irreversible damage that can occur in the kidneys, including tubulointerstitial and renal arterial damage. Furthermore, the insidious onset of renal tubulopathy and arteriolopathy adds to the complexity of assessing renal function (23). Therefore, the present study was designed to investigate the correlation between VPT and various aspects of renal function, including glomerular and tubular, in patients with T2DM.
Our findings revealed that the incidence of CKD and UACR >30 mg/g were significantly higher in groups with abnormal VPT, particularly in the severely elevated VPT group. However, after comprehensive adjustment for confounding factors, no significant difference was observed in the incidence of eGFR <60 ml/min between the groups. These results confirm that higher VPT levels are associated with a higher incidence of CKD, with a stronger association observed with UACR levels. Notably, the correlation between eGFR and VPT was found to be weaker compared to the association with UACR, which could be due to several reasons. First, previous research has shown that UACR is a more sensitive indicator of renal function than eGFR in cases of diabetic peripheral neuropathy (24, 25). Second, in the progression of CKD, the increase in UACR and the decrease in eGFR may not necessarily occur in perfect parallel, as eGFR does not have to be reduced when macroalbuminuria is present (24). Lastly, renal hyperfiltration, which occurs in the early stages of CKD, is considered a marker of renal impairment and has been associated with increased urinary albumin excretion (26, 27).
Diabetic nephropathy, the most common form of CKD and ESRD, is typically characterized by diabetic glomerulosclerosis (28). However, in recent years, tubular injury has received increasing attention as a critical mechanism in the development of albuminuria at the early stages of CKD and its contribution to disease progression (29–31). While MA and U-IgG have traditionally served as markers of glomerular damage (32), α1-MG has emerged as an early and specific marker for tubular injury (33). This study demonstrated that VPT could be an independent factor associated with glomerular and tubular injury. The levels of MA and α1-MG displayed transient increases with elevated VPT, and this association persisted even after adjusting for factors such as age, diabetes control parameters, cardiovascular risk factors, and medication usage. Furthermore, the elevated VPT levels observed were associated with a higher prevalence of hypertension (HT) and increased SBP and DBP. This correlation between VPT and glomerular and tubular damage may be attributed to oxidative stress induced by blood pressure fluctuations (34). Oxidative stress can impair mitochondrial function, leading to accelerated β-cell function decline, glucose, and lipid dysmetabolism, ultimately resulting in renal glomerular and tubulointerstitial damage (35).
The present study has some limitations. First, as a single-center study, there may be potential admission rate bias, which could limit the generalizability of the findings. Secondly, due to the lack of a comparison with healthy subjects, the group of ‘non-diabetes comparators’ was used for comparison to address this issue. Since VPT, MA, U-IgG, and α1-MG are not routine tests for non-diabetic patients, this data was unavailable. Third, as a cross-sectional study, it is important to note that causal relationships cannot be inferred from the observed associations between VPT and renal function. To establish causality and better understand the longitudinal impact, further prospective studies are needed. The strengths of the present study are the following: the assessment of VPT was performed, and a comprehensive understanding of renal function, including indicators of glomerular and tubular were screened, providing objective evidence. Furthermore, the sample size was relatively large, further enhancing the credibility of the results.
Overall, our findings provided further confirmation that higher VPT is an independent factor associated with CKD incidence in patients with T2DM. The correlation between VPT and CKD was found to be particularly strong when considering the level of UACR. Our findings revealed a robust and comprehensive association between higher VPT, glomerular functional decline, and tubular damage. This study expands our understanding of the role of VPT in T2DM and its impact on renal health.
The original contributions presented in the study are included in the article/supplementary material. Further inquiries can be directed to the corresponding author.
This study was approved by the ethics committee of the First Affiliated Hospital of Fujian Medical University, written informed consent was obtained from the patients: MRCTA, ECFAH of FMU(2017)131.
YZ: Data curation, Formal analysis, Writing – original draft, Writing – review & editing. BZ: Data curation, Investigation, Writing – original draft. YL: Data curation, Formal analysis, Investigation, Writing – original draft. XS: Conceptualization, Supervision, Writing – review & editing. LH: Conceptualization, Supervision, Writing – review & editing. FZ: Data curation, Investigation, Writing – review & editing. SY: Conceptualization, Data curation, Funding acquisition, Resources, Supervision, Validation, Writing – review & editing.
The author(s) declare financial support was received for the research, authorship, and/or publication of this article. This work is support by the Key Program of Health Scientific Research of Fujian Province (2021ZD01004) and Foreign Cooperation Project of Fujian Science and Technology Planning Project (2022I1001)
We are grateful to the patients for their help and willingness to participate in the study.
The authors declare that the research was conducted in the absence of any commercial or financial relationships that could be construed as a potential conflict of interest.
All claims expressed in this article are solely those of the authors and do not necessarily represent those of their affiliated organizations, or those of the publisher, the editors and the reviewers. Any product that may be evaluated in this article, or claim that may be made by its manufacturer, is not guaranteed or endorsed by the publisher.
1. Drawz P, Rahman M. Chronic kidney disease. Ann Intern Med. (2015) 162:Itc1–16. doi: 10.7326/aitc201506020
2. Bakris GL, Ruilope LM, Anker SD, Filippatos G, Pitt B, Rossing P, et al. A prespecified exploratory analysis from fidelity examined finerenone use and kidney outcomes in patients with chronic kidney disease and type 2 diabetes. Kidney Int. (2023) 103:196–206. doi: 10.1016/j.kint.2022.08.040
3. Doshi SM, Friedman AN. Diagnosis and management of type 2 diabetic kidney disease. Clin J Am Soc Nephrol. (2017) 12:1366–73. doi: 10.2215/cjn.11111016
4. Eirin A, Chade AR, Lerman LO. Kidney intrinsic mechanisms as novel targets in renovascular hypertension. Hypertension. (2024) 81:206–17. doi: 10.1161/hypertensionaha.123.21362
5. Maser RE, Nielsen VK, Bass EB, Manjoo Q, Dorman JS, Kelsey SF, et al. Measuring diabetic neuropathy. Assessment and comparison of clinical examination and quantitative sensory testing. Diabetes Care. (1989) 12:270–5. doi: 10.2337/diacare.12.4.270
6. Liu M, Gao Y, Chen DW, Lin S, Wang C, Chen LH, et al. Quantitative vibration perception threshold in assessing diabetic polyneuropathy: should the cut-off value be adjusted for chinese individuals with type 2 diabetes? J Diabetes Investig. (2021) 12:1663–70. doi: 10.1111/jdi.13515
7. Pafili K, Trypsianis G, Papazoglou D, Maltezos E, Papanas N. Correlation of cardiac autonomic neuropathy with small and large peripheral nerve function in type 2 diabetes mellitus. Diabetes Res Clin Pract. (2019) 156:107844. doi: 10.1016/j.diabres.2019.107844
8. Williams K, Burns K, Constantino M, Shackel N, Prakoso E, Wong J, et al. An association of large-fiber peripheral nerve dysfunction with non-invasive measures of liver fibrosis secondary to non-alcoholic fatty liver disease in diabetes. J Diabetes its Complications. (2015) 29:1240–7. doi: 10.1016/j.jdiacomp.2015.06.015
9. Bergón E, Granados R, Fernández-Segoviano P, Miravalles E, Bergón M. Classification of renal proteinuria: A simple algorithm. Clin Chem Lab Med. (2002) 40:1143–50. doi: 10.1515/cclm.2002.201
10. Edrosolan KA, Shlipak MG, Scherzer R, Estrella MM, Gustafson D, Karim R, et al. Mediation analysis of chronic kidney disease risk factors using kidney biomarkers in women living with HIV. AIDS (London England). (2024) 38:813–24. doi: 10.1097/qad.0000000000003839
11. Jin S, Park Y, Park Y, Chang H, Kim S. Comparison of gait speed and peripheral nerve function between chronic kidney disease patients with and without diabetes. Ann Rehabil Med. (2017) 41:72–9. doi: 10.5535/arm.2017.41.1.72
12. American Diabetes Association. Classification and diagnosis of diabetes: standards of medical care in diabetes-2021. Diabetes Care. (2021) 44:S15–s33. doi: 10.2337/dc21-S002
13. Alberti KG, Zimmet PZ. Definition, diagnosis and classification of diabetes mellitus and its complications. Part 1: diagnosis and classification of diabetes mellitus provisional report of a WHO consultation. Diabetic Medicine: J Br Diabetic Assoc. (1998) 15:539–53. doi: 10.1002/(sici)1096–9136(199807)15:7<539::aid-dia668>3.0.co;2-s
14. Zhang Y, Weng S, Huang L, Shen X, Zhao F, Yan S. Association of sarcopenia with a higher risk of infection in patients with type 2 diabetes. Diabetes Metab Res Rev. (2022) 38:e3478. doi: 10.1002/dmrr.3478
15. Beara-Lasic L, Cogal A, Mara K, Enders F, Mehta RA, Haskic Z, et al. Prevalence of low molecular weight proteinuria and dent disease 1 clcn5 mutations in proteinuric cohorts. Pediatr Nephrol (Berlin Germany). (2020) 35:633–40. doi: 10.1007/s00467–019-04210–0
16. Schaper NC, van Netten JJ, Apelqvist J, Bus SA, Hinchliffe RJ, Lipsky BA. Practical guidelines on the prevention and management of diabetic foot disease (Iwgdf 2019 update). Diabetes/Metabolism Res Rev. (2020) 36 Suppl 1:e3266. doi: 10.1002/dmrr.3266
17. McIllhatton A, Lanting S, Lambkin D, Leigh L, Casey S, Chuter V. Reliability of recommended non-invasive chairside screening tests for diabetes-related peripheral neuropathy: A systematic review with meta-analyses. BMJ Open Diabetes Res Care. (2021) 9(2):e002528. doi: 10.1136/bmjdrc-2021–002528
18. Young MJ, Breddy JL, Veves A, Boulton AJ. The prediction of diabetic neuropathic foot ulceration using vibration perception thresholds. A prospective study. Diabetes Care. (1994) 17:557–60. doi: 10.2337/diacare.17.6.557
19. Bakris G, Ali W, Parati G. ACC/AHA versus ESC/ESH on hypertension guidelines: JACC guideline comparison. J Am Coll Cardiol. (2019) 73:3018–26. doi: 10.1016/j.jacc.2019.03.507
20. Inker LA, Astor BC, Fox CH, Isakova T, Lash JP, Peralta CA, et al. KDOQI US commentary on the 2012 KDIGO clinical practice guideline for the evaluation and management of CKD. Am J Kidney Dis. (2014) 63:713–35. doi: 10.1053/j.ajkd.2014.01.416
21. Eid S, Sas KM, Abcouwer SF, Feldman EL, Gardner TW, Pennathur S, et al. New insights into the mechanisms of diabetic complications: role of lipids and lipid metabolism. Diabetologia. (2019) 62:1539–49. doi: 10.1007/s00125–019-4959–1
22. Forbes JM, Cooper ME. Mechanisms of diabetic complications. Physiol Rev. (2013) 93:137–88. doi: 10.1152/physrev.00045.2011
23. Chen TK, Knicely DH, Grams ME. Chronic kidney disease diagnosis and management: A review. JAMA. (2019) 322:1294–304. doi: 10.1001/jama.2019.14745
24. Zhang Y, Jiang Y, Shen X, Yan S. Can both normal and mildly abnormal albuminuria and glomerular filtration rate be a danger signal for diabetic peripheral neuropathy in type 2 diabetes mellitus? Neurol Sci. (2017) 38:1381–90. doi: 10.1007/s10072–017-2946–1
25. Hong X, Huang L, Zhang Y, Shen X, Weng S, Zeng F, et al. Stronger association of albuminuria with the risk of vascular complications than estimated glomerular filtration rate in type 2 diabetes. Kidney Blood Press Res. (2021) 46:550–62. doi: 10.1159/000515163
26. Tonneijck L, Muskiet MH, Smits MM, van Bommel EJ, Heerspink HJ, van Raalte DH, et al. Glomerular hyperfiltration in diabetes: mechanisms, clinical significance, and treatment. J Am Soc Nephrol. (2017) 28:1023–39. doi: 10.1681/asn.2016060666
27. Melsom T, Schei J, Stefansson VT, Solbu MD, Jenssen TG, Mathisen UD, et al. Prediabetes and risk of glomerular hyperfiltration and albuminuria in the general nondiabetic population: A prospective cohort study. Am J Kidney Dis. (2016) 67:841–50. doi: 10.1053/j.ajkd.2015.10.025
28. Barrera-Chimal J, Lima-Posada I, Bakris GL, Jaisser F. Mineralocorticoid receptor antagonists in diabetic kidney disease - mechanistic and therapeutic effects. Nat Rev Nephrol. (2022) 18:56–70. doi: 10.1038/s41581–021-00490–8
29. Hasegawa K, Wakino S, Simic P, Sakamaki Y, Minakuchi H, Fujimura K, et al. Renal tubular sirt1 attenuates diabetic albuminuria by epigenetically suppressing claudin-1 overexpression in podocytes. Nat Med. (2013) 19:1496–504. doi: 10.1038/nm.3363
30. Dickson LE, Wagner MC, Sandoval RM, Molitoris BA. The proximal tubule and albuminuria: really! J Am Soc Nephrol. (2014) 25:443–53. doi: 10.1681/asn.2013090950
31. Tojo A, Onozato ML, Ha H, Kurihara H, Sakai T, Goto A, et al. Reduced albumin reabsorption in the proximal tubule of early-stage diabetic rats. Histochem Cell Biol. (2001) 116:269–76. doi: 10.1007/s004180100317
32. Singh A, Satchell SC. Microalbuminuria: causes and implications. Pediatr Nephrol. (2011) 26:1957–65. doi: 10.1007/s00467–011-1777–1
33. Jotwani V, Scherzer R, Abraham A, Estrella MM, Bennett M, Cohen MH, et al. Association of urine Α1-microglobulin with kidney function decline and mortality in HIV-infected women. Clin J Am Soc Nephrol. (2015) 10:63–73. doi: 10.2215/cjn.03220314
34. Guzik TJ, Touyz RM. Oxidative stress, inflammation, and vascular aging in hypertension. Hypertension. (2017) 70:660–7. doi: 10.1161/hypertensionaha.117.07802
Keywords: vibration perception threshold, chronic kidney disease, type 2 diabetes, urinary albumin to creatinine ratio, glomerulus, renal tubule
Citation: Zhang Y, Zheng B, Li Y, Shen X, Huang L, Zhao F and Yan S (2024) Association of high vibration perception threshold with reduced renal function in patients with type 2 diabetes. Front. Endocrinol. 15:1357294. doi: 10.3389/fendo.2024.1357294
Received: 09 January 2024; Accepted: 14 May 2024;
Published: 30 May 2024.
Edited by:
Kofi Asiedu, University of Houston, United StatesReviewed by:
Sanjeev Sharma, Ipswich Hospital NHS Trust, United KingdomCopyright © 2024 Zhang, Zheng, Li, Shen, Huang, Zhao and Yan. This is an open-access article distributed under the terms of the Creative Commons Attribution License (CC BY). The use, distribution or reproduction in other forums is permitted, provided the original author(s) and the copyright owner(s) are credited and that the original publication in this journal is cited, in accordance with accepted academic practice. No use, distribution or reproduction is permitted which does not comply with these terms.
*Correspondence: Sunjie Yan, Zmp5YW5zdW5qaWVAMTYzLmNvbQ==
†These authors share first authorship
Disclaimer: All claims expressed in this article are solely those of the authors and do not necessarily represent those of their affiliated organizations, or those of the publisher, the editors and the reviewers. Any product that may be evaluated in this article or claim that may be made by its manufacturer is not guaranteed or endorsed by the publisher.
Research integrity at Frontiers
Learn more about the work of our research integrity team to safeguard the quality of each article we publish.