 Xiaofang Zhao
 Tianci Yao
 Bei Song
 Haohui Fan
 Weilin Lu
94% of researchers rate our articles as excellent or good
Learn more about the work of our research integrity team to safeguard the quality of each article we publish.
Find out more
ORIGINAL RESEARCH article
Front. Endocrinol. , 14 February 2024
Sec. Clinical Diabetes
Volume 15 - 2024 | https://doi.org/10.3389/fendo.2024.1355180
Background: Body mass index (BMI) and fasting plasma glucose (FPG) are known risk factors for type 2 diabetes mellitus (T2DM), but data on the prospective association of the combination of BMI and FPG with T2DM are limited. This study sought to characterize the association of the combination of BMI and FPG (ByG) with T2DM.
Methods: The current study used the NAGALA database. We categorized participants by tertiles of ByG. The association of ByG with T2DM was expressed with hazard ratios (HRs) with 95% confidence intervals (CIs) after adjustment for potential risk factors.
Results: During a median follow-up of 6.19 years in the normoglycemia cohort and 5.58 years in the prediabetes cohort, the incidence of T2DM was 0.75% and 7.79%, respectively. Following multivariable adjustments, there were stepwise increases in T2DM with increasing tertiles of ByG. After a similar multivariable adjustment, the risk of T2DM was 2.57 (95% CI 2.26 - 2.92), 1.97 (95% CI 1.53 - 2.54) and 1.50 (95% CI 1.30 - 1.74) for a per-SD change in ByG in all populations, the normoglycemia cohort and the prediabetes cohort, respectively.
Conclusion: ByG was associated with an increased risk of T2DM in Japan. The result reinforced the importance of the combination of BMI and FPG in assessing T2DM risk.
Concomitantly with the change of lifestyles and dietary habits, the incidence of type 2 diabetes mellitus (T2DM) is increasing year by year. By 2045, this diabetes epidemic is expected to 700 million worldwide (1). Since the increasing prevalence of diabetes and subsequent economic burden, diabetes has emerged as one of the most important public health issues (2). Identifying people at higher risk of developing T2DM and risk factors of T2DM could inform screening, prevention and earlier intervention.
Many studies have indicated that insulin resistance (IR) is the major metabolic disorder in the early stages of T2DM development (3–5). Thus, early recognition of IR is crucial. Traditional methods used to evaluate IR mainly include positive hyperinsulin ⁃ glucose clamp and homeostasis model assessment (6). However, they are complicated and time-consuming, and have been performed only under limited conditions. Triglyceride glucose (TyG) index-related parameters, including the TyG index and triglyceride glucose–body mass index (TyG-BMI), have been widely studied and reported as valuable biomarkers in the identification of various diseases, such as non-alcoholic fatty liver disease (7–9), metabolic syndrome (10, 11), heart failure (12), stroke (13), hyperuricemia (14). In recent times, TyG and TyG-BMI have been attracted much attention as new surrogate markers for the assessment of IR and T2DM (15–19). And besides, studies have found that TyG-BMI is of greater diagnostic value than TyG (19, 20), which shows that body mass index (BMI) has also played a significant role. BMI and fasting plasma glucose (FPG) are two well known risk factors for T2DM (21, 22). However, the relationship of the combination of BMI and FPG with T2DM is not clear. Accordingly, we proposed a new index-ByG (defined as ln [1/2 BMI (kg/m2) × FPG (mg/dL)]) based on the formula of TyG (defined as ln [1/2 TG (mg/dL) × FPG (mg/dL)]). Using a population-based cohort, we evaluated the association of ByG with T2DM.
All the data analyzed in this study were obtained from The DATADRYAD database (http://www.Datadryad.org/). The raw data could be freely download from the dryad data package (Okamura, Takuro et al. (2019)) (23).
This study was a cohort study that included 15,464 subjects in Japan. All the participants come from the NAGALA (NAfld in the Gifu Area, Population-based Longitudinal Analysis) database, which aimed to investigate risk factors for chronic diseases. All inclusion and exclusion criteria are detailed in the literature of the data source (23). The exclusion criteria for the study of raw data included: 1) T2DM at baseline or fasting plasma glucose ≥ 6.1 mmol/L; 2) missing data; 3) known liver disease; 4) ethanol consumption (> 60 g/day for men and 40 g/day for women); medication usage (23). The study was approved by the Ethics Committee of Murakami Memorial Hospital in Japan. Informed consent was obtained from participants in the study (23).
BMI = weight (kg) divided by height2(m). TyG = Ln [(FPG (mg/dL)/2) × TG (mg/dL)] (8). TyG-BMI = BMI × TyG (8). The study exposure was ByG. The formula for calculating the index: ByG = Ln [1/2 BMI (kg/m2) × FPG (mg/dL)].
The sociodemographic characteristics included age, sex, habit of exercise, alcohol consumption (non, light, moderate, heavy), and smoking status (never, past, current). The laboratory results were as follows: BMI, waist circumference (WC), alanine aminotransferase (ALT), aspartate aminotransferase (AST), gamma-glutamyl transferase (GGT), total cholesterol (TC), triglycerides (TG), high-density lipoprotein cholesterol (HDL), FPG, glycosylated haemoglobin (HbA1c), systolic blood pressure (SBP), and diastolic blood pressure (DBP). Criteria for fatty liver diagnosis by abdominal ultrasonography were as follows: hepatorenal echo contrast, liver brightness, deep attenuation, and vascular blurring (23).
Newly developed T2DM was either diagnosed following the American Diabetes Association criteria [FPG ≥ 7 mmol/l or HbA1c ≥ 6.5%] (24) or was based on self-report (25).
The total cohort was divided into the normoglycemia (defined as FPG < 100mg/dL or HbA1c < 5.7%) group and the prediabetes (defined as FPG≥100mg/dL or HbA1c level of 5.7% to 6.4%) group (26). For normally distributed continuous variables, one-way analysis of variance was used to analyze the differences among groups, expressed as mean ± standard deviation. For non-normally distributed continuous variables, differences across groups were analyzed using Kruskal-Wallis test and expressed as median with interquartile ranges. Categorical variables were compared by the chi-square test and expressed as proportions.
Characteristics of participants were described by ByG tertiles. Then, a univariate analysis model was applied to explore the relation between the baseline characteristics and T2DM. Moreover, Cox proportional hazards models and restricted cubic spline (RCS) analysis were conducted to assess the association of the levels of ByG with T2DM. Additionally, we performed receiver operating characteristic (ROC) curve analysis and informativeness analysis (27) to examine the potential diagnostic value of ByG in T2DM. Finally, a stratified study and interaction analysis between ByG and T2DM were identified in different subgroups by grouping sex, fatty liver, smoking status (never, past, current), alcohol consumption (non, light, moderate, heavy), and habit of exercise. All statistical analyses in our study were executed by EmpowerStats (www.empowerstats.com, X&Y solutions, Inc., Boston MA) and R statistical software (http://www.R-project.org).
A total of 15,464 participants were included in the cohort study. There were 11,806 participants in the normoglycemia cohort and 3,658 participants in the prediabetes cohort. Table 1 presented the characteristics of the study stratified by ByG tertiles in all populations. Compared with subjects in the lowest tertile of ByG, those in the highest tertile were more likely to be older, male, smoking (past or current), drinking (light or moderate or heavy), have fatty liver, have no habit of exercise, have higher BMI, WC, ALT, AST, GGT, TC, TG, HbA1c, FPG, SBP, DBP and lower HDL. Additionally, the ByG highest tertile group had the highest T2DM incidence, with 9.75 cases per 1000 person-years in all populations, 2.26 cases per 1000 person-years among the normoglycemia cohort and 22.26 cases per 1000 person-years among the prediabetes cohort (Figure 1).
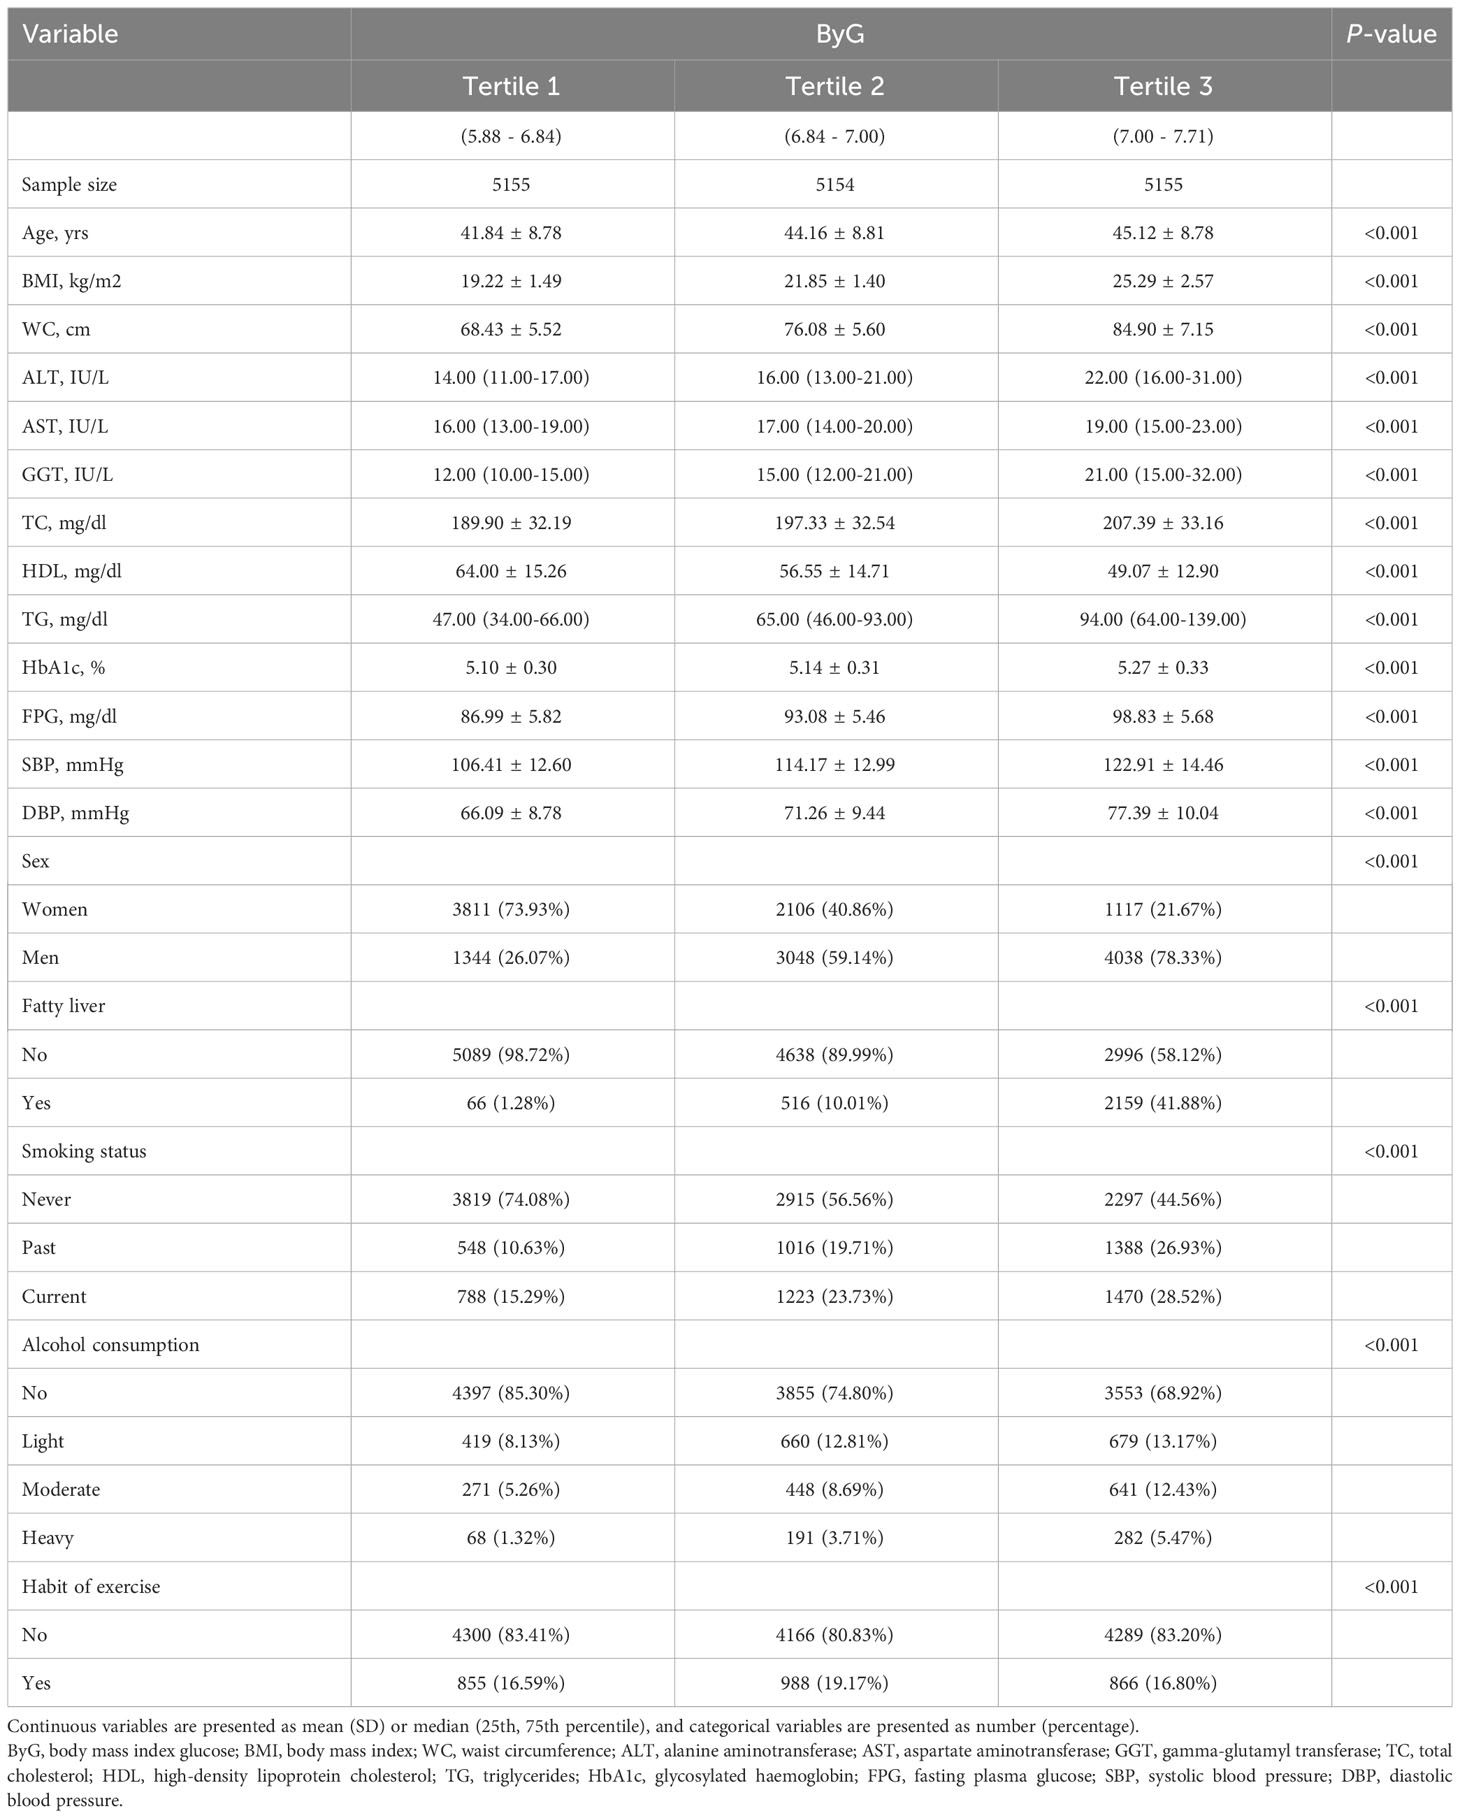
Table 1 Baseline characteristics of the study sample according to ByG tertiles.
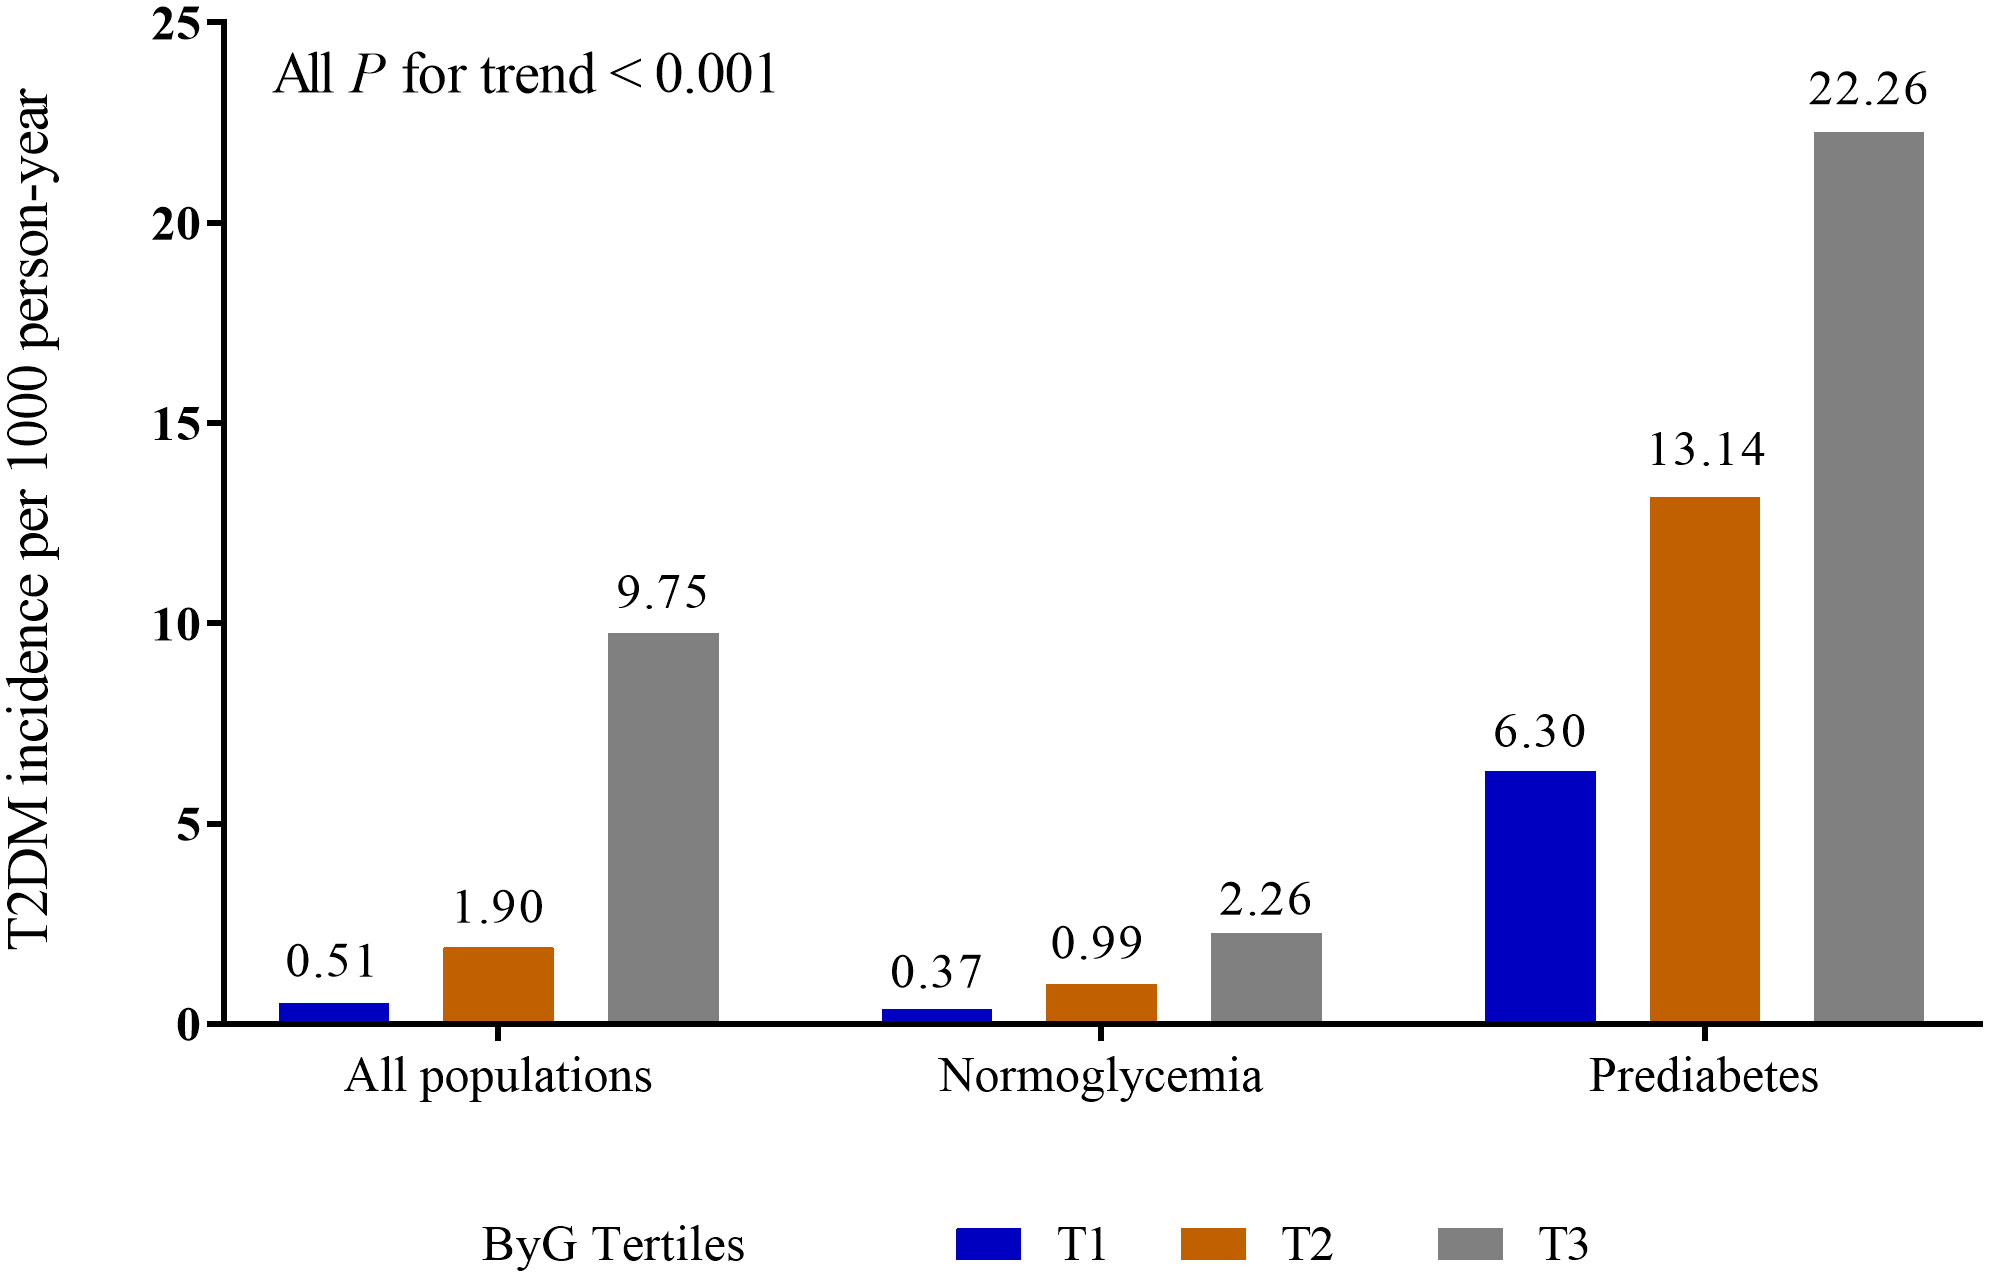
Figure 1 Incidence of T2DM in different populations. ByG, body mass index glucose; T2DM, type 2 diabetes mellitus.
The results of univariate Cox proportional hazards models between baseline variables and T2DM were presented in Table 2. We found that male, age, BMI, WC, ALT, AST, GGT, TC, TG, HbA1c, FPG, SBP, DBP, fatty liver, smoking status (past or current) and alcohol consumption (heavy) (P < 0.05) were positively correlated with the risk of T2DM, and that HDL (P < 0.0001) was negatively correlated with the risk of T2DM.
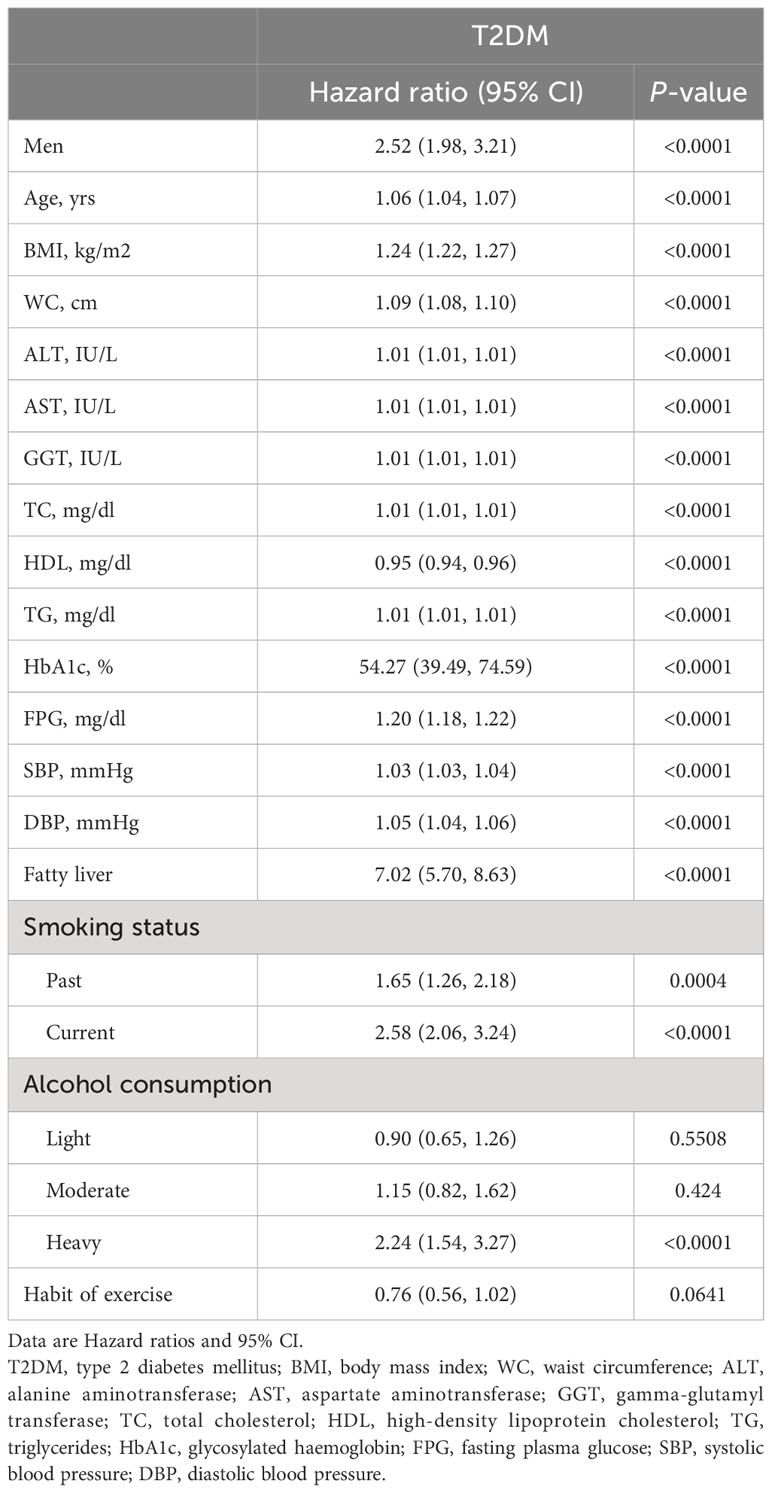
Table 2 The unadjusted association between baseline variables and T2DM at the end of follow-up.
The results of the multiple Cox proportional hazards models are shown in Table 3. With the lowest tertile as a reference, unadjusted, minimally adjusted (adjusted for age and sex) and fully adjusted (adjusted for age, sex, ALT, GGT, TC, fatty liver, smoking status, alcohol consumption and habit of exercise) Cox regression analysis showed that the hazard ratios (HRs) for T2DM significantly increased as the tertiles of ByG increased. Moreover, multiple Cox regression analysis demonstrated that ByG per-SD change was positively correlated with the risk of T2DM (HR:2.57 in all populations; HR:1.97 in the normoglycemia cohort; HR:1.50 in the prediabetes cohort; all P < 0.0001).
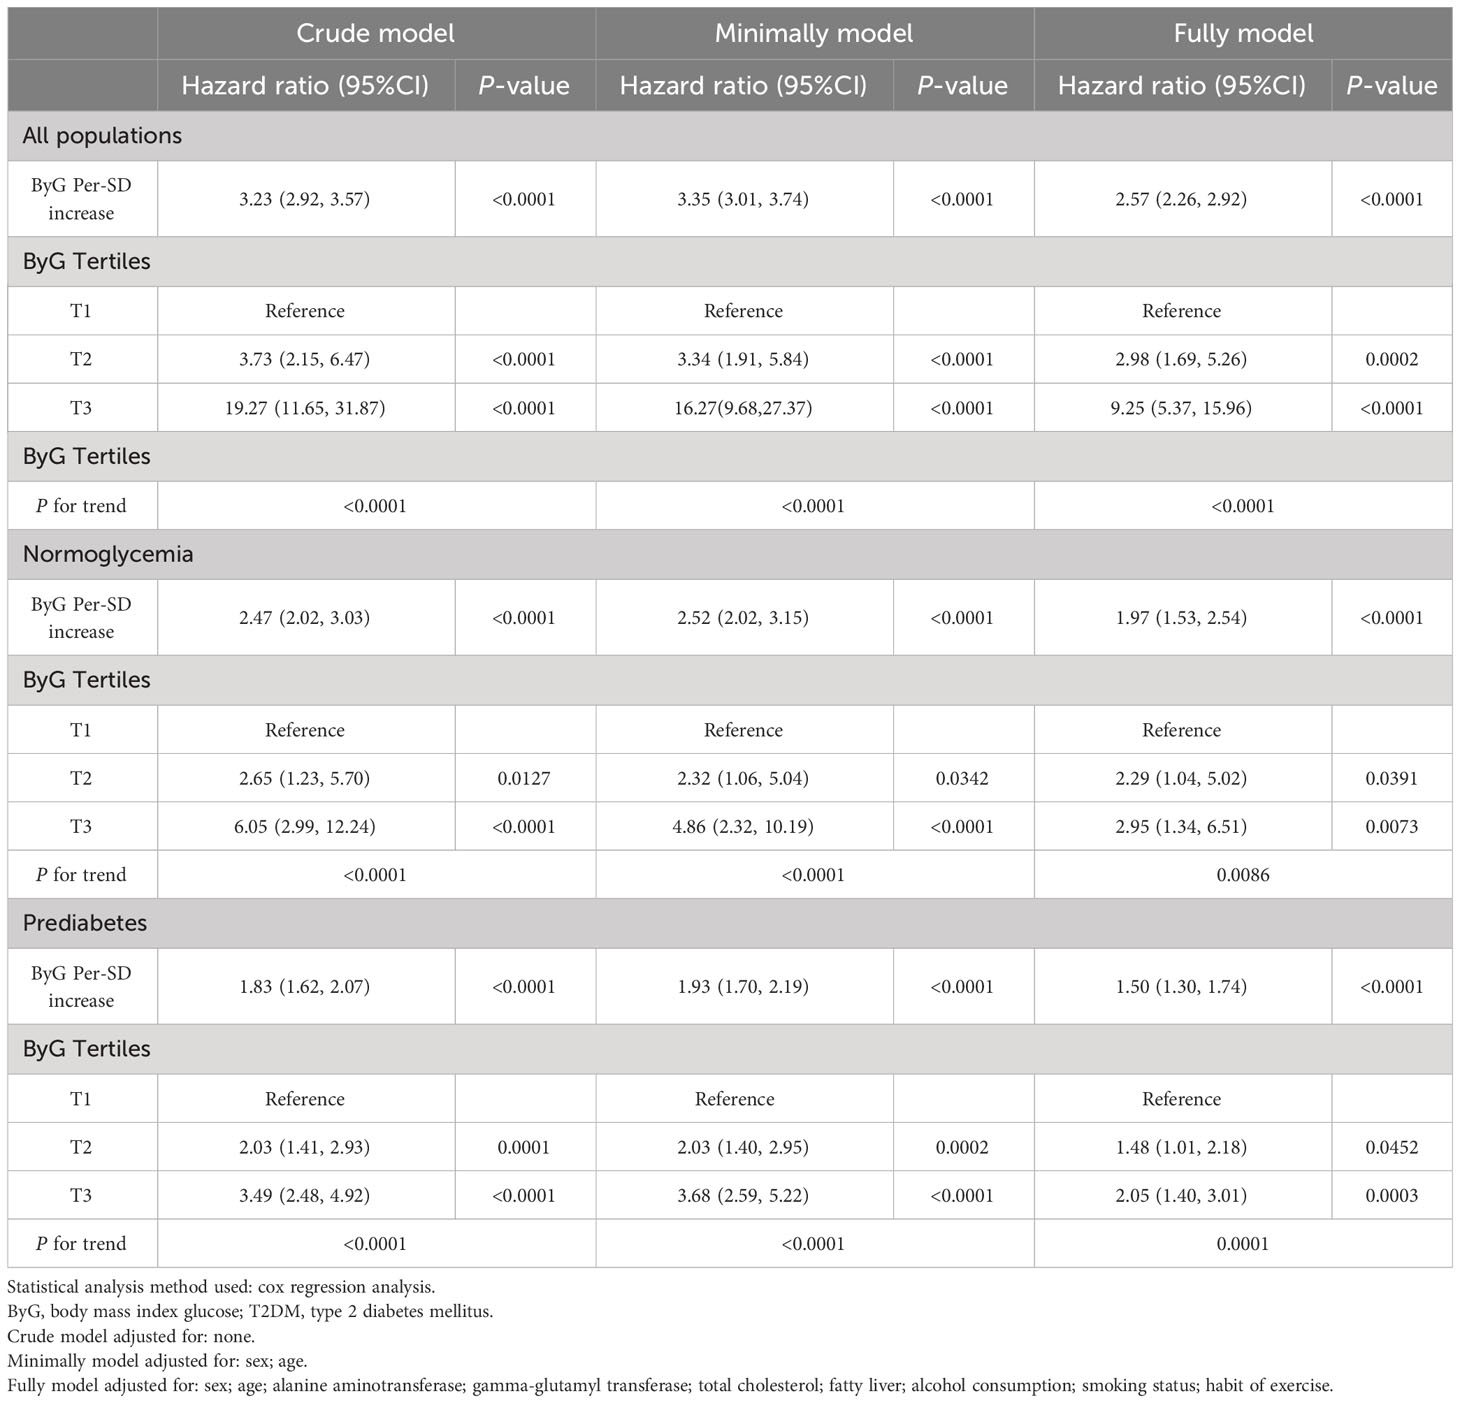
Table 3 Associations of baseline ByG with incident T2DM.
We further assessed the potential nonlinear relationship between ByG and new-onset T2DM. The RCS analysis (Figure 2) showed a linear relationship between ByG and T2DM in all populations, normoglycemia and prediabetes (all P for nonlinearity > 0.05).
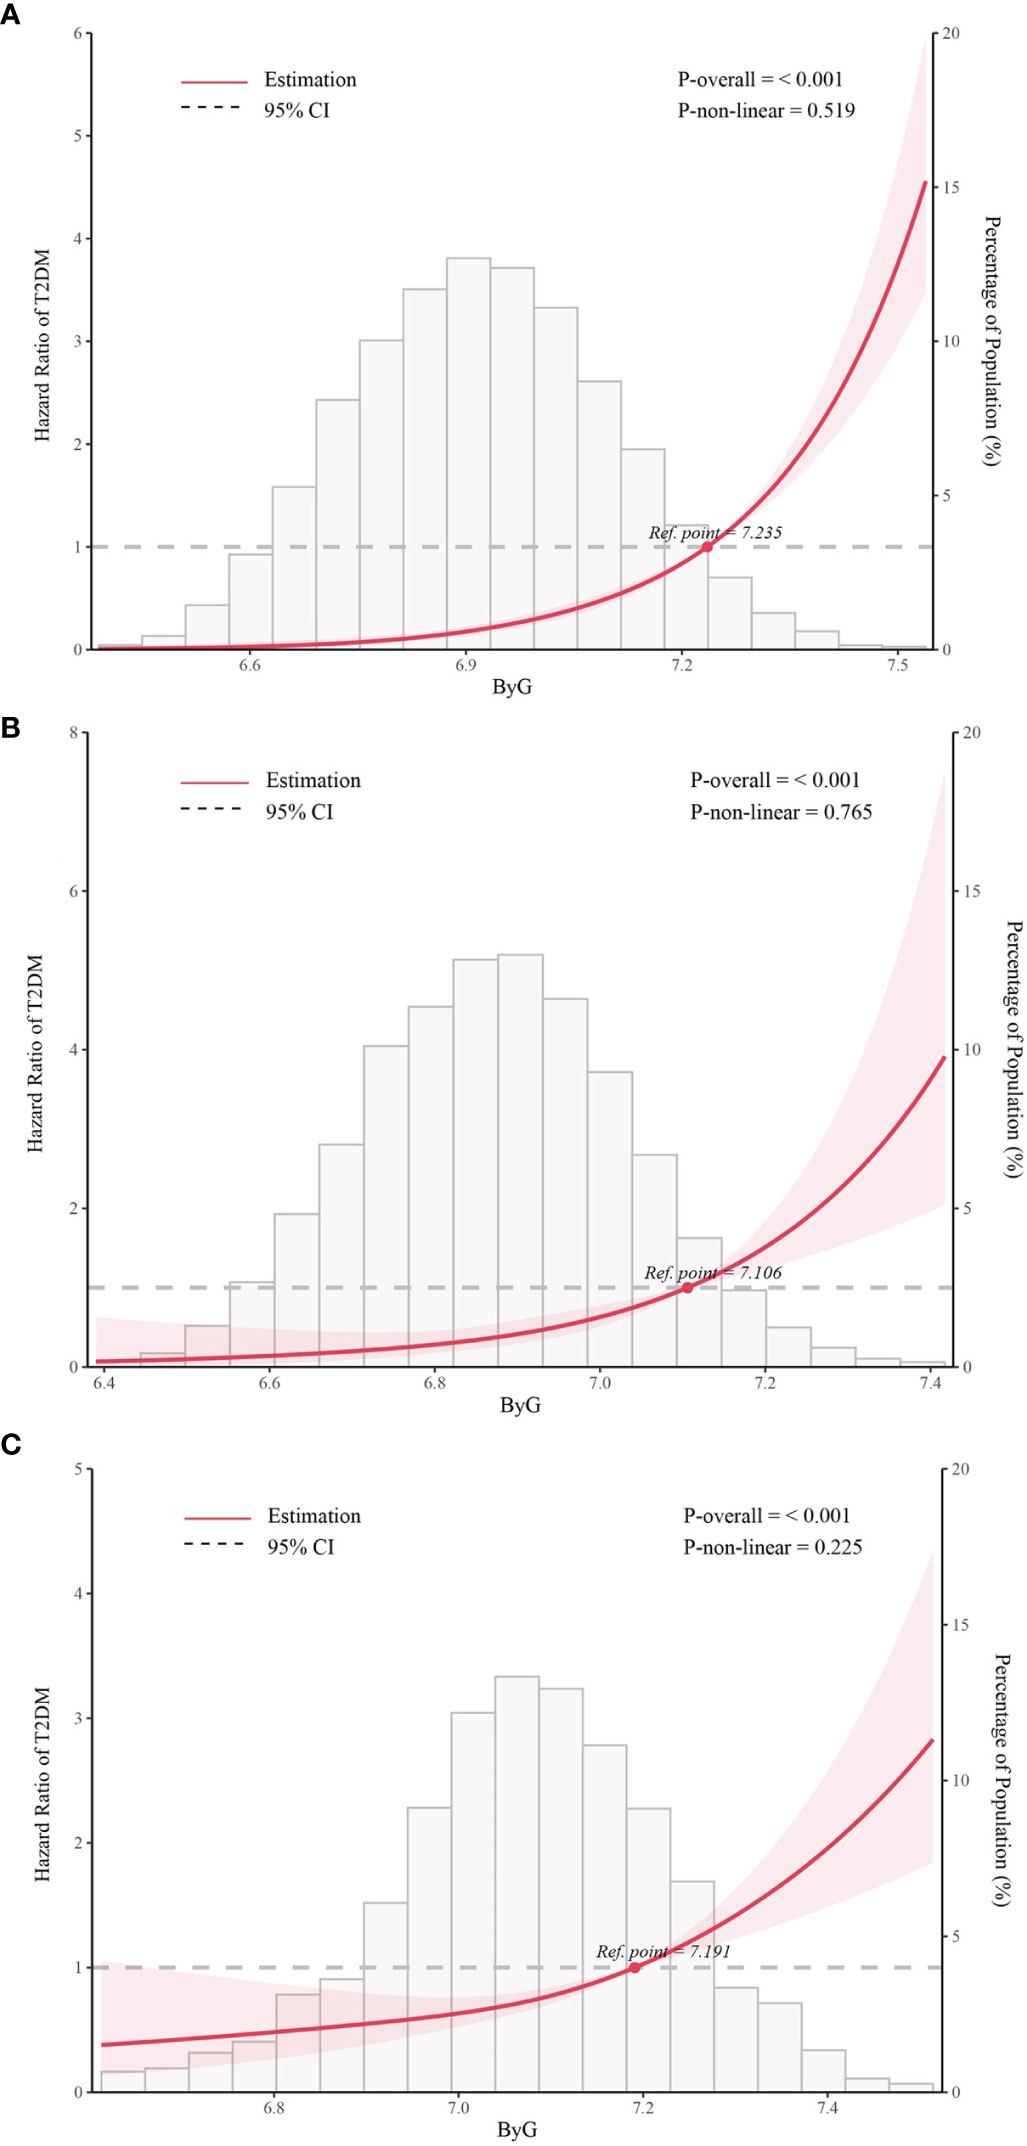
Figure 2 Association between ByG and T2DM in different populations. Data were fit by five knots restricted cubic spline (RCS). (A). all populations, (B). normoglycemia, (C). prediabetes. ByG, body mass index glucose; T2DM, type 2 diabetes mellitus. Data were adjusted for sex, age, alanine aminotransferase, gamma-glutamyl transferase, total cholesterol, fatty liver, alcohol consumption, smoking status, habit of exercise.
ROC curve analysis was done to assess the effectiveness of ByG in predicting T2DM risk in all populations (Figure 3). The result showed that ByG (AUC 0.807) had the strongest predictive performance for T2DM compared with BMI (AUC 0.733), TyG (AUC 0.750) and TyG-WC (AUC 0.774). Consistent with this result, ByG was almost 1.23 times more informative about the risk of T2DM than TyG and TyG-BMI (Table 4).
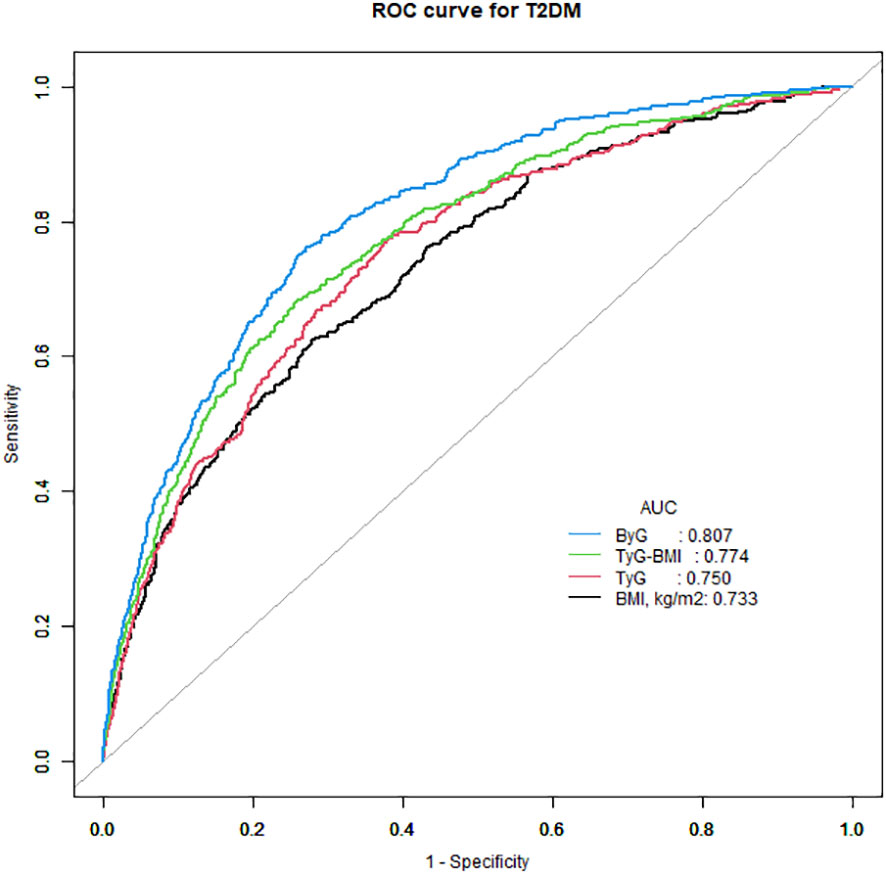
Figure 3 ROC curve analysis of the relationship between different indices and T2DM. T2DM, type 2 diabetes mellitus; TyG, triglyceride glucose; TyG-BMI, triglyceride glucose-body mass index; ByG, body mass index glucose.
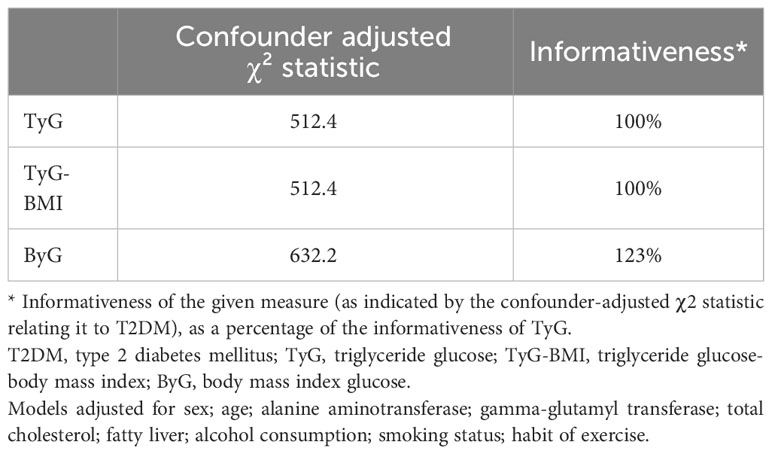
Table 4 Relative informativeness of different indices for T2DM.
For each SD increase of ByG, the HRs for T2DM were 2.59 in females and 2.54 in males; 2.53 in non-fatty liver and 2.51 in fatty liver; 2.78 in never smokers, 1.99 in previous smokers and 2.69 in current smokers; 2.61 in never drinkers, 2.29 in light drinkers and 2.45 in moderate drinkers;2.48 in persons without habit of exercise and 3.68 in persons with habit of exercise in Table 5. No interaction between ByG and T2DM was observed between subgroups by grouping sex, fatty liver, smoking status (never, past, current), alcohol consumption (non, light, moderate, heavy), and habit of exercise in Table 5 (all Pinteraction > 0.05 or close to 0.05).
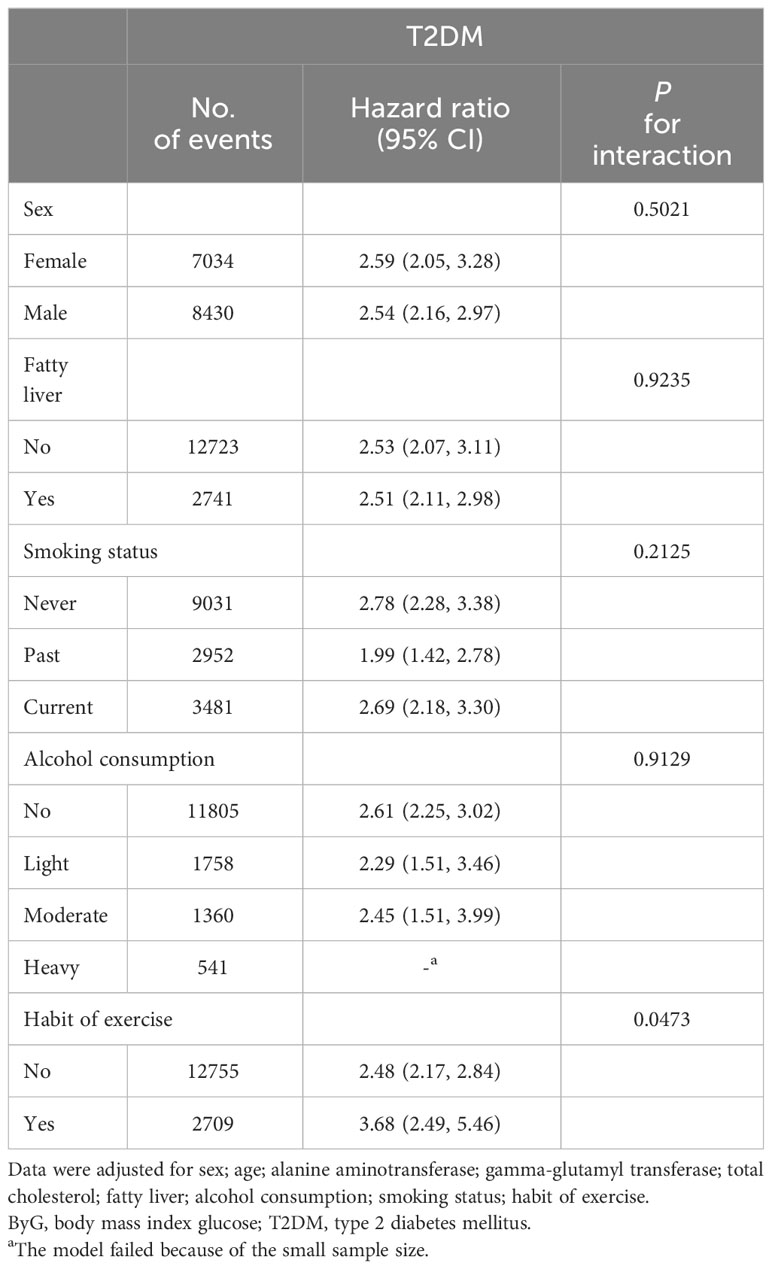
Table 5 Association of ByG with incident T2DM in subgroups.
Here, we provided for the first time evidence that ByG was independently positively associated with T2DM in Japan. Moreover, these associations were independent of age, sex, ALT, GGT, TC, fatty liver, smoking status, alcohol consumption and habit of exercises. The present study may suggest that ByG was a better predictor of T2DM than BMI, TyG and TyG-BMI.
Several screening indicators that predict high risk of future T2DM have been previously reported. Given the high cost of time and money, oral glucose tolerance test is seldom used for routine testing. A Swedish case-referent study showed that the combination of HbA1c, FPG and BMI was effective in screening for individuals at risk of future clinical diagnosis of T2DM (28). Both Japanese and Chinese studies suggested that the combined measurement of FPG and HbA1c was effective for predicting T2DM (29, 30). A study in the Finnish population revealed that these individuals can be identified early by knowledge of FPG, BMI, and family history of diabetes (31). The American Diabetes Association diabetes risk test, as a simple and inexpensive tool to identify individuals at high risk for T2DM, had highlighted the importance of BMI in predicting the risk of T2DM (32). Different from previous studies, our study was the first to demonstrate a positive association between the combination of BMI and FPG and T2DM and suggested that ByG may be used to identify people who were at high risk for developing T2DM.
IR was one of the important factors affecting various metabolic diseases. Thus, identifying IR was critically important for early diagnosis, prevention, and personalized therapy. The TyG was a new and economical index for IR evaluation. In recent years, the role of TyG in the evaluation of diabetes, non-alcoholic fatty liver disease and other common clinical diseases has been confirmed to a certain extent (33–35), which has become a new research direction. A meta-analysis in 2020 demonstrated that TyG was a predictor of T2DM development (17). Another meta-analysis in 2021 assessed the dose-response relationship between TyG and the incidence of T2DM (36). It has been found that a high TyG was associated with the incidence of T2DM and the relationship between them was non-linear (36). Other studies on IR and diabetes indicated that the combined application of BMI with TyG (TyG-BMI) showed a significant increase in the area under the curve and its discrimination accuracy was higher than TyG (19, 20). This meant that BMI was essentially important to predict diabetes risk. Given that TG levels were affected by race and steroid hormones (37), we created a new index - ByG, which linked together BMI and FPG. Importantly, ByG was much easier to compute and utilize than TyG-BMI. Compared with TyG and TyG-BMI, ByG showed a better performance in identifying T2DM. More future studies are needed to gain more insights about ByG.
Many studies have pointed to a strong relationship between obesity and diabetes (5, 38, 39). Also, obesity was closely related to high blood sugar (40). Moreover, reactive oxygen species, mainly derived from adipose tissue, may cause multiple metabolic disorders, including obesity-related IR and T2DM (41). BMI, calculated from weight and height, represented general obesity. In addition to obesity, elevated FPG levels have also been shown to be an independent risk factor for the development of T2DM (42). Our results showed that ByG, the combination of obesity and FPG, was a predictor of diabetes. The dominance of ByG may be due to the well-verified roles of FPG and obesity in the development of IR and diabetes. Elevated glucose concentrations have a toxic effect upon beta cells by increasing reactive oxygen species (43). Altogether, these results suggested that glucotoxicity and lipotoxicity played pivotal roles for pathogenesis of diabetes.
Furthermore, BMI was a cheap, easy-to-operate and non-invasive compared to TG. Advantageously, an accurate scale enabled real-time measurement of BMI at home. ByG simplified the calculation of TyG-BMI. Due to its convenience and simplification, ByG was not only suitable for large-scale health assessment, but also for individuals’ evaluation of themselves.
This analysis had important strengths. The large size and long follow-up duration of the two cohort studies strengthened the credibility of the results. More importantly, more confounding factors were adjusted to increase the reliability of the results compared with previous studies. Besides, because the data come from Japan, the results were more instructive to the Japanese. It was interesting to notice that ByG would be a new predictor of diabetes. In addition, ByG can serve as a reference biomarker for T2DM during follow-up.
Several limitations may exist in this study. Firstly, as a single-center cohort study in Japan, the results may not be directly applicable to other regions and ethnicities. The generality of the findings needed to be confirmed across regions and ethnic groups. Then, the prevalence of diabetes may be inaccurate due to the lack of oral glucose tolerance tests. Lastly, because the research data came from an existing database, unmeasured confounding factors may not fully be resolved. We were unable to obtain potentially important information that may influence T2DM, such as family history of diabetes, history of gestational diabetes, therapy and main comorbidities (in particular obesity).
The study in Japanese population have first found evidence that higher tertiles of ByG were associated with a higher risk of T2DM. ByG assessment may have important implications for identifying individuals at increased risk of T2DM in the clinic. Future prospective clinical studies should focus on the underlying mechanisms of these associations that have not been fully elucidated.
Publicly available datasets were analyzed in this study. This data can be found here: https://datadryad.org/stash/dataset/doi:10.5061%2Fdryad.8q0p192.
The studies involving humans were approved by the Ethics Committee of Murakami Memorial Hospital in Japan. The studies were conducted in accordance with the local legislation and institutional requirements. The participants provided their written informed consent to participate in this study.
XZ: Data curation, Resources, Writing – original draft, Writing – review & editing. TY: Data curation, Writing – original draft, Writing – review & editing. BS: Methodology, Writing – original draft. HF: Methodology, Writing – original draft. TL: Writing – review & editing. GG: Writing – review & editing. KW: Writing – review & editing. WL: Conceptualization, Project administration, Writing – review & editing. CL: Conceptualization, Funding acquisition, Project administration, Writing – review & editing.
The author(s) declare financial support was received for the research, authorship, and/or publication of this article. All costs of this study were supported by National Natural Science Foundation of China (NSFC) project 81974222.
We would like to express our gratitude to all members of the cohort study, including the study sponsors, data collection managers, the staff of the Murakami Memorial Hospital Medical Examination Center and all participants.
The authors declare that the research was conducted in the absence of any commercial or financial relationships that could be construed as a potential conflict of interest.
All claims expressed in this article are solely those of the authors and do not necessarily represent those of their affiliated organizations, or those of the publisher, the editors and the reviewers. Any product that may be evaluated in this article, or claim that may be made by its manufacturer, is not guaranteed or endorsed by the publisher.
1. Ibsen DB, Steur M, Imamura F, Overvad K, Schulze MB, Bendinelli B, et al. Replacement of red and processed meat with other food sources of protein and the risk of type 2 diabetes in European populations: the EPIC-interAct study. Diabetes Care (2020) 43:2660–67. doi: 10.2337/dc20-1038
2. Khadir A, Kavalakatt S, Cherian P, Warsame S, Abubaker JA, Dehbi M, et al. Physical exercise enhanced heat shock protein 60 expression and attenuated inflammation in the adipose tissue of human diabetic obese. Front Endocrinol (2018) 9:16. doi: 10.3389/fendo.2018.00016
3. Li Y, Tang Y, Shi S, Gao S, Wang Y, Xiao D, et al. Tetrahedral framework nucleic acids ameliorate insulin resistance in type 2 diabetes mellitusvia the PI3K/akt pathway. ACS Appl Mater Inter (2021) 13:40354–64. doi: 10.1021/acsami.1c11468
4. Wang Y, Zhou H, Palyha O, Mu J. Restoration of insulin receptor improves diabetic phenotype in T2DM mice. JCI Insight (2019) 4:e124945. doi: 10.1172/jci.insight.124945
5. Rohm TV, Meier DT, Olefsky JM, Donath MY. Inflammation in obesity, diabetes, and related disorders. Immunity (2022) 55:31–55. doi: 10.1016/j.immuni.2021.12.013
6. Sánchez-García A, Rodríguez-Gutiérrez R, Mancillas-Adame L, González-Nava V, Díaz González-Colmenero A, Solis RC, et al. Diagnostic accuracy of the triglyceride and glucose index for insulin resistance: A systematic review. Int J Endocrinol (2020) 2020:1–07. doi: 10.1155/2020/4678526
7. Xue Y, Xu J, Li M, Gao Y. Potential screening indicators for early diagnosis of NAFLD/MAFLD and liver fibrosis: Triglyceride glucose index–related parameters. Front Endocrinol (2022) 13:951689. doi: 10.3389/fendo.2022.951689
8. Hu H, Han Y, Cao C, He Y. The triglyceride glucose-body mass index: a non-invasive index that identifies non-alcoholic fatty liver disease in the general Japanese population. J Transl Med (2022) 20:398. doi: 10.1186/s12967-022-03611-4
9. Peng H, Pan L, Ran S, Wang M, Huang S, Zhao M, et al. Prediction of MAFLD and NAFLD using different screening indexes: A cross-sectional study in U.S. adults. Front Endocrinol (2023) 14:1083032. doi: 10.3389/fendo.2023.1083032
10. Gui J, Li Y, Liu H, Guo L, Li J, Lei Y, et al. Obesity- and lipid-related indices as a predictor of obesity metabolic syndrome in a national cohort study. Front Public Health (2023) 11:1073824. doi: 10.3389/fpubh.2023.1073824
11. Li Y, Gui J, Liu H, Guo L, Li J, Lei Y, et al. Predicting metabolic syndrome by obesity- and lipid-related indices in mid-aged and elderly Chinese: a population-based cross-sectional study. Front Endocrinol (2023) 14:1201132. doi: 10.3389/fendo.2023.1201132
12. Yang S, Shi X, Liu W, Wang Z, Li R, Xu X, et al. Association between triglyceride glucose-body mass index and heart failure in subjects with diabetes mellitus or prediabetes mellitus: a cross-sectional study. Front Endocrinol (2023) 14:1294909. doi: 10.3389/fendo.2023.1294909
13. Huang Q, Yin L, Liu Z, Wei M, Feng J, Huang Q, et al. Association of novel lipid indicators with the risk of stroke among participants in Central China: a population-based prospective study. Front Endocrinol (2023) 14:1266552. doi: 10.3389/fendo.2023.1266552
14. Wang H, Zhang J, Pu Y, Qin S, Liu H, Tian Y, et al. Comparison of different insulin resistance surrogates to predict hyperuricemia among U.S. non-diabetic adults. Front Endocrinol (2022) 13:1028167. doi: 10.3389/fendo.2022.1028167
15. Lee J, Kim B, Kim W, Ahn C, Choi HY, Kim JG, et al. Lipid indices as simple and clinically useful surrogate markers for insulin resistance in the U.S. population. Sci Rep-Uk (2021) 11:2366. doi: 10.1038/s41598-021-82053-2
16. Park HM, Lee HS, Lee Y, Lee J. The triglyceride–glucose index is a more powerful surrogate marker for predicting the prevalence and incidence of type 2 diabetes mellitus than the homeostatic model assessment of insulin resistance. Diabetes Res Clin Pr (2021) 180:109042. doi: 10.1016/j.diabres.2021.109042
17. Da Silva A, Caldas APS, Rocha DMUP, Bressan J. Triglyceride-glucose index predicts independently type 2 diabetes mellitus risk: A systematic review and meta-analysis of cohort studies. Prim Care Diabetes (2020) 14:584–93. doi: 10.1016/j.pcd.2020.09.001
18. Wang X, Liu J, Cheng Z, Zhong Y, Chen X, Song W. Triglyceride glucose-body mass index and the risk of diabetes: a general population-based cohort study. Lipids Health Dis (2021) 20:99. doi: 10.1186/s12944-021-01532-7
19. Song B, Zhao X, Yao T, Lu W, Zhang H, Liu T, et al. Triglyceride glucose-body mass index and risk of incident type 2 diabetes mellitus in Japanese people with normal glycemic level: A population-based longitudinal cohort study. Front Endocrinol (Lausanne) (2022) 13:907973. doi: 10.3389/fendo.2022.907973
20. Er LK, Wu S, Chou HH, Hsu LA, Teng MS, Sun YC, et al. Triglyceride glucose-body mass index is a simple and clinically useful surrogate marker for insulin resistance in nondiabetic individuals. PloS One (2016) 11:e149731. doi: 10.1371/journal.pone.0149731
21. Leung MYM, Carlsson NP, Colditz GA, Chang S. The burden of obesity on diabetes in the United States: medical expenditure panel survey, 2008 to 2012. Value Health (2017) 20:77–84. doi: 10.1016/j.jval.2016.08.735
22. He L, Zheng W, Li Z, Chen L, Kong W, Zeng T. J-shape relationship between normal fasting plasma glucose and risk of type 2 diabetes in the general population: results from two cohort studies. J Transl Med (2023) 21:175. doi: 10.1186/s12967-023-04006-9
23. Okamura T, Hashimoto Y, Hamaguchi M, Obora A, Kojima T, Fukui M. Ectopic fat obesity presents the greatest risk for incident type 2 diabetes: a population-based longitudinal study. Int J Obes (2019) 43:139–48. doi: 10.1038/s41366-018-0076-3
24. Standards of medical care in diabetes—2011. Diabetes Care (2011) 34:S11–61. doi: 10.2337/dc11-S011
25. Yang R, Kuang M, Qiu J, Yu C, Sheng G, Zou Y. Assessing the usefulness of a newly proposed metabolic score for visceral fat in predicting future diabetes: results from the NAGALA cohort study. Front Endocrinol (2023) 14:1172323. doi: 10.3389/fendo.2023.1172323
26. Echouffo-Tcheugui JB, Perreault L, Ji L, Dagogo-Jack S. Diagnosis and management of prediabetes. JAMA (2023) 329:1206. doi: 10.1001/jama.2023.4063
27. Staplin N, de la Sierra A, Ruilope LM, Emberson JR, Vinyoles E, Gorostidi M, et al. Relationship between clinic and ambulatory blood pressure and mortality: an observational cohort study in 59 124 patients. Lancet (2023) 401:2041–50. doi: 10.1016/S0140-6736(23)00733-X
28. Norberg M, Eriksson Jw, Lindahl B, Andersson C, Rolandsson O, Stenlund H, et al. A combination of HbA1c, fasting glucose and BMI is effective in screening for individuals at risk of future type 2 diabetes: OGTT is not needed. J Intern Med (2006) 260:263–71. doi: 10.1111/j.1365-2796.2006.01689.x
29. Ko GT, Chan JC, Tsang LW, Cockram CS. Combined use of fasting plasma glucose and HbA1c predicts the progression to diabetes in Chinese subjects. Diabetes Care (2000) 23:1770–73. doi: 10.2337/diacare.23.12.1770
30. Inoue K, Matsumoto M, Kobayashi Y. The combination of fasting plasma glucose and glycosylated hemoglobin predicts type 2 diabetes in Japanese workers. Diabetes Res Clin Pr (2007) 77:451–58. doi: 10.1016/j.diabres.2007.01.024
31. Lyssenko V, Almgren P, Anevski D, Perfekt R, Lahti K, Nissén M, et al. Predictors of and longitudinal changes in insulin sensitivity and secretion preceding onset of type 2 diabetes. Diabetes (2005) 54:166–74. doi: 10.2337/diabetes.54.1.166
32. Lindström J, Tuomilehto J. The diabetes risk score. Diabetes Care (2003) 26:725–31. doi: 10.2337/diacare.26.3.725
33. Park B, Lee HS, Lee Y. Triglyceride glucose (TyG) index as a predictor of incident type 2 diabetes among nonobese adults: a 12-year longitudinal study of the Korean Genome and Epidemiology Study cohort. Transl Res (2021) 228:42–51. doi: 10.1016/j.trsl.2020.08.003
34. Kim KS, Hong S, Ahn HY, Park CY. Triglyceride and glucose index is a simple and easy-to-calculate marker associated with nonalcoholic fatty liver disease. Obesity (2022) 30:1279–88. doi: 10.1002/oby.23438
35. Zhao J, Fan H, Wang T, Yu B, Mao S, Wang X, et al. TyG index is positively associated with risk of CHD and coronary atherosclerosis severity among NAFLD patients. Cardiovasc Diabetol (2022) 21:123. doi: 10.1186/s12933-022-01548-y
36. Pranata R, Huang I, Irvan, Lim MA, Vania R. The association between triglyceride-glucose index and the incidence of type 2 diabetes mellitus—a systematic review and dose–response meta-analysis of cohort studies. Endocrine (2021) 74:254–62. doi: 10.1007/s12020-021-02780-4
37. Lamon-Fava S, Barnett JB, Woods MN, McCormack C, McNamara JR, Schaefer EJ, et al. Differences in serum sex hormone and plasma lipid levels in Caucasian and African-American premenopausal women. J Clin Endocrinol Metab (2005) 90:4516–20. doi: 10.1210/jc.2004-1897
38. Piché M, Tchernof A, Després J. Obesity phenotypes, diabetes, and cardiovascular diseases. Circ Res (2020) 126:1477–500. doi: 10.1161/CIRCRESAHA.120.316101
39. Klein S, Gastaldelli A, Yki-Järvinen H, Scherer PE. Why does obesity cause diabetes? Cell Metab (2022) 34:11–20. doi: 10.1016/j.cmet.2021.12.012
40. Martyn JAJ, Kaneki M, Yasuhara S, Warner DS, Warner MA. Obesity-induced insulin resistance and hyperglycemia. Anesthesiology (2008) 109:137–48. doi: 10.1097/ALN.0b013e3181799d45
41. Matsuda M, Shimomura I. Increased oxidative stress in obesity: Implications for metabolic syndrome, diabetes, hypertension, dyslipidemia, atherosclerosis, and cancer. Obes Res Clin Pract (2013) 7:e330–41. doi: 10.1016/j.orcp.2013.05.004
42. Brambilla P, La Valle E, Falbo R, Limonta G, Signorini S, Cappellini F, et al. Normal fasting plasma glucose and risk of type 2 diabetes. Diabetes Care (2011) 34:1372–74. doi: 10.2337/dc10-2263
Keywords: type 2 diabetes mellitus, body mass index, fasting plasma glucose, insulin resistance, Japan
Citation: Zhao X, Yao T, Song B, Fan H, Liu T, Gao G, Wang K, Lu W and Liu C (2024) The combination of body mass index and fasting plasma glucose is associated with type 2 diabetes mellitus in Japan: a secondary retrospective analysis. Front. Endocrinol. 15:1355180. doi: 10.3389/fendo.2024.1355180
Received: 13 December 2023; Accepted: 29 January 2024;
Published: 14 February 2024.
Edited by:
Roberto Scicali, University of Catania, ItalyReviewed by:
Arianna Toscano, University Hospital of Policlinico G. Martino, ItalyCopyright © 2024 Zhao, Yao, Song, Fan, Liu, Gao, Wang, Lu and Liu. This is an open-access article distributed under the terms of the Creative Commons Attribution License (CC BY). The use, distribution or reproduction in other forums is permitted, provided the original author(s) and the copyright owner(s) are credited and that the original publication in this journal is cited, in accordance with accepted academic practice. No use, distribution or reproduction is permitted which does not comply with these terms.
*Correspondence: Weilin Lu, d2VpbGlubHUxMTA5QDE2My5jb20=; Chengyun Liu, Y2hlbmd5dW5saXVAaHVzdC5lZHUuY24=
†These authors have contributed equally to this work and share first authorship
‡These authors have contributed equally to this work
Disclaimer: All claims expressed in this article are solely those of the authors and do not necessarily represent those of their affiliated organizations, or those of the publisher, the editors and the reviewers. Any product that may be evaluated in this article or claim that may be made by its manufacturer is not guaranteed or endorsed by the publisher.
Research integrity at Frontiers
Learn more about the work of our research integrity team to safeguard the quality of each article we publish.