 Saba Sheikh1
 Darko Stefanovski2Marissa J. Kilberg3Denis Hadjiliadis4
 Ronald C. Rubenstein5
 Michael R. Rickels6*Andrea Kelly3*
- 1Division of Pulmonary and Sleep Medicine, Children’s Hospital of Philadelphia and Department of Pediatrics, University of Pennsylvania Perelman School of Medicine, Philadelphia, PA, United States
- 2Department of Clinical Studies-New Bolton Center, University of Pennsylvania School of Veterinary Medicine, Kennett Square, PA, United States
- 3Division of Endocrinology and Diabetes, Children’s Hospital of Philadelphia and Department of Pediatrics, University of Pennsylvania Perelman School of Medicine, Philadelphia, PA, United States
- 4Division of Pulmonary and Critical Care Medicine, Department of Medicine, University of Pennsylvania Perelman School of Medicine, Philadelphia, PA, United States
- 5Division of Allergy and Pulmonary Medicine, Department of Pediatrics, Washington University School of Medicine, St. Louis, MO, United States
- 6Division of Endocrinology, Diabetes & Metabolism, Department of Medicine and Institute for Diabetes, Obesity & Metabolism, University of Pennsylvania Perelman School of Medicine, Philadelphia, PA, United States
Insulin secretion within 30 minutes of nutrient ingestion is reduced in people with cystic fibrosis (PwCF) and pancreatic insufficiency and declines with worsening glucose tolerance. The glucose potentiated arginine (GPA) test is validated for quantifying β-cell secretory capacity as an estimate of functional β-cell mass but requires technical expertise and is burdensome. This study sought to compare insulin secretion during mixed-meal tolerance testing (MMTT) to GPA-derived parameters in PwCF.
Methods: Secondary data analysis of CF-focused prospective studies was performed in PwCF categorized as 1) pancreatic insufficient [PI-CF] or 2) pancreatic sufficient [PS-CF] and in 3) non-CF controls. MMTT: insulin secretory rates (ISR) were derived by parametric deconvolution using 2-compartment model of C-peptide kinetics, and incremental area under the curve (AUC) was calculated for 30, 60 and 180-minutes. GPA: acute insulin (AIR) and C-peptide responses (ACR) were calculated as average post-arginine insulin or C-peptide response minus pre-arginine insulin or C-peptide under fasting (AIRarg and ACRarg), ~230 mg/dL (AIRpot and ACRpot), and ~340 mg/dL (AIRmax and ACRmax) hyperglycemic clamp conditions. Relationships of MMTT to GPA parameters were derived using Pearson’s correlation coefficient. Predicted values were generated for MMTT ISR and compared to GPA parameters using Bland Altman analysis to assess degree of concordance.
Results: 85 PwCF (45 female; 75 PI-CF and 10 PS-CF) median (range) age 23 (6-56) years with BMI 23 (13-34) kg/m2, HbA1c 5.5 (3.8-10.2)%, and FEV1%-predicted 88 (26-125) and 4 non-CF controls of similar age and BMI were included. ISR AUC30min positively correlated with AIRarg (r=0.55), AIRpot (r=0.62), and AIRmax (r=0.46) and with ACRarg (r=0.59), ACRpot (r=0.60), and ACRmax (r=0.51) (all P<0.001). ISR AUC30min strongly predicted AIRarg (concordance=0.86), AIRpot (concordance=0.89), and AIRmax (concordance=0.76) at lower mean GPA values, but underestimated AIRarg, AIRpot, and AIRmax at higher GPA-defined β-cell secretory capacity. Between test agreement was unaltered by adjustment for study group, OGTT glucose category, and BMI.
Conclusion: Early-phase insulin secretion during MMTT can accurately predict GPA-derived measures of β-cell function and secretory capacity when functional β-cell mass is reduced. These data can inform future multicenter studies requiring reliable, standardized, and technically feasible testing mechanisms to quantify β-cell function and secretory capacity.
Introduction
Medical advancements and improved clinical care in people with cystic fibrosis (PwCF) have improved life expectancy, with the majority of PwCF living well into adulthood (1). With advancing age, however, PwCF are at an increased risk for the development of cystic fibrosis-related diabetes (CFRD) (2), a major comorbidity that affects 40-50% of adults living with CF (2). Better understanding the pathophysiology and risk factors for diabetes development in PwCF is imperative to prevent, treat and manage CFRD.
While the underpinnings of CFRD development remain elusive, impaired insulin secretion is considered the primary defect, and the American Diabetes Association classifies CFRD as “specific types of diabetes due to other causes” (3). Individuals with exocrine pancreatic insufficient CF (PI-CF) are at greater risk for CFRD than PwCF with pancreatic sufficiency (4). While insulin secretion is largely preserved in pancreatic sufficient CF (PS-CF), it is decreased in PI-CF even in individuals with “normal” glucose tolerance (5). With worsening glucose tolerance in PI-CF, insulin and C-peptide peak concentrations are lower and their secretion is progressively delayed after nutrient ingestion; these findings indicate worsening impairment of early-phase insulin secretion dynamics (6). In addition to fibrofatty replacement of the exocrine pancreas in PI-CF, loss of CFTR function, genetic susceptibility, systemic and local inflammation, and disturbances in the entero-insular axis also appear to have roles in pancreatic β-cell dysfunction in CF (7, 8).
Reproducible and more easily available techniques that estimate β-cell function are required to advance our understanding of the development of insulin secretion defects in CF. While multiple methodologies exist to quantify β-cell function, each has their own limitations due to varying routes of administration, stimuli and sampling (9). We have successfully used the glucose potentiated arginine (GPA) test, which provides validated measures of functional β-cell mass, across multiple studies to evaluate β-cell function and secretory capacity in PwCF (5, 6, 10–12). β-cell responses at basal (fasting) glucose and under hyperglycemic clamp conditions are calculated in response to arginine, a non-glucose insulin secretagogue. However, this test requires technical expertise and resources that are not readily available at many research centers and is burdensome to participants. The mixed meal tolerance test (MMTT), which is less intensive in terms of participation and resources, can assess insulin secretion from mathematical deconvolution of peripherally measured C-peptide concentrations in response to a more physiologic challenge, a standardized meal (13).
In this study, we aimed to test the correlation of insulin secretory rate (ISR) responses during MMTT and GPA-derived acute insulin and C-peptide responses under fasting and hyperglycemic clamp conditions. Based on known CF pathophysiology (6) we hypothesized that ISR responses during the initial 30 minutes of the MMTT would correlate closely with and accurately predict GPA measures of β-cell function and secretory capacity, and also explored this relationship for ISR responses during the initial 60 minutes of the MMTT.
Materials and methods
We performed these secondary analyses on data collected from PwCF who participated in research studies conducted between March 2012 and February 2022 at the Hospital of the University of Pennsylvania and the Children’s Hospital of Philadelphia and that included assessment of 1) β-cell function and secretory capacity by GPA and 2) glucose tolerance and insulin secretion by MMTT. Subjects ≥6 years of age with a confirmed clinical diagnosis of CF as per Cystic Fibrosis Foundation diagnostic criteria were included (14). Data from non-CF control participants from a study on the effects of incretin hormones on islet function in PI-CF were also included for comparison (12).
All participants completed a 75-gram oral glucose tolerance test (OGTT) within the previous 6 months and were characterized as having either normal glucose tolerance (NGT), defined as 1-hour glucose < 155 mg/dL and 2-hour glucose < 140 mg/dL, early glucose intolerance (EGI) defined as 1-hour glucose ≥ 155 mg/dL and 2-hour glucose < 140 mg/dL (6), impaired glucose tolerance (IGT) defined as 2-hour glucose ≥ 140 mg/dL and < 200 mg/dL), or CFRD defined as 2-hour glucose ≥ 200 mg/dL or previously confirmed diagnosis with or without fasting hyperglycemia (fasting glucose ≥ 126 mg/dL).
Participants were excluded if they had experienced clinically symptomatic pancreatitis within the previous 12 months, a history of lung or liver transplant, significant kidney or liver dysfunction, or were pregnant or nursing females. Study visits were delayed for acute illness necessitating change of antibiotics or treatment with oral or intravenous glucocorticoids within the prior 4 weeks. Approvals for each study were obtained through the institutional review boards of the University of Pennsylvania and the Children’s Hospital of Philadelphia. All adult participants or parents of children (age <18 years) provided written informed consent to participate and to use their deidentified data for future analyses; assent was provided by participants aged <18 years.
Mixed meal tolerance test
A standardized MMTT was used to evaluate postprandial glucose tolerance and incretin and islet hormone secretion, as previously described (5). After a 12-hour overnight fast, an antecubital or forearm vein catheter was placed for blood sampling, with the arm warmed using a heating pad to promote arterialization of venous blood. After approximately 20 min of acclimatization to the catheter, baseline blood samples were taken at t = −10 and −1 min before consumption of an 820-kcal meal over 15 min starting at t = 0. Meal composition was 47% carbohydrate, 40% fat, and 13% protein of the total energy content (15). Pancreatic insufficient participants took their regularly prescribed dose of pancreatic enzyme replacement with the test meal. Additional blood samples were collected at t = 10, 15, 20, 30, 60, 90, 120, 150, 180, 210, and 240 min from the start of the meal. If applicable, rapid-acting insulin or repaglinide was held for 12 h prior to testing, while morning doses of CFTR modulator therapy were taken as prescribed with the meal.
Glucose potentiated arginine test
A GPA test was performed according to established methodology for evaluation of β-cell function and secretory capacity (16–18). After a 12-hour overnight fast, an antecubital or forearm vein catheter was placed for infusions and a second catheter was placed in the contralateral forearm or hand for blood sampling, with the forearm or hand warmed using a heating pad to promote arterialization of venous blood. After approximately 20 min of acclimatization to placement of the catheters, baseline blood samples were taken at t = −5 and −1 min relative to injection of 10% arginine (5 g) over 1 min starting at t = 0. Additional blood samples were collected at t = 2, 3, 4, and 5 min. Beginning at t = 10 min, a hyperglycemic clamp technique (19) using a variable rate infusion of 20% dextrose was performed to achieve a plasma glucose concentration of ~230 mg/dL. Blood samples were taken every 5 min to adjust the glucose infusion rate and achieve the desired plasma glucose concentration. After 45 min of glucose infusion (at t = 55 min), a second arginine pulse was injected with identical blood sampling. The first administration of arginine has no effect on the subsequent response to arginine using this protocol (20). A subsequent 2-hour period without glucose infusion allowed plasma glucose to return to baseline. A second hyperglycemic clamp was then performed to achieve a plasma glucose concentration of ~340 mg/dL. After 45 min of glucose infusion, a third arginine pulse was injected with identical sampling. If applicable, rapid-acting insulin or repaglinide was held for 12 h prior to testing, and morning doses of CFTR modulator therapy were held until the completion of testing and taken with a provided meal.
Biochemical analyses
Plasma glucose was measured in duplicate by the glucose oxidase method using an automated glucose analyzer (YSI 2300; Yellow Springs Instruments, Yellow Springs, OH, USA). Additional blood samples were collected into tubes on ice containing ethylenediamine tetra-acetate and protease inhibitor cocktail and, for the MMTT test, dipeptidyl peptidase-4 inhibitor (Sigma-Aldrich, St. Louis, MO, USA). Samples were centrifuged at 4°C, separated, and frozen at −80°C for subsequent analysis. Plasma insulin (Millipore Cat# HI-14 K, RRID: AB_2801577) and C-peptide (Millipore Cat# HCP-20 K, RRID: AB_2891151) were assayed in duplicate by double-antibody radioimmunoassay (Millipore, Billerica, MA, USA).
Calculations
ISRs during the MMTT were calculated from C-peptide values and derived by parametric deconvolution of C-peptide kinetics using a 2-compartment model (21) in WinSAAM software 3.0.8 (University of Pennsylvania, New Bolton Center, Kennett Square, PA, US). The 30-, 60- and 180-min incremental areas under the curve for ISR (ISR AUC30min, ISR AUC60min, ISR AUC180min, respectively) were calculated with baseline values subtracted using the trapezoidal method in STATA 15 software (StataCorp LP, College Station, TX, USA). Acute insulin and C-peptide responses to arginine (AIRarg and ACRarg, respectively) during the GPA test were calculated as mean of 2-, 3-, 4-, and 5-min values minus mean of baseline values (-5 and -1 min) (19). Acute responses during the 230 mg/dL clamp enable determination of glucose potentiation of arginine-induced insulin (AIRpot) and C-peptide (ACRpot) release. Acute responses during the 340 mg/dL clamp allow for determination of maximum arginine-induced insulin (AIRmax) and C-peptide (ACRmax) release (i.e., β-cell secretory capacity).
Statistical analyses
Data are reported as median (min-max) and categorial data as percentages, except where indicated. Graphs were generated to permit visual inspection of data by study group: PI-CF, PS-CF, and non-CF controls. Subject demographics were examined using the Kruskal-Wallis test for continuous variables and χ2 test for categorical variables. Comparison of results between the PI-CF, PS-CF, and control subjects was performed with the Kruskal-Wallis test, and when significant differences at P ≤ 0.05 (two-tailed) were found, comparisons between groups were performed using the Dunn test. Comparison of results across glucose tolerance categories among PI-CF was performed with the nonparametric test for progressively worsening differences across ordered groups (nptrend).
Pearson’s correlation coefficient was used to assess the relationship between ISR AUC during MMTT to acute insulin and C-peptide responses during the GPA. As the MMTT and GPA measures are with different units and not directly comparable through a Bland Altman analysis, we corrected the ISR AUCs using linear regression to generate predicted values from MMTT to compare to GPA measures. These models were generated with MMTT measures as the independent variable and GPA measures as the outcome variable. GPA values were compared to predicted values from MMTT using the concord command in STATA that generates the Bland Altman Analysis, along with a Pearson’s correlation coefficient, r, the bias-correction factor, concordance (measure of accuracy), and Lin’s correlation coefficient, rho_c (product of Pearson’s r and concordance). Linear models were also adjusted for age, sex, study group, OGTT glucose category and BMI to evaluate if the between test agreement was modified by these factors. As age and sex were not significantly associated with our outcome variable they were excluded from the final model. All data analyses were performed in STATA 15 software.
Results
Participants
A total of 89 CF participants and 5 non-CF controls were enrolled in studies that included baseline assessment of both MMTT and GPA during an approximate 10-year period (5, 6, 10–12). Four CF participants and one non-CF control were unable to complete one or both tests and were, therefore, excluded from the present analyses. Data were subsequently analyzed for 85 CF participants and 4 non-CF controls. The majority of CF participants were pancreatic insufficient (PI-CF; n = 75) and were more often homozygous (46%) or heterozygous (37%) for the 508del CFTR mutation (P = 0.02) and glucose intolerant by OGTT (P = 0.002) than the group with pancreatic sufficient CF (PS-CF; n = 10; Table 1). HbA1c was higher in PI-CF than PS-CF whose HbA1c was not different than controls (PI-CF vs PS-CF: P = 0.001; Table 1). Only 29 CF participants (34%) were on CFTR modulator therapy at the time of their metabolic testing visits, of whom 16 were on highly effective modulator therapy.
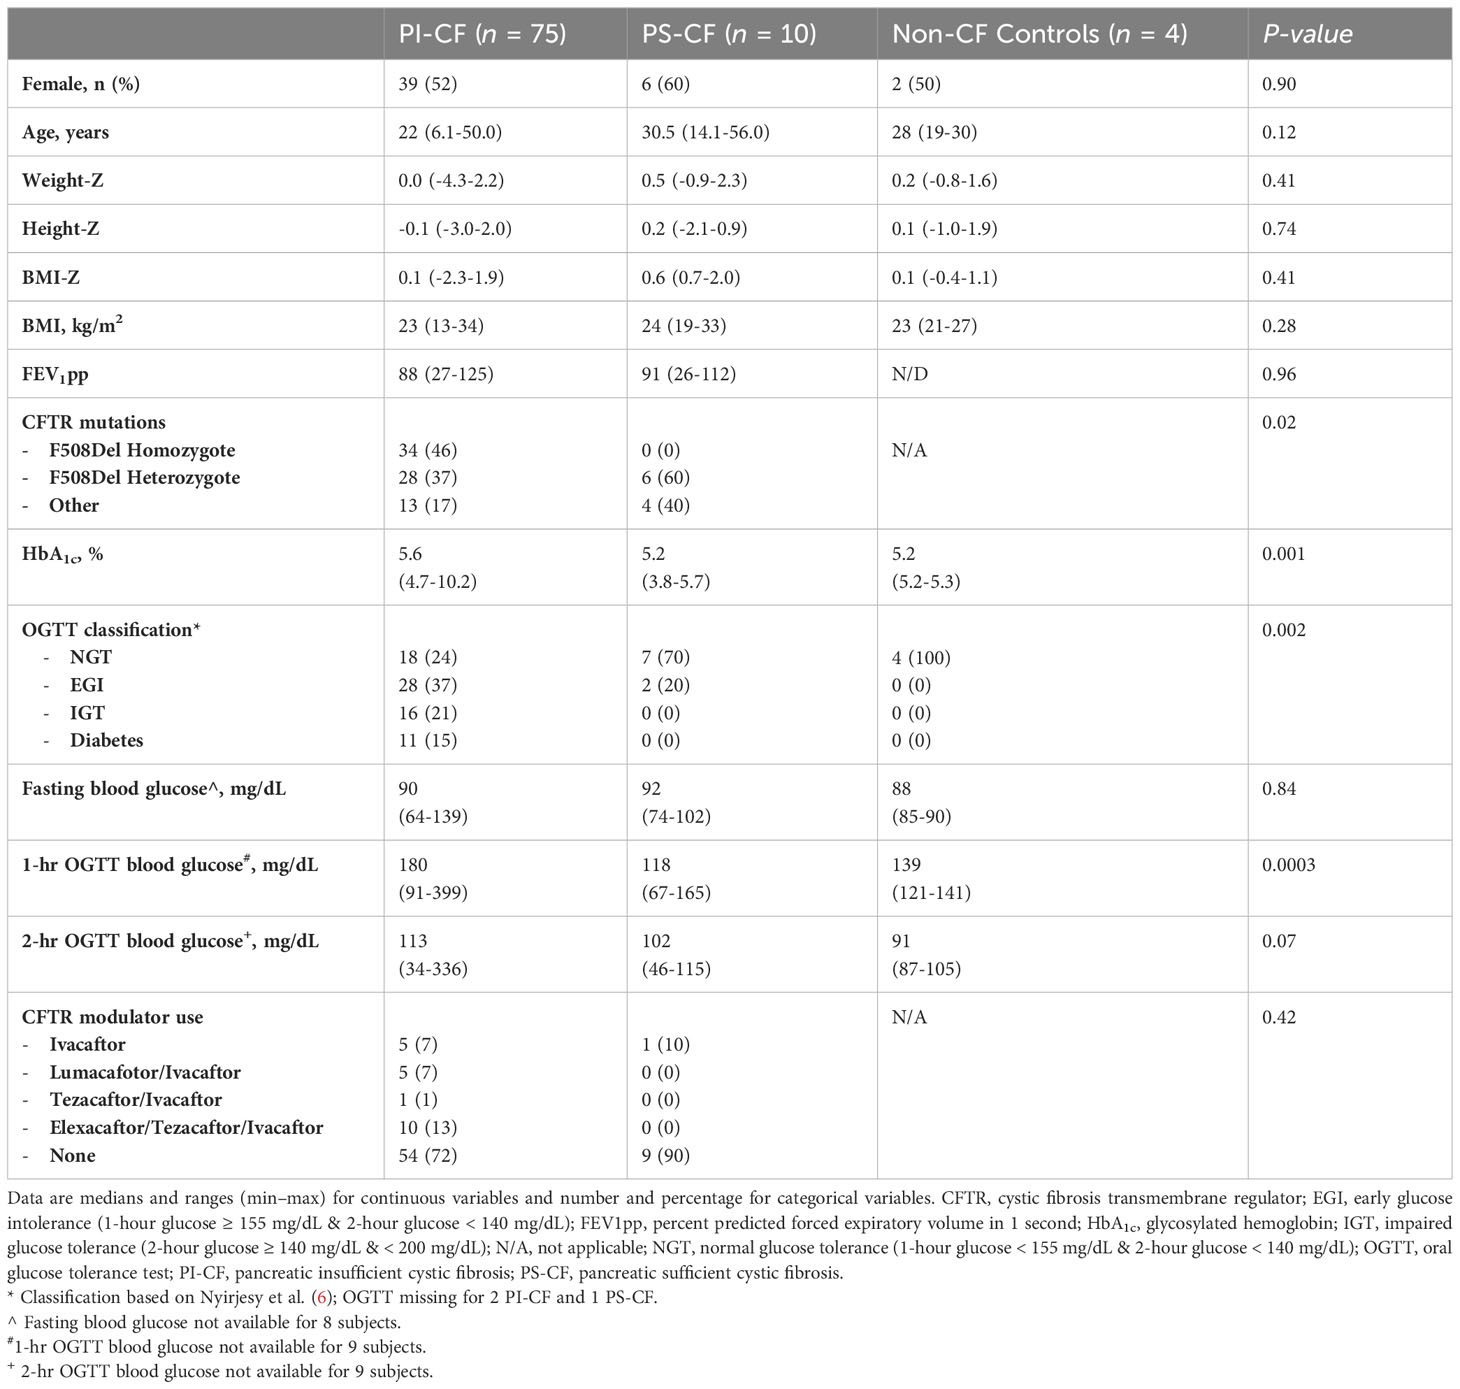
Table 1 Subject characteristics.
β-cell function with MMTT
During the first 30- and 60-min following meal ingestion, PI-CF subjects had lower ISR AUC30 min and ISR AUC60 min compared to PS-CF and non-CF controls (P < 0.05 for all comparisons; Table 2). In contrast, ISR AUC180 min was not different across groups.
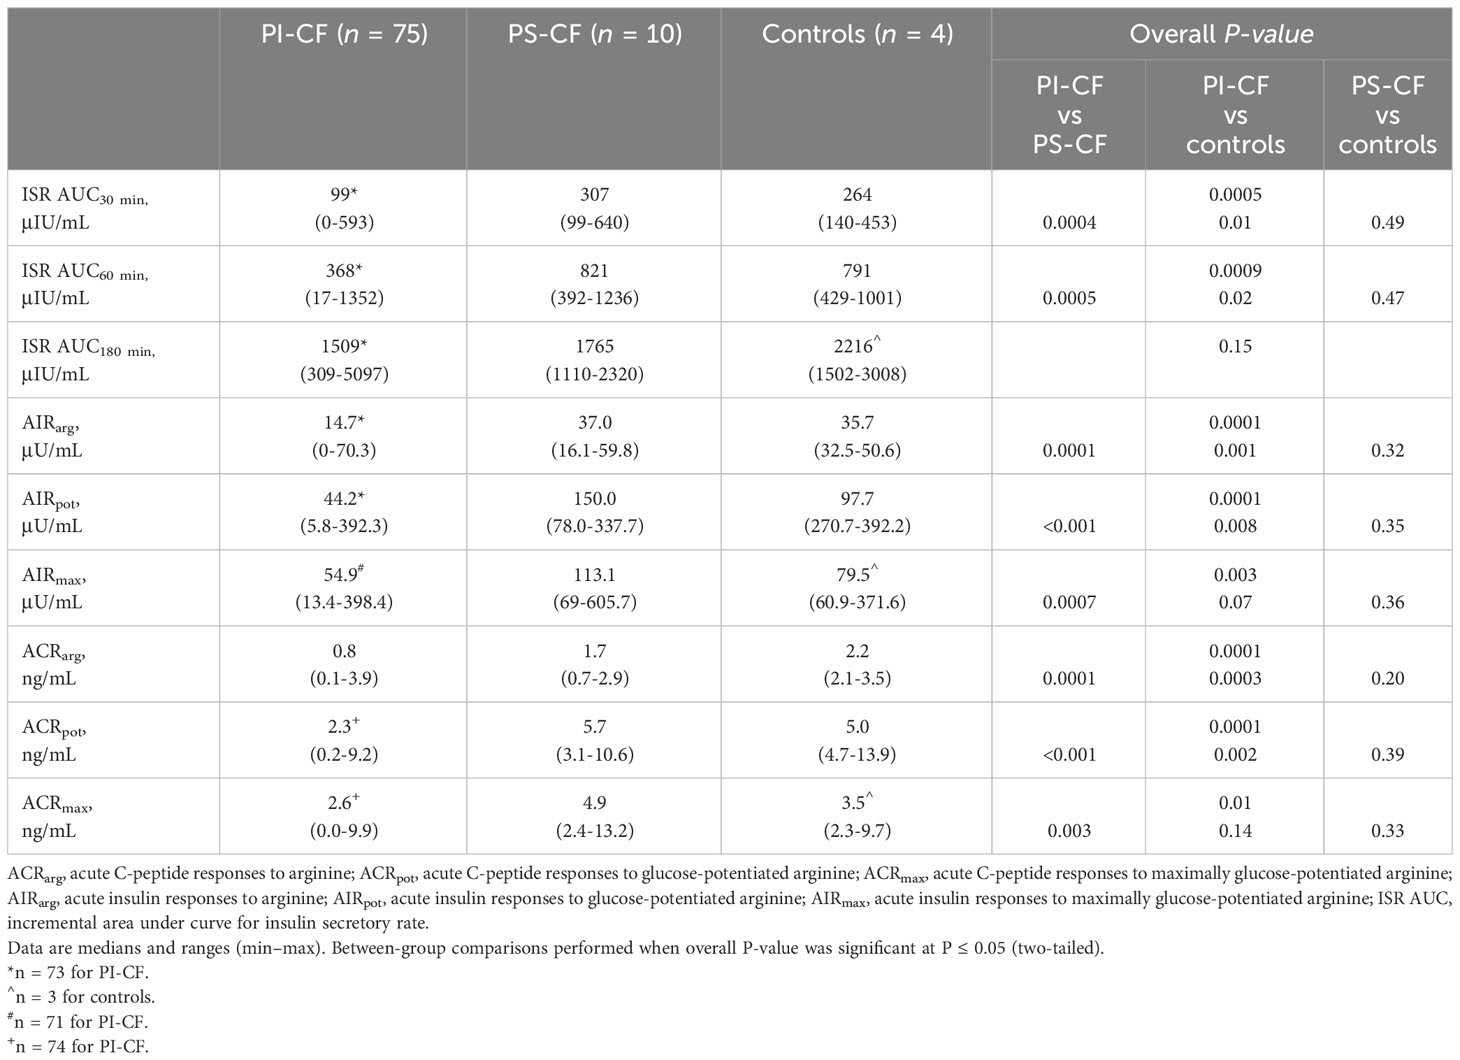
Table 2 β-cell function measures derived from the mixed-meal tolerance and glucose-potentiated arginine tests.
Within the PI-CF subjects, ISR AUC30 min and ISR AUC60 min were progressively worse with progressive impairment in glucose tolerance from NGT to CFRD (P = 0.01 and P = 0.04, respectively; data not shown), confirming previous results from a smaller cohort of 42 individuals with PI-CF (6). No differences were found in ISR AUC180 min across glucose tolerance categories within PI-CF subjects.
β-cell function and secretory capacity with GPA
During the GPA test, PI-CF subjects had lower AIRarg and AIRpot compared to PS-CF and controls (P < 0.05 for all comparisons; Table 2). AIRmax was lower in PI-CF than PS-CF (P = 0.001), but was only lower by trend in PI-CF compared to the smaller sample of non-CF controls (P = 0.14). No differences were observed in acute insulin responses between PS-CF and non-CF controls. Similar between group results were found for acute C-peptide responses at fasting (ACRarg) and under hyperglycemic clamp conditions (ACRpot and ACRmax; Table 2).
Across glucose tolerance categories in PI-CF, while AIRarg trended lower (P = 0.07), AIRpot and AIRmax were progressively lower with worsening glucose tolerance (P = 0.001 & 0.01, respectively; data not shown). Similar results were seen for acute C-peptide responses across glucose tolerance categories in PI-CF.
Comparison of β-cell function measures between MMTT and GPA
The ISR AUC30min was positively correlated with AIRarg, AIRpot and AIRmax (Figures 1A, 2A, 3A; Table 3) as well as with ACRarg, ACRpot and ACRmax (Figures 1D, 2D, 3D; Table 3).
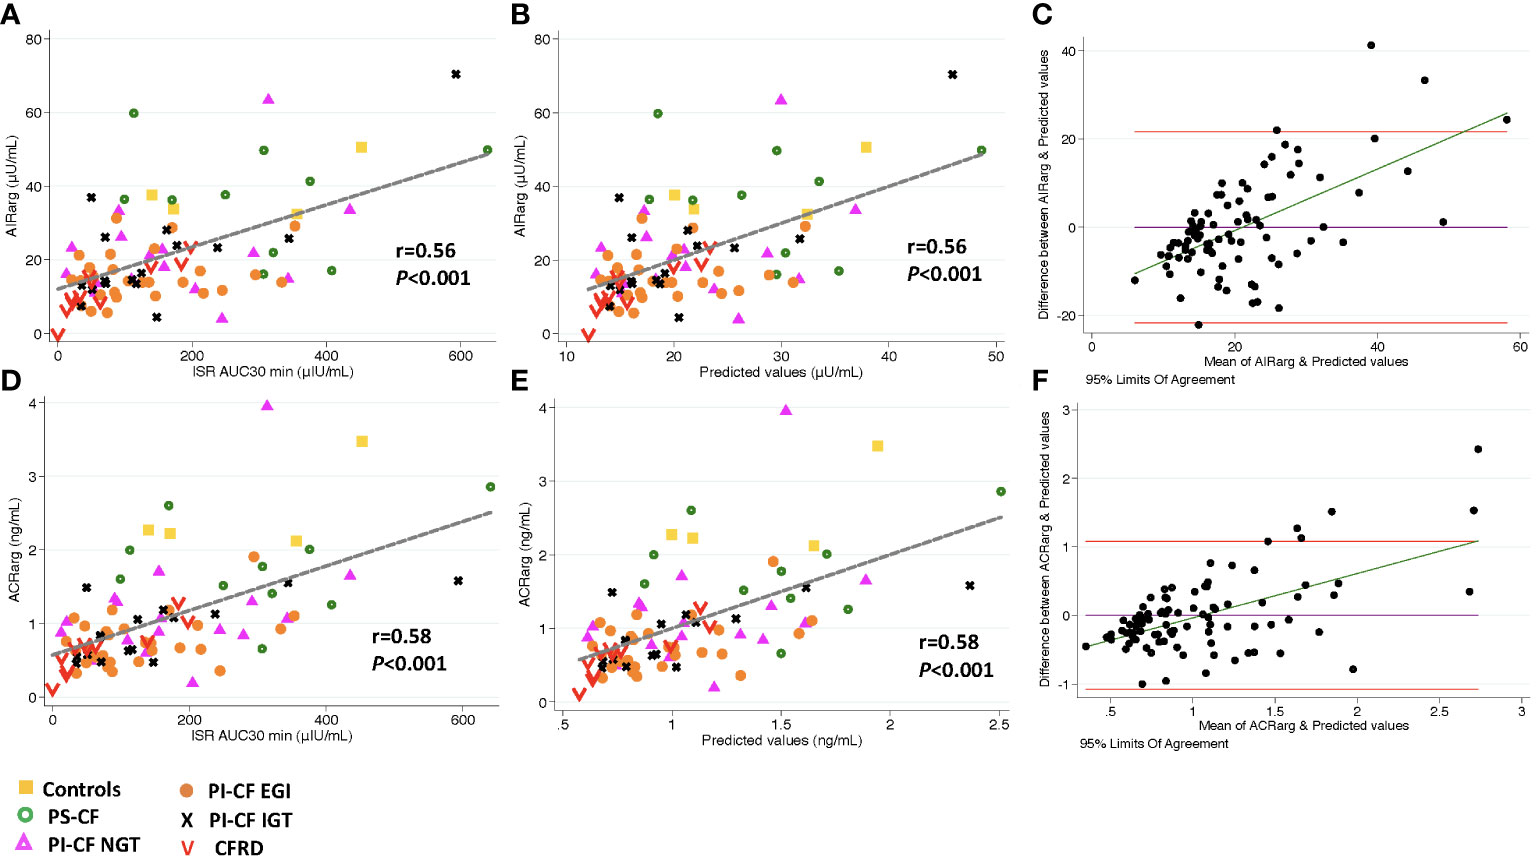
Figure 1 There is a positive correlation between AIRarg, and ISR AUC30 min [incremental area under curve for ISR at 30 min; (A)], and predicted values from linear regression modeling [(B), AIRarg=β *ISR iAUC30 min intercept]. Bland Altman plot shows increasing bias between between GPA estimated AIRarg & MMTT predicted values as mean values increase (C). Horizontal red lines depict 95% limits of agreement and green line depicts the bias. (D–F) demonstrate similar relationships for ACRarg.
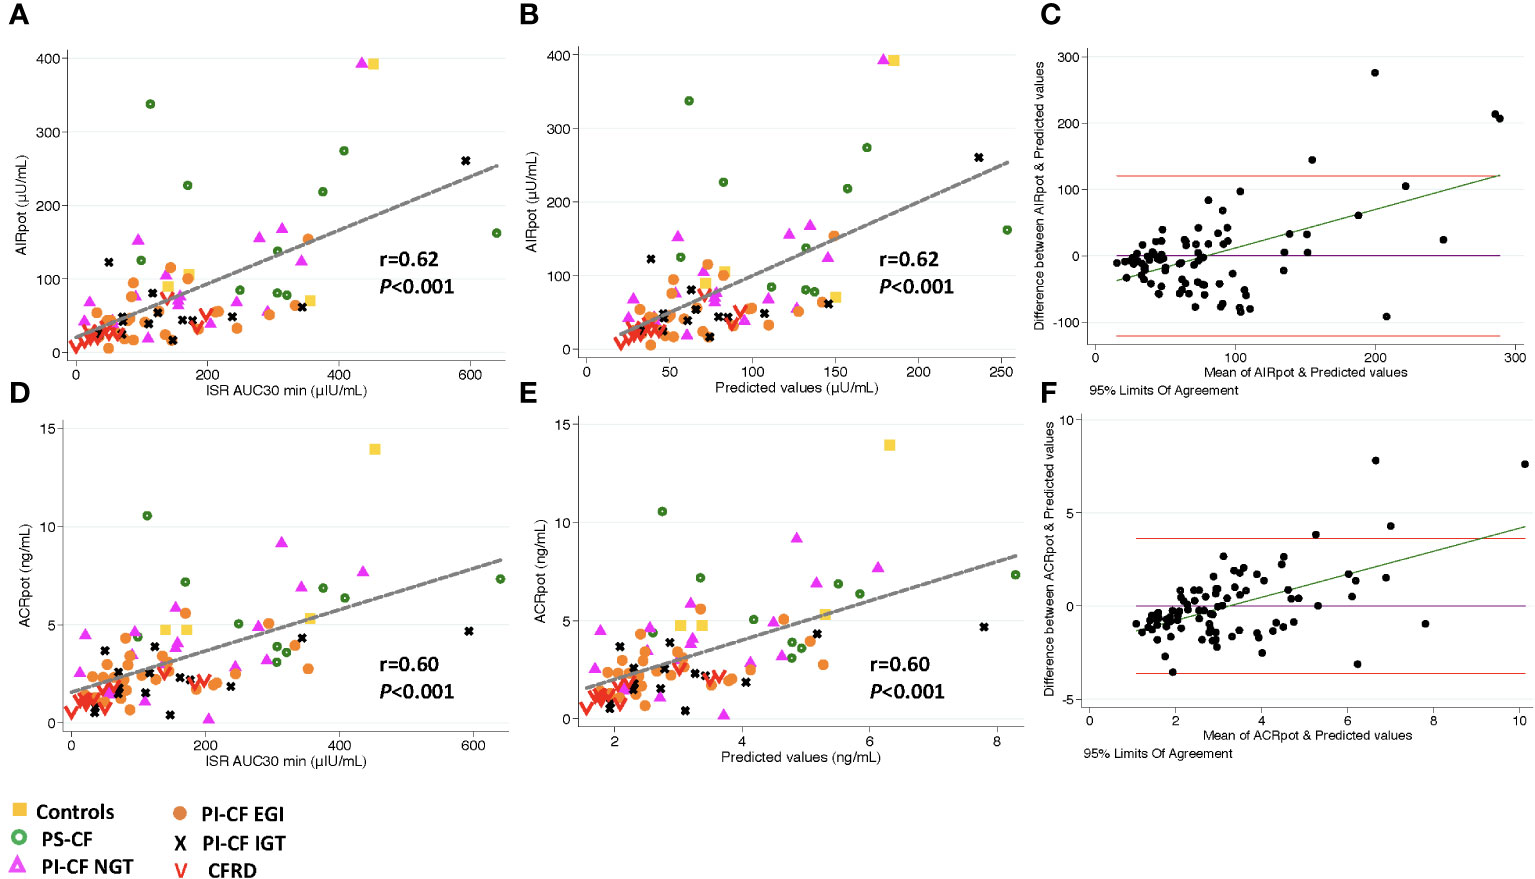
Figure 2 There is a positive correlation between AIRpot and ISR AUC30 min [incremental area under curve for ISR at 30 min; (A)], and predicted values from linear regression modeling [(B), AIRpot=β* ISR iAUC30 min + intercept]. Bland Altman plot shows increasing bias between between GPA estimated AIRpot & MMTT predicted values as the mean values increase (C). Horizontal red lines depict 95% limits of agreement and green line depicts the bias. (D–F) demonstrate similar relationships for ACRpot.

Figure 3 There is a positive correlation between AIRmax and and ISR AUC30 min [incremental area under curve for ISR at 30 min; (A)], and predicted values from linear regression modeling [(B), AIRmax=β* ISR ¡AUC30 min intercept]. Bland Altman plot shows increasing bias between between GPA estimated AIRmax & MMTT predicted values as the mean values increase (C). Horizontal red lines depict 95% limits of agreement and green line depicts the bias. (D–F) demonstrate similar relationships for ACRmax.
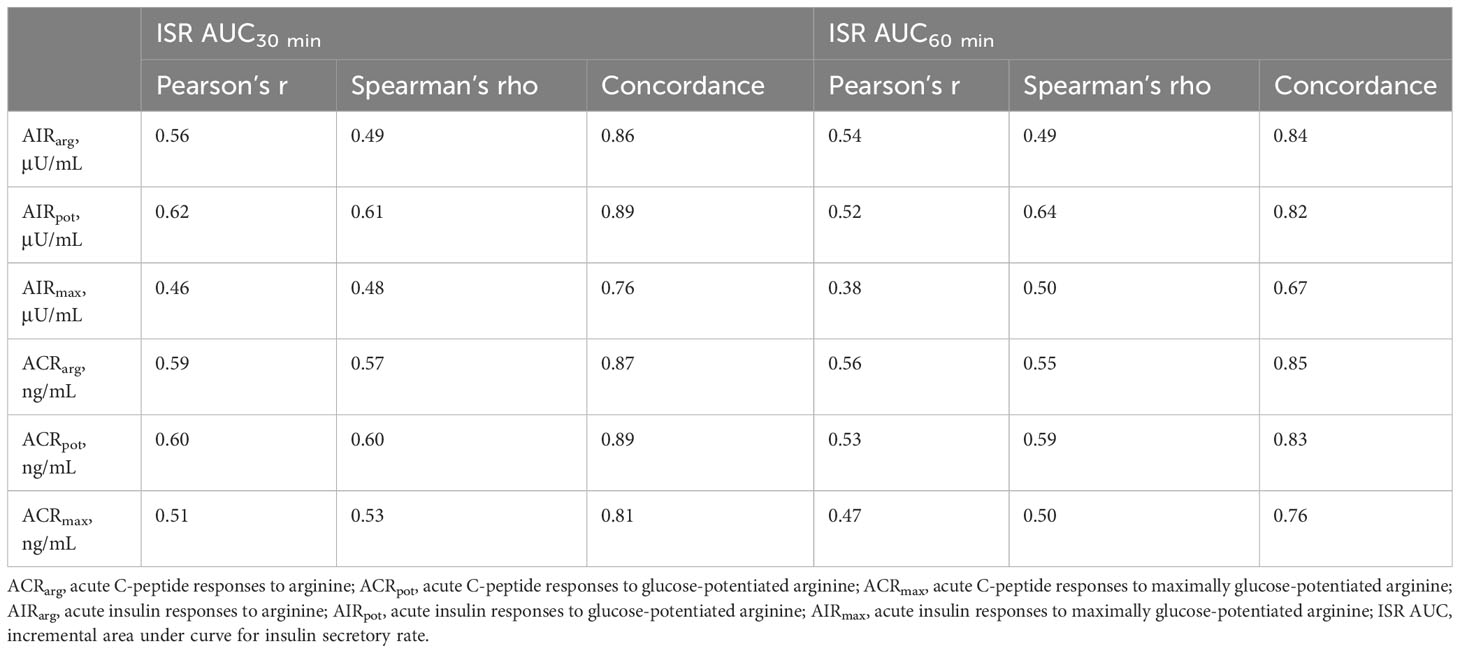
Table 3 Relationship of mixed-meal tolerance test measures of early-phase insulin secretion to glucose-potentiated arginine test measures of acute insulin and C-peptide responses.
Model predicted values from ISR AUC30 min were positively correlated to AIRarg (Pearson’s r = 0.56, P < 0.001, Figure 1B) and accurately able to predict AIRarg (concordance = 0.86, Table 3). Bland Altman analysis showed acceptable bias at lower mean AIRarg values, but as mean values increase, the bias also increases (Figure 1C). When regression models were adjusted for study group, OGTT-defined glucose tolerance category, and BMI, the results were similar, suggesting that pancreatic sufficiency status, glucose tolerance and BMI do not affect MMTT performance. Similarly, the positive and predictive relationship between ISR AUC30 min and ACRarg also demonstrates greater bias as mean values of ACRarg increase (Figures 1E, F, Table 3).
Model predicted values from ISR AUC30 min were more strongly positively correlated with AIRpot (r = 0.62; P< 0.001; Figure 2B) and very accurately predicted AIRpot (concordance = 0.89, Table 3). Bland Altman analysis again showed acceptable bias at lower mean AIRpot and increasing bias as mean values increase (Figure 2C). When regression models were adjusted for study group, OGTT-defined glucose tolerance category, and BMI, the results were similar. Results were also similar for the positive and predictive relationship between ISR AUC30 min and ACRpot, showing increasing bias with increases in ACRpot (Figures 2E, F; Table 3).
Similar to AIRarg and AIRpot, model predicted values from ISR AUC30 min were positively correlated with AIRmax (r = 0.46; P <0.001; Figure 3B) and accurately predicted AIRmax (concordance = 0.76; Table 3). Bland Altman analysis again showed acceptable bias at lower mean AIRpot that increased as mean values increased (Figure 3C). When regression models were adjusted for study group, OGTT-defined glucose tolerance category, and BMI, the results were similar. Results were also similar for the positive and predictive relationship between ISR AUC30 min and ACRmax (Figures 3E, F; Table 3).
When ISR AUC60 min was explored to model predicted values for acute insulin and C-peptide responses, very similar results were obtained for Pearson’s correlation and concordance (Table 3). In addition, AIRpot was highly correlated with AIRmax (r = 0.91; P< 0.001; Figure 4A), with a similar strong relationship between ACRpot and ACRmax (r = 0.84; P< 0.001; Figure 4B).
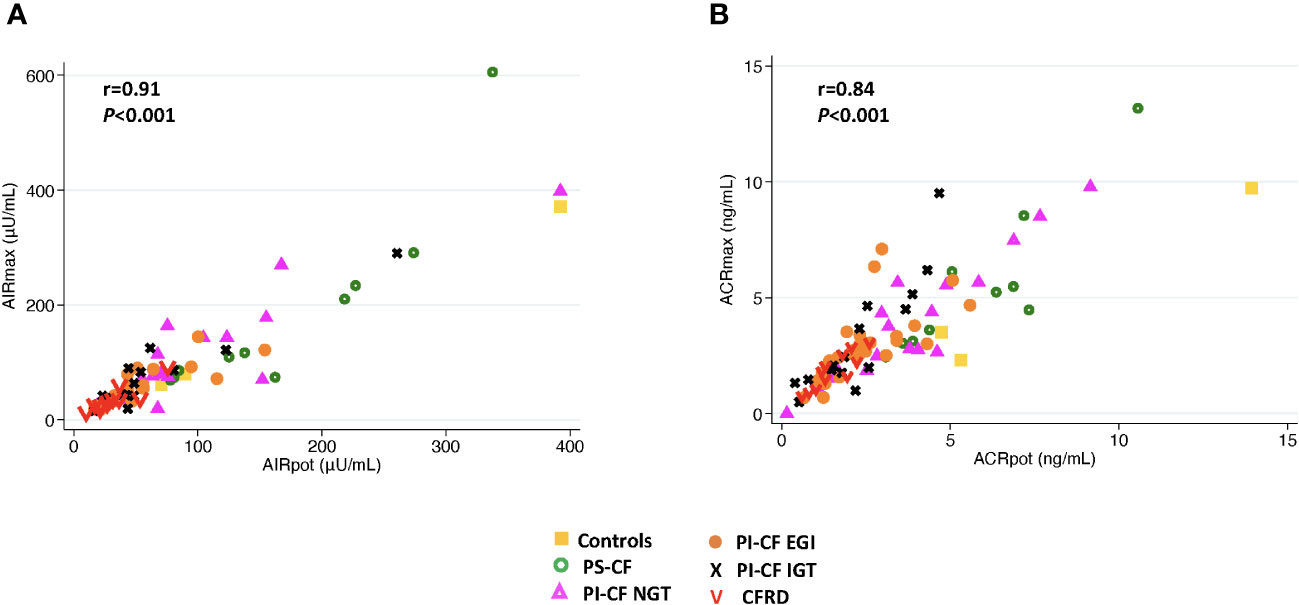
Figure 4 There is a positive correlation between AIRmax and AIRpot (A) and between ACRmax and ACRpot (B).
Discussion
These analyses tested the agreement between measures of insulin secretion derived from a MMTT, which estimates β-cell function in response to an oral challenge, and those derived from the GPA test, which estimates β-cell secretory capacity (or functional β-cell mass), in PwCF. Our data suggest that early-phase insulin secretion as defined by the ISR AUC30 min during MMTT demonstrates good agreement with β-cell secretory capacity measured from glucose-potentiation of arginine-induced insulin secretion. However, in subjects with high β-cell secretory capacity, the MMTT measure of early-phase insulin secretion is biased toward underestimating the β-cell secretory capacity. These findings suggest that early-phase insulin secretion during MMTT peaks before exhausting the reserve capacity of the β-cells for insulin secretion. Therefore, while the MMTT may not adequately assess functional β-cell mass in a fully functional pancreas, it does provide a close estimate of β-cell secretory capacity in people who have a reduced functional β-cell mass, such as PwCF and abnormal glucose tolerance (6).
β-cell secretory capacity provides the best estimate of functional β-cell mass and is measured from glucose-potentiation of insulin or C-peptide release in response to a non-glucose secretagogue, such as arginine (22). In advanced type 2 diabetes (T2D), β-cell secretory capacity is diminished without a change in β-cell sensitivity to glucose (23, 24), while early in T2D impaired β-cell sensitivity to glucose is present with relative preservation of the reserve capacity for insulin secretion that is evident with maximal glucose-potentiation (25). In contrast, we have demonstrated a decrease in β-cell secretory capacity in PI-CF subjects that progresses with worsening glucose tolerance status without any impairment in β-cell sensitivity to glucose (5, 6). These differences may be explained by a more significant defect in β-cell function than mass early in T2D, with decreased β-cell sensitivity to glucose possibly representing a protective mechanism against the potential for β-cell exhaustion induced by chronically increased demand for secretion. In contrast, the primary defect in PI-CF appears to be a reduced β-cell secretory capacity (5) which may result from a combination of reduced β-cell numbers as well as reduced ability of residual β-cells to manufacture and release insulin. The reduced β-cell secretory capacity without impairment in β-cell sensitivity to glucose observed in PI-CF has also been demonstrated in other conditions with reduced functional β-cell mass including early type 1 diabetes (T1D) (26) and islet transplant recipients (27). Importantly, in the absence of impaired β-cell sensitivity to glucose, glucose-potentiation at ~230 mg/dL is sufficient for estimation of the β-cell secretory capacity from AIRpot or ACRpot and can obviate the need for a second, ~340 mg/dL hyperglycemic clamp to obtain maximal responses AIRmax or ACRmax (28), as demonstrated in the present report for PwCF.
The main limitations to performing GPA routinely in the research setting are the technical expertise requirement and high participant burden. Both an OGTT and MMTT are easier to perform at most research centers, are standardized, and consistency can be maintained across studies. The MMTT is more physiologic than an OGTT, hence subjects experience fewer adverse effects including nausea and hypoglycemia. The MMTT also allows robust interrogation of the entero-insular axis in the stimulation of insulin secretion. Unlike GPA (and OGTT), response measures during a MMTT are affected by the degree of nutrient digestion and absorption and neurohormonal responses to nutrient ingestion including the entero-insular axis. Nutrient absorption in CF is known to be impaired in the presence of exocrine pancreatic insufficiency which is present in ~85% of PwCF (1). Furthermore, digestive problems related to pancreatic insufficiency, such as rate of gastric emptying, also impair secretion of the incretin hormones, glucagon-like peptide-1 (GLP-1) and glucose-dependent insulinotropic polypeptide (GIP), from intestinal L and K cells, respectively (29, 30). GLP-1 improves postprandial glycemia through slowing gastric emptying and glucose-dependent insulinotropic and glucagonostatic properties. GIP is insulinotropic, and can stimulate glucagon secretion (31). However, this entero-insular axis is impaired in PwCF (30, 32). The use of MMTT, rather than an OGTT, allows for more complete examination of this axis.
Diminished incretin secretion in CF may contribute to the aberrant post-prandial insulin secretion and glucose homeostasis and likely contributes to the pathophysiology of diabetes in CF (5). Pancreatic enzyme replacement therapy (PERT) improves but does not normalize GLP-1 and GIP secretion (5, 32). Inhibitors of dipeptidyl peptidase-4 (DPP-4) prevent inactivation of endogenous GLP-1 and GIP, and our group has shown that treatment of adults with PI-CF and abnormal glucose tolerance with the DPP-4 inhibitor sitagliptin for 6 months improved the rate and degree of postprandial insulin secretion during the MMTT, although did not improve post-prandial glucose tolerance (11). This favorable effect upon insulin secretion may be attributed to GLP-1 as infusion of GLP-1, but not of GIP, improves glucose-dependent β-cell insulin secretion in PI-CF (12).
The data here also demonstrate higher GPA-derived acute insulin and C-peptide responses in non-CF controls and PS-CF compared to PI-CF. While agreement between MMTT-derived ISR AUC30 min appears weaker with higher GPA measures, linear regression models did not demonstrate differences in agreement when adjusted for study group or participant glucose tolerance. The less robust relationship with higher β-cell secretory capacity is likely explained by the small number of non-CF and PS-CF subjects in our sample. A sample containing a larger number of individuals with preserved functional β-cell mass would better define the relationship between MMTT- and GPA-derived measures of β-cell function when β-cell secretory capacity is normal.
In summary, early-phase insulin secretion during a standardized MMTT can provide reliable, and robust measures of β-cell function that agree well with measures of β-cell secretory capacity derived from the more laborious and complex GPA test and may be more favorable for use in large, longitudinal observation or intervention studies across research centers. However, caution should be exercised in extrapolating MMTT ISR results in a largely healthy population in whom β-cell secretory capacity is expected to be normal by GPA, as these MMTT ISR measures may underestimate β-cell functional reserve present in a healthy pancreas.
Data availability statement
The raw data supporting the conclusions of this article will be made available by the authors, without undue reservation.
Ethics statement
The studies involving humans were approved by Institutional Review Boards of the University of Pennsylvania and the Children’s Hospital of Philadelphia. The studies were conducted in accordance with the local legislation and institutional requirements. Written informed consent for participation in this study was provided by the participants’ legal guardians/next of kin when appropriate.
Author contributions
SS: Data curation, Formal Analysis, Writing – original draft, Investigation. DS: Conceptualization, Methodology, Writing – review & editing, Formal Analysis. MK: Data curation, Investigation, Writing – review & editing. DH: Supervision, Writing – review & editing. RR: Conceptualization, Writing – review & editing. MR: Conceptualization, Funding acquisition, Investigation, Methodology, Resources, Supervision, Writing – review & editing. AK: Conceptualization, Funding acquisition, Investigation, Methodology, Resources, Supervision, Writing – review & editing.
Funding
The author(s) declare financial support was received for the research, authorship, and/or publication of this article. This work was supported by National Institutes of Health Grants K23-DK-107937 (to SS), R01-DK-97830 (to AK and MR), UL1-TR-001878 (Univ. of Pennsylvania and Children’s Hospital of Philadelphia Center for Human Phenomic Science), P30-DK-19525 (Univ. of Pennsylvania Diabetes Research Center Radioimmunoassay and Biomarkers Core), and the Cystic Fibrosis Foundation.
Acknowledgments
We are indebted to the PwCF for their participation; to the clinical research staff of the Children’s Hospital of Philadelphia-Univ. of Pennsylvania Cystic Fibrosis Center and Univ. of Pennsylvania Institute for Diabetes, Obesity & Metabolism for coordination and completion of the metabolic testing visits; to the nursing and dietary staff of the Univ. of Pennsylvania and Children’s Hospital of Philadelphia Center for Human Phenomic Science for their subject care and technical assistance; to the pharmacy staff of the Univ. of Pennsylvania Investigational Drug Service for preparation of the arginine for injection; to Dr. Heather Collins of the Univ. of Pennsylvania Diabetes Research Center Radioimmunoassay and Biomarkers Core for performance of the radioimmunoassays.
Conflict of interest
The authors declare that the research was conducted in the absence of any commercial or financial relationships that could be construed as a potential conflict of interest.
Publisher’s note
All claims expressed in this article are solely those of the authors and do not necessarily represent those of their affiliated organizations, or those of the publisher, the editors and the reviewers. Any product that may be evaluated in this article, or claim that may be made by its manufacturer, is not guaranteed or endorsed by the publisher.
References
1. Cystic Fibrosis Foundation Patient Registry Annual Data Report 2021. Bethesda, MD: Cystic Fibrosis Foundation (2022).
2. Moran A, Dunitz J, Nathan B, Saeed A, Holme B, Thomas W. Cystic fibrosis-related diabetes: current trends in prevalence, incidence, and mortality. Diabetes Care. (2009) 32:1626–31. doi: 10.2337/dc09-0586.
3. ElSayed NA, Aleppo G, Aroda VR, Bannuru RR, Brown FM, Bruemmer D, et al. 2. Classification and diagnosis of diabetes: standards of care in diabetes-2023. Diabetes Care. (2023) 46:S19–40. doi: 10.2337/dc23-S002.
4. Marshall BC, Butler SM, Stoddard M, Moran AM, Liou TG, Morgan WJ. Epidemiology of cystic fibrosis-related diabetes. J Pediatr. (2005) 146:681–7. doi: 10.1016/j.jpeds.2004.12.039.
5. Sheikh S, Gudipaty L, De Leon DD, Hadjiliadis D, Kubrak C, Rosenfeld NK, et al. Reduced beta-Cell Secretory Capacity in Pancreatic-Insufficient, but Not Pancreatic-Sufficient, Cystic Fibrosis Despite Normal Glucose Tolerance. Diabetes. (2017) 66:134–44. doi: 10.2337/db16-0394.
6. Nyirjesy SC, Sheikh S, Hadjiliadis D, De Leon DD, Peleckis AJ, Eiel JN, et al. beta-Cell secretory defects are present in pancreatic insufficient cystic fibrosis with 1-hour oral glucose tolerance test glucose >/=155 mg/dL. Pediatr Diabetes. (2018) 19:1173–82. doi: 10.1111/pedi.12700.
7. Kelly A, Moran A. Update on cystic fibrosis-related diabetes. J Cyst Fibros. (2013) 12:318–31. doi: 10.1016/j.jcf.2013.02.008.
8. Rickels MR, Norris AW, Hull RL. A tale of two pancreases: exocrine pathology and endocrine dysfunction. Diabetologia. (2020) 63:2030–9. doi: 10.1007/s00125-020-05210-8.
9. Kahn SE, Carr DB, Faulenbach MV, Utzschneider KM. An examination of beta-cell function measures and their potential use for estimating beta-cell mass. Diabetes Obes Metab. (2008) 10 Suppl 4:63–76. doi: 10.1111/j.1463-1326.2008.00945.x.
10. Kelly A, De Leon DD, Sheikh S, Camburn D, Kubrak C, Peleckis AJ, et al. Islet hormone and incretin secretion in cystic fibrosis after four months of ivacaftor therapy. Am J Respir Crit Care Med. (2019) 199:342–51. doi: 10.1164/rccm.201806-1018OC.
11. Kelly A, Sheikh S, Stefanovski D, Peleckis AJ, Nyirjesy SC, Eiel JN, et al. Effect of sitagliptin on islet function in pancreatic insufficient cystic fibrosis with abnormal glucose tolerance. J Clin Endocrinol Metab. (2021) 106:2617–34. doi: 10.1210/clinem/dgab365.
12. Nyirjesy SC, Peleckis AJ, Eiel JN, Gallagher K, Doliba A, Tami A, et al. Effects of GLP-1 and GIP on islet function in glucose-intolerant, pancreatic-insufficient cystic fibrosis. Diabetes. (2022) 71:2153–65. doi: 10.2337/db22-0399.
13. Cobelli C, Dalla Man C, Toffolo G, Basu R, Vella A, Rizza R. The oral minimal model method. Diabetes. (2014) 63:1203–13. doi: 10.2337/db13-1198.
14. Farrell PM, White TB, Ren CL, Hempstead SE, Accurso F, Derichs N, et al. Diagnosis of cystic fibrosis: consensus guidelines from the cystic fibrosis foundation. J Pediatr. (2017) 181S:S4–S15 e1. doi: 10.1016/j.jpeds.2016.09.064.
15. Vollmer K, Holst JJ, Baller B, Ellrichmann M, Nauck MA, Schmidt WE, et al. Predictors of incretin concentrations in subjects with normal, impaired, and diabetic glucose tolerance. Diabetes. (2008) 57:678–87. doi: 10.2337/db07-1124.
16. Seaquist ER, Robertson RP. Effects of hemipancreatectomy on pancreatic alpha and beta cell function in healthy human donors. J Clin Invest. (1992) 89:1761–6. doi: 10.1172/JCI115779.
17. Guldstrand M, Ahren B, Adamson U. Improved beta-cell function after standardized weight reduction in severely obese subjects. Am J Physiol Endocrinol Metab. (2003) 284:E557–65. doi: 10.1152/ajpendo.00325.2002.
18. Gudipaty L, Rosenfeld NK, Fuller CS, Gallop R, Schutta MH, Rickels MR. Effect of exenatide, sitagliptin, or glimepiride on beta-cell secretory capacity in early type 2 diabetes. Diabetes Care. (2014) 37:2451–8. doi: 10.2337/dc14-0398.
19. Ward WK, Halter JB, Beard JC, Porte D Jr. Adaptation of B and A cell function during prolonged glucose infusion in human subjects. Am J Physiol. (1984) 246:E405–11. doi: 10.1152/ajpendo.1984.246.5.E405.
20. Larsson H, Ahren B. Glucose-dependent arginine stimulation test for characterization of islet function: studies on reproducibility and priming effect of arginine. Diabetologia. (1998) 41:772–7. doi: 10.1007/s001250050986.
21. Toffolo G, Breda E, Cavaghan MK, Ehrmann DA, Polonsky KS, Cobelli C. Quantitative indexes of beta-cell function during graded up&down glucose infusion from C-peptide minimal models. Am J Physiol Endocrinol Metab. (2001) 280:E2–10. doi: 10.1152/ajpendo.2001.280.1.E2
22. Robertson RP, Raymond RH, Lee DS, Calle RA, Ghosh A, Savage PJ, et al. Arginine is preferred to glucagon for stimulation testing of beta-cell function. Am J Physiol Endocrinol Metab. (2014) 307:E720–7. doi: 10.1152/ajpendo.00149.2014.
23. Ward WK, Bolgiano DC, McKnight B, Halter JB, Porte D Jr. Diminished B cell secretory capacity in patients with noninsulin-dependent diabetes mellitus. J Clin Invest. (1984) 74:1318–28. doi: 10.1172/JCI111542.
24. Van Haeften TW, Van Maarschalkerweerd WW, Gerich JE, van der Veen EA. Decreased insulin secretory capacity and normal pancreatic B-cell glucose sensitivity in non-obese patients with NIDDM. Eur J Clin Invest. (1991) 21:168–74. doi: 10.1111/j.1365-2362.1991.tb01806.x
25. Gudipaty L, Rosenfeld NK, Fuller CS, Cuchel M, Rickels MR. Different beta-cell secretory phenotype in non-obese compared to obese early type 2 diabetes. Diabetes Metab Res Rev. (2020) 36:e3295. doi: 10.1002/dmrr.3295.
26. Greenbaum CJ, Prigeon RL, D’Alessio DA. Impaired beta-cell function, incretin effect, and glucagon suppression in patients with type 1 diabetes who have normal fasting glucose. Diabetes. (2002) 51:951–7. doi: 10.2337/diabetes.51.4.951.
27. Rickels MR, Mueller R, Teff KL, Naji A. {beta}-Cell secretory capacity and demand in recipients of islet, pancreas, and kidney transplants. J Clin Endocrinol Metab. (2010) 95:1238–46. doi: 10.1210/jc.2009-2289.
28. Rickels MR, Naji A, Teff KL. Acute insulin responses to glucose and arginine as predictors of beta-cell secretory capacity in human islet transplantation. Transplantation. (2007) 84:1357–60. doi: 10.1097/01.tp.0000287595.16442.a7.
29. Hillman M, Eriksson L, Mared L, Helgesson K, Landin-Olsson M. Reduced levels of active GLP-1 in patients with cystic fibrosis with and without diabetes mellitus. J Cyst Fibros. (2012) 11:144–9. doi: 10.1016/j.jcf.2011.11.001.
30. Kuo P, Stevens JE, Russo A, Maddox A, Wishart JM, Jones KL, et al. Gastric emptying, incretin hormone secretion, and postprandial glycemia in cystic fibrosis–effects of pancreatic enzyme supplementation. J Clin Endocrinol Metab. (2011) 96:E851–5. doi: 10.1210/jc.2010-2460.
31. Nauck MA, Holst JJ, Willms B, Schmiegel W. Glucagon-like peptide 1 (GLP-1) as a new therapeutic approach for type 2-diabetes. Exp Clin Endocrinol Diabetes. (1997) 105:187–95. doi: 10.1055/s-0029-1211750.
32. Perano SJ, Couper JJ, Horowitz M, Martin AJ, Kritas S, Sullivan T, et al. Pancreatic enzyme supplementation improves the incretin hormone response and attenuates postprandial glycemia in adolescents with cystic fibrosis: a randomized crossover trial. J Clin Endocrinol Metab. (2014) 99:2486–93. doi: 10.1210/jc.2013-4417.
Keywords: insulin secretion, beta-cell function, beta-cell secretory capacity, cystic fibrosis, pancreatic insufficiency, cystic fibrosis-related diabetes
Citation: Sheikh S, Stefanovski D, Kilberg MJ, Hadjiliadis D, Rubenstein RC, Rickels MR and Kelly A (2024) Early-phase insulin secretion during mixed-meal tolerance testing predicts β-cell function and secretory capacity in cystic fibrosis. Front. Endocrinol. 15:1340346. doi: 10.3389/fendo.2024.1340346
Received: 17 November 2023; Accepted: 05 February 2024;
Published: 20 February 2024.
Edited by:
Xingshen Sun, The University of Iowa, United StatesReviewed by:
Valeria Grancini, Fondazione IRCCS Ca’ Granda Ospedale Maggiore Policlinico, ItalyBrittany Bruggeman, University of Florida, United States
Copyright © 2024 Sheikh, Stefanovski, Kilberg, Hadjiliadis, Rubenstein, Rickels and Kelly. This is an open-access article distributed under the terms of the Creative Commons Attribution License (CC BY). The use, distribution or reproduction in other forums is permitted, provided the original author(s) and the copyright owner(s) are credited and that the original publication in this journal is cited, in accordance with accepted academic practice. No use, distribution or reproduction is permitted which does not comply with these terms.
*Correspondence: Michael R. Rickels, cmlja2Vsc0BwZW5ubWVkaWNpbmUudXBlbm4uZWR1; Andrea Kelly, a2VsbHlhQGNob3AuZWR1