- 1College of Traditional Chinese Medicine, Changchun University of Chinese Medicine, Changchun, China
- 2Department of Liver, Spleen and Gastroenterology, First Affiliated Hospital to Changchun University of Chinese Medicine, Changchun, China
- 3Department of Intensive Care Unit, Changchun Tongyuan Hospital, Changchun, China
Background and aim: Metabolic-associated fatty liver disease (MAFLD) has gradually become one of the main health concerns regarding liver diseases. Postmenopausal women represent a high-risk group for MAFLD; therefore, it is of great importance to identify and intervene with patients at risk at an early stage. This study established a predictive nomogram model of MAFLD in postmenopausal women and to enhance the clinical utility of the new model, the researchers limited variables to simple clinical and laboratory indicators that are readily obtainable.
Methods: Data of 942 postmenopausal women from January 2023 to October 2023 were retrospectively collected and divided into two groups according to the collection time: the training group (676 cases) and the validation group (226 cases). Significant indicators independently related to MAFLD were identified through univariate logistic regression and stepwise regression, and the MAFLD prediction nomogram was established. The C-index and calibration curve were used to quantify the nomogram performance, and the model was evaluated by measuring the area under the receiver operating characteristic curve (AUC), calibration curve, and decision curve analysis (DCA).
Results: Of 37 variables, 11 predictors were identified, including occupation (worker), body mass index, waist-to-hip ratio, number of abortions, anxiety, hypertension, hyperlipidemia, diabetes, hyperuricemia, and diet (meat and processed meat). The C-index of the training group predicting the related risk factors was 0.827 (95% confidence interval [CI] 0.794–0.860). The C-index of the validation group was 0.787 (95% CI 0.728–0.846). Calibration curves 1 and 2 (BS1000 times) were close to the diagonal, showing a good agreement between the predicted probability and the actual incidence in the two groups. The AUC of the training group was 0.827, the sensitivity was 0.784, and the specificity was 0.735. The AUC of the validation group was 0.787, the sensitivity was 0.674, and the specificity was 0.772. The DCA curve showed that the nomogram had a good net benefit in predicting MAFLD in postmenopausal women.
Conclusions: A predictive nomogram for MAFLD in postmenopausal women was established and verified, which can assist clinicians in evaluating the risk of MAFLD at an early stage.
1 Introduction
Nonalcoholic fatty liver disease (NAFLD) is a type of clinical-histopathological condition characterized by fat accumulation in hepatocytes, with or without accompanying inflammation, necrosis, and even fibrosis. Globally, the incidence of NAFLD is increasing rapidly, with significant differences observed between men and women (1). Compared with men of the same age, the prevalence rate of NAFLD in premenopausal women is lower; however, this trend reverses after menopause (2, 3). A cross-sectional study in China, which included 9,360 women, found that the incidence of NAFLD was 5.3% in women under 45 years old, 18.8% in women aged 45–55 years, and increased to 27.8% in women over 55 years old (4). With China’s aging population, an increasing number of women are entering the postmenopausal stage, which significantly elevates the risk of liver-related diseases.
To date, the pathogenesis of NAFLD remains ill-defined. Theories of insulin resistance and a “second strike” are widely accepted. Thus, the diagnosis of NAFLD typically relies on exclusion criteria. The gold-standard method for the diagnosis of NAFLD is liver biopsy (5), but it is difficult to achieve in clinical practice owing to its invasive nature. Furthermore, magnetic resonance spectroscopy (MRS) and computed tomography (CT) are difficult to use as early screening methods for NAFLD, owing to their high cost. Ultrasonography (US) is the most common diagnostic method in clinical practice, but its subjectivity leads to significant differences in the findings made by different operators (6), which reduces its sensitivity for the detection of mild fatty liver (7). In 2020, a consensus statement from international experts proposed renaming the condition to metabolic-associated fatty liver disease (MAFLD) and recommended using a combination of imaging and risk factors as the diagnostic standard (8). This new approach has improved the detection rate of MAFLD and underscored the importance of risk factors in its diagnosis.
MAFLD is not just a progressive liver disease; it also contributes to other systemic diseases, particularly cardiovascular diseases (9), which seriously affect the health of postmenopausal women. Owing to the lack of specific clinical symptoms of MAFLD, it is often diagnosed incidentally during physical examination, but it frequently involves inflammatory changes and even fibrosis in the liver. Therefore, it is important to establish a diagnostic prediction model based on easily collected data, such as physical findings, lifestyle, and medical history, which could be readily used by medical institutions such as clinics and community hospitals for the early screening of populations at high risk for MAFLD. This study aimed to analyze MAFLD-related risk factors in postmenopausal women and establish a predictive nomogram to identify high-risk individuals at an early stage.
2 Materials and methods
2.1 Patient selection
The data of postmenopausal women in Northeast China from January 2023 to October 2023 were collected retrospectively. The diagnosis of MAFLD was based on the presence of steatosis on color Doppler ultrasound accompanied by any of the following conditions: overweight or obesity, diabetes, and metabolic dysfunction. Metabolic dysfunction must meet at least two of the following conditions: 1) waist circumference ≥80 cm; 2) hypertension; 3) plasma triglyceride levels ≥1.70 mmol/L or receiving specific drug treatment; 4) high-density lipoprotein cholesterol ≤1.3 mmol/L; 5) pre-diabetes; 6) high-sensitivity C-reactive protein >2 mg/L (5). This study was approved by the Ethics Committee of the First Affiliated Hospital to Changchun University of Chinese Medicine. All patients consented to the use of their data for the study. No patient received financial compensation.
The inclusion criteria were as follows: women who have been postmenopausal for more than 1 year. The exclusion criteria were as follows (1): unnatural menopause (hysterectomy, ovariectomy, chemotherapy leading to ovarian failure, etc.) (2); specific liver diseases such as viral hepatitis, Wilson’s disease, autoimmune liver disease and drug-induced liver disease that can lead to abnormal liver function (3); a long-term drinking history, generally more than 5 years, with an average daily alcohol consumption in the past 12 months >20 g, or a significant drinking history within the last 2 weeks with an equivalent alcohol consumption of >80 g/d (4); patients with the following medical history are excluded: significant weight loss due to metabolism, history of malignant tumor, history of glucocorticoid treatment, history of intake of medications that affect insulin secretion and sensitivity; or (5) coexisting important organ diseases or serious mental disorders that prevent cooperation with the investigation.
2.2 Data collection
This study adopted the field questionnaire survey method. Based on the Clinical Research Guidelines of Metabolic Fatty Liver Disease of the Asia-Pacific Liver Research Association, the Dietary Guidelines for China Residents (2022), and related literature, risk factors were identified and classified, including the patient’s general information (name, age, occupation, education level, and exercise habits), eating habits (cereals, fruits, vegetables, meat and eggs, milk, and processed meat), metabolic risk factors (history of smoking, sleep status, history of hypertension, history of hyperlipidemia, history of diabetes, and history of hyperuricemia), and physical condition. The food frequency questionnaire (FFQ) method was used to assess eating habits. After rigorous training, investigators interviewed respondents and completed the questionnaires to collect data on the frequency of eating and portion sizes of various foods consumed by the respondents in the past 6 months. The FFQ was designed with reference to the common food classifications in Northeast China, including 10 categories and 28 items, ultimately determining the daily intake of each food category.
2.3 Statistical analysis
Data entry was performed using Excel. During model development, 942 women were divided into the training group (676 women from January 2023 to July 2023) and validation group (266 women from August 2023 to October 2023) according to the time of case collection. The training dataset was used to develop the model, and the validation dataset was used for external validation. According to Harrell’s (10) guidelines, the final number of variables used for binary logistic regression should not exceed 10% of the number of cases. In the present study, the prediction group included 227 women with MALFD and 449 women without MAFLD. Therefore, the final number of predictors included should not have exceeded 22. The risk factors were analyzed using univariate logistic regression and stepwise regression to eliminate statistically insignificant variables. The coefficient of variance inflation factor (VIF) was utilized to assess the severity of multicollinearity in the multivariate linear regression model, and significant variables were included in the multivariate logistic regression model to identify predictive factors. A nomogram was constructed to build a predictive model, and the nomogram’s performance was evaluated through the calibration of the consistency index (C-index) and 1000 bootstrap samples to minimize overfitting bias. The receiver operating characteristic curve was plotted to assess the internal validity of the prediction model. C-index and area under the receiver operating characteristic (ROC) curve (AUC) values range from 0.5 to 1.0, with 0.5 indicating a random probability and 1.0 indicating perfect fitting. Generally, a C-index and AUC value above 0.7 suggest that the prediction is reliable. A decision curve analysis (DCA) was conducted to evaluate the utility of the clinical prediction model. A P value < 0.05 was considered significant. All analyses were performed using R, version 4.3.0.
3 Results
3.1 General information on patients and univariate logistic regression
The clinicopathologic variables in this study are reported in Table 1. During the study period, we enrolled 942 eligible postmenopausal women with an average age of 59.68 years. According to the diagnostic criteria, 313 women were diagnosed with MAFLD, and the incidence rate was 33.23%. The training group had 676 women, with an average age of 59.66 years, and 227 women with MAFLD (33.58%). The validation group had 266 women, with an average age of 59.70 years, and 86 women had MAFLD (32.33%). No significant differences were observed between the two datasets with regard to baseline characteristics (P > 0.05; Figures 1A, B). Univariate analysis was used to analyze the risk factors related to fatty liver in postmenopausal women in the training group. Using P < 0.1 as the threshold, 20 variables were selected, including age, occupation (workers, housework, employees, and farmers), waist-to-hip ratio, waist-to-height ratio, years since menopause, number of abortions, weight change before and after menopause, body mass index (BMI), hypertension, hyperlipidemia, diabetes, hyperuricemia, Pittsburgh Sleep Quality Index, anxiety, and diet (fruit, meat, and processed meat).
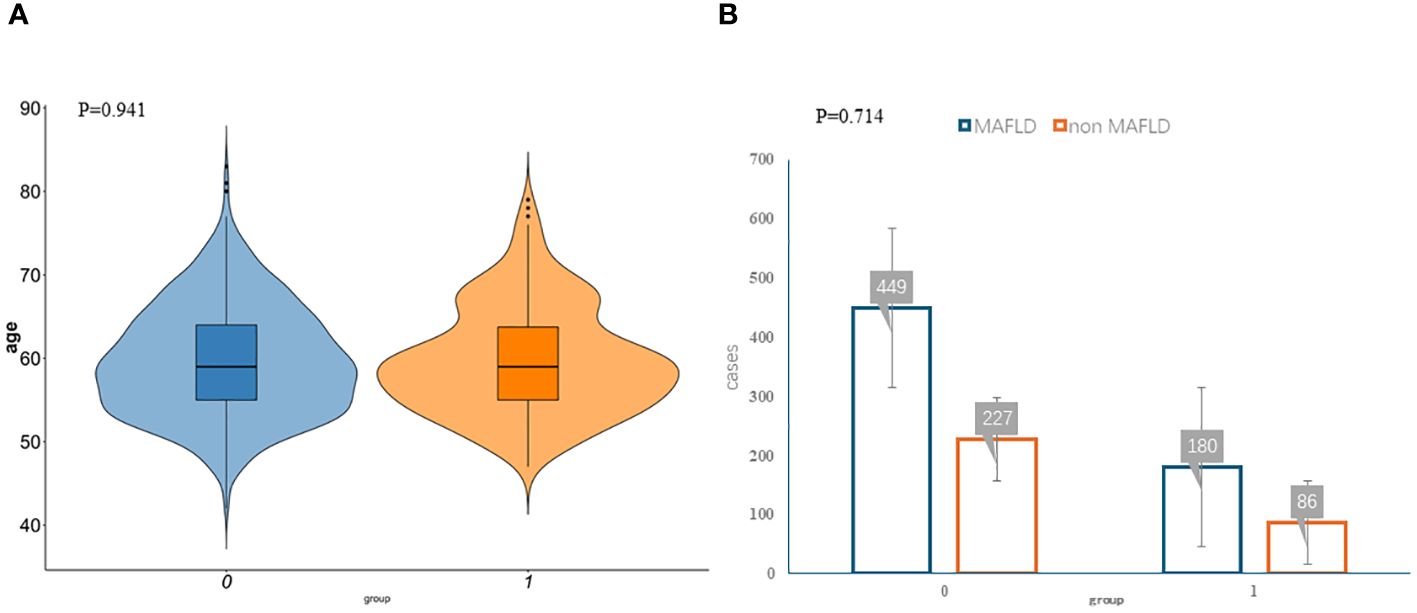
Figure 1 Participant characteristics. The violin plots (A) and bar plots (B) suggest no significant differences between the two data sets. Group:0 means training group,1 means validation group.
3.2 Selection of predictors of fatty liver in postmenopausal women
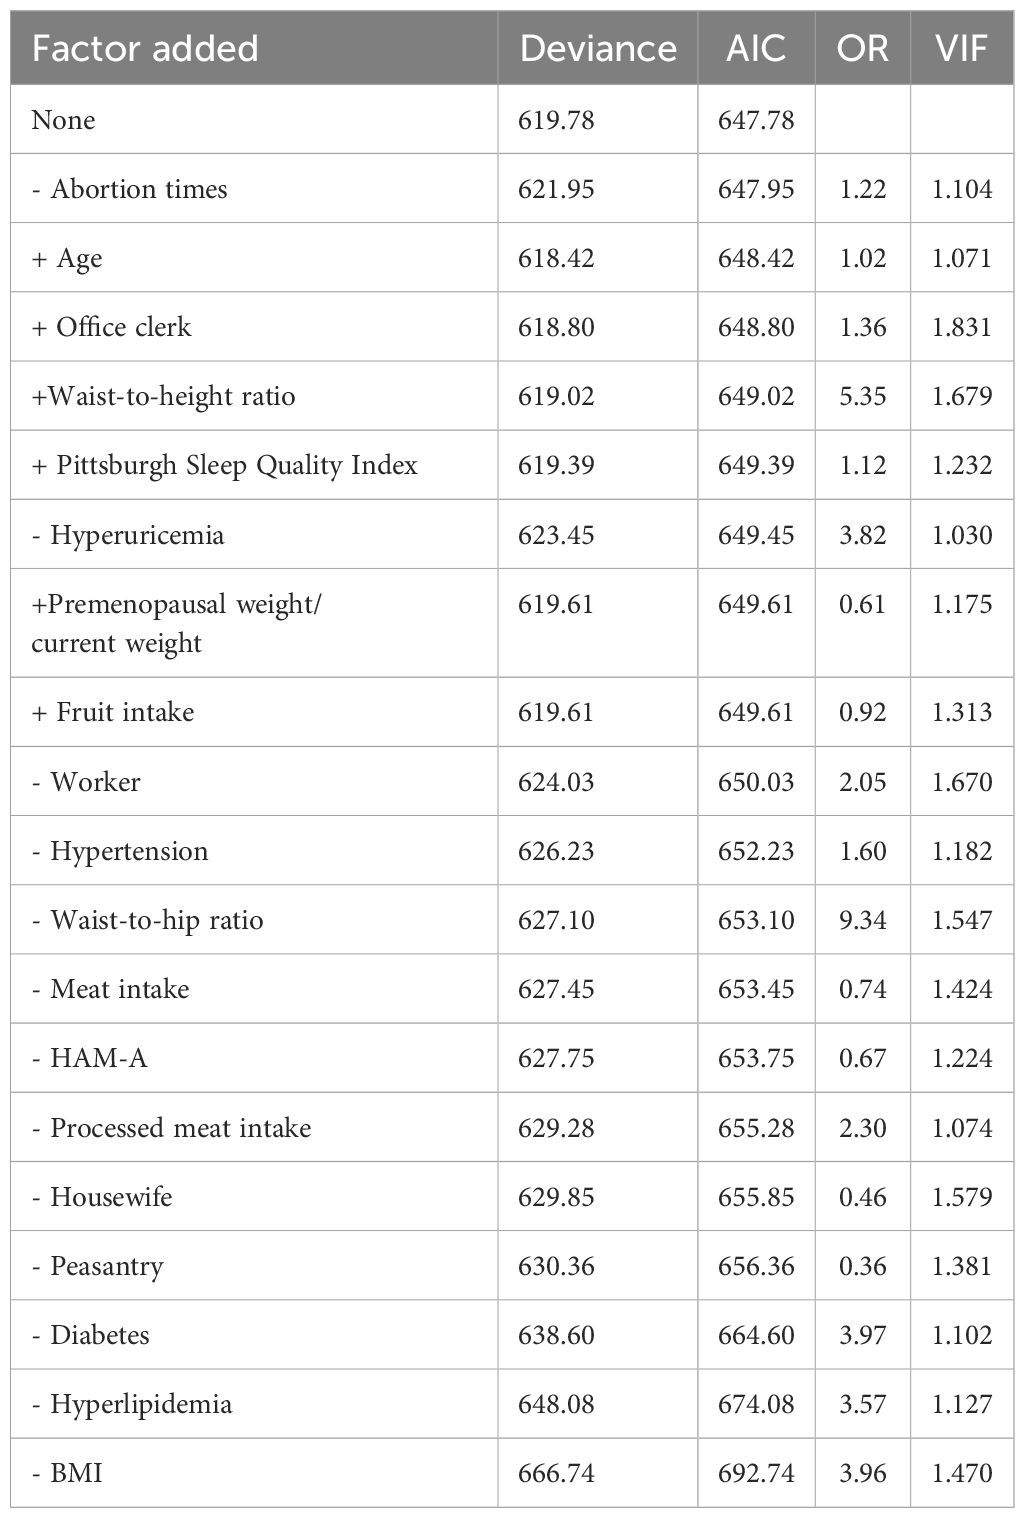
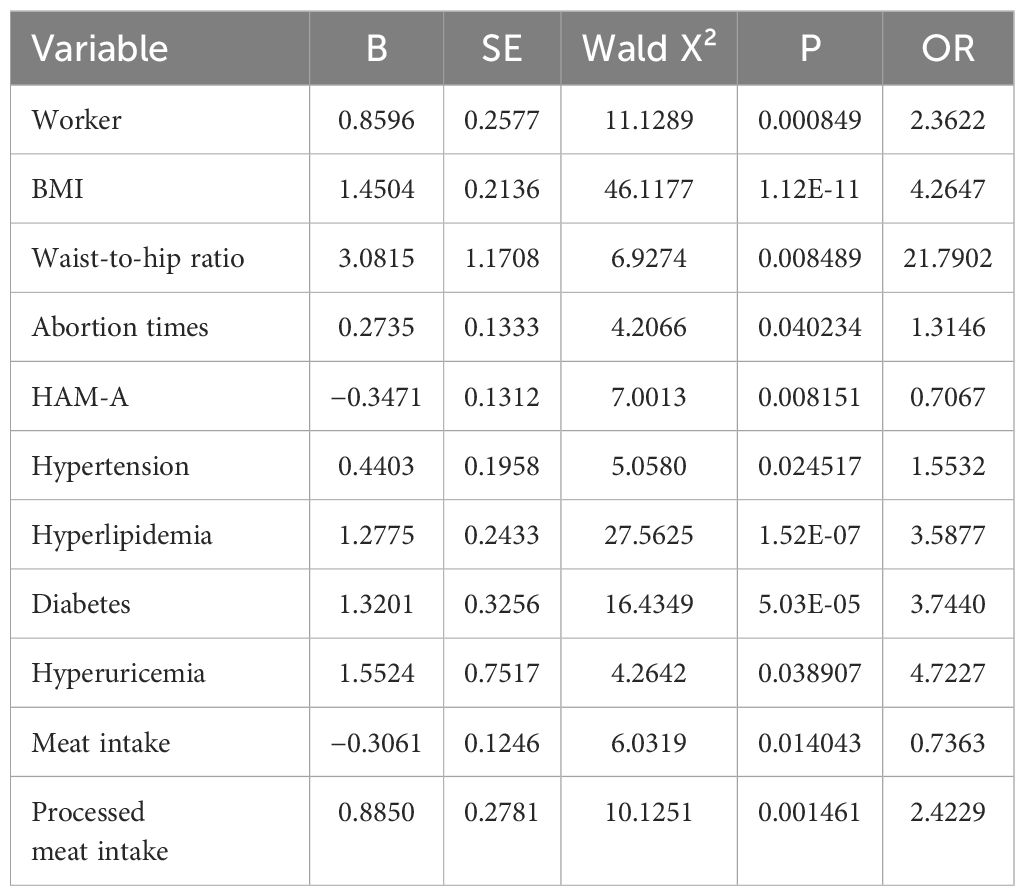
The multicollinearity test revealed no statistically significant correlation among the variables. Stepwise regression analysis was performed on the 20 variables, excluding age, occupation (staff), waist-to-height ratio, Pittsburgh Sleep Quality Index, years since menopause, weight change before and after menopause, and fruit consumption frequency. After processing of dummy variables, “housework” and “farmers” within occupations were statistically significant, but not meaningful to the predictive model (odds ratio [OR] < 1; Table 2). After excluding the aforementioned variables, 11 key predictors of postmenopausal MAFLD were identified and included in the multivariate logistic regression to construct the model. These predictors are occupation (workers), BMI, waist-to-hip ratio, number of abortions, anxiety, hypertension, hyperlipidemia, diabetes, hyperuricemia, and diet (meat and processed meat). Table 3 presents detailed information on the predictors.
3.3 Establishment and evaluation of the predictive nomogram model for fatty liver in postmenopausal women
The independent risk factor data obtained from the multivariate logistic regression analysis were input into R software to construct the nomogram risk prediction model (Figure 2). The C-index for the prediction group was 0.827 (95% CI 0.794 to 0.860) and that for the verification group was 0.787 (95% CI 0.728 to 0.846), indicating moderate accuracy. BS 1,000 times was used to verify the accuracy of the predicted model. The training group BS 1,000 times drew calibration curves (Figure 3A), and the model curve and the actual curve were close to the diagonal line, with an absolute error of 0.015. For the verification group, BS 1,000 times was also used to draw calibration curves (Figure 3B), and the model curve and the actual curve were also close to the diagonal line, with an absolute error of 0.023. Thus, the results show that the predicted probability of the model agreed well with the actual incidence in both groups. The AUC represents the area under the ROC curve, serving as an evaluation metric capable of quantifying and categorizing model performance. As the AUC value approaches 1, it signifies higher accuracy levels within the model. The AUC value for the prediction group was 0.827, the sensitivity was 0.784, and the specificity was 0.735 (Figure 4A). The AUC value of the verification group was 0.787, the sensitivity was 0.674, and the specificity was 0.772 (Figure 4B). The DCA curve showed that the nomogram had a good net benefit in predicting MAFLD in postmenopausal women (Figures 5A, B).
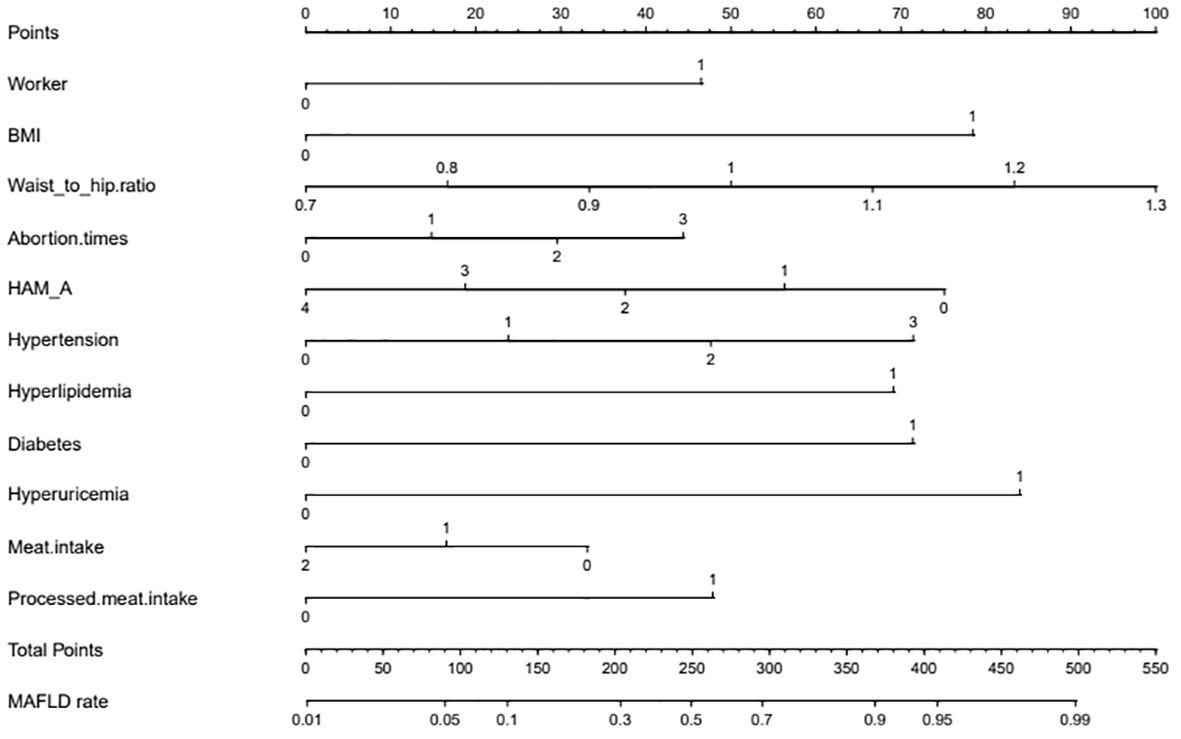
Figure 2 Nomogram. The nomogram represents the prediction probability of MAFLD, ranging from 0 to 550. For each predictive, a vertical line is drawn to the point axis, and the corresponding point is noted down. The scores of each predictor are summed. The total score corresponding to the predicted occurrence probative variability of MAFLD is provided at the bottom of the nomogram. Worker: 0 means non-worker; 1 means workers. BMI: 0 means less than 23 kg/m2, and 1 means greater than or equal to 23 kg/m2; HAM-A: 0 means no anxiety, 1 means I-degree anxiety, 2 means II-degree anxiety, 3 means III-degree anxiety, and 4 means IV-degree anxiety; Hypertension: 0 means no hypertension, 1 means hypertension grade I, 2 means hypertension grade II, and 3 means hypertension grade III; Hyperlipidemia:0 means no hyperlipidemia, and 1 means hyperlipidemia; Diabetes: 0 means no diabetes, 1 means diabetes; Hyperuricemia: 0 means no hyperuricemia, 1 means hyperlipidemia; Meat intake: 0 means that the average daily meat intake is less than <120 g, 1 means that the average daily meat intake is 120–200 g, and 2 means that the average daily meat intake is more than 200 g; Processed meat intake: 0 means that the diet does not contain processed meat, and 1 means that the diet contains processed meat.
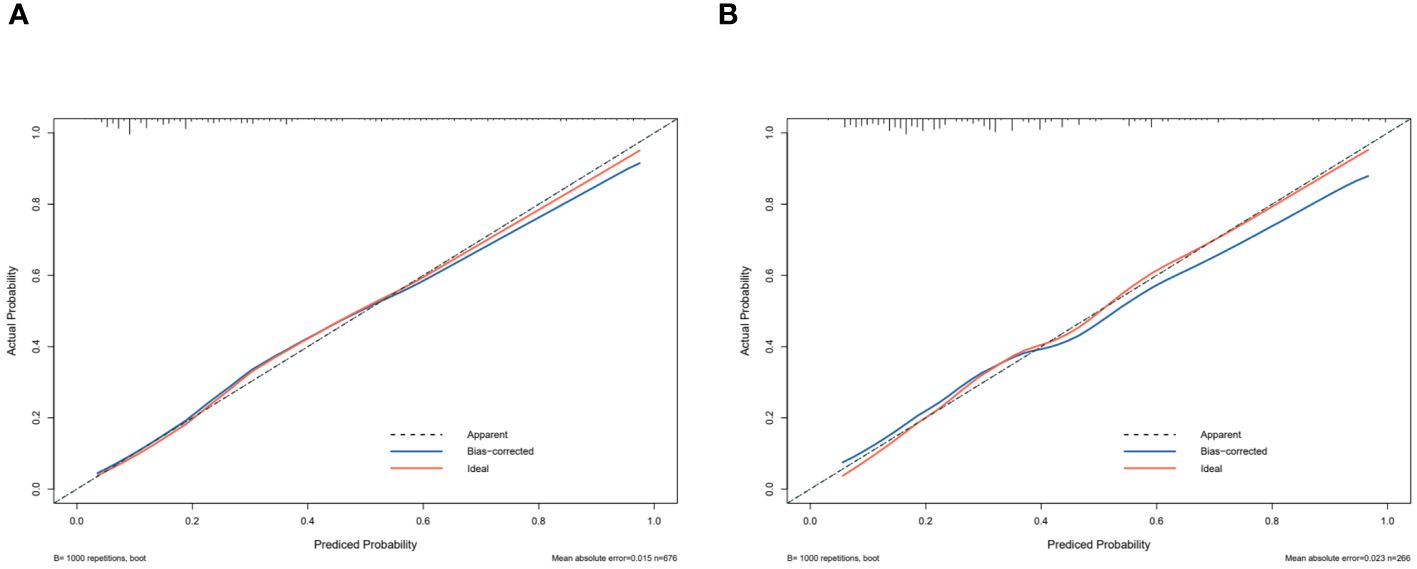
Figure 3 Receiver operating characteristic curve. The performance of the new nomogram was assessed by calibration curves in the training dataset (A) and the validation dataset (B). The X-axis represents specificity; the Y-axis represents sensitivity.
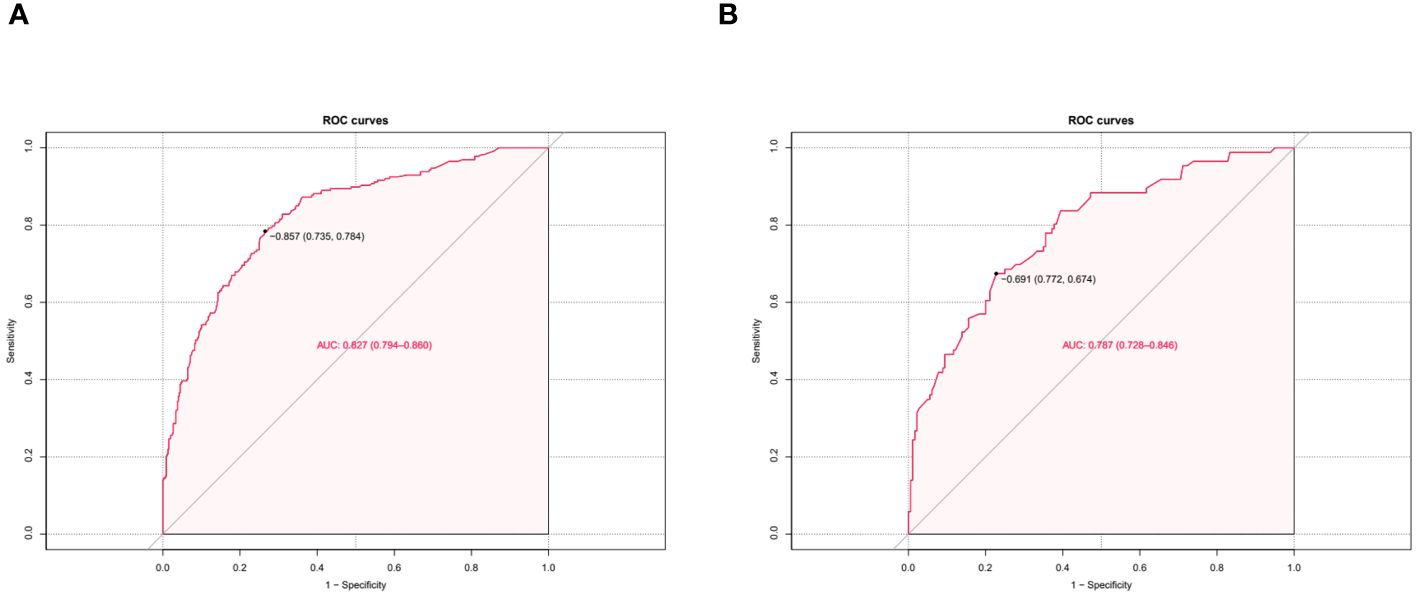
Figure 4 Predictive model calibration curve. ROC curves for predicting MAFLD in the training dataset (A) and the validation dataset (B). The X-axis is the predictive probability of the nomogram for MAFLD; the Y-axis represents the actual probability.
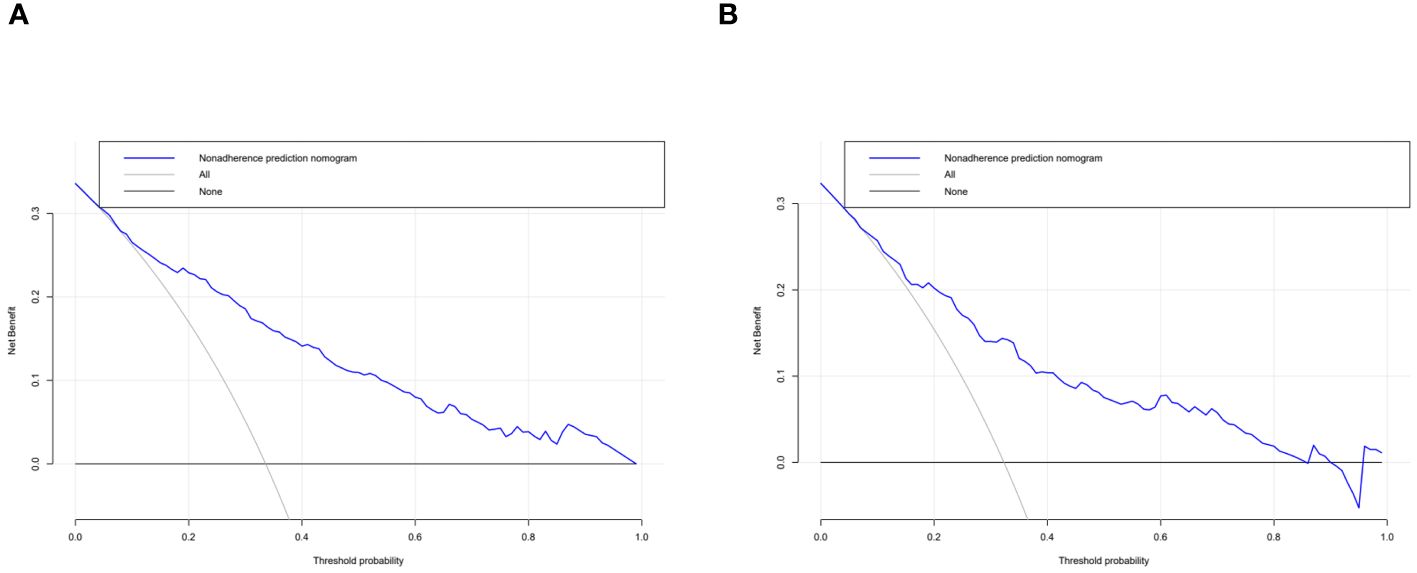
Figure 5 Decision curve analysis. The clinical utility of the nomogram was evaluated by decision curves in the training dataset (A) and the validation dataset (B). The X-axis measures the threshold probability. The Y-axis represents net benefits, calculated by subtracting the relative harms (false positives) from the benefits (true positives).
4 Discussion
The core feature of MAFLD is hepatic steatosis (8). However, liver biopsy, MRI, CT scans, and other diagnostic tests are not suitable for early mass screening, owing to the limitations described above. Previous studies have demonstrated that scoring systems can serve as an early and straightforward evaluation method for MAFLD. Current MAFLD scores primarily rely on anthropometric parameters in combination with non-invasive biochemical parameters, such as the hepatic steatosis index (HSI), the fatty liver index (FLI), and the visceral adiposity index (VAI) (11). These scores exhibit good levels of accuracy for their respective populations. Nevertheless, there has been a lack of research regarding appropriate models of MAFLD for use in postmenopausal women, and the existing score models require biochemical measurements that may not be suitable for early screening in lower-tier hospitals. In the present study, we collected easily obtainable demographic data (age, occupation, etc.), anthropometric data (waist-to-hip ratio, BMI, etc.), details of lifestyle (dietary patterns, exercise routines), and information regarding comorbidities (hypertension, diabetes, etc.) from postmenopausal women attending hospitals or physical examination centers of all types. The resulting nomogram represents a simple, yet practical, diagnostic tool. For each predictive, a vertical line is drawn to the point axis, and the corresponding point is noted down. The scores of each predictor are summed. The total score corresponding to the predicted occurrence probative variability of MAFLD is provided at the bottom of the nomogram. According to the occurrence and progression of diseases as well as the characteristics of health factors, preventive medicine classifies prevention strategies into three levels: primary prevention (etiological prevention), secondary prevention (pre-clinical prevention), and tertiary prevention (clinical prevention). Our model can assist physicians in assessing patients without relying on laboratory tests or imaging evidence, providing recommendations on whether further examinations are necessary based on the results. It is specifically designed for community-level secondary prevention of postmenopausal MAFLD, aiming to achieve early detection, diagnosis, and treatment with the goal of reversing, halting, or delaying the progression of fatty liver disease. Additionally, doctors can utilize the outcomes from this nomogram to deliver health education regarding lifestyle choices, diet modifications, and exercise routines for postmenopausal women in order to accomplish primary preventive measures.
In this study, the detection rate of fatty liver in postmenopausal women was 33.23%. The prevalence of MAFLD is higher than that in the general population (12, 13). In this study, 11 predictors from 37 variables were identified, and they were used to construct a risk nomogram for diagnosing postmenopausal MAFLD. The validation of the nomogram demonstrates that it has good predictive and calibration abilities. Notably, hypertension, hyperlipidemia, hyperuricemia, and diabetes are typical metabolic disorders that also serve as risk factors for the diagnosis of MAFLD in non-postmenopausal women (5).
BMI and waist-to-hip ratio are also primary predictors in the nomogram. The relationship between obesity and metabolic diseases has been widely discussed. In a cohort study of 23,993 cases, Ofer et al. discovered that a BMI of below 27 kg/m2 offered an ideal negative predictive value for metabolic syndrome (MetS) (14). BMI is also indicative of long-term health outcomes, and adolescent obesity is an important risk factor for adult MetS (15, 16). Ying et al. conducted a 16-year follow-up study on 554 adolescents and discovered that those with rapidly increasing BMI had a significantly higher risk of MetS than those with slower BMI growth (17). Our study found that the ratio of premenopausal weight to current weight was correlated with postmenopausal MAFLD in univariate logistic regression. Obesity is closely linked to other metabolic and endocrine-related organ diseases. Milewska et al. observed 105 patients with a BMI ≥ 30 kg/m2 and further classified them into classes I, II, and III obesity, finding that the prevalence of hyperlipidemia, hypertension, asthma, and obstructive sleep apnea increased with the level of obesity (18). In our study, BMI was also identified as a risk factor for the development of MAFLD in postmenopausal women (OR = 4.2647). However, women’s body fat tends to be more concentrated in the buttocks and thighs than in the upper body before menopause (19). The decrease in estrogen and sex hormone-binding globulin levels, along with increases in follicle-stimulating hormone, androgens, and the androgen/estrogen ratio, may affect the development of fat cells in specific areas, leading to higher abdominal obesity in postmenopausal women compared to premenopausal women (20). Additionally, as age increases, the loss of muscle tissue and the gain in fat content typically affect the accuracy of BMI as a predictive measure. Therefore, it is essential to consider the influence of body fat distribution on metabolism-related diseases in postmenopausal women. Kim et al. found that an increase in visceral adipose tissue area was positively correlated with the incidence of NAFLD, while an increase in subcutaneous adipose tissue area was significantly correlated with the reversal of NAFLD (21). Hong et al. discovered that BMI, waist circumference, and waist-to-hip ratio have a similar potential in predicting the risk of NAFLD in premenopausal women, with the waist-to-hip ratio being the most significant risk factor among postmenopausal women (22). This aligns with our model, which suggests that the waist-to-hip ratio is a more important predictor of MAFLD in postmenopausal women (OR = 21.7902), indicating that accumulation of abdominal fat in postmenopausal women is more likely to lead to MAFLD than an increase in BMI alone.
Although diet is one of the causes of MAFLD, the specific role of dietary factors in the occurrence and development of the disease remains unclear. A cross-sectional study conducted in the United States, involving 3,573 subjects, adopted five dietary quality standards, including the Dietary Inflammation Index (DII), the Mediterranean diet, the Dietary Approaches to Stop Hypertension, the Alternative Healthy Eating Index, and the Healthy Eating Index, to observe their relationship with MAFLD. It was found that the DII was positively correlated with MAFLD, while the other four were negatively correlated (23). However, the correlation between the intake of specific food components and MAFLD has not been well studied. Referring to the Dietary Guidelines for Chinese Residents (2022), this study classified foods and graded their intake. According to our statistics, there was a negative correlation between meat consumption and the occurrence of MAFLD (OR=0.7363). The effect of meat on diseases has always been controversial. Studies in the United States and Europe typically categorize meat as red or white. For instance, research by the National Institutes of Health suggested that red meat and saturated fat may be associated with an increased risk of chronic liver disease and liver cancer (hepatocellular carcinoma [HCC]), while white meat might reduce this risk (24). In 2015, consumption of red meat was classified as “possibly carcinogenic to humans” (25). However, subsequent studies have also provided evidence that red meat does not necessarily cause cancer. Ma (26) and others have found that the intake of processed meat may be positively related to the risk of HCC, while fish and poultry may decrease the risk. When designing our questionnaire, this study also considered the differences between fresh and processed meats. Because of Western dietary habits, most studies do not differentiate between fresh and processed red meats, which may contribute to the controversy over the impact of red meat on disease. However, given China’s preference for fresh foods, processed meat is not commonly consumed by the older population. Therefore, in our questionnaire, we separately accounted for the consumption of processed meats and found that postmenopausal women who consume processed meats are more likely to develop MAFLD (OR=2.4229), which was included as an independent risk factor in the predictive model. Lipoprotein metabolism in the liver, which encompasses cholesterol metabolism, triglyceride metabolism, lipoprotein synthesis, and secretion, is a vital part of lipid metabolism. These pathways together regulate the processes of lipid synthesis, transport, and degradation, and an adequate intake of protein is crucial for maintaining these processes. Compared with fresh red meat, processed meat may contain potential carcinogens such as N-nitroso compounds or heterocyclic amines that remain after the cooking process, in addition to high levels of saturated fat and heme iron, all of which are possible pathogenic factors in processed meats. Ideally, the preservation and cooking methods of meat should be further considered, and our findings require more research for verification.
Considering the relationship between emotional disorders and MetS, it is reasonable to posit a correlation between mental health status and MAFLD. Kim et al. analyzed 10,484 samples in the United States and found that subjects with depression had a higher risk of NAFLD, suggesting depression may be an independent risk factor for NAFLD (27). Anxiety and depression can also affect the prognosis of MAFLD. Tomeno et al. observed the therapeutic effects on 258 patients with major depressive disorder by adjusting their lifestyles, including 32 patients with NAFLD and reported that these patients had a poorer therapeutic response. This may be attributable to the influence of emotional factors on memory and self-efficacy, resulting in poor compliance (28). However, some studies have reported different results. In the systematic review by Tang (29), two cohort studies were included, which reported no correlation between MetS and anxiety (30, 31). Akbari conducted a cross-sectional analysis as part of a prospective cohort study in Isfahan and discovered that anxiety was negatively correlated with MetS, but found no correlation between depression and MetS (32). This finding aligns with those obtained in the present study, which also revealed that anxiety is negatively correlated with MAFLD in postmenopausal women (OR=0.7067). It is commonly believed that the inflammatory response triggered by emotional stress is a contributing factor to MAFLD, yet anxiety and depression also affect eating habits. This influence is often bidirectional, which may explain the contradictory effects on MAFLD.
5 Limitation
While the use of estrogen to prevent and treat fatty liver in postmenopausal women is controversial (6), the correlation between estrogen and postmenopausal MAFLD is certain. Klair et al. (33) analyzed the menopause timing of 488 postmenopausal women and the duration since menopause at the time of their examination, finding that prolonged estrogen deficiency in a postmenopausal state increased the risk of liver fibrosis in women with NAFLD. Lu et al. (34) investigated 4,128 postmenopausal women and found that those with earlier menarche had a higher risk of overweight/obesity, insulin resistance, and NAFLD. Menstrual history is also associated with other metabolic diseases. Chen et al. (35) observed a significant correlation between menstrual history, serum uric acid levels, and NAFLD, positing that this may be related to decreased estrogen levels. In univariate logistic regression, the time since menopause and the number of abortions were associated with postmenopausal MAFLD; after adjustment, only the number of abortions remained significant. However, the duration of menstruation, menstrual cycle regularity, and the number of pregnancies were not included in the predictive model in this study. The use of a retrospective study to analyze menstrual history may have some limitations, and this study designed prospective studies with serological markers to longitudinally track this issue.
Exercise has always been a focal point in the prevention and treatment of metabolic diseases. A position statement from Exercise and Sport Science Australia suggests that moderate-intensity aerobic exercise for at least 150–240 minutes per week can reduce liver steatosis by 2%–4%, and high-intensity interval training (HIIT) may also have a similar effect (36). In the present research, this correlation was not observed, which may be attributable to the fact that postmenopausal women in China, generally being of retirement age and primarily engaged in housework, lack sustained exercise of moderate intensity or higher. Nevertheless, multivariate regression analysis revealed that occupation (being a worker) is an independent risk factor for postmenopausal MAFLD, potentially related to the increase in body fat due to a sudden decrease in physical activity after retirement. Additionally, despite rigorous training of investigators, it remains challenging for respondents to have a uniform understanding of what constitutes moderate-intensity exercise, and we cannot retroactively determine objective indicators such as respondents’ heart rates during exercise. These factors may contribute to the reasons why exercise was not included as a risk factor in the final analysis.
6 Conclusion
In this study, an effective clinical nomogram was developed for a specific group—postmenopausal women. The model is based on 11 clinically accessible and objective variables, which can be utilized for the early screening of MAFLD in postmenopausal women. For those identified as high risk for MAFLD, laboratory examinations should be enhanced to establish individualized treatment plans at an early stage. Therefore, this model holds significant clinical value. However, further validation is necessary to confirm its widespread applicability.
Data availability statement
The original contributions presented in the study are included in the article/Supplementary Material. Further inquiries can be directed to the corresponding authors.
Ethics statement
The studies involving humans were approved by The Ethics Committee of the First Affiliated Hospital to Changchun University of Chinese Medicine. The studies were conducted in accordance with the local legislation and institutional requirements. Written informed consent for participation was not required from the participants or the participants’ legal guardians/next of kin in accordance with the national legislation and institutional requirements.
Author contributions
MY: Writing – review & editing, Writing – original draft, Validation, Methodology, Investigation, Data curation, Conceptualization. XC: Writing – review & editing, Data curation. QS: Writing – review & editing, Investigation, Data curation. ZX: Writing – review & editing, Methodology, Data curation. TL: Writing – review & editing, Methodology, Investigation. YL: Writing – review & editing. YJ: Writing – review & editing, Data curation.
Funding
The author(s) declare financial support was received for the research, authorship, and/or publication of this article. This study was funded by the Natural Science Foundation of Jilin Province (20210101208JC), the Natural Science Foundation of Jilin Province (YDZJ202201ZYTS263) and the Science and Technology capability enhancement Project of Jilin Provincial Health Commission (2023LC034).
Acknowledgments
Authors thank the investigators from Changchun University of Chinese Medicine.
Conflict of interest
The authors declare that the research was conducted in the absence of any commercial or financial relationships that could be construed as a potential conflict of interest.
Publisher’s note
All claims expressed in this article are solely those of the authors and do not necessarily represent those of their affiliated organizations, or those of the publisher, the editors and the reviewers. Any product that may be evaluated in this article, or claim that may be made by its manufacturer, is not guaranteed or endorsed by the publisher.
Supplementary material
The Supplementary Material for this article can be found online at: https://www.frontiersin.org/articles/10.3389/fendo.2024.1334924/full#supplementary-material
References
1. Ahmed MH, Noor SK, Bushara SO, Husain NE, Elmadhoun WM, Ginawi IA, et al. Non-alcoholic fatty liver disease in Africa and middle east: an attempt to predict the present and future implications on the healthcare system. Gastroenterol Res. (2017) 10:271–9. doi: 10.14740/gr913w
2. Lonardo A, Bellentani S, Argo CK, Ballestri S, Byrne CD, Caldwell SH, et al. Epidemiological modifiers of non-alcoholic fatty liver disease: focus on high-risk groups. Dig Liver Dis. (2015) 47:997–1006. doi: 10.1016/j.dld.2015.08.004
3. Lonardo A, Carani C, Carulli N, Loria P. ‘endocrine nafld’ a hormonocentric perspective of nonalcoholic fatty liver disease pathogenesis. J Hepatol. (2006) 44:1196–207. doi: 10.1016/j.jhep.2006.03.005
4. Wang Z, Xu M, Hu Z, Shrestha UK. Prevalence of nonalcoholic fatty liver disease and its metabolic risk factors in women of different ages and body mass index. Menopause. (2015) 22:667–73. doi: 10.1097/GME.0000000000000352
5. Chalasani N, Younossi Z, Lavine JE, Diehl AM, Brunt EM, Cusi K, et al. The diagnosis and management of non-alcoholic fatty liver disease: practice guideline by the American Gastroenterological Association, American Association for the Study of Liver Diseases, and American College of Gastroenterology. Gastroenterology. (2012) 142:1592–609. doi: 10.1053/j.gastro.2012.04.001
6. Strauss S, Gavish E, Gottlieb P, Katsnelson L. Interobserver and intraobserver variability in the sonographic assessment of fatty liver. AJR Am J Roentgenol. (2007) 189:W320–3. doi: 10.2214/AJR.07.2123
7. Tan CH, Venkatesh SK. Magnetic resonance elastography and other magnetic resonance imaging techniques in chronic liver disease: current status and future directions. Gut Liver. (2016) 10:672–86. doi: 10.5009/gnl15492
8. Eslam M, Newsome PN, Sarin SK, Anstee QM, Targher G, Romero-Gomez M, et al. A new definition for metabolic dysfunction-associated fatty liver disease: an international expert consensus statement. J Hepatol. (2020) 73:202–9. doi: 10.1016/j.jhep.2020.03.039
9. Francque SM, van der Graaff D, Kwanten WJ. Non-alcoholic fatty liver disease and cardiovascular risk: pathophysiological mechanisms and implications. J Hepatol. (2016) 65:425–43. doi: 10.1016/j.jhep.2016.04.005
10. Harrell FE. Regression modeling strategies with applications to linear models, logistic regression, and survival analysis. New York, NY: Springer Verlag (2001). doi: 10.1007/978-1-4757-3462-1
11. MaChado MV, Cortez-Pinto H. Non-invasive diagnosis of non-alcoholic fatty liver disease. A Crit appraisal J Hepatol. (2013) 58:1007–19. doi: 10.1016/j.jhep.2012.11.021
12. Yu B, Kwok D, Wong WS. Magnitude of nonalcoholic fatty liver disease: eastern perspective. J Clin Exp Hepatol. (2019) 9:491–6. doi: 10.1016/j.jceh.2019.01.007
13. Younossi ZM, Marchesini G, Pinto-Cortez H, Petta S. Epidemiology of nonalcoholic fatty liver disease and nonalcoholic steatohepatitis: implications for liver transplantation. Transplantation. (2018) 103:1. doi: 10.1097/TP.0000000000002484
14. Kobo O, Leiba R, Avizohar O, Karban A. Normal body mass index (bmi) can rule out metabolic syndrome: an Israeli cohort study. Medicine. (2019) 98:e14712. doi: 10.1097/MD.0000000000014712
15. Stolzman SC, Skelton J, Harkins A, Hoeger Bement M. Does weight status impact metabolic health in adolescents when controlling for physical fitness? Pediatr Phys Ther. (2019) 31:134–40. doi: 10.1097/PEP.0000000000000589
16. Morrison JA, Friedman LA, Wang P, Glueck CJ. Metabolic syndrome in childhood predicts adult metabolic syndrome and type 2 diabetes mellitus 25 to 30 years later. J Pediatr. (2008) 152:201–6. doi: 10.1016/j.jpeds.2007.09.010
17. Ying M, Hu X, Li Q, Dong H, Zhou Y, Chen Z. Long-term trajectories of BMI and cumulative incident metabolic syndrome: A cohort study. Front Endocrinol. (2022) 13:915394. doi: 10.3389/fendo.2022.915394
18. Milewska EM, Szczepanek-Parulska E, Marciniak M, Krygier A, Dobrowolska A, Ruchala M. Selected organ and endocrine complications according to bmi and the metabolic category of obesity: a single endocrine center study. Nutrients. (2022) 14:1307. doi: 10.3390/nu14061307
19. Kwon SS, Lee SG, Lee YH, Lim JB, Kim JH. Homeostasis model assessment of insulin resistance in a general adult population in korea: additive association of sarcopenia and obesity with insulin resistance. Clin Endocrinol (Oxf). (2017) 86:44–51. doi: 10.1111/cen.2017.86.issue-1
20. Abdulnour J, Doucet E, Brochu M, Lavoie JM, Strychar I, Rabasa-Lhoret R, et al. The effect of the menopausal transition on body composition and cardiometabolic risk factors: a montreal-Ottawa new emerging team group study. Menopause. (2012) 19:760–7. doi: 10.1097/gme.0b013e318240f6f3
21. Kim D, Chung GE, Kwak MS, Seo HB, Kang JH, Kim W, et al. Body fat distribution and risk of incident and regressed nonalcoholic fatty liver disease. Clin Gastroenterol Hepatol. (2016) 14:132–8.e4. doi: 10.1016/j.cgh.2015.07.024
22. Hong SH, Hwang SY, Kim JA, Lee YB, Yoo HJ. Comparison of anthropometric indices for the screening of nonalcoholic fatty liver disease in pre- and postmenopausal women. Menopause (N Y NY). (2019) 27:1. doi: 10.1097/GME.0000000000001419
23. Tian T, Zhang J, Xie W, Ni Y, Fang X, Liu M, et al. Dietary quality and relationships with metabolic dysfunction-associated fatty liver disease (MAFLD) among United States adults, results from NHANES 2017-2018. Nutrients. (2022) 14:4505. doi: 10.3390/nu14214505
24. Freedman ND, Cross AJ, McGlynn KA, Abnet CC, Park Y, Hollenbeck AR, et al. Association of meat and fat intake with liver disease and hepatocellular carcinoma in the nih-AARP cohort. J Natl Cancer Inst. (2010) 102:1354–65. doi: 10.1093/jnci/djq301
25. Bouvard V, Loomis D, Guyton KZ, Grosse Y, Ghissassi FE, Benbrahim-Tallaa L, et al. Carcinogenicity of consumption of red and processed meat. Lancet Oncol. (2015) 16:1599–600. doi: 10.1016/S1470-2045(15)00444-1
26. Yanan M, Wanshui Y, Tricia L, Liu Y, Simon TG, Sui J, et al. Meat intake and risk of hepatocellular carcinoma in two large us prospective cohorts of women and men. Int J Epidemiol. (2019) 6:6. doi: 10.1093/ije/dyz146
27. Kim D, Yoo ER, Li AA, Tighe SP, Cholankeril G, Harrison SA, et al. Depression is associated with non-alcoholic fatty liver disease among adults in the United States. Aliment Pharmacol Ther. (2019) 50:590–8. doi: 10.1111/apt.15395
28. Tomeno W, Kawashima K, Yoneda M, Saito S, Ogawa Y, Honda Y, et al. Non-alcoholic fatty liver disease comorbid with major depressive disorder: the pathological features and poor therapeutic efficacy. J Gastroenterol Hepatol. (2015) 30:1009–14. doi: 10.1111/jgh.12897
29. Tang F, Wang G, Lian Y. Association between anxiety and metabolic syndrome: a systematic review and meta-analysis of epidemiological studies. Psychoneuroendocrinology. (2017) 77:112–21. doi: 10.1016/j.psyneuen.2016.11.025
30. Takeuchi T, Nakao M, Nomura K, Inoue M, Tsurugano S, Shinozaki Y, et al. Association of the metabolic syndrome with depression and anxiety in Japanese men: a 1-year cohort study. Diabetes Metab Res Rev. (2009) 25:762–7. doi: 10.1002/dmrr.1041
31. Akbari H, Sarrafzadegan N, Aria H, Garaei AG, Zakeri H. Anxiety but not depression is associated with metabolic syndrome: the Isfahan healthy heart program. J Res Med Sci Off J Isfahan Univ Med Sci. (2017) 22:90. doi: 10.4103/jrms.JRMS_288_16
32. Räikkönen K, Matthews KA, Kuller LH. Depressive symptoms and stressful life events predict metabolic syndrome among middle-aged women: a comparison of world health organization, adult treatment panel III, and international diabetes foundation definitions. Diabetes Care. (2007) 30:872–7. doi: 10.2337/dc06-1857
33. Klair JS, Yang JD, Abdelmalek MF, Guy CD, Yates K, Unalp-Arida A, et al. A longer duration of estrogen deficiency increases fibrosis risk among postmenopausal women with nonalcoholic fatty liver disease. Hepatology. (2016) 64:85–91. doi: 10.1002/hep.28514
34. Lu J, Zhang J, Du R, Wang T, Xu M, Xu Y, et al. Age at menarche is associated with the prevalence of nonalcoholic fatty liver disease later in life. J Diabetes. (2016) 9:53–60. doi: 10.1111/1753-0407.12379
35. Chen Y, Huang Q, Ai P, Liu H, Chen X, Xu X, et al. Association between serum uric acid and non-alcoholic fatty liver disease according to different menstrual status groups. Can J Gastroenterol Hepatol. (2019) 2019:2763093–2763093. doi: 10.1155/2019/2763093
Keywords: MAFLD, postmenopausal women, nomogram, predictive model, risk factors
Citation: Yang M, Chen X, Shen Q, Xiong Z, Liu T, Leng Y and Jiao Y (2024) Development and validation of a predictive nomogram for the risk of MAFLD in postmenopausal women. Front. Endocrinol. 15:1334924. doi: 10.3389/fendo.2024.1334924
Received: 08 November 2023; Accepted: 09 July 2024;
Published: 06 August 2024.
Edited by:
Aleksandra Klisic, Primary Health Care Center Podgorica, MontenegroReviewed by:
Yan Wang, University of Pittsburgh, United StatesAfshan Masood, King Saud University Medical City, Saudi Arabia
Copyright © 2024 Yang, Chen, Shen, Xiong, Liu, Leng and Jiao. This is an open-access article distributed under the terms of the Creative Commons Attribution License (CC BY). The use, distribution or reproduction in other forums is permitted, provided the original author(s) and the copyright owner(s) are credited and that the original publication in this journal is cited, in accordance with accepted academic practice. No use, distribution or reproduction is permitted which does not comply with these terms.
*Correspondence: Yan Leng, bGVuZ3lhbjIyOUAxNjMuY29t; Yue Jiao, amlhb3l1ZTA5MTZAMTYzLmNvbQ==
 Ming Yang
 Xingyu Chen2
 Qiaohui Shen
 Yan Leng
