 Siyuan Song
 Qiling Zhang
- Department of Endocrinology, Jiangsu Province Hospital of Chinese Medicine, Affiliated Hospital of Nanjing University of Chinese Medicine, Nanjing, China
Objective: This study sought to elucidate the causal association between gut microbiota (GM) composition and type 2 diabetes mellitus (T2DM) through a comprehensive two-sample bidirectional Mendelian randomization analysis.
Method: T2DM data were sourced from the IEU OpenGWAS Project database, complemented by 211 gut microbiota (GM) datasets from the MiBioGen Federation. The primary analytical approach employed was inverse variance weighted (IVW), supplemented by MR-Egger regression and weighted median (WME) methods to investigate their potential interplay. Results were assessed using odds ratios (OR) and 95% confidence intervals (CI). The robustness and reliability of the findings were confirmed through leave-one-out analysis, heterogeneity testing, and assessment of horizontal pleiotropy. Furthermore, we explored the potential mediating role of metabolites in the pathway linking GM to T2DM.
Result: A set of 11 Single Nucleotide Polymorphisms (SNPs) linked to GM were identified as instrumental variables (IVs). The IVW analysis revealed that increased abundance of the genus Actinomyces, genus Bilophila, genus Lachnoclostridium, genus Ruminococcus gnavus group, and genus Streptococcus corresponded to a heightened risk of T2DM. Conversely, higher levels of genus Eubacterium oxidoreducens group, genus Oscillospira, genus Ruminococcaceae UCG003, genus Ruminococcaceae UCG010, and genus Sellimonas were associated with a reduced risk of T2DM. However, following false discovery rate (FDR) correction, only the abundance of genus Lachnoclostridium retained a significant positive correlation with T2DM risk (OR = 1.22, q value = 0.09), while the other ten GM showed suggestive associations with T2DM. Reverse MR analysis did not reveal any causal relationship between T2DM and the increased risk associated with the identified GM. Additionally, metabolites did not exhibit mediating effects in this context.
Conclusion: This study effectively pinpointed specific GM associated with T2DM, potentially paving the way for novel biomarkers in the prevention and treatment of this condition. The findings suggested that probiotics could emerge as a promising avenue for managing T2DM in the future. Furthermore, the analysis indicated that metabolites do not appear to act as mediators in the pathway from GM to T2DM.
1 Introduction
Type 2 diabetes mellitus (T2DM) is a metabolic disorder characterized by chronic hyperglycemia, primarily stemming from insulin resistance in peripheral tissues or inadequate insulin secretion from pancreatic islet β cells. Globally, the diabetic population has surged to approximately 420 million, with China alone exceeding 100 million individuals affected (1). Research findings indicate substantial alterations in the gut microbiota (GM) structure among T2DM patients compared to healthy individuals (2). GM actively participates in material and energy metabolism processes, influencing the onset and progression of metabolic disorders such as obesity through inflammatory responses, endotoxemia, and the production of short-chain fatty acids (SCFAs) (3). Research has demonstrated that individuals with T2DM exhibit an altered GM composition compared to healthy counterparts, characterized by an increase in Firmicutes abundance and a decrease in Bacteroides abundance. Moreover, the ratio of Bacteroides to Firmicutes has been positively correlated with plasma glucose levels measured by oral glucose tolerance test (OGTT) (4). Hwang (5) observed an elevated Firmicutes to Bacteroides ratio in the GM of diet-induced obese mice, which was associated with increased calorie absorption. This imbalance was implicated in perturbed glucose and lipid metabolism, altered gene expression, low-grade inflammation, and the pathogenesis of T2DM. Gou (6) developed a microbiome risk score (MRS) based on T2DM-associated gut microorganisms. They observed a positive correlation between MRS and glucose increment, providing evidence that dysbiosis of the GM contributes to aberrant glucose and lipid metabolism, thereby influencing the onset and progression of T2DM. The mycobiome and virome are recognized to exert significant, sometimes debilitating effects on T2DM. These components interact within the intestinal milieu. For instance, Bao (7) demonstrated that mitigating Candida albicans colonization represents a viable strategy for ameliorating T2DM progression. Similarly, viruses coexist within the human gut, and their interplay has been implicated in T2DM pathogenesis. The functional loss of several viruses and the disruption of virus-bacteria correlations suggest a potential role for enteroviruses in T2DM (8). Additionally, Gu (9) observed that Lactobacillus paracasei administration alleviated T2DM by modulating the intestinal microbiota SCFAs-hormone/inflammation axis. However, observational studies are susceptible to unknown confounders and reverse causality, thereby obscuring the causal relationship between GM and T2DM risk.
Mendelian randomization (MR) stands as an effective approach for discerning causal relationships between exposures and outcomes, leveraging single nucleotide polymorphisms (SNPs) as IVs (10). The inherent independence of MR ensures that genetic variations are generally uninfluenced by external factors or confounding variables, rendering the associations gleaned from MR analyses more robust than those from randomized clinical trials (RCTs) (11). In this investigation, data were gathered via genome-wide association studies (GWAS), and a two-sample bidirectional MR analysis was employed to elucidate the potential causal link between GM and the risk of T2DM, thereby furnishing genetic substantiation for their association. The schematic representation of our study protocol is depicted in Figure 1.
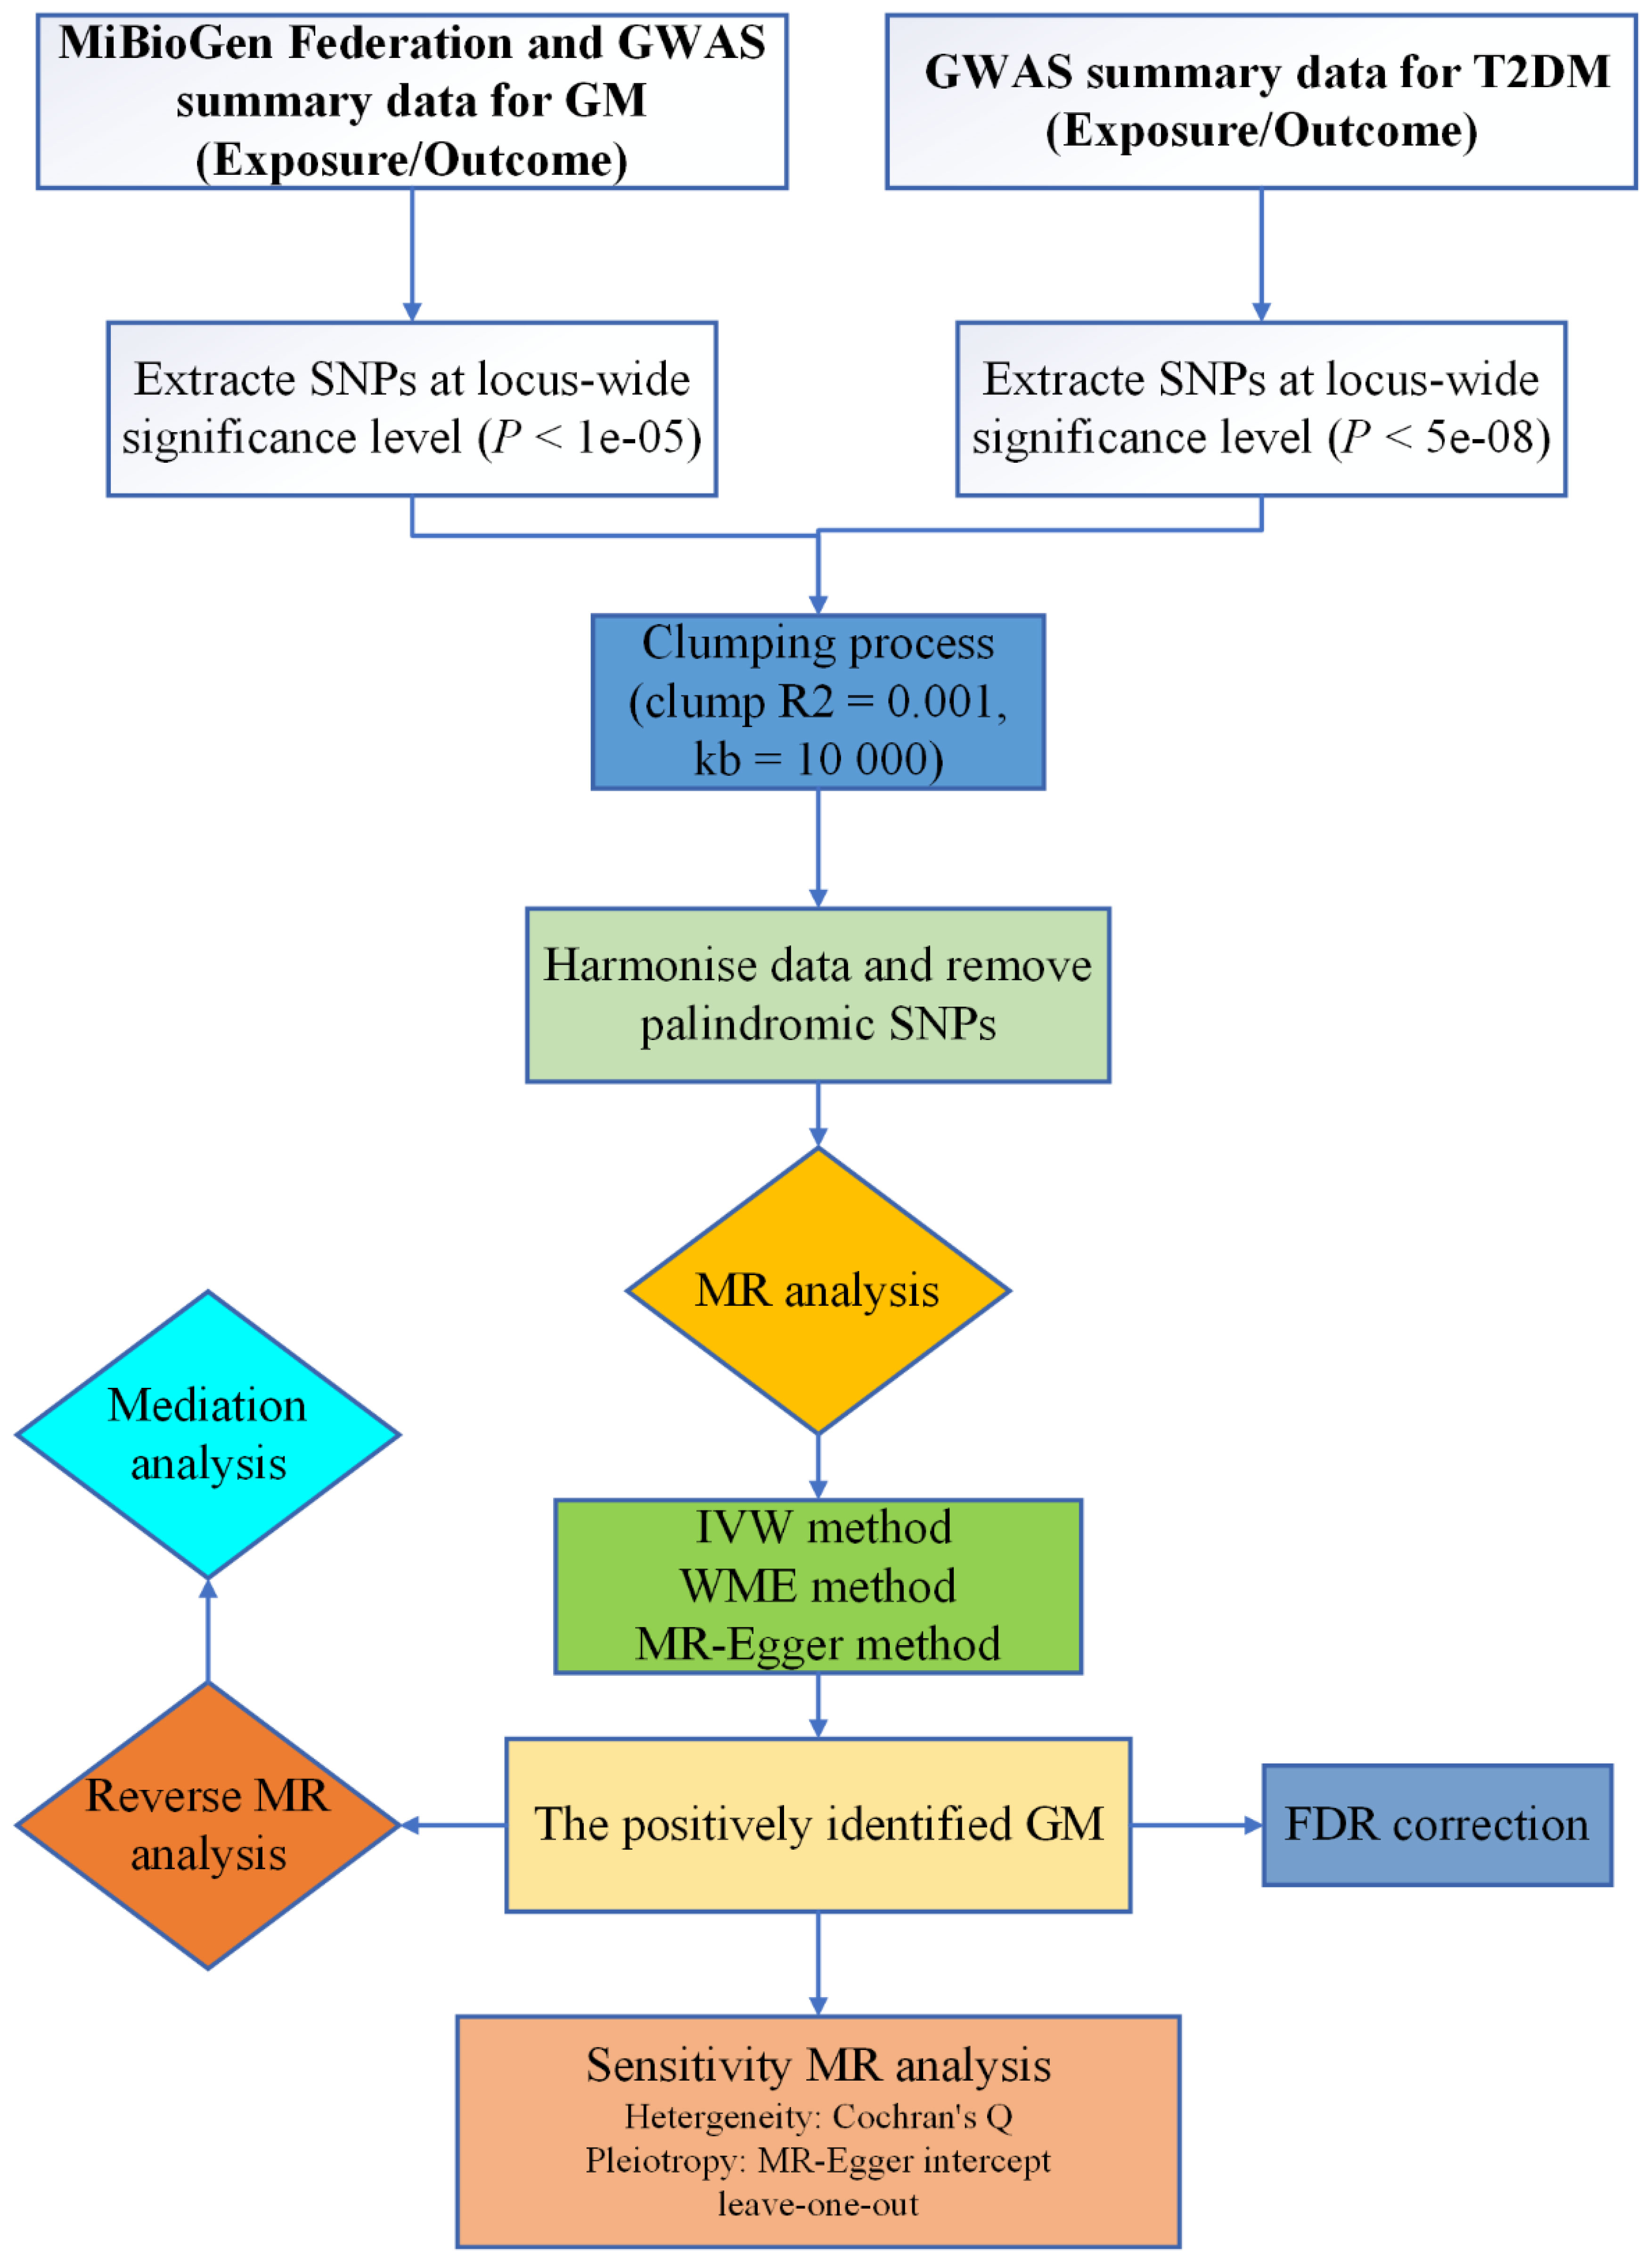
Figure 1 The protocol of our study procedure.
2 Materials and method
2.1 Study design
In this investigation, GM was posited as the exposure variable, with SNPs exhibiting significant correlations selected as IVs, while T2DM was delineated as the outcome variable. Causal analysis was undertaken employing a two-sample MR analysis. The fulfillment of three hub hypotheses is imperative for robust MR analysis (12): (1) a substantial association between IVs and the exposure variable exists; (2) no confounding factors unduly influence the relationship between the exposure variable and the outcome variable; (3) IVs exert no direct effect on the outcome variable but instead operate solely through the exposure variable. These pivotal hypotheses are depicted in Figure 2A.
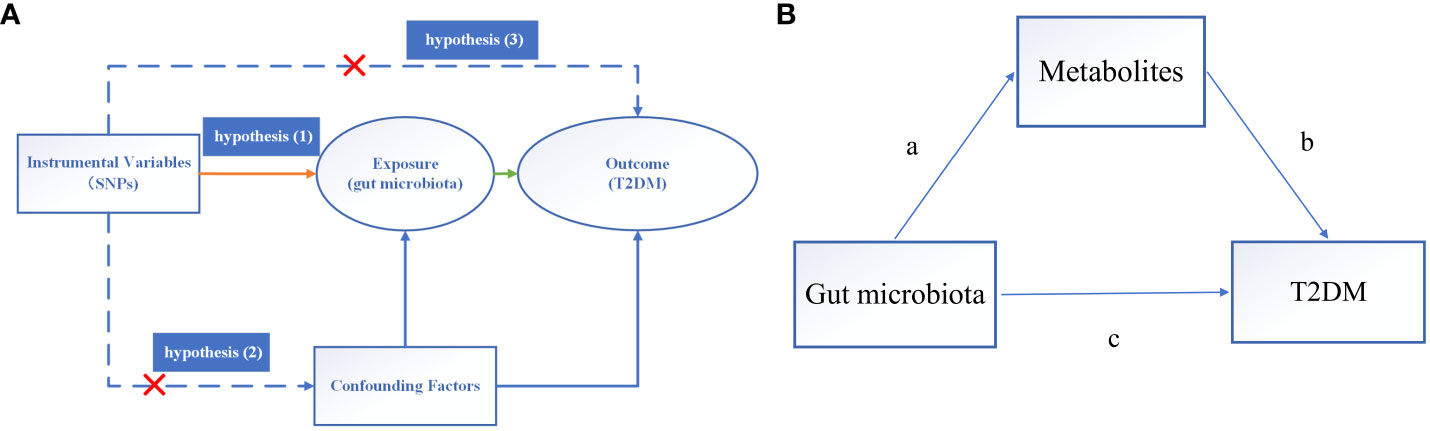
Figure 2 Overview of MR analysis. (A) The hub hypothesis of MR analysis. (B) Mediated analysis of metabolites from GM to T2DM pathway. (a) stands for the causal effect of GM on metabolites, and (b) stands for the causal effect of metabolites on T2DM, (c) represents the total influence of GM on T2DM.
2.2 Data of exposure
The exposure data utilized in this study originated from a large-scale, multi-ethnic genome-wide meta-analysis conducted by the MiBioGen Federation. The MiBioGen Consortium aggregated 16s RNA gene sequencing maps and genotyping data from 18,340 subjects across 11 countries in Asia and Europe. Through meticulous analysis, characteristic loci associated with microbial groups were identified to ascertain genetic factors influencing the relative abundance or presence of microbial taxa, all of which were integrated into the genome-wide association study (GWAS) dataset. Within this GWAS endeavor, 211 subgroups of GM, categorized at the phylum level, were meticulously examined. Consequently, the genetic variation linked with 9 phyla, 16 classes, 20 orders, 35 families, and 131 genera of GM was delineated (13).
To delve deeper into the realm of GM sub-species, a query for “gut microbio” was executed within the IEU OpenGWAS Project, yielding 418 additional GM datasets. Subsequently, a secondary MR analysis was undertaken to corroborate the influence of GM sub-species on the risk of T2DM.
2.3 Data of outcome
The outcome data utilized in this study, designated as ebi-a-GCST006867, was procured from the IEU OpenGWAS Project website (gwas.mrcieu.ac.uk). The T2DM dataset encompasses a substantial sample size of 655,666 individuals, with a corresponding SNP count of 5,030,727. As all data utilized in this research are sourced from publicly available databases, no additional ethical approval was deemed necessary.
2.4 Tool variable filtering
We conducted a rigorous selection process for SNPs with significant correlation, employing a threshold of P < 1e-05 (14). To mitigate the influence of linkage disequilibrium (LD), we set parameters of R2 = 0.001 and kb = 10,000. Additionally, all palindrome SNPs were excluded to ensure data integrity (15). To fulfill the second MR hypothesis, known as the independence hypothesis, we utilized the PhenoScanner (http://www.phenoscanner.medschl.cam.ac.uk/) database (16) to identify all eligible SNPs. SNPs associated with confounding factors related to T2DM, such as fasting insulin, HbA1c, and two-hour glucose challenge, were meticulously excluded from the analysis. The strength of the correlation between loci and exposure variables was assessed based on the F value of each SNP, with an F value exceeding 10 generally considered indicative of unbiased IVs (17).
2.5 Statistical analysis
2.5.1 MR analysis
We employed multiple methods including the IVW method, WME method, MR-Egger regression, and forest plot analysis to thoroughly investigate the potential relationship between GM and T2DM, ensuring robustness of the findings (18). The IVW method, assuming all SNPs are valid IVs, offers the most precise effect estimation (10). MR-Egger regression, while capable of detecting and adjusting for pleiotropy, often yields less accurate estimates (19). The WME method, predicated on the assumption that at least 50% of IVs are valid, provides accurate estimation results (20). Given the superior efficiency of the IVW method compared to other MR methods, it was selected as the primary approach to assess causal effects in this study (21). A significance level of P < 0.05 was considered indicative of a causal relationship between exposure (GM) and outcome (T2DM) (22). To mitigate the risk of one kind of error and ascertain whether the findings were influenced by multiple testing, we also employed the q value to correct the false discovery rate (FDR) of GM. A q value of less than 0.1 indicates a positive correlation (23). When P < 0.05 but q ≥ 0.1, GM and T2DM are deemed suggestive of association.
2.5.2 Sensitivity analysis
Cochran’s Q statistic was employed to assess heterogeneity. A P-value greater than or equal to 0.05 suggests no heterogeneity in causal analysis (19). Additionally, the funnel plot was utilized to detect heterogeneity, with symmetrical distribution of SNPs indicating absence of heterogeneity in the results (24). MR-Egger intercept analysis was utilized to assess pleiotropy between IVs and other potential confounding factors, ensuring that the selected IVs do not exert effects on outcome variables via pathways other than exposure factors. Statistical significance (P < 0.05) in MR-Egger intercept analysis indicates presence of horizontal pleiotropy (25). Furthermore, to evaluate the impact of each SNP, a leave-one-out (LOO) analysis was conducted to ascertain the comprehensive impact of individual SNPs (26). Results were reported as odds ratios (OR) with corresponding 95% confidence intervals (CI), with statistical significance set at P < 0.05.
2.5.3 Bidirectional MR analysis
We conducted a two-sample bidirectional MR analysis to explore the reverse causal relationship between T2DM (exposure) and positively identified GM (outcome). The steps of bidirectional MR analysis mirror those of the MR analysis.
2.5.4 Mediation analysis
To explore whether the influence of GM on T2DM could be mediated through metabolites, we examined the mediation of metabolites in the pathway from GM to T2DM (Figure 2B). We acquired GWAS data for 575 metabolites from the IEU OpenGWAS Project (with criteria of P < 5e-06, R2 = 0.001, and kb = 10,000).
2.5.5 Statistical software
All MR analyses were conducted using R (version 4.3.1) and the TwoSampleMR package.
3 Results
3.1 Tool variable filtering
According to the screening criteria of IVs, 6, 9, 3, 9, 6, 9, 4, 9, 6, 11, and 6 SNPs were extracted from the genus Actinomyces, genus Bilophila, genus Eubacterium oxidoreducens group, genus Lachnoclostridium, genus Oscillospira, genus Ruminococcaceae UCG003, genus Ruminococcaceae UCG010, genus Ruminococcus gnavus group, genus Sellimonas, genus Streptococcus, and unknown genus. The F statistics of the IVs included were all greater than 10, indicating that the bias of weak IVs would not have a substantial impact on the results (Supplementary Table 1; Figure 3).
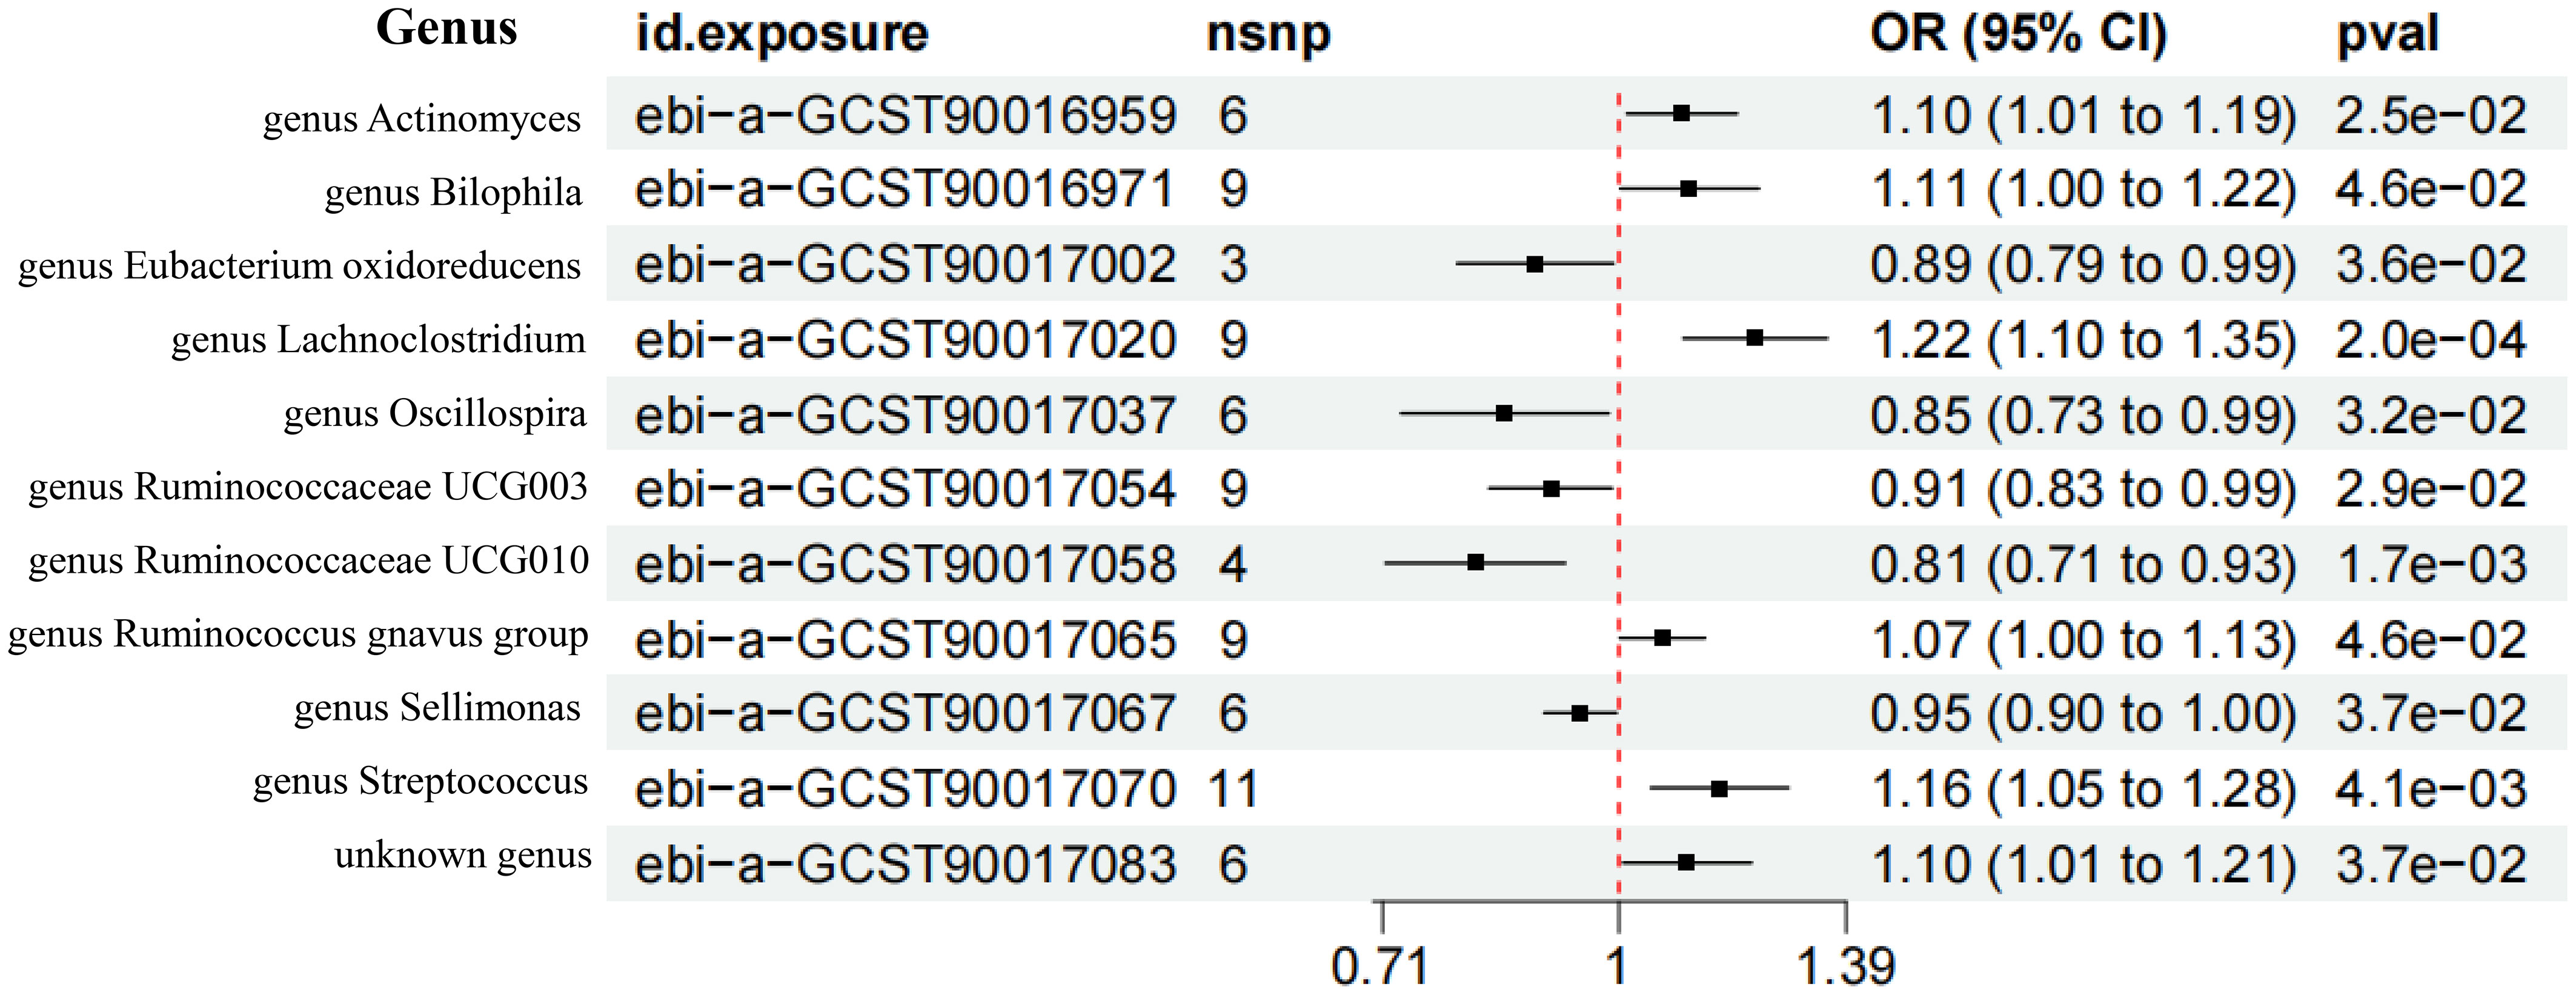
Figure 3 Forest plot of the MR results of 11 GM. nsnp represents the number of single nucleotide polymorphism. pval represents P-value.
3.2 MR analysis
The IVW analysis showed that the genus Actinomyces (OR = 1.10, 95%CI 1.01-1.19, P = 2.5e-02), genus Bilophila (OR = 1.11, 95%CI 1.00-1.22, P = 4.6e-02), genus Lachnoclostridium (OR = 1.22, 95%CI 1.10-1.35, P = 2.0e-04), genus Ruminococcus gnavus group (OR = 1.07, 95%CI 1.00-1.13, P = 4.6e-02), genus Streptococcus (OR = 1.16, 95%CI 1.05-1.28, P = 4.1e-03), and unknown genus (OR = 1.10, 95%CI 1.01-1.21, P = 3.7e-02) had a causal relationship with the increased risk of T2DM, while the genus Eubacterium oxidoreducens group (OR = 0.89, 95%CI 0.79-0.99, P = 3.6e-02), genus Oscillospira (OR = 0.85, 95%CI 0.73-0.99, P = 3.2e-02), genus Ruminococcaceae UCG003 (OR = 0.91, 95%CI 0.83-0.99, P = 2.9e-02), genus Ruminococcaceae UCG010 (OR = 0.81, 95%CI 0.71-0.93, P = 1.7e-03), and genus Sellimonas (OR = 0.95, 95%CI 0.90-1.00, P = 3.7e-02) had a causal relationship with the reduced risk of T2DM (Figures 4A, B). The results of the WME analysis supported the above conclusions. In the results of the genus Bilophila, genus Ruminococcaceae UCG003, genus Ruminococcaceae UCG010, genus Ruminococcus gnavus group, the total effect values of MR-Egger and IVW are in the opposite direction. (Supplementary Table 2; Figures 5, 6). Because the results of IVW analysis are the most valuable and consistent with the forest plot, it was considered that the 11 GM we identified are related to the onset of T2DM. However, after FDR correction, it was found that only the genus Lachnoclostridium had a positive correlation with the risk of T2DM (OR = 1.22, q value = 0.09). The other ten GM were considered to be suggestive of T2DM.

Figure 4 MR estimates of the causal effects of 11 GM on T2DM. Forest plot of estimates of the causal effects of 11 GM on T2DM. (A) The green triangle represents the WME method, the red square represents the MR-Egger method, and the grey circle represents the IVW method. (B) Circular graph of estimates of the causal effects of 11 GM on T2DM.
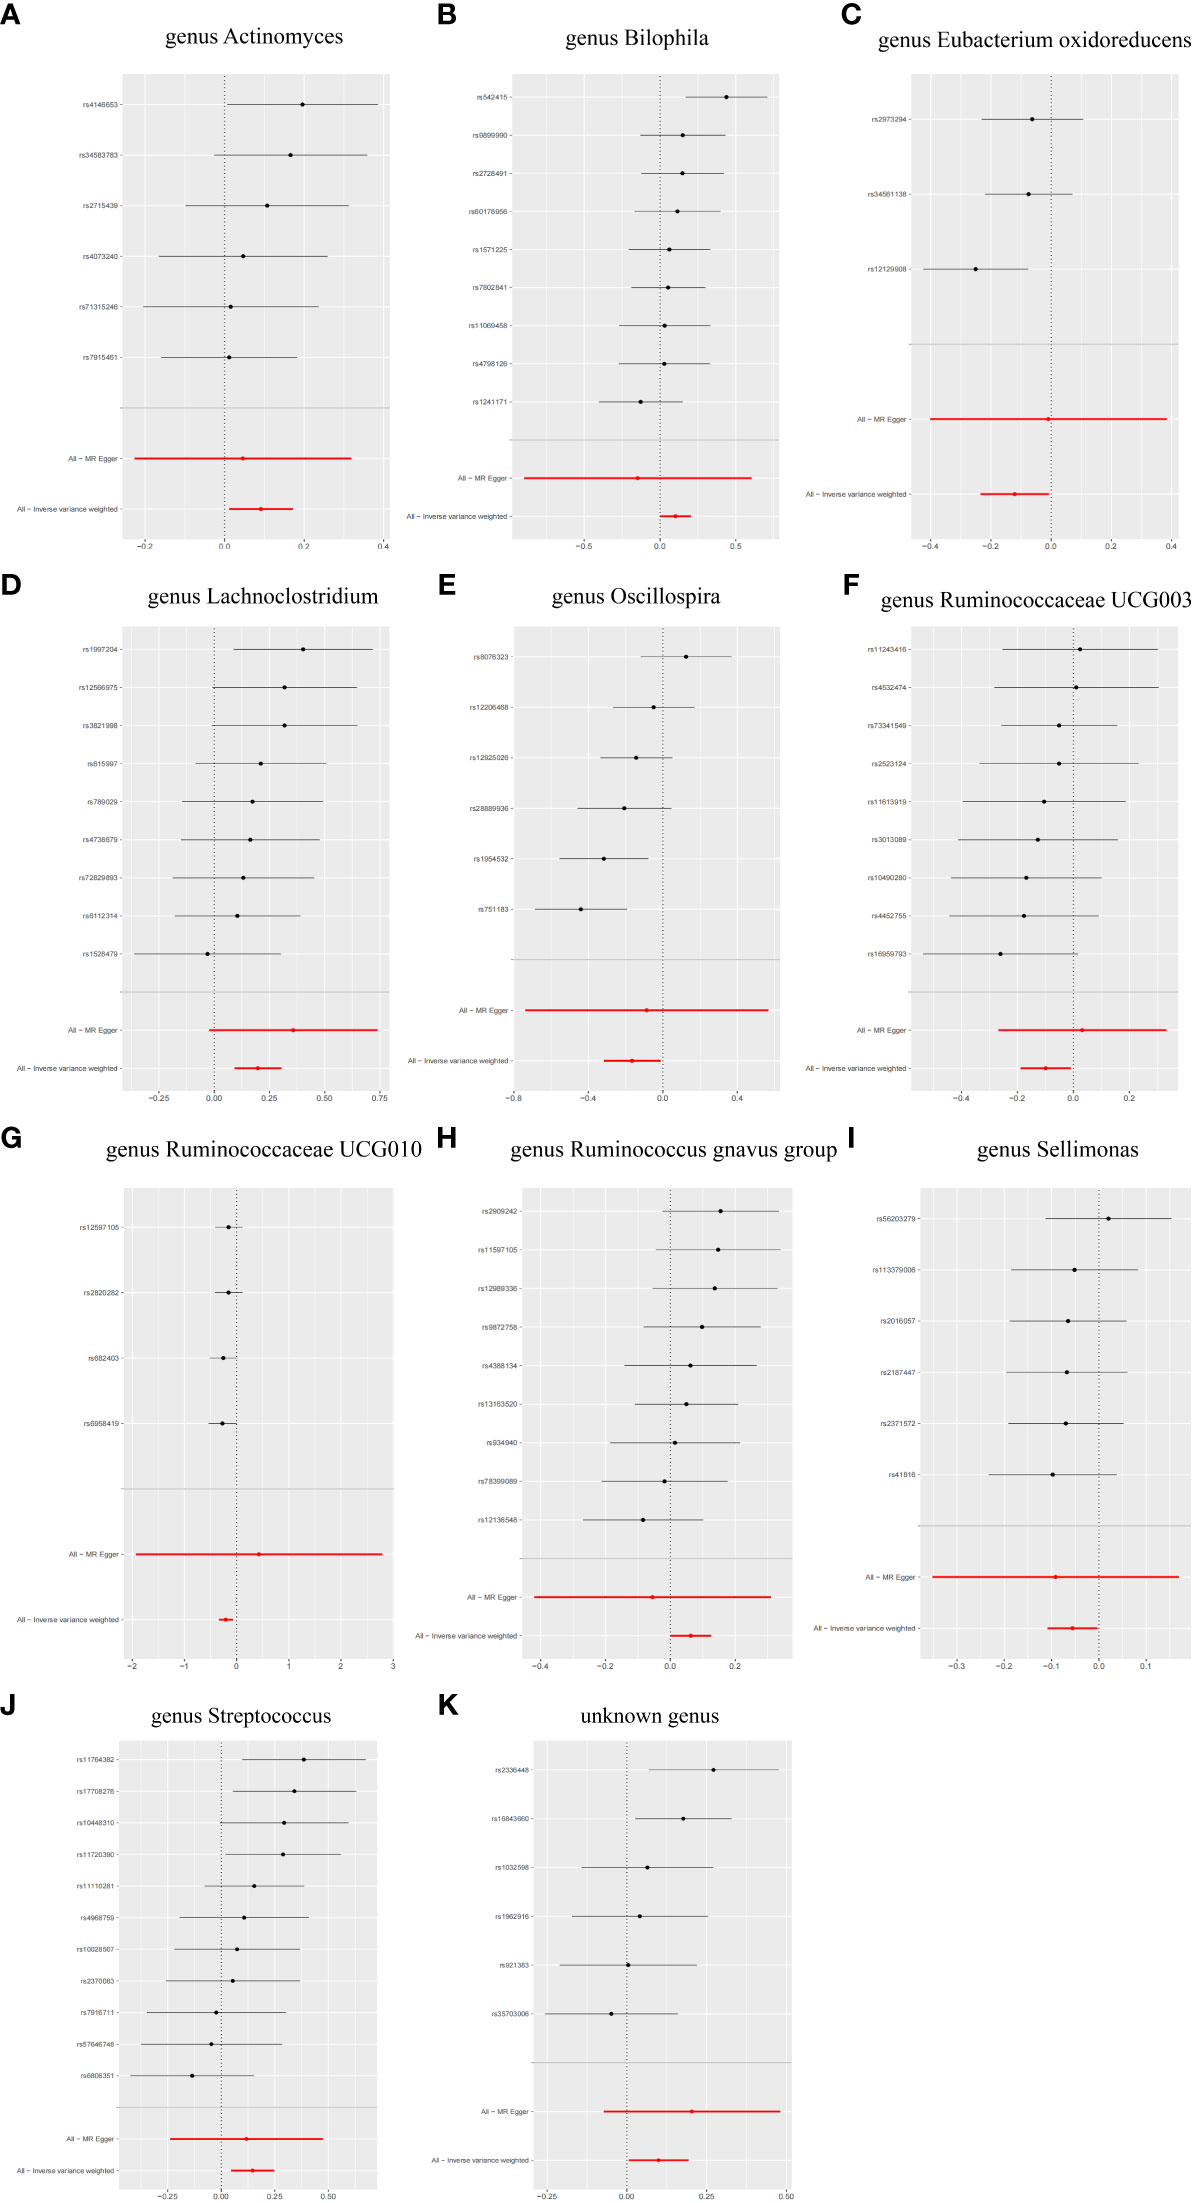
Figure 5 Forest plot of single SNP MR results. (A) genus Actinomyces. (B) genus Bilophila. (C) genus Eubacterium oxidoreducens. (D) genus Lachnoclostridium. (E) genus Oscillospira. (F) genus Ruminococcaceae UCG003. (G) genus Ruminococcaceae UCG010. (H) genus Ruminococcus gnavus group. (I) genus Sellimonas. (J) genus Streptococcus. (K) unknown genus.
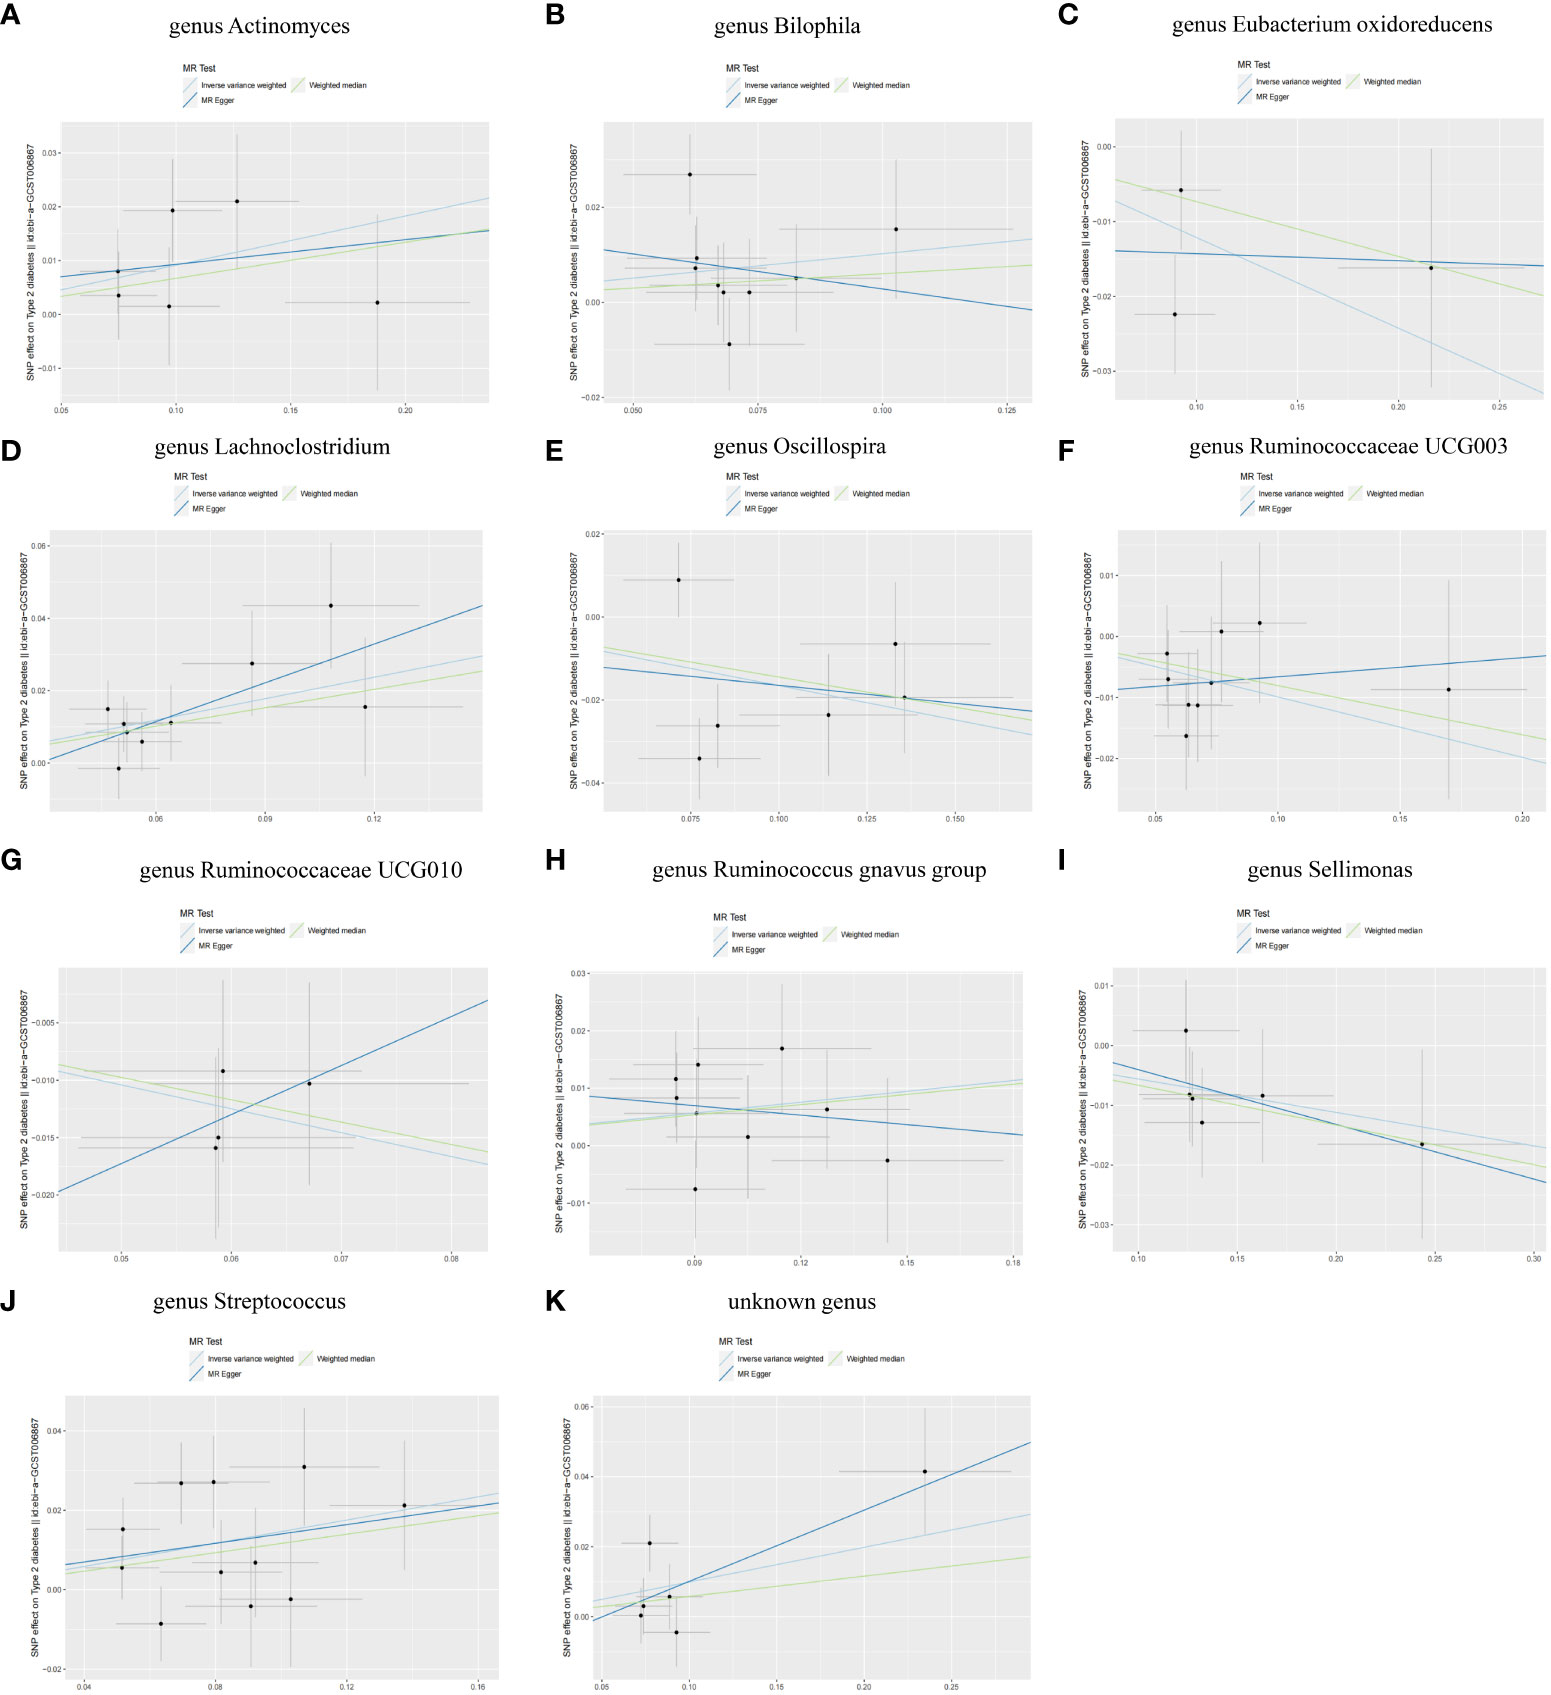
Figure 6 Scatter plots of SNP analysis (A) genus Actinomyces. (B) genus Bilophila. (C) genus Eubacterium oxidoreducens. (D) genus Lachnoclostridium. (E) genus Oscillospira. (F) genus Ruminococcaceae UCG003. (G) genus Ruminococcaceae UCG010. (H) genus Ruminococcus gnavus group. (I) genus Sellimonas. (J) genus Streptococcus. (K) unknown genus. The X-axis represents the influence of SNP on GM, the Y-axis represents the influence of SNP on T2DM, the black dot represents a single SNP, the line segment represents 95% CI, and the slope of the straight line represents the causal estimation of the MR method. The light blue line represents IVW method, the blue line represents MR Egger method, and the green line represents WME method.
Following the second MR analysis involving 418 GM sub-species and T2DM, we identified several taxa with potential causal relationships. Specifically, the genera Lachnoclostridium, Ruminococcustorquesgroup, and Streptococcus, along with Betaproteobacteria, Micrococcaceae, Bacteroidales, Rothia, Bacteroidales (specifically Roseburia), Burkholderiales, and Bacteroidales_bacterium_ph8 were associated with an increased risk of T2DM. Conversely, the family Alcaligenaceae, along with the genera RuminococcaceaeUCG003 and RuminococcaceaeUCG010, Clostridiaceae, and Coprobacter_fastidiosus exhibited a causal relationship with a reduced risk of T2DM (Supplementary Figure 1).
3.3 Sensitivity analysis
Cochran’s Q test and MR-Egger regression results showed that there is no significant heterogeneity and pleiotropy in this study (P > 0.05) (Supplementary Table 3). Funnel plots showed that the possible interference factors are less likely to have an impact on causality (Supplementary Figures 2A-K). LOO analysis showed that the remaining SNPs had no significant effect on the analysis results after removing individual SNP in turn (Supplementary Figures 3A-K). These analyses proved the robustness of the results of this study.
3.4 Bidirectional MR analysis
The reverse MR analysis revealed no evidence of a causal relationship between T2DM and the heightened risk associated with the positively identified GM (Figures 7A-J). Notably, the unknown genus was excluded from this analysis.

Figure 7 Forest plot of the bidirectional MR analysis of the positively identified 10 GM. (A) genus Actinomyces. (B) genus Bilophila. (C) genus Eubacterium oxidoreducens. (D) genus Lachnoclostridium. (E) genus Oscillospira. (F) genus Ruminococcaceae UCG003. (G) genus Ruminococcaceae UCG010. (H) genus Ruminococcus gnavus group. (I) genus Sellimonas. (J) genus Streptococcus.
3.5 Mediation analysis
Through mediation analysis, we found that Leucine (OR = 4.33, 95%CI 1.08-17.36, P = 3.9e-02), Carnitine (OR = 2.49, 95%CI 1.04-5.97, P = 4.1e-02), and 1-arachidonoylglycerophosphocholine (OR = 1.50, 95%CI 1.17-1.92, P =1.5e-03) had a causal relationship with the increased risk of T2DM (Figure 8). Both GM and metabolites exhibit causal effects on T2DM. Although metabolites appear to mediate the relationship between GM and T2DM, the requirement for mediation is a significant association between GM and metabolites. However, our results indicate no causal relationship between GM associated with T2DM and metabolites related to T2DM. This suggested that metabolites do not act as mediators in the pathway from GM to T2DM (Supplementary Table 4).
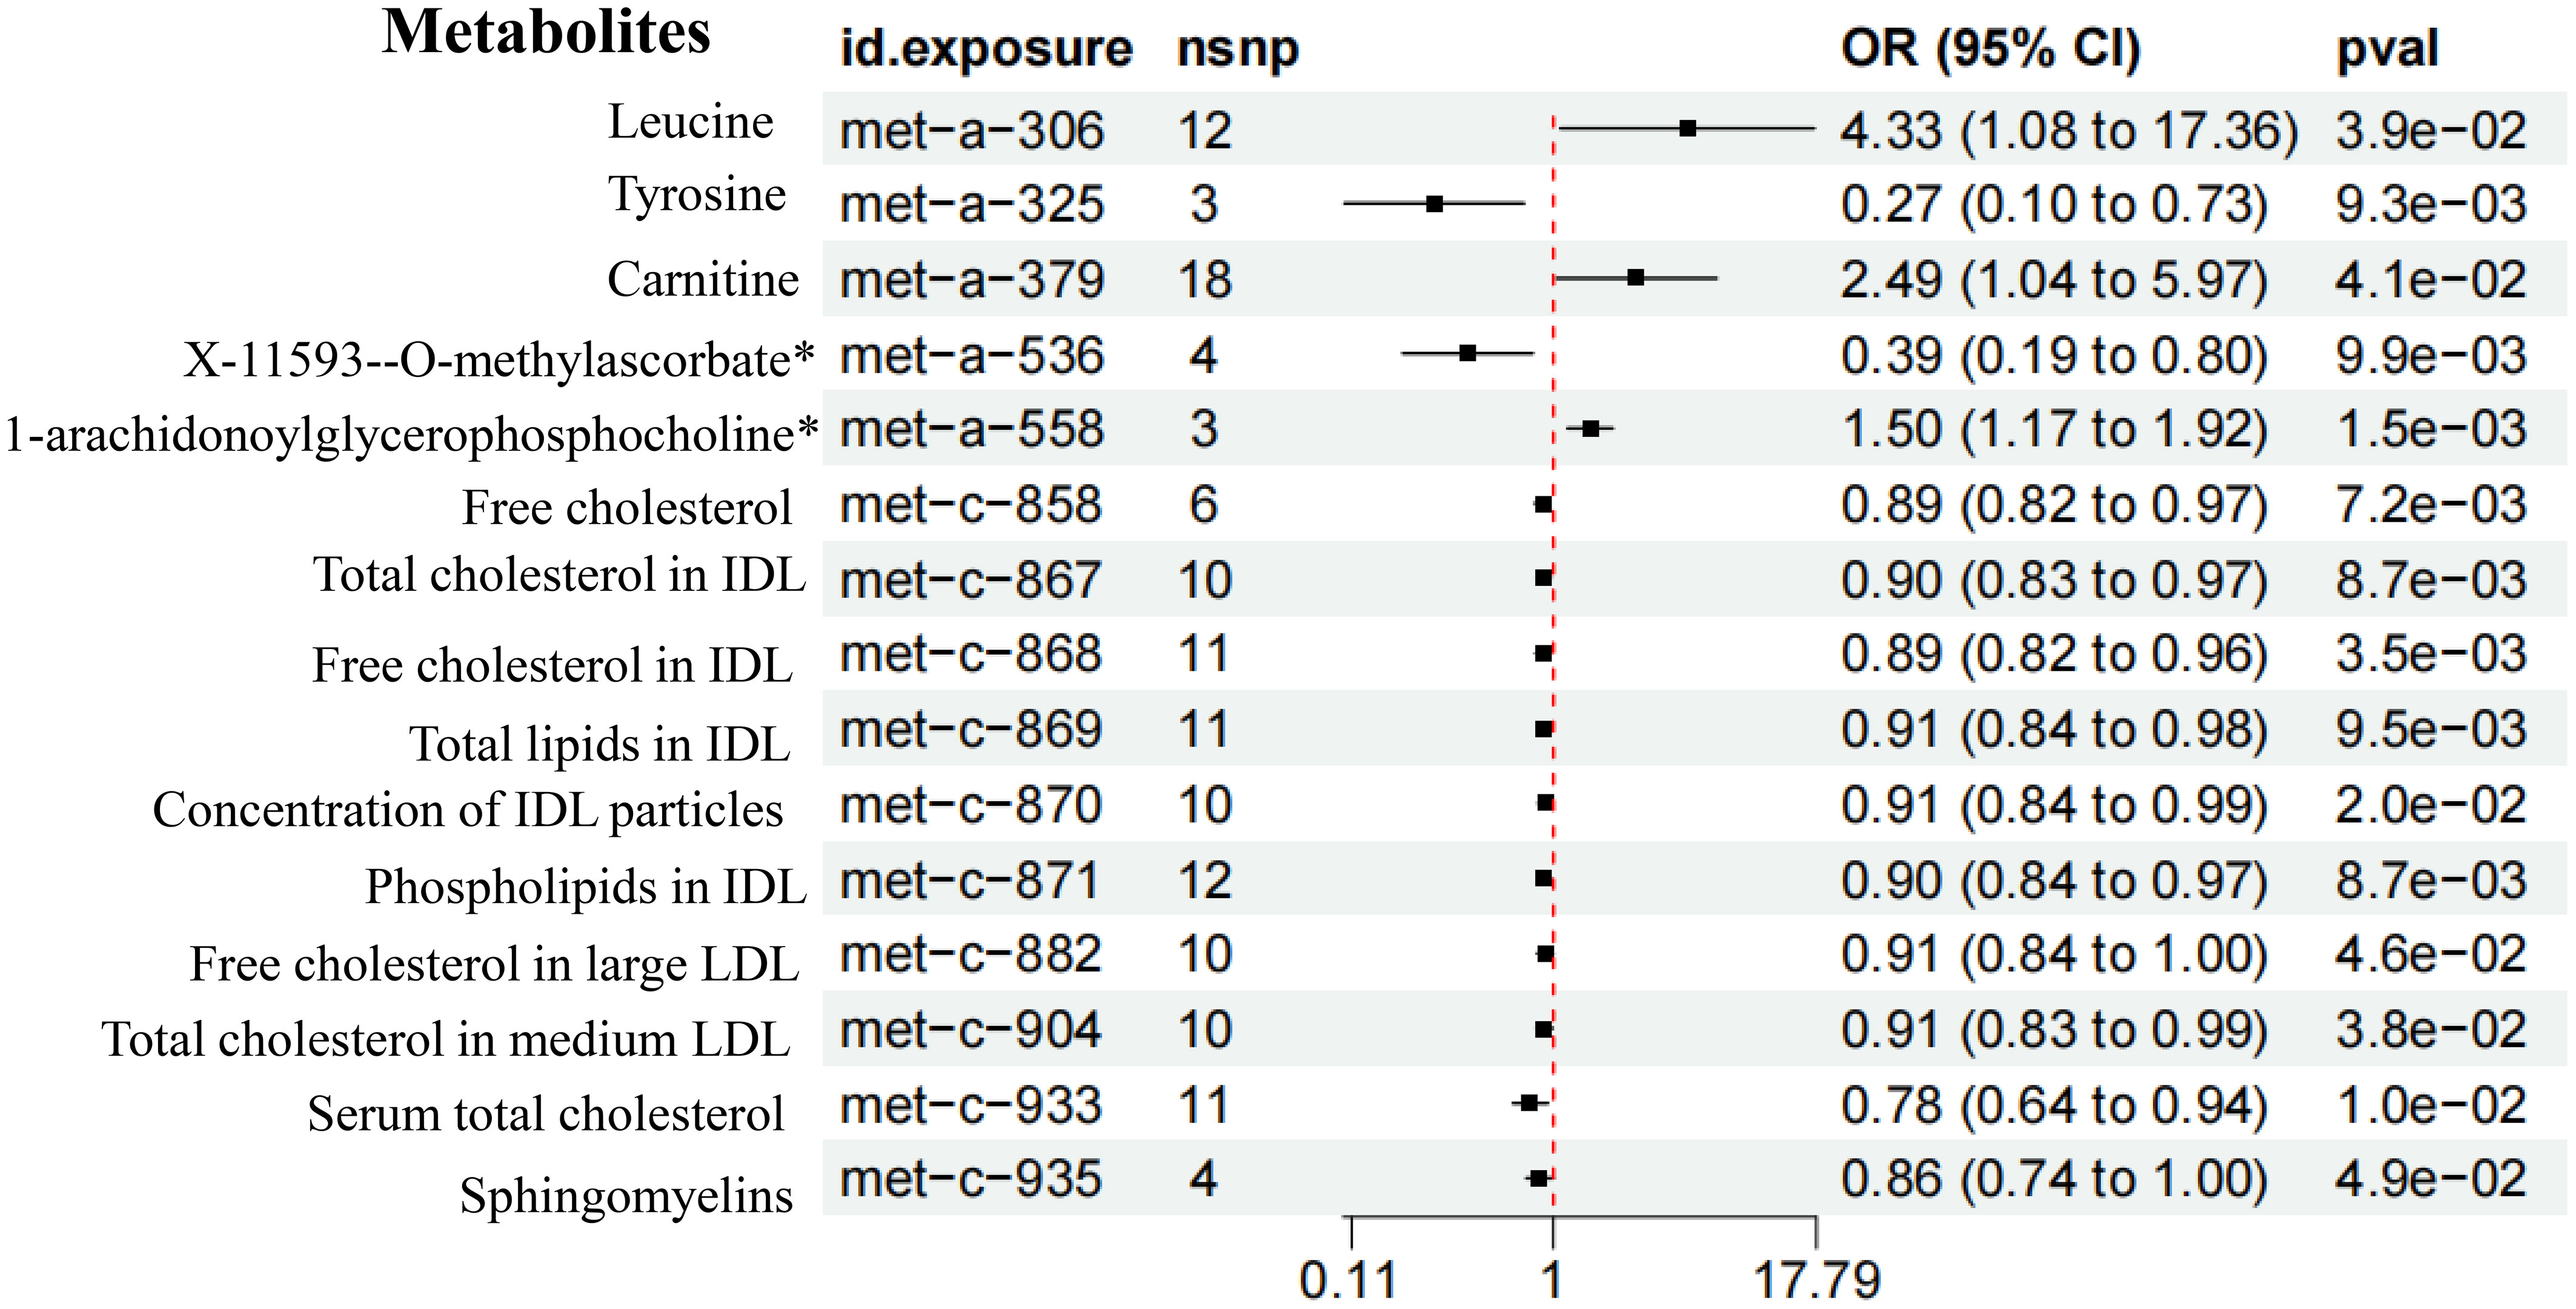
Figure 8 Forest plot of the MR results of metabolites on T2DM.
4 Discussion
In this study, based on large-scale GWAS data, a two-sample MR method was used to analyze the causal relationship between GM and T2DM. The results showed that genus Actinomyces, genus Bilophila, genus Lachnoclostridium, genus Ruminococcus gnavus group, and genus Streptococcus had a causal relationship with the increased risk of T2DM, while genus Eubacterium oxidoreducens group, genus Oscillospira, genus Ruminococcaceae UCG003, genus Ruminococcaceae UCG010, and genus Sellimonas had a causal relationship with the reduced risk of T2DM. Further sensitivity analysis results indicated that the above results are consistent and reliable.
Research indicates a close relationship between T2DM and GM, with GM’s structural composition and metabolites exerting influence on T2DM (27). Actinomycetes, known for their efficacy in steroid conversion, play a pivotal role in this process (28). Specifically, cholesterol in the liver undergoes conversion into primary cholic acid, subsequently forming secondary cholic acid through enterohepatic circulation. Notably, secondary cholic acid, a predominant metabolite of intestinal bacteria, has been implicated in regulating glucose homeostasis via bile acid sensing mediated by Takeda G protein-coupled receptor 5 (TGR5) (29). Activation of TGR5 by bile acid prompts an increase in energy expenditure, thereby mitigating diet-induced obesity. Furthermore, TGR5 signaling stimulates the release of intestinal glucagon-like peptide-1 (GLP-1), enhancing liver and pancreas function and improving glucose tolerance in obese mice (30).
Bilophila plays a multifaceted role in gut health, contributing to both intestinal inflammation and disturbances in bile acid metabolism and microbial composition. These disruptions ultimately culminate in metabolic impairment and host dysfunction. Notably, Bilophila exhibits a negative correlation with glucose metabolism, indicating its involvement in regulating susceptibility not only to inflammatory diseases but also to metabolic disorders (31). These findings underscore the intricate interplay between GM and energy metabolism, highlighting their correlation with clinical indicators.
Blandino highlighted a positive correlation between the abundance of the genus Lachnoclostridium and fasting blood glucose as well as glycosylated hemoglobin levels (32). Elevated levels of Lachnoclostridium are associated with decreased circulating acetic acid, potentially leading to increased abdominal fat accumulation and exerting a detrimental effect on T2DM.
Ruminococcaceae-producing ursodeoxycholic acid (UDCA) plays a key role in promoting bile acid secretion. In a study investigating the impact of exercise on insulin sensitivity and glucose homeostasis in individuals with pre-T2DM, findings revealed a negative correlation between the abundance of Ruminococcaceae and fasting plasma glucose (FPG), fasting insulin levels, and homeostatic model assessment of insulin resistance (HOMA-IR). Conversely, a positive correlation was observed with the insulin sensitivity index (33). Moreover, enhanced jejunal-ileal bypass surgery in Goto-Kakizaki rats led to significant reductions in weight gain and serum lipid levels, accompanied by marked improvements in pancreatic islet β-cell function, glucose tolerance, and insulin resistance. Postoperatively, there was an increase in the abundance of Ruminococcaceae, which exhibited a negative correlation with blood glucose levels and a positive correlation with insulin levels (34).
Streptococcus is positively correlated with insulin, connexin, and the steady-state model evaluation index of insulin resistance (35). SCFAs represent crucial metabolites synthesized by beneficial microorganisms (36). They exert influence on glucose homeostasis by modulating glucose absorption and utilization across various organs (37). Research has indicated a correlation between alterations in SCFA levels in diabetic mice and the regulation of lipopolysaccharide-binding protein by Streptococcus (38). SCFAs have demonstrated favorable effects on T2DM by diminishing the production of pro-inflammatory cytokines such as TNK-α, IL-6, MCP-1, and NF-κB (39). Notably, this study marks the first instance of identifying the Eubacterium oxidoreducens group, genus Ruminococcaceae UCG003, and genus Ruminococcaceae UCG010 as negative regulators in the progression of T2DM. Additionally, there is scant literature on the relationship between the Eubacterium oxidoreducens group and T2DM.
Oscillospira is negatively correlated with fasting blood glucose, which is an index of glucose metabolism disorder (40). In addition, Oscillospira can produce butyrate (41). Julienne Siptroth described the fermentation to butyrate for T2DM, which tend to have high potential for disease detection (42). Oscillospira plays an important role in GM, and its abundance is closely related to host health (43).
Sellimonas, identified as a Gram-positive obligate anaerobe (44), exhibits increased relative abundance in individuals recovering from intestinal ecological disturbances triggered by tumors or chronic metabolic ailments, eventually stabilizing at a steady state (45, 46). Consequently, Sellimonas emerges as a potential biomarker candidate for the restoration of intestinal homeostasis.
In this study, the relative abundance expression of GM was employed to delineate their potential “beneficial” or “harmful” roles in the context of T2DM. However, the precise mechanisms underlying how GM contribute to the development of T2DM remain elusive. It was postulated that metabolites could serve as the mediating factor between GM and T2DM. Our findings identified Leucine, Carnitine, and 1-arachidonoylglycerophosphocholine as causally linked to an increased risk of T2DM. Nonetheless, our analysis revealed that metabolites did not function as mediators in the pathway from GM to T2DM.
Recent studies have delved into the impact of GM on the etiology of T2DM. The SCFA theory, bile acid theory, and endotoxin theory represent three potential mechanisms through which GM may contribute to the onset and progression of T2DM. Based on the findings of this investigation, we postulate that the genus Actinomyces, genus Bilophila, genus Lachnoclostridium, genus Ruminococcus gnavus group, and genus Streptococcus may disrupt pancreatic islet cell function by influencing the metabolism of SCFAs, bile acids, and endotoxin reactions. Consequently, this disruption could diminish the body’s insulin sensitivity, thereby facilitating the initiation and progression of T2DM (47). However, it is plausible that these alterations in microbial abundance may be a response to environmental stress or high sugar environments aimed at mitigating systemic dysfunction. Conversely, the increased abundance of the genus Eubacterium oxidoreducens group, genus Oscillospira, genus Ruminococcaceae UCG003, genus Ruminococcaceae UCG010, and genus Sellimonas exhibited a causally negative effect on the risk of T2DM. These findings deepen our comprehension of the intricate interplay between GM and T2DM, potentially paving the way for novel preventive strategies against T2DM. Moreover, it is noteworthy that T2DM itself could influence changes in GM and metabolite profiles.
Based on the findings of this study, there is potential for further investigation into the protective mechanisms of GM in mitigating T2DM. This could lead to the development of foods or beverages enriched with genera such as Eubacterium oxidoreducens group, Oscillospira, Ruminococcaceae UCG003, Ruminococcaceae UCG010, and Sellimonas, aiming to prevent T2DM. Such endeavors could open up a novel avenue for drug research in the field of T2DM.
The study possesses several strengths. Firstly, it benefits from a large sample size, which minimizes the impact of confounding factors on the results. Secondly, it employs robust methodologies to estimate causal relationships between exposure factors and disease outcomes, thus mitigating the issues of reverse causality often encountered in traditional observational studies. Thirdly, it marks the first identification of the genetic-level association between GM and the risk of T2DM. However, there are certain limitations to consider. Firstly, the outcome data used in the study are derived from European populations, limiting the generalizability of the findings. Future research should aim to validate these results in larger, more diverse populations. Secondly, the available data lack detailed information such as general health status, dietary habits, geographic location, age, and gender, precluding further subgroup analyses. Thirdly, additional mediation MR analyses, particularly focusing on SCFAs, are warranted to validate the findings. Fourthly, considering the multifactorial influence of GM on human health, it is imperative to conduct sequencing verification using clinical samples in future studies. Lastly, the intricate interactions among the gut mycobiome, virome, and microorganisms necessitate further clinical validation to elucidate their specific roles in T2DM. Determining the precise role of these interactions in T2DM pathogenesis represents a crucial research objective.
5 Conclusion
There is a causal relationship between GM and T2DM, the genus Eubacterium oxidoreducens group, genus Oscillospira, genus Ruminococcaceae UCG003, genus Ruminococcaceae UCG010, and genus Sellimonas are protective factors of T2DM. Metabolites did not appear to act as mediators in the pathway from GM to T2DM.
Data availability statement
The original contributions presented in the study are included in the article/Supplementary Material. Further inquiries can be directed to the corresponding author.
Author contributions
SS: Conceptualization, Writing – original draft. QZ: Data curation, Project administration, Writing – review & editing. LZ: Methodology, Validation, Writing – review & editing. XZ: Conceptualization, Writing – original draft. JY: Software, Writing – original draft.
Funding
The author(s) declare financial support was received for the research, authorship, and/or publication of this article. This study was supported by grants from National Natural Science Foundation of China (Grant No. 82174293 and 82374355),Science and Technology Support Program of Jiangsu Province (ZD202208).
Acknowledgments
We thank all contributors to the IEU OpenGWAS Project and MiBioGen Federation.
Conflict of interest
The authors declare that the research was conducted in the absence of any commercial or financial relationships that could be construed as a potential conflict of interest.
Publisher’s note
All claims expressed in this article are solely those of the authors and do not necessarily represent those of their affiliated organizations, or those of the publisher, the editors and the reviewers. Any product that may be evaluated in this article, or claim that may be made by its manufacturer, is not guaranteed or endorsed by the publisher.
Supplementary material
The Supplementary Material for this article can be found online at: https://www.frontiersin.org/articles/10.3389/fendo.2024.1313651/full#supplementary-material
Supplementary Figure 1 | MR analysis between the 418 GM sub-species and T2DM.
Supplementary Figure 2 | Funnel plots of sensitivity analysis.
Supplementary Figure 3 | Forest plots of LOO sensitivity analysis. The black dot represents the T2DM with increased standard deviation (SD) in GM, which is generated by using each SNP as a separate tool variable. The red dot represents the causal estimation of all SNP combinations by different MR methods. The horizontal line segment represents 95%CI. The IVW causal estimate and how the overall estimate (red horizontal line) was disproportionately driven, which is influenced by the removal of a single variant (black horizontal line), were visualized.
Supplementary Table 1 | Specific information of IVs used in MR analysis of 11 GM.
Supplementary Table 2 | MR estimates of the causal effects of 11 GM on T2DM.
Supplementary Table 3 | Sensitivity analysis.
Supplementary Table 4 | Relationship between GM related to T2DM and metabolites related to T2DM.
Abbreviations
FDR, false discovery rate; GM, gut microbiota; IVs, Instrumental variables; IVW, Inverse variance weighted; GWAS, Genome-wide association study; LD, linkage disequilibrium; LOO, Leave-one-out; MR, Mendelian randomization; MRS, Microbiome risk score; SCFAs, short-chain fatty acids; SNPs, Single nucleotide polymorphisms; T2DM, Type 2 diabetes mellitus; WME, Weighted median.
References
1. Hsia E, Draznin B. Intensive control of diabetes in the hospital: why, how, and what is in the future? J Diabetes Sci Technol. (2011) 5:1596–601. doi: 10.1177/193229681100500637
2. Agarwal K, Maki KA, Vizioli C, Carnell S, Goodman E, Hurley M, et al. The neuro-endo-microbio-ome study: A pilot study of neurobiological alterations pre- versus post-bariatric surgery. Biol Res Nurs. (2022) 24:362–78. doi: 10.1177/10998004221085976
3. Clements SJ, S RC. Diet, the intestinal microbiota, and immune health in aging. Crit Rev Food Sci Nutr. (2018) 58:651–61. doi: 10.1080/10408398.2016.1211086
4. Ma L, Zhang L, Li J, Zhang X, Xie Y, Li X, et al. The potential mechanism of gut microbiota-microbial metabolites-mitochondrial axis in progression of diabetic kidney disease. Mol Med. (2023) 29:148. doi: 10.1186/s10020-023-00745-z
5. Hwang I, Park YJ, Kim YR, Kim YN, Ka S, Lee HY, et al. Alteration of gut microbiota by vancomycin and bacitracin improves insulin resistance via glucagon-like peptide 1 in diet-induced obesity. FASEB J. (2015) 29:2397–411. doi: 10.1096/fj.14-265983
6. Gou W, Ling CW, He Y, Jiang Z, Fu Y, Xu F, et al. Interpretable machine learning framework reveals robust gut microbiome features associated with type 2 diabetes. Diabetes Care. (2021) 44:358–66. doi: 10.2337/dc20-1536
7. Bao L, Zhang Y, Zhang G, Jiang D, Yan D. Abnormal proliferation of gut mycobiota contributes to the aggravation of Type 2 diabetes. Commun Biol. (2023) 6:226. doi: 10.1038/s42003-023-04591-x
8. Fan G, Cao F, Kuang T, Yi H, Zhao C, Wang L, et al. Alterations in the gut virome are associated with type 2 diabetes and diabetic nephropathy. Gut Microbes. (2023) 15:2226925. doi: 10.1080/19490976.2023.2226925
9. Gu Y, Chen H, Li X, Li D, Sun Y, Yang L, et al. Lactobacillus paracasei IMC 502 ameliorates type 2 diabetes by mediating gut microbiota-SCFA-hormone/inflammation pathway in mice. J Sci Food Agric. (2023) 103:2949–59. doi: 10.1002/jsfa.12267
10. Lawlor DA, Harbord RM, Sterne JA, Timpson N, Davey Smith G. Mendelian randomization: using genes as instruments for making causal inferences in epidemiology. Stat Med. (2008) 27:1133–63. doi: 10.1002/sim.3034
11. Zheng J, Baird D, Borges MC, Bowden J, Hemani G, Haycock P, et al. Recent developments in mendelian randomization studies. Curr Epidemiol Rep. (2017) 4:330–45. doi: 10.1007/s40471-017-0128-6
12. Burgess S, Scott RA, Timpson NJ, Davey Smith G, Thompson SG, Consortium E-I. Using published data in Mendelian randomization: a blueprint for efficient identification of causal risk factors. Eur J Epidemiol. (2015) 30:543–52. doi: 10.1007/s10654-015-0011-z
13. Kurilshikov A, Medina-Gomez C, Bacigalupe R, Radjabzadeh D, Wang J, Demirkan A, et al. Large-scale association analyses identify host factors influencing human gut microbiome composition. Nat Genet. (2021) 53:156–65. doi: 10.1038/s41588-020-00763-1
14. Shin H. XGBoost regression of the most significant photoplethysmogram features for assessing vascular aging. IEEE J BioMed Health Inform. (2022) 26:3354–61. doi: 10.1109/JBHI.2022.3151091
15. Hartwig FP, Davies NM, Hemani G, Davey Smith G. Two-sample Mendelian randomization: avoiding the downsides of a powerful, widely applicable but potentially fallible technique. Int J Epidemiol. (2016) 45:1717–26. doi: 10.1093/ije/dyx028
16. Kamat MA, Blackshaw JA, Young R, Surendran P, Burgess S, Danesh J, et al. PhenoScanner V2: an expanded tool for searching human genotype-phenotype associations. Bioinformatics. (2019) 35:4851–3. doi: 10.1093/bioinformatics/btz469
17. Burgess S, Small DS, Thompson SG. A review of instrumental variable estimators for Mendelian randomization. Stat Methods Med Res. (2017) 26:2333–55. doi: 10.1177/0962280215597579
18. Burgess S, Thompson SG. Interpreting findings from Mendelian randomization using the MR-Egger method. Eur J Epidemiol. (2017) 32:377–89. doi: 10.1007/s10654-017-0255-x
19. Bowden J, Davey Smith G, Burgess S. Mendelian randomization with invalid instruments: effect estimation and bias detection through Egger regression. Int J Epidemiol. (2015) 44:512–25. doi: 10.1093/ije/dyv080
20. Bowden J, Davey Smith G, Haycock PC, Burgess S. Consistent estimation in mendelian randomization with some invalid instruments using a weighted median estimator. Genet Epidemiol. (2016) 40:304–14. doi: 10.1002/gepi.21965
21. Lin Z, Deng Y, Pan W. Combining the strengths of inverse-variance weighting and Egger regression in Mendelian randomization using a mixture of regressions model. PloS Genet. (2021) 17:e1009922. doi: 10.1371/journal.pgen.1009922
22. Bowden J, Del Greco MF, Minelli C, Davey Smith G, Sheehan NA, Thompson JR. Assessing the suitability of summary data for two-sample Mendelian randomization analyses using MR-Egger regression: the role of the I2 statistic. Int J Epidemiol. (2016) 45:1961–74. doi: 10.1093/ije/dyw220
23. Storey JD, Tibshirani R. Statistical significance for genomewide studies. Proc Natl Acad Sci U.S.A. (2003) 100:9440–5. doi: 10.1073/pnas.1530509100
24. Hayreh SS. Ocular vascular occlusive disorders: natural history of visual outcome. Prog Retin Eye Res. (2014) 41:1–25. doi: 10.1016/j.preteyeres.2014.04.001
25. Pierce BL, Burgess S. Efficient design for Mendelian randomization studies: subsample and 2-sample instrumental variable estimators. Am J Epidemiol. (2013) 178:1177–84. doi: 10.1093/aje/kwt084
26. Li L, Ren Q, Zheng Q, Bai Y, He S, Zhang Y, et al. Causal associations between gastroesophageal reflux disease and lung cancer risk: A Mendelian randomization study. Cancer Med. (2023) 12:7552–9. doi: 10.1002/cam4.5498
27. Ling LJ, Hershenson MB, Young S, Traisman HS. Home parenteral nutrition in a child with Menetrier disease. Eur J Pediatr. (1986) 144:505–7. doi: 10.1007/BF00441749
28. Ke J, An Y, Cao B, Lang J, Wu N, Zhao D. Orlistat-induced gut microbiota modification in obese mice. Evid Based Complement Alternat Med. (2020) 2020:9818349. doi: 10.1155/2020/9818349
29. Ding L, Yang Q, Zhang E, Wang Y, Sun S, Yang Y, et al. Notoginsenoside Ft1 acts as a TGR5 agonist but FXR antagonist to alleviate high fat diet-induced obesity and insulin resistance in mice. Acta Pharm Sin B. (2021) 11:1541–54. doi: 10.1016/j.apsb.2021.03.038
30. Matsubara T, Li F, Gonzalez FJ. FXR signaling in the enterohepatic system. Mol Cell Endocrinol. (2013) 368:17–29. doi: 10.1016/j.mce.2012.05.004
31. Natividad JM, Lamas B, Pham HP, Michel ML, Rainteau D, Bridonneau C, et al. Bilophila wadsworthia aggravates high fat diet induced metabolic dysfunctions in mice. Nat Commun. (2018) 9:2802. doi: 10.1038/s41467-018-05249-7
32. Blandino G, Inturri R, Lazzara F, Di Rosa M, Malaguarnera L. Impact of gut microbiota on diabetes mellitus. Diabetes Metab. (2016) 42:303–15. doi: 10.1016/j.diabet.2016.04.004
33. Liu Y, Wang Y, Ni Y, Cheung CKY, Lam KSL, Wang Y, et al. Gut microbiome fermentation determines the efficacy of exercise for diabetes prevention. Cell Metab. (2020) 31:77–91 e75. doi: 10.1016/j.cmet.2019.11.001
34. Tan C, Zheng Z, Wan X, Cao J, Wei R, Duan J. The role of gut microbiota and amino metabolism in the effects of improvement of islet beta-cell function after modified jejunoileal bypass. Sci Rep. (2021) 11:4809. doi: 10.1038/s41598-021-84355-x
35. Liu S, Cao R, Liu L, Lv Y, Qi X, Yuan Z, et al. Correlation between gut microbiota and testosterone in male patients with type 2 diabetes mellitus. Front Endocrinol (Lausanne). (2022) 13:836485. doi: 10.3389/fendo.2022.836485
36. Ji X, Hou C, Gao Y, Xue Y, Yan Y, Guo X. Metagenomic analysis of gut microbiota modulatory effects of jujube (Ziziphus jujuba Mill.) polysaccharides in a colorectal cancer mouse model. Food Funct. (2020) 11:163–73. doi: 10.1039/C9FO02171J
37. Chen Y, Guo J, Qian G, Fang D, Shi D, Guo L, et al. Gut dysbiosis in acute-on-chronic liver failure and its predictive value for mortality. J Gastroenterol Hepatol. (2015) 30:1429–37. doi: 10.1111/jgh.12932
38. Ma Q, Zhai R, Xie X, Chen T, Zhang Z, Liu H, et al. Hypoglycemic Effects of Lycium barbarum Polysaccharide in Type 2 Diabetes Mellitus Mice via Modulating Gut Microbiota. Front Nutr. (2022) 9:916271. doi: 10.3389/fnut.2022.916271
39. Mazhar M, Zhu Y, Qin L. The interplay of dietary fibers and intestinal microbiota affects type 2 diabetes by generating short-chain fatty acids. Foods. (2023) 12:245–56. doi: 10.3390/foods12051023
40. Zeng Q, Li D, He Y, Li Y, Yang Z, Zhao X, et al. Discrepant gut microbiota markers for the classification of obesity-related metabolic abnormalities. Sci Rep. (2019) 9:13424. doi: 10.1038/s41598-019-49462-w
41. Gophna U, Konikoff T, Nielsen HB. Oscillospira and related bacteria - From metagenomic species to metabolic features. Environ Microbiol. (2017) 19:835–41. doi: 10.1111/1462-2920.13658
42. Siptroth J, Moskalenko O, Krumbiegel C, Ackermann J, Koch I, Pospisil H. Variation of butyrate production in the gut microbiome in type 2 diabetes patients. Int Microbiol. (2023) 26:601–10. doi: 10.1007/s10123-023-00324-6
43. Yang J, Li Y, Wen Z, Liu W, Meng L, Huang H. Oscillospira - a candidate for the next-generation probiotics. Gut Microbes. (2021) 13:1987783. doi: 10.1080/19490976.2021.1987783
44. Seo B, Yoo JE, Lee YM, Ko G. Sellimonas intestinalis gen. nov., sp. nov., isolated from human faeces. Int J Syst Evol Microbiol. (2016) 66:951–6. doi: 10.1099/ijsem.0.000817
45. Kong C, Gao R, Yan X, Huang L, He J, Li H, et al. Alterations in intestinal microbiota of colorectal cancer patients receiving radical surgery combined with adjuvant CapeOx therapy. Sci China Life Sci. (2019) 62:1178–93. doi: 10.1007/s11427-018-9456-x
46. Liu Y, Li J, Jin Y, Zhao L, Zhao F, Feng J, et al. Splenectomy leads to amelioration of altered gut microbiota and metabolome in liver cirrhosis patients. Front Microbiol. (2018) 9:963. doi: 10.3389/fmicb.2018.00963
Keywords: gut microbiota, type 2 diabetes mellitus, genus Lachnoclostridium Actinomyces, bidirectional, metabolites
Citation: Song S, Zhang Q, Zhang L, Zhou X and Yu J (2024) A two-sample bidirectional Mendelian randomization analysis investigates associations between gut microbiota and type 2 diabetes mellitus. Front. Endocrinol. 15:1313651. doi: 10.3389/fendo.2024.1313651
Received: 10 October 2023; Accepted: 15 February 2024;
Published: 01 March 2024.
Edited by:
Amy Alman, University of South Florida, United StatesReviewed by:
Angélica G. Martínez-H, National Institute of Genomic Medicine (INMEGEN), MexicoGeorge Grant, University of Aberdeen, United Kingdom
Akihiko Oka, Shimane University, Japan
Copyright © 2024 Song, Zhang, Zhang, Zhou and Yu. This is an open-access article distributed under the terms of the Creative Commons Attribution License (CC BY). The use, distribution or reproduction in other forums is permitted, provided the original author(s) and the copyright owner(s) are credited and that the original publication in this journal is cited, in accordance with accepted academic practice. No use, distribution or reproduction is permitted which does not comply with these terms.
*Correspondence: Jiangyi Yu, MTQwMTc0MzExOEBxcS5jb20=