
94% of researchers rate our articles as excellent or good
Learn more about the work of our research integrity team to safeguard the quality of each article we publish.
Find out more
ORIGINAL RESEARCH article
Front. Endocrinol., 19 June 2024
Sec. Endocrinology of Aging
Volume 15 - 2024 | https://doi.org/10.3389/fendo.2024.1308841
This article is part of the Research TopicEndocrinology of Obesity, Aging and StressView all 16 articles
 Peipei Han1,2,3†
 Xiaoyu Chen2†
 Zhenwen Liang2†
 Yuewen Liu2
 Xing Yu2Peiyu Song3
 Yinjiao Zhao3
 Hui Zhang3Shuyan Zhu2Xinyi Shi2
 Qi Guo1,2,3*
Background: Untargeted metabonomics has provided new insight into the pathogenesis of sarcopenia. In this study, we explored plasma metabolic signatures linked to a heightened risk of sarcopenia in a cohort study by LC-MS-based untargeted metabonomics.
Methods: In this nested case–control study from the Adult Physical Fitness and Health Cohort Study (APFHCS), we collected blood plasma samples from 30 new-onset sarcopenia subjects (mean age 73.2 ± 5.6 years) and 30 healthy controls (mean age 74.2 ± 4.6 years) matched by age, sex, BMI, lifestyle, and comorbidities. An untargeted metabolomics methodology was employed to discern the metabolomic profile alterations present in individuals exhibiting newly diagnosed sarcopenia.
Results: In comparing individuals with new-onset sarcopenia to normal controls, a comprehensive analysis using liquid chromatography-mass spectrometry (LC-MS) identified a total of 62 metabolites, predominantly comprising lipids, lipid-like molecules, organic acids, and derivatives. Receiver operating characteristic (ROC) curve analysis indicated that the three metabolites hypoxanthine (AUC=0.819, 95% CI=0.711–0.927), L-2-amino-3-oxobutanoic acid (AUC=0.733, 95% CI=0.598–0.868) and PC(14:0/20:2(11Z,14Z)) (AUC= 0.717, 95% CI=0.587–0.846) had the highest areas under the curve. Then, these significant metabolites were observed to be notably enriched in four distinct metabolic pathways, namely, “purine metabolism”; “parathyroid hormone synthesis, secretion and action”; “choline metabolism in cancer”; and “tuberculosis”.
Conclusion: The current investigation elucidates the metabolic perturbations observed in individuals diagnosed with sarcopenia. The identified metabolites hold promise as potential biomarkers, offering avenues for exploring the underlying pathological mechanisms associated with sarcopenia.
Sarcopenia, defined by the gradual decline in skeletal muscle mass, muscle strength, and physical performance (1), is closely linked to the aging process and adverse health outcomes, including disability, diabetes, metabolic syndrome, poor quality of life, and increased mortality (2). Despite the severity of its symptoms and associated side effects, the pathophysiological mechanisms driving sarcopenia remain inadequately elucidated, and current pharmacotherapies demonstrate limited efficacy (3). Therefore, there exists a pressing imperative to uncover novel, clinically significant biomarkers, delineate high-risk populations, and attain a more profound understanding of the underlying pathological mechanisms to mitigate the onset and progression of sarcopenia.
Metabonomics emerges as a potent methodology capable of furnishing intricate insights into biological pathways, pivotal genes, and mutations, thus elucidating the mechanisms underlying disease progression and revealing diagnostic biomarkers Metabonomics analysis can be performed using untargeted or targeted approaches. Most of the current metabonomics studies were targeted metabonomics analyses (4–6).
Nevertheless, while targeted metabonomics offers precision, it inherently limits the potential for discovering novel biomarkers and unveiling previously unrecognized pathways in sarcopenia development. Untargeted metabolomic analysis emerges as essential for functional research, facilitating the integration of comprehensive metabolic profiles with biological insights (7).
Several integrated studies investigating the relationship between blood and fecal untargeted metabolomics and sarcopenia have been published. These studies involve untargeted profiling to discern trait-specific or shared metabolites linked with muscle mass and strength (8), comparing the plasma metabolome (9, 10), as well as analyzing the differences in fecal metabolites (11–13). Blood metabolomics primarily reflects systemic metabolic changes and can capture metabolites related to muscle metabolism, hormonal regulation, and systemic inflammation, which are directly relevant to the pathophysiology of sarcopenia. In contrast, fecal metabolomics offers insights into gut microbiota composition and activity, which, while important for overall health, may be less directly connected to muscle metabolism. The systemic nature of blood metabolomics makes it particularly valuable for identifying biomarkers that are directly associated with muscle mass and strength, and for understanding the systemic metabolic disturbances underlying sarcopenia.
Multiple studies have proposed that the characterization of metabolic signatures holds promise as a biomarker for investigating the physical debilitation associated with sarcopenia (14). However, research on metabolomic analysis in sarcopenia remains in its incipient stages. More research is needed to identify more valuable potential markers, especially by untargeted metabonomics. Furthermore, studies using untargeted metabonomics approaches have predominantly been conducted in Western populations (8, 9, 15, 16). Asians and Westerners differ in lifestyle factors such as exercise habits, sleep quality, stress levels, etc. These lifestyle factors potentially influence metabolic processes, thereby contributing to differences in metabolomic profiles.
Data from Asian populations are scarce and predominantly derived from cross-sectional studies, which are vulnerable to reverse causation and hinder the establishment of temporal and causal relationships. To our knowledge, only two studies have been conducted on Asian populations (17, 18).
Here, the objective of this study was to pinpoint potential plasma metabolite biomarkers linked with sarcopenia. These findings will enrich our understanding of sarcopenia’s progression and may aid in identifying new molecular targets for the treatment of this condition.
The study design entailed a nested case-control approach derived from the Adult Physical Fitness and Health Cohort Study (APFHCS) [ChiCTR1900024880]. The APFHCS is a substantial prospective, open, and dynamic cohort study primarily examining the correlation between physical fitness and health status within a broad adult population residing in Tianjin and Shanghai, China. All participants enrolled in the National Free Physical Examination Program were recruited for comprehensive annual health assessments. Subsequently, they were instructed to fill out detailed questionnaires regarding their lifestyle and medical history. Subsequently, they were subjected to lifelong follow-up through periodic visits. The characteristics of the study participants have been delineated in our prior investigation (19).
Subjects in this study participated in September 2019 (baseline) and September 2020 (follow-up) in Shanghai. A total of 380 subjects had a plasma sample available at baseline. Participants who met any of the following conditions were excluded from the study: (1) inability to provide informed consent; (2) inability to undergo anthropometric measurements; and (3) diagnosis of sarcopenia using the AWGS criteria. Among the 380 subjects, 48 individuals diagnosed with sarcopenia in 2019 were excluded from the analysis. Subsequently, 30 subjects who developed new-onset sarcopenia in 2020 were matched with non-sarcopenic individuals based on age, sex, BMI, lifestyle, and comorbidities using propensity score matching. Nearest neighbor matching without replacement was employed in a 1:1 manner, with a caliper set at 0.02 standard deviations of the logit of the propensity score. This study was approved by the Ethics Committee of Shanghai University of Medicine and Health Sciences. All study participants voluntarily participated by providing written informed consent and completing comprehensive questionnaires encompassing demographic variables, including age, sex, lifestyle behaviors, and medical history. The measurement methods were detailed in our previous cross-sectional study (19).
Sarcopenia was defined according to the Asian Working Group for Sarcopenia (AWGS) criteria (20), in which a person who has low muscle mass, low muscle strength and/or low physical performance was identified as having sarcopenia. Low muscle mass was classified as a relative skeletal muscle mass index (ASM/ht2) less than 7.0 kg/m2 and 5.7 kg/m2 in men and women, respectively; low muscle strength was defined as grip strength <28 kg or <18 kg for males and females, respectively; and low physical performance was defined as walking speed <1.0 m/s for both males and females.
Muscle mass was quantified employing direct segmental multi-frequency bioelectrical impedance analysis (BIA) (In-Body720; Biospace Co., Ltd,Seoul, Korea). Assessment of muscle strength involved measuring grip strength using a dynamometer (GRIP-D; Takei Ltd, Niigata, Japan) while standing, with the arm fully extended straight down by the side. The participant received instructions to exert maximal effort by squeezing the handle of the dynamometer for a duration of 3–5 seconds, accompanied by standard encouragement to ensure maximal performance. Following this, the measurement was repeated after a 30-second interval to allow for recovery. The usual walking speed, measured in meters per second (m/s), was utilized as an objective indicator of physical performance, conducted along a 4-meter course. The methodology for this measurement has been previously elucidated in our prior study (21).
Each plasma sample was procured from the study participants under fasting conditions in the morning. Subsequently, the samples were separated and preserved in freezers at a temperature of -80°C until the commencement of the metabonomics assay. Thawing of the samples was conducted at room temperature prior to analysis. Initially, 150 μl of plasma was aliquoted into a new Eppendorf tube, followed by the addition of 10 μl of L-2-chlorophenylalanine (0.3 mg/ml) dissolved in methanol as the internal standard. Subsequently, a 450-μl mixture of methanol/acetonitrile (2/1) was added and vortexed for 1 minute. The entire samples underwent extraction by ultrasonication for 10 minutes and were then stored at -20°C for 30 minutes. The resulting extract was centrifuged for 10 minutes at 4°C (13,000 rpm). A volume of 200 μl of supernatant was then subjected to drying in a freeze concentration centrifugal dryer, followed by resolubilization with 300 μl of methanol/water (1/4) and vortexing for 30 seconds. Subsequent extraction by ultrasonication for 3 minutes was performed. After thorough mixing, the samples were centrifuged at 4°C (13,000 rpm) for 10 minutes, and 150 μl of supernatant was filtered through 0.22-μm microfilters before being transferred to LC vials. The vials were stored at -80°C prior to analysis by LC-MS.
Plasma metabolomic profiling analysis was conducted in accordance with previously established methodologies (22). In brief, LC-MS analysis was executed utilizing an ACQUITY ultra-performance liquid chromatography (UPLC) I-Class coupled with a VION IMS QT high-resolution mass spectrometer (Waters Corporation, Milford, USA). Metabolic profiles were obtained through electrospray ionization (ESI) in both positive and negative ion modes. Sample separation was conducted using an ACQUITY UPLC BEH C18 column (Waters Corporation; particle size: 1.7 μm, dimensions: 100 × 2.1 mm) at a flow rate of 0.4 ml/min. The column temperature was held constant at 45°C, while the sample chamber temperature was maintained at 4°C, and a 1 μl injection volume was employed. The mobile phases consisted of two solutions: solution A comprised water with 0.1% formic acid, while solution B consisted of a mixture of acetonitrile and methanol in a ratio of 2:3 (vol/vol) with 0.1% formic acid. The gradient elution program was as follows: from 0 to 1 minute, the composition was 30% solution B; from 1 to 2.5 minutes, the composition increased from 30% to 60% solution B; from 2.5 to 6.5 minutes, it increased from 60% to 90% solution B; from 6.5 to 8.5 minutes, it increased from 90% to 100% solution B; at 8.5 to 10.7 minutes, the composition remained at 100% solution B; from 10.7 to 10.8 minutes, it decreased from 100% to 1% solution B; and finally, from 10.8 to 13 minutes, the composition was maintained at 1% solution B. The LC-MS system was operated under optimized conditions, including an ion source temperature of 150°C, capillary voltage set to 2.5 kV, desolvation gas flow maintained at 900 L/h, declustering potential set at 40V, collision energy at 4 eV, a mass scan range from m/z 50 to 1,000, and a scan time of 0.2 s (22).
The LC-MS data underwent processing using Progenesis QI version 2.3 software (Nonlinear Dynamics, Newcastle, UK) to facilitate meaningful data analysis, encompassing peak alignment, selection, normalization, and retention time (RT) correction. The resultant feature matrix comprised information on mass-to-charge ratio (m/z), RT, and peak intensities. Compound identification relied on precise m/z values, secondary fragments, and isotopic distribution, with reference to databases such as the Human Metabolome Database (HMDB) (http://www.hmdb.ca/), LIPID MAPS (version 2.3) (http://www.lipidmaps.org/), Metabolite Mass Spectral Database (METLIN) (http://metlin.scripps.edu/), and internally curated databases (EMDB) for qualitative analysis.
In order to delineate differences in metabolic profiles between the control group and individuals with newly diagnosed sarcopenia, orthogonal projection to latent structure with discriminant analysis (OPLS-DA) was utilized as a statistical approach. Simultaneously, the OPLS-DA model underwent validation using a 200-fold permutation test. This permutation test was evaluated through cross-validation, during which the correlation coefficients R2 and Q2 derived from the cross-validation procedure were examined to determine the likelihood of overfitting (23).
Variations in expression between groups were evaluated employing both multidimensional and single-dimensional analyses. The variable importance in projection (VIP) scores derived from OPLS-DA were employed to identify metabolites demonstrating significant biological disparities. Additionally, the statistical significance of these differentially expressed metabolites was confirmed through Student’s t-test. Metabolites with VIP scores exceeding 1.0 and P-values below 0.05 were considered potential biomarkers indicative of sarcopenia. The predictive accuracy of the model was assessed via the computation of the area under the receiver operating characteristic (ROC) curve (AUC). Furthermore, to elucidate the underlying mechanisms driving metabolic pathway alterations across distinct sample groups, the differentially expressed metabolites underwent metabolic pathway enrichment analysis utilizing the Kyoto Encyclopedia of Genes and Genomes (KEGG) database (http://www.kegg.jp/kegg/pathway.html).
The baseline sociodemographic characteristics of both the control and newly diagnosed sarcopenia cohorts were juxtaposed employing an independent t-test for numerical variables and the chi-squared test for categorical variables. Data exhibiting a normal distribution were depicted as the mean along with the standard deviation (SD), whereas categorical variables were delineated as proportions. Statistical assessments were conducted using SPSS version 26.0 (SPSS Incorporation, Chicago, IL, USA), with significance threshold established at p < 0.05.
During this study, 30 new-onset sarcopenia subjects and 30 non-sarcopenia subjects (control group) were eventually incorporated into our study. The primary characteristics of the population are delineated based on the cases and controls in Table 1. There were no statistically significant discrepancies noted in age, gender distribution, BMI, or other pertinent indicators across the groups, implying that individuals within each group were similar in baseline characteristics.
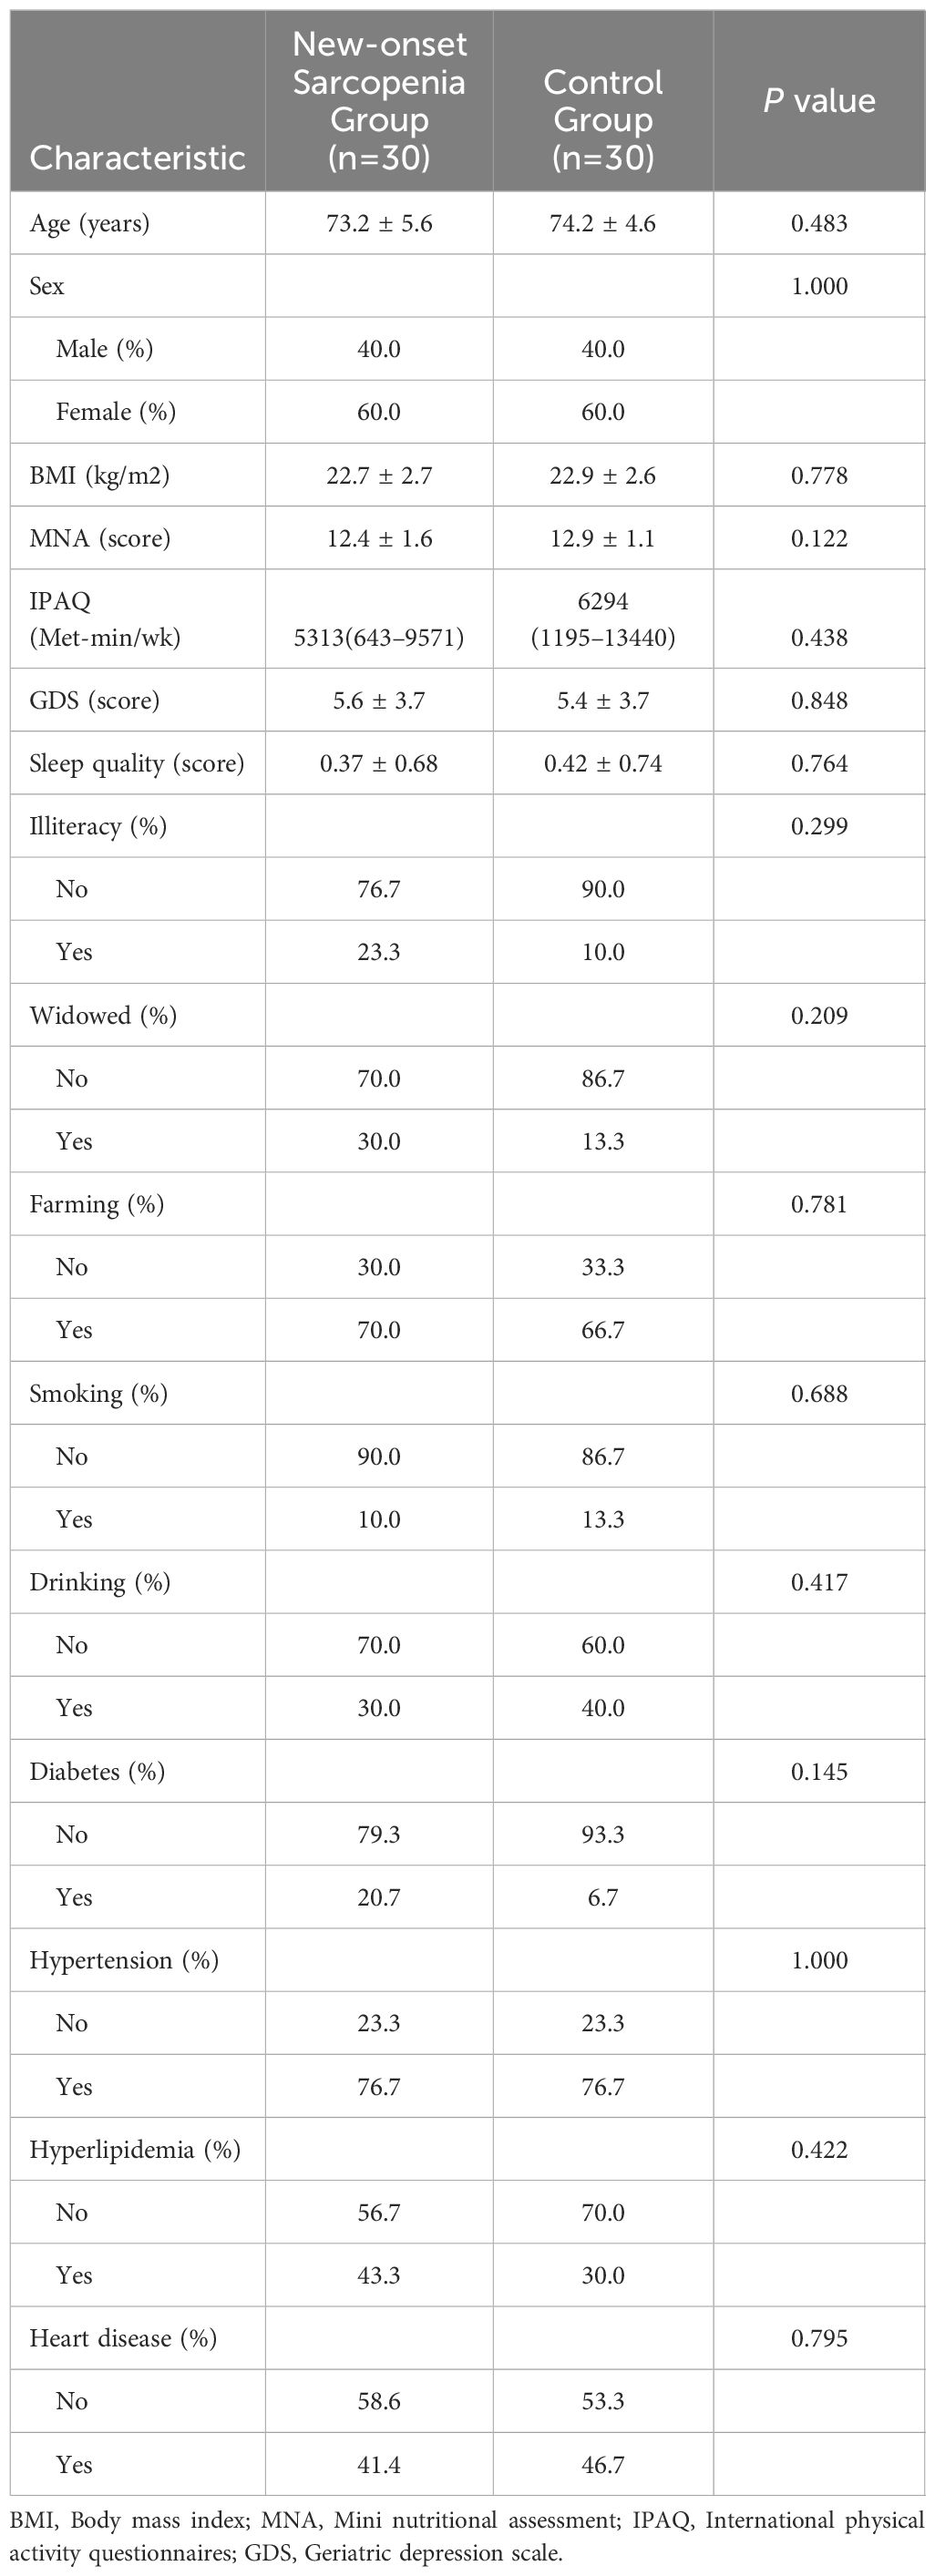
Table 1 Baseline characteristics of the matched groups.
To analyze the metabolic changes between the new-onset sarcopenia and matched control groups, nontargeted metabonomics analysis was performed using LC−MS. OPLS-DA serves as a suitable model for discerning distinct origins in scenarios where multiple factors may influence metabolite profiles. Consequently, we established an OPLS-DA model utilizing the metabolic spectrum, revealing an evident tendency for segregation, as illustrated in Figure 1. Furthermore, additional permutation tests illustrated that the model was not overfitted, with R2= (0.0, 0.51) and Q2= (0.0, -0.42) (Figure 2). Taken together, these findings suggest a significant metabolic alteration between the new-onset sarcopenia group and the matched control group.
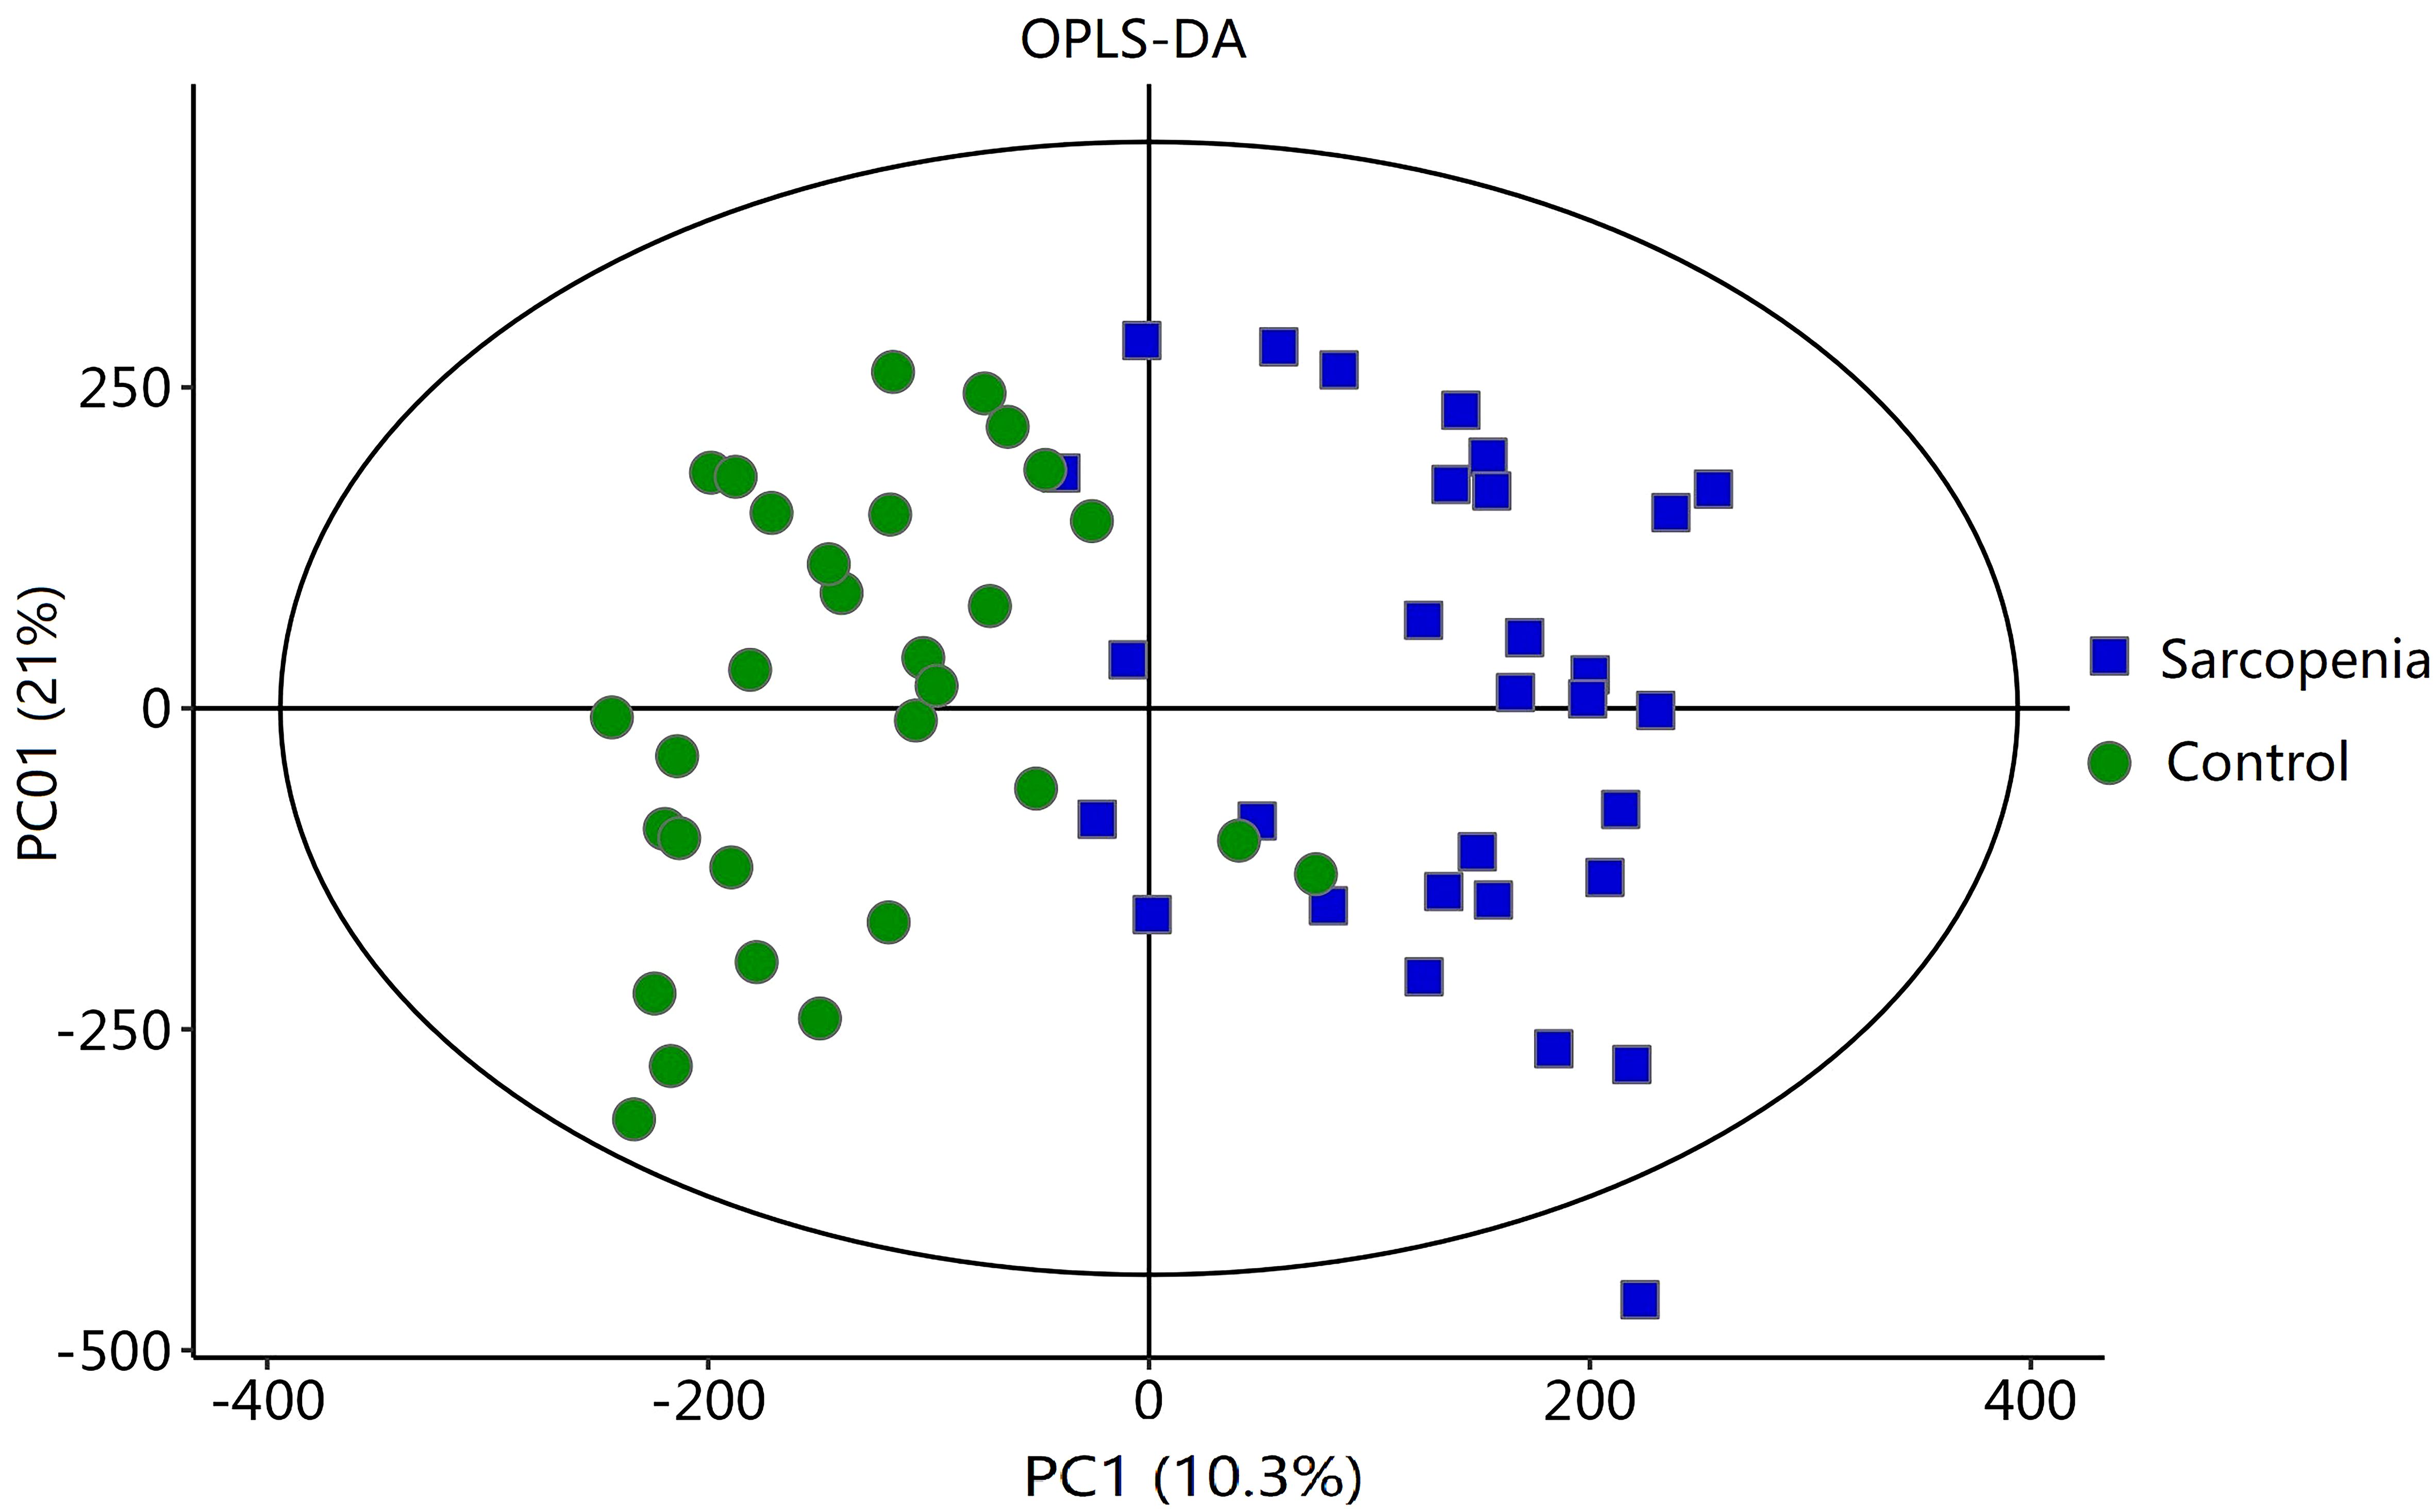
Figure 1 OPLS-DA score plot comparing the new-onset sarcopenia group with the matched control group.
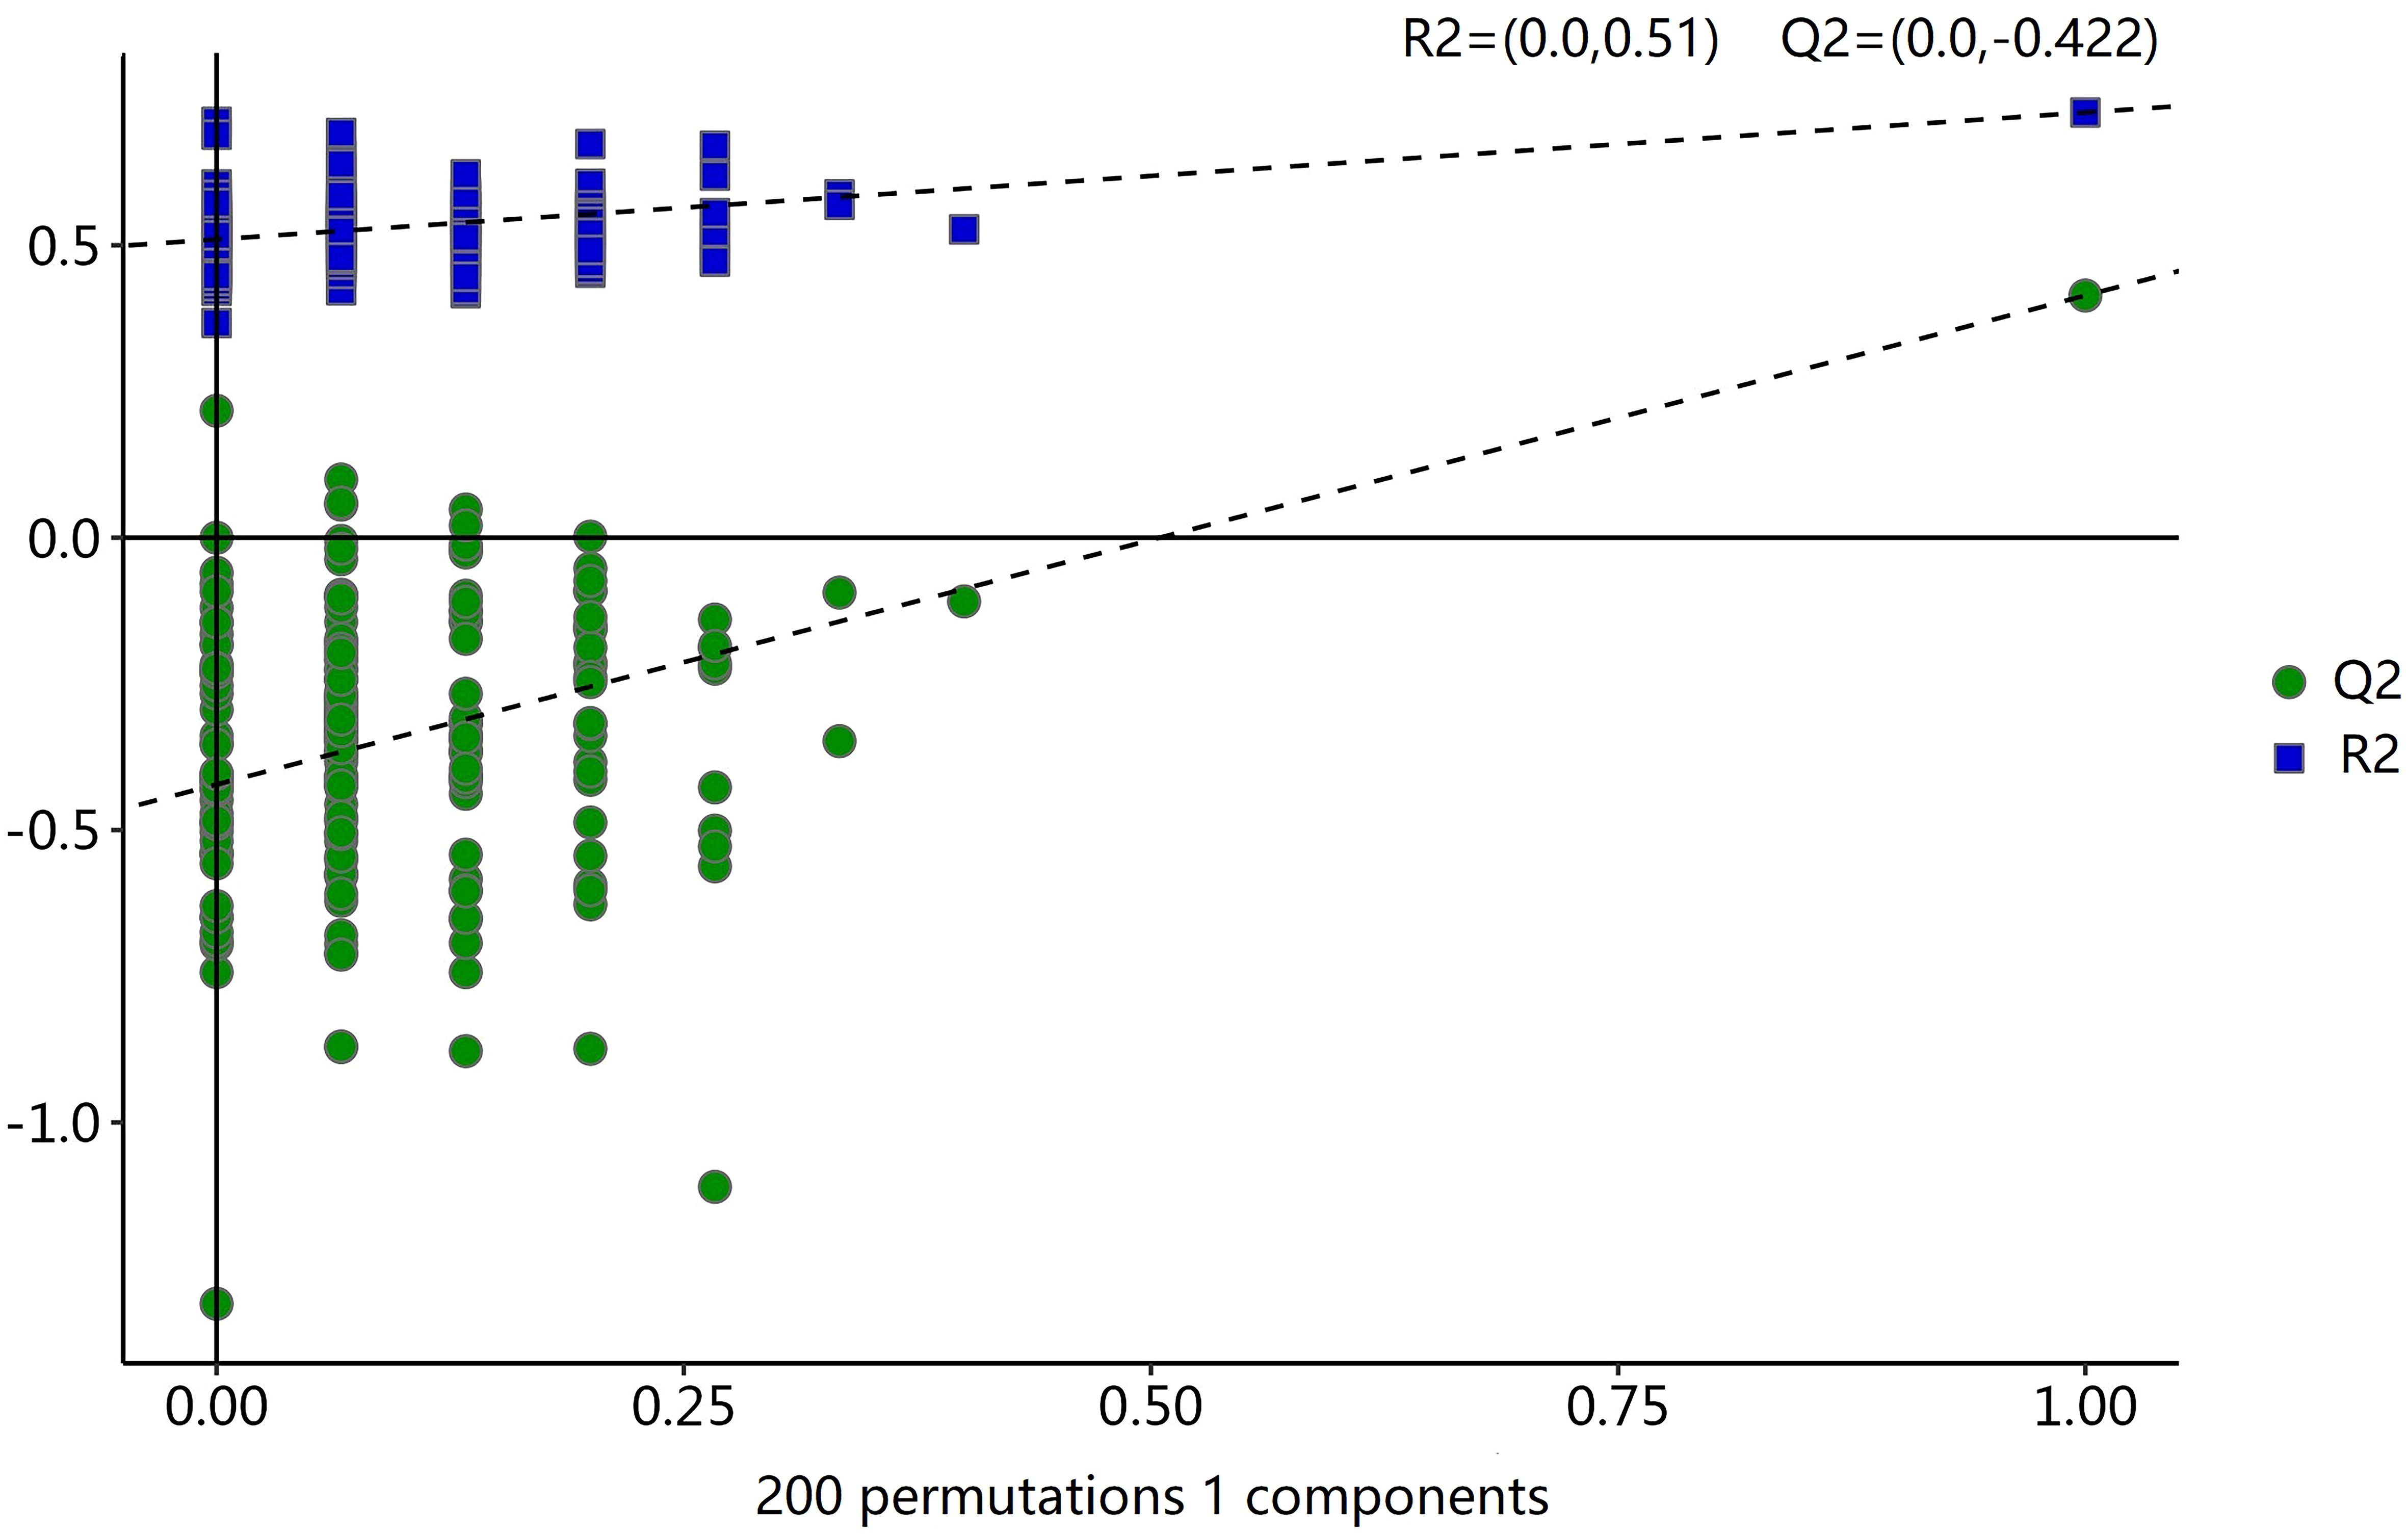
Figure 2 Statistical validation of the OPLS-DA model by permutation testing with 200 iterations.
As shown in Table 2, a total of 62 differentially expressed metabolites, including 34 downregulated and 28 upregulated differentially expressed metabolites, contributed significantly to the distinction between the control group and the new-onset sarcopenia group. The volcano plot displays both the p-value and fold change value (Figure 3), thereby substantiating the efficacy of differential metabolites. The majority of these distinct metabolites were identified as lipids and lipid-like molecules, along with organic acids and derivatives, which accounted for 45.2% and 24.2%, respectively (Figure 4). Hierarchical clustering was performed using the expression profiles of all metabolites demonstrating significant disparities (Figure 5). In this visualization, colors indicate elevated (red) or diminished (blue) levels of abundance, with intensity correlating to the respective concentration. These findings provide a more direct depiction of the associations among samples and the variations in metabolite expression across different samples.
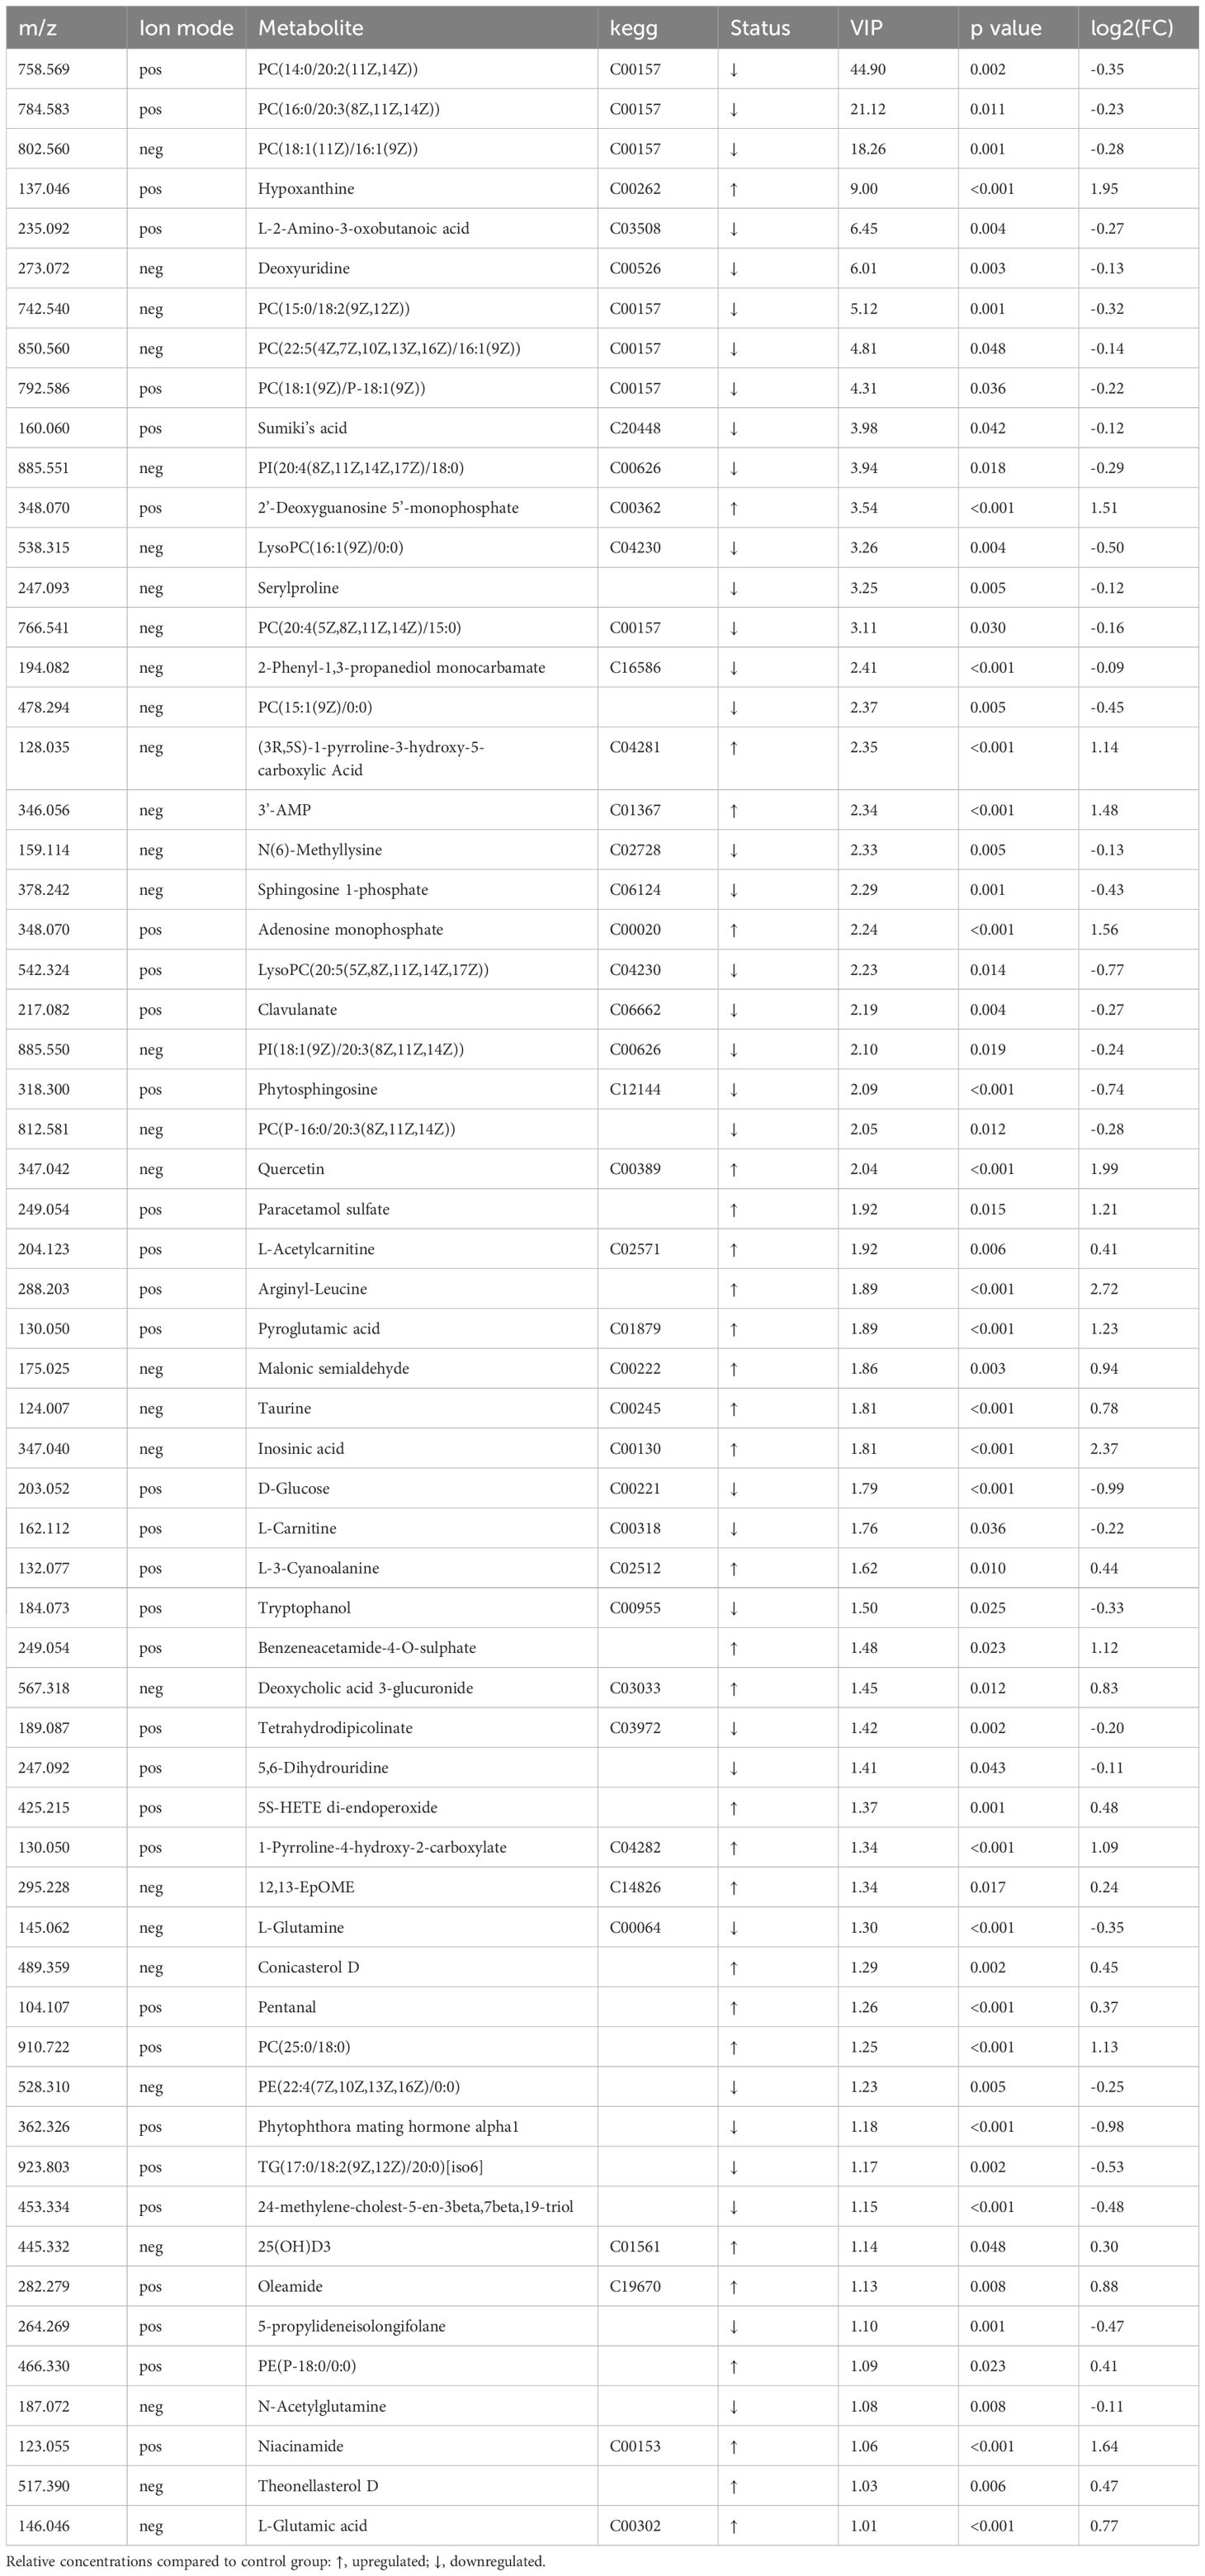
Table 2 The 62 differential metabolites associated with risk of sarcopenia.
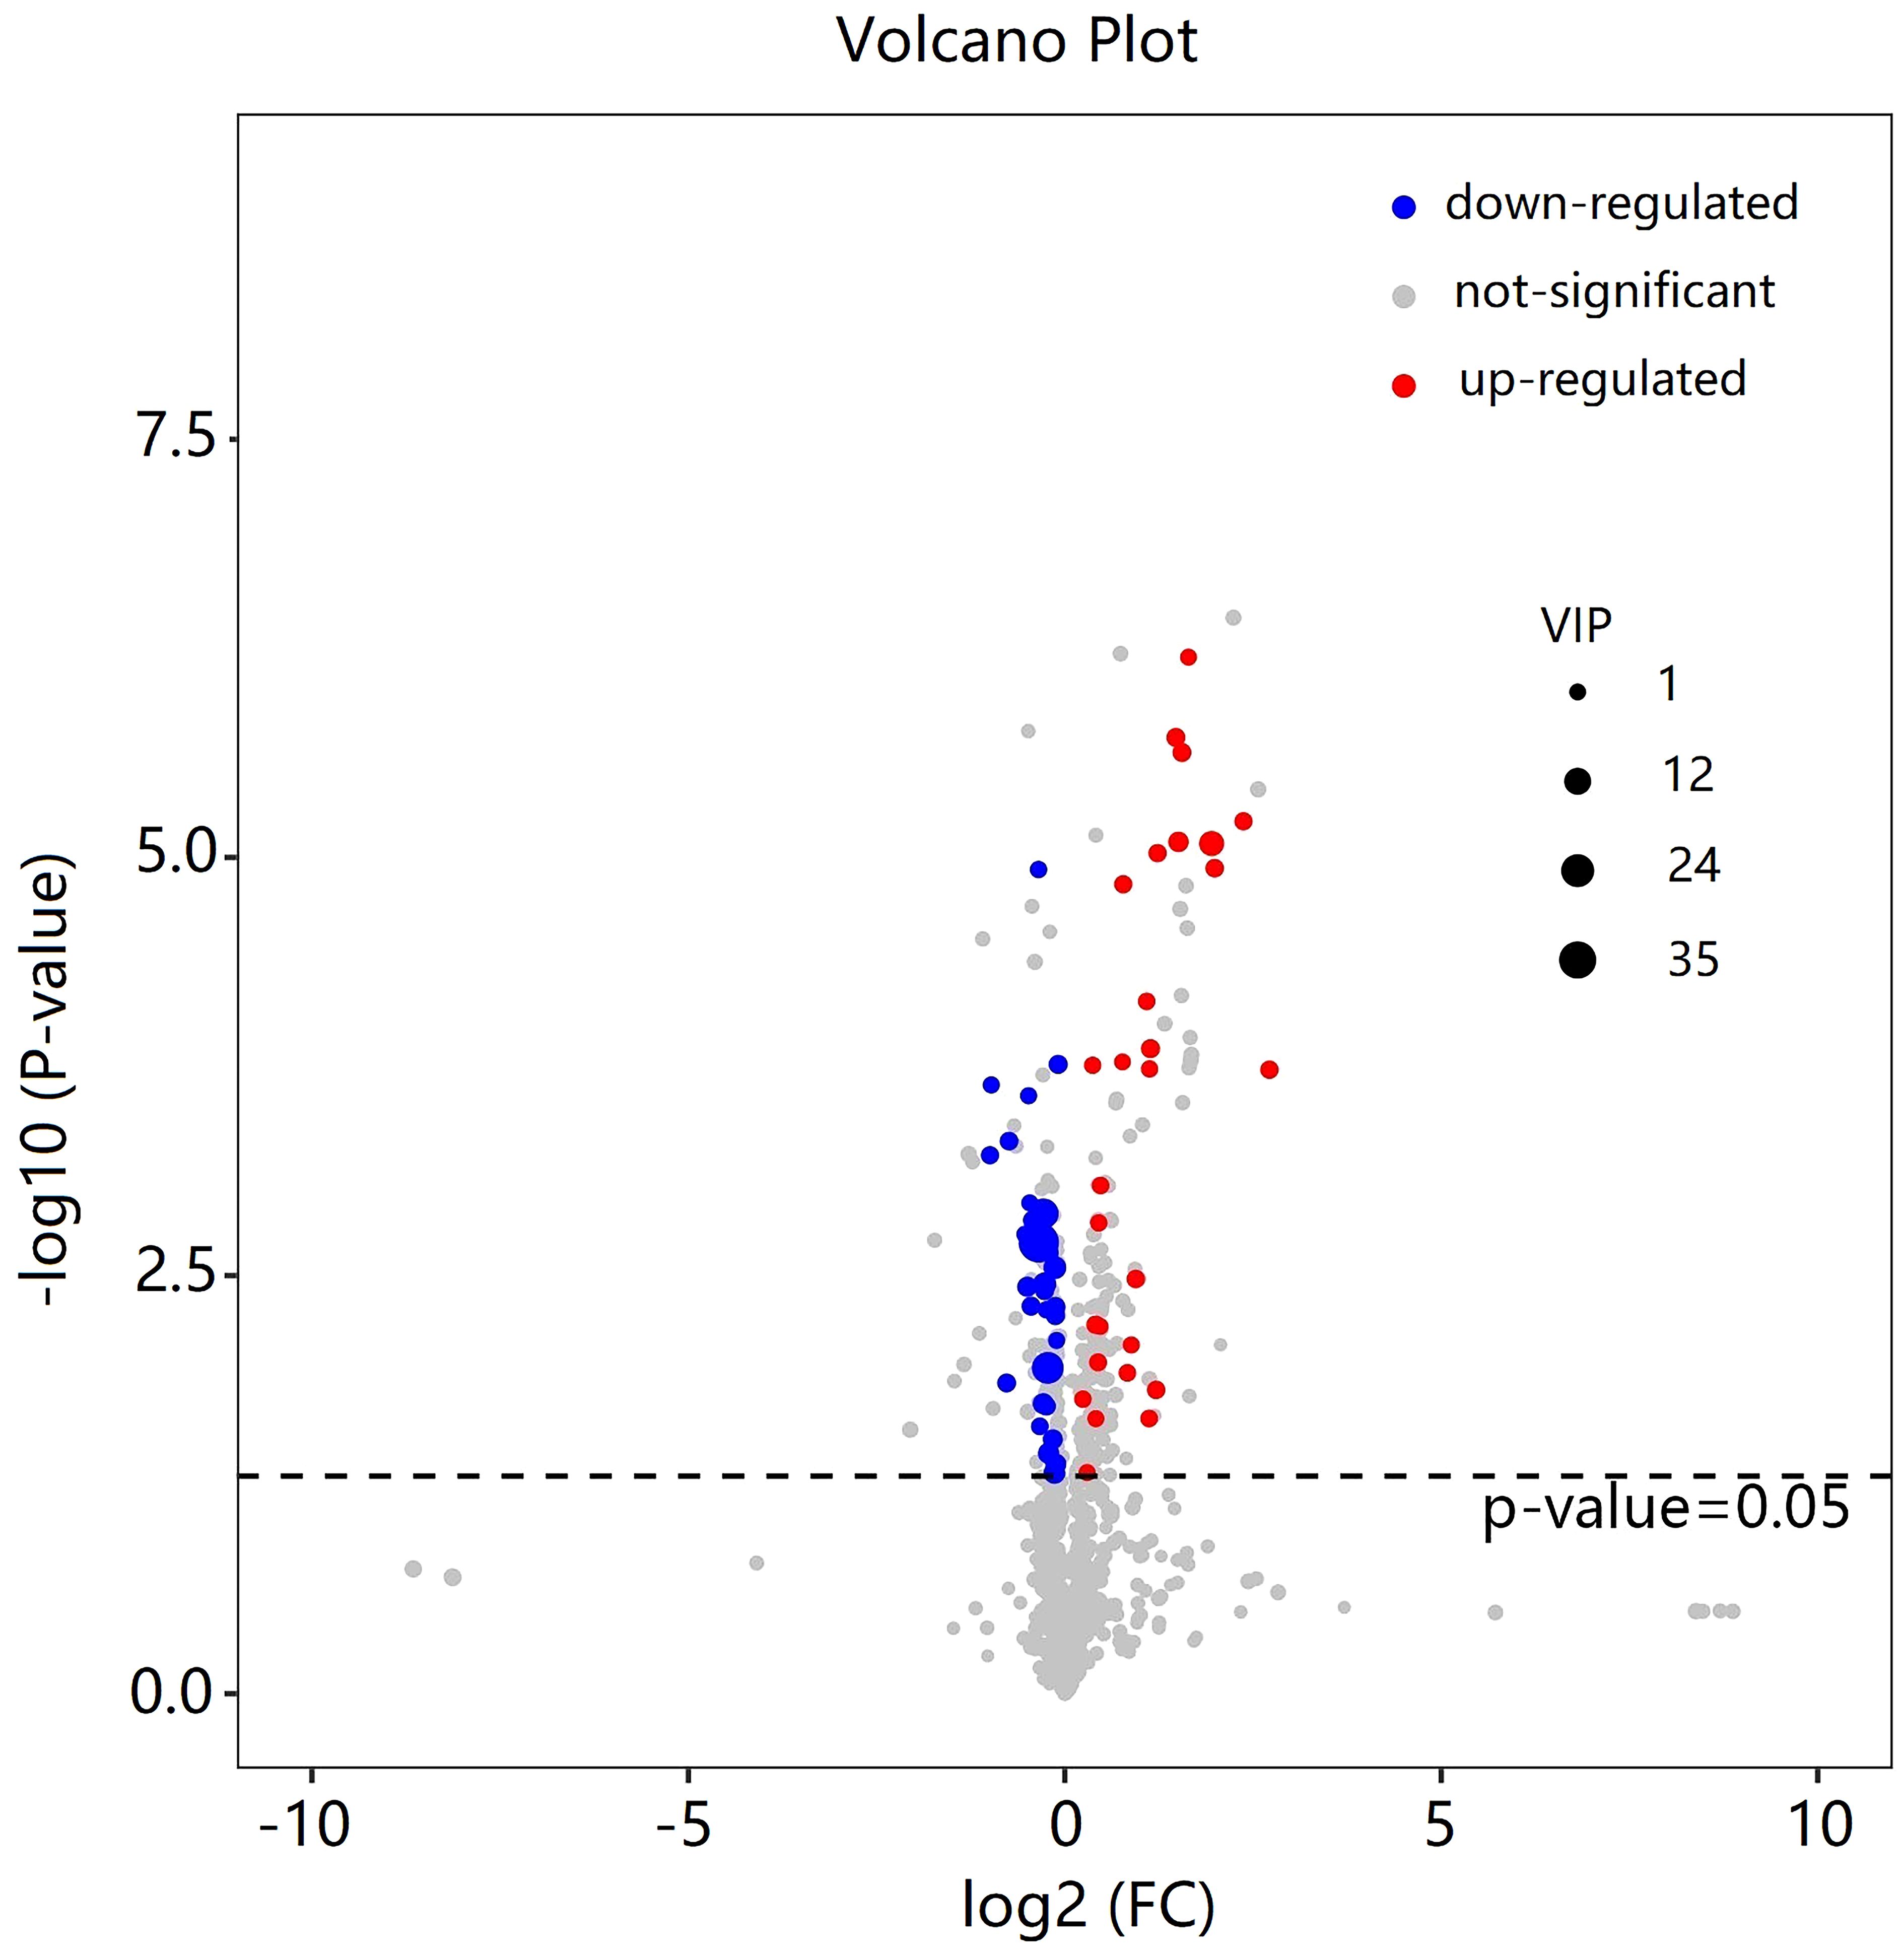
Figure 3 Volcano plot of the differential metabolites filtered by the univariate analysis between the new-onset sarcopenia and matched control groups.
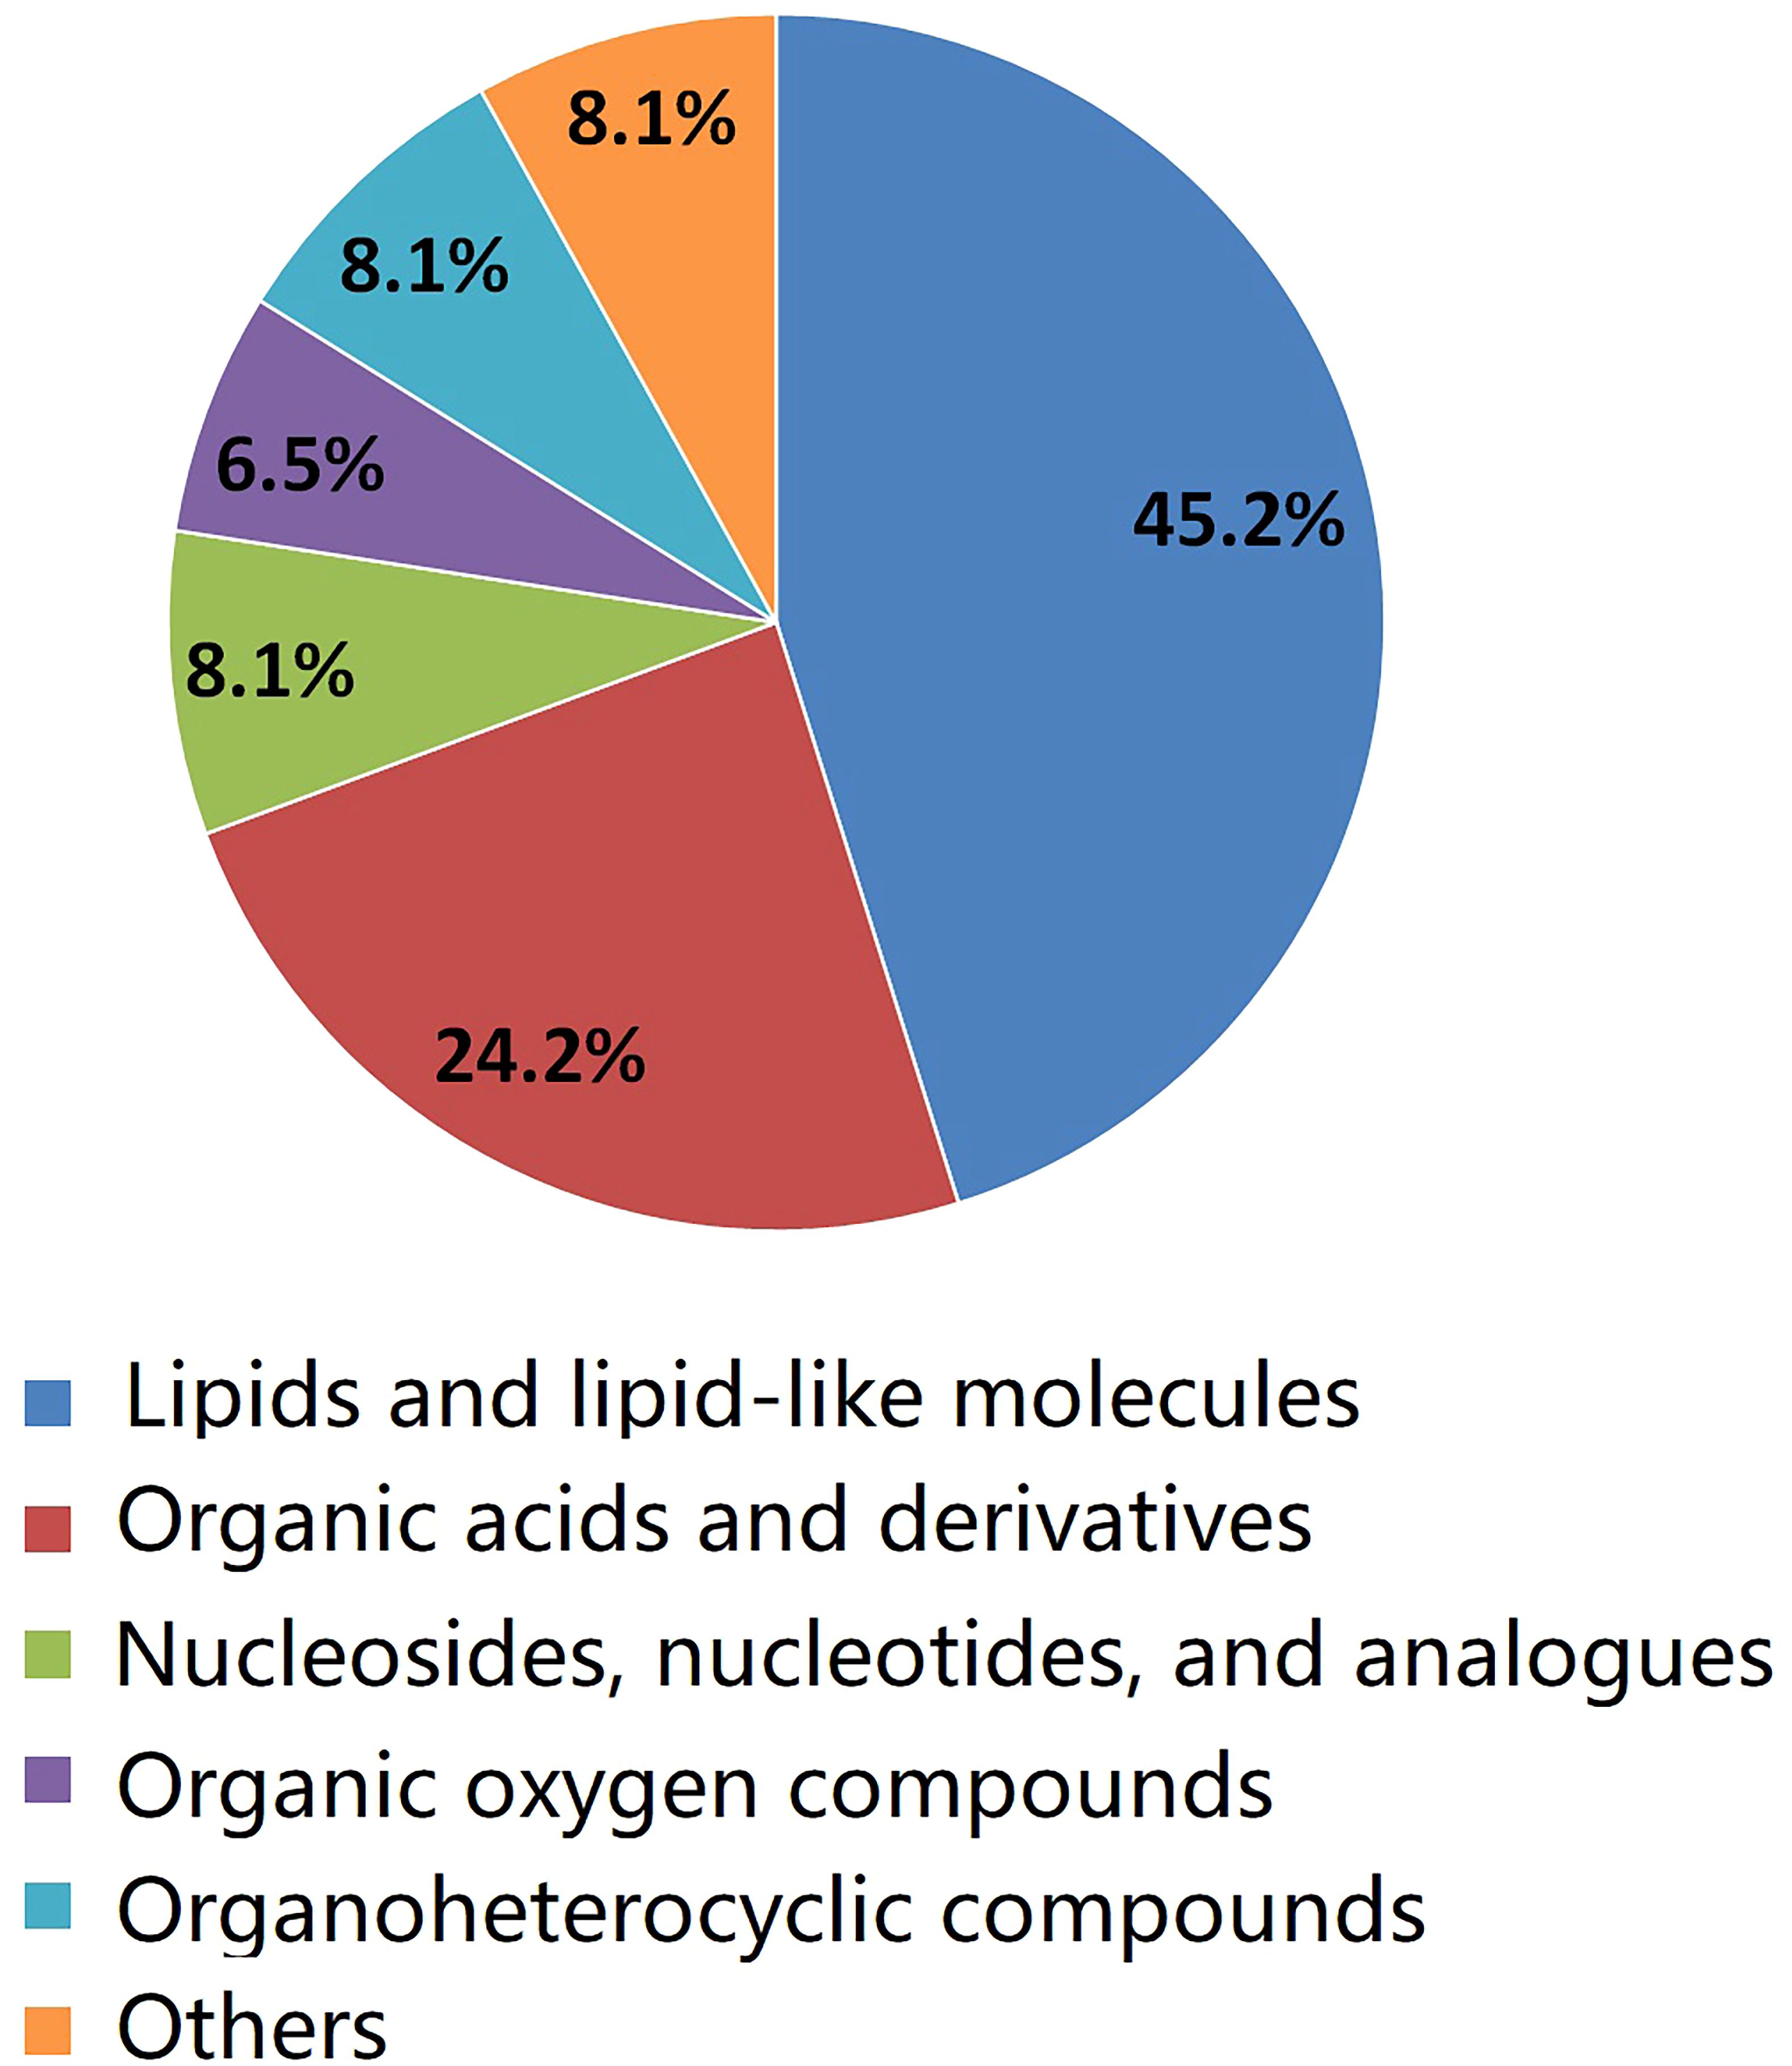
Figure 4 The pie chart illustrates the classification and quantity of significantly disturbed metabolites.
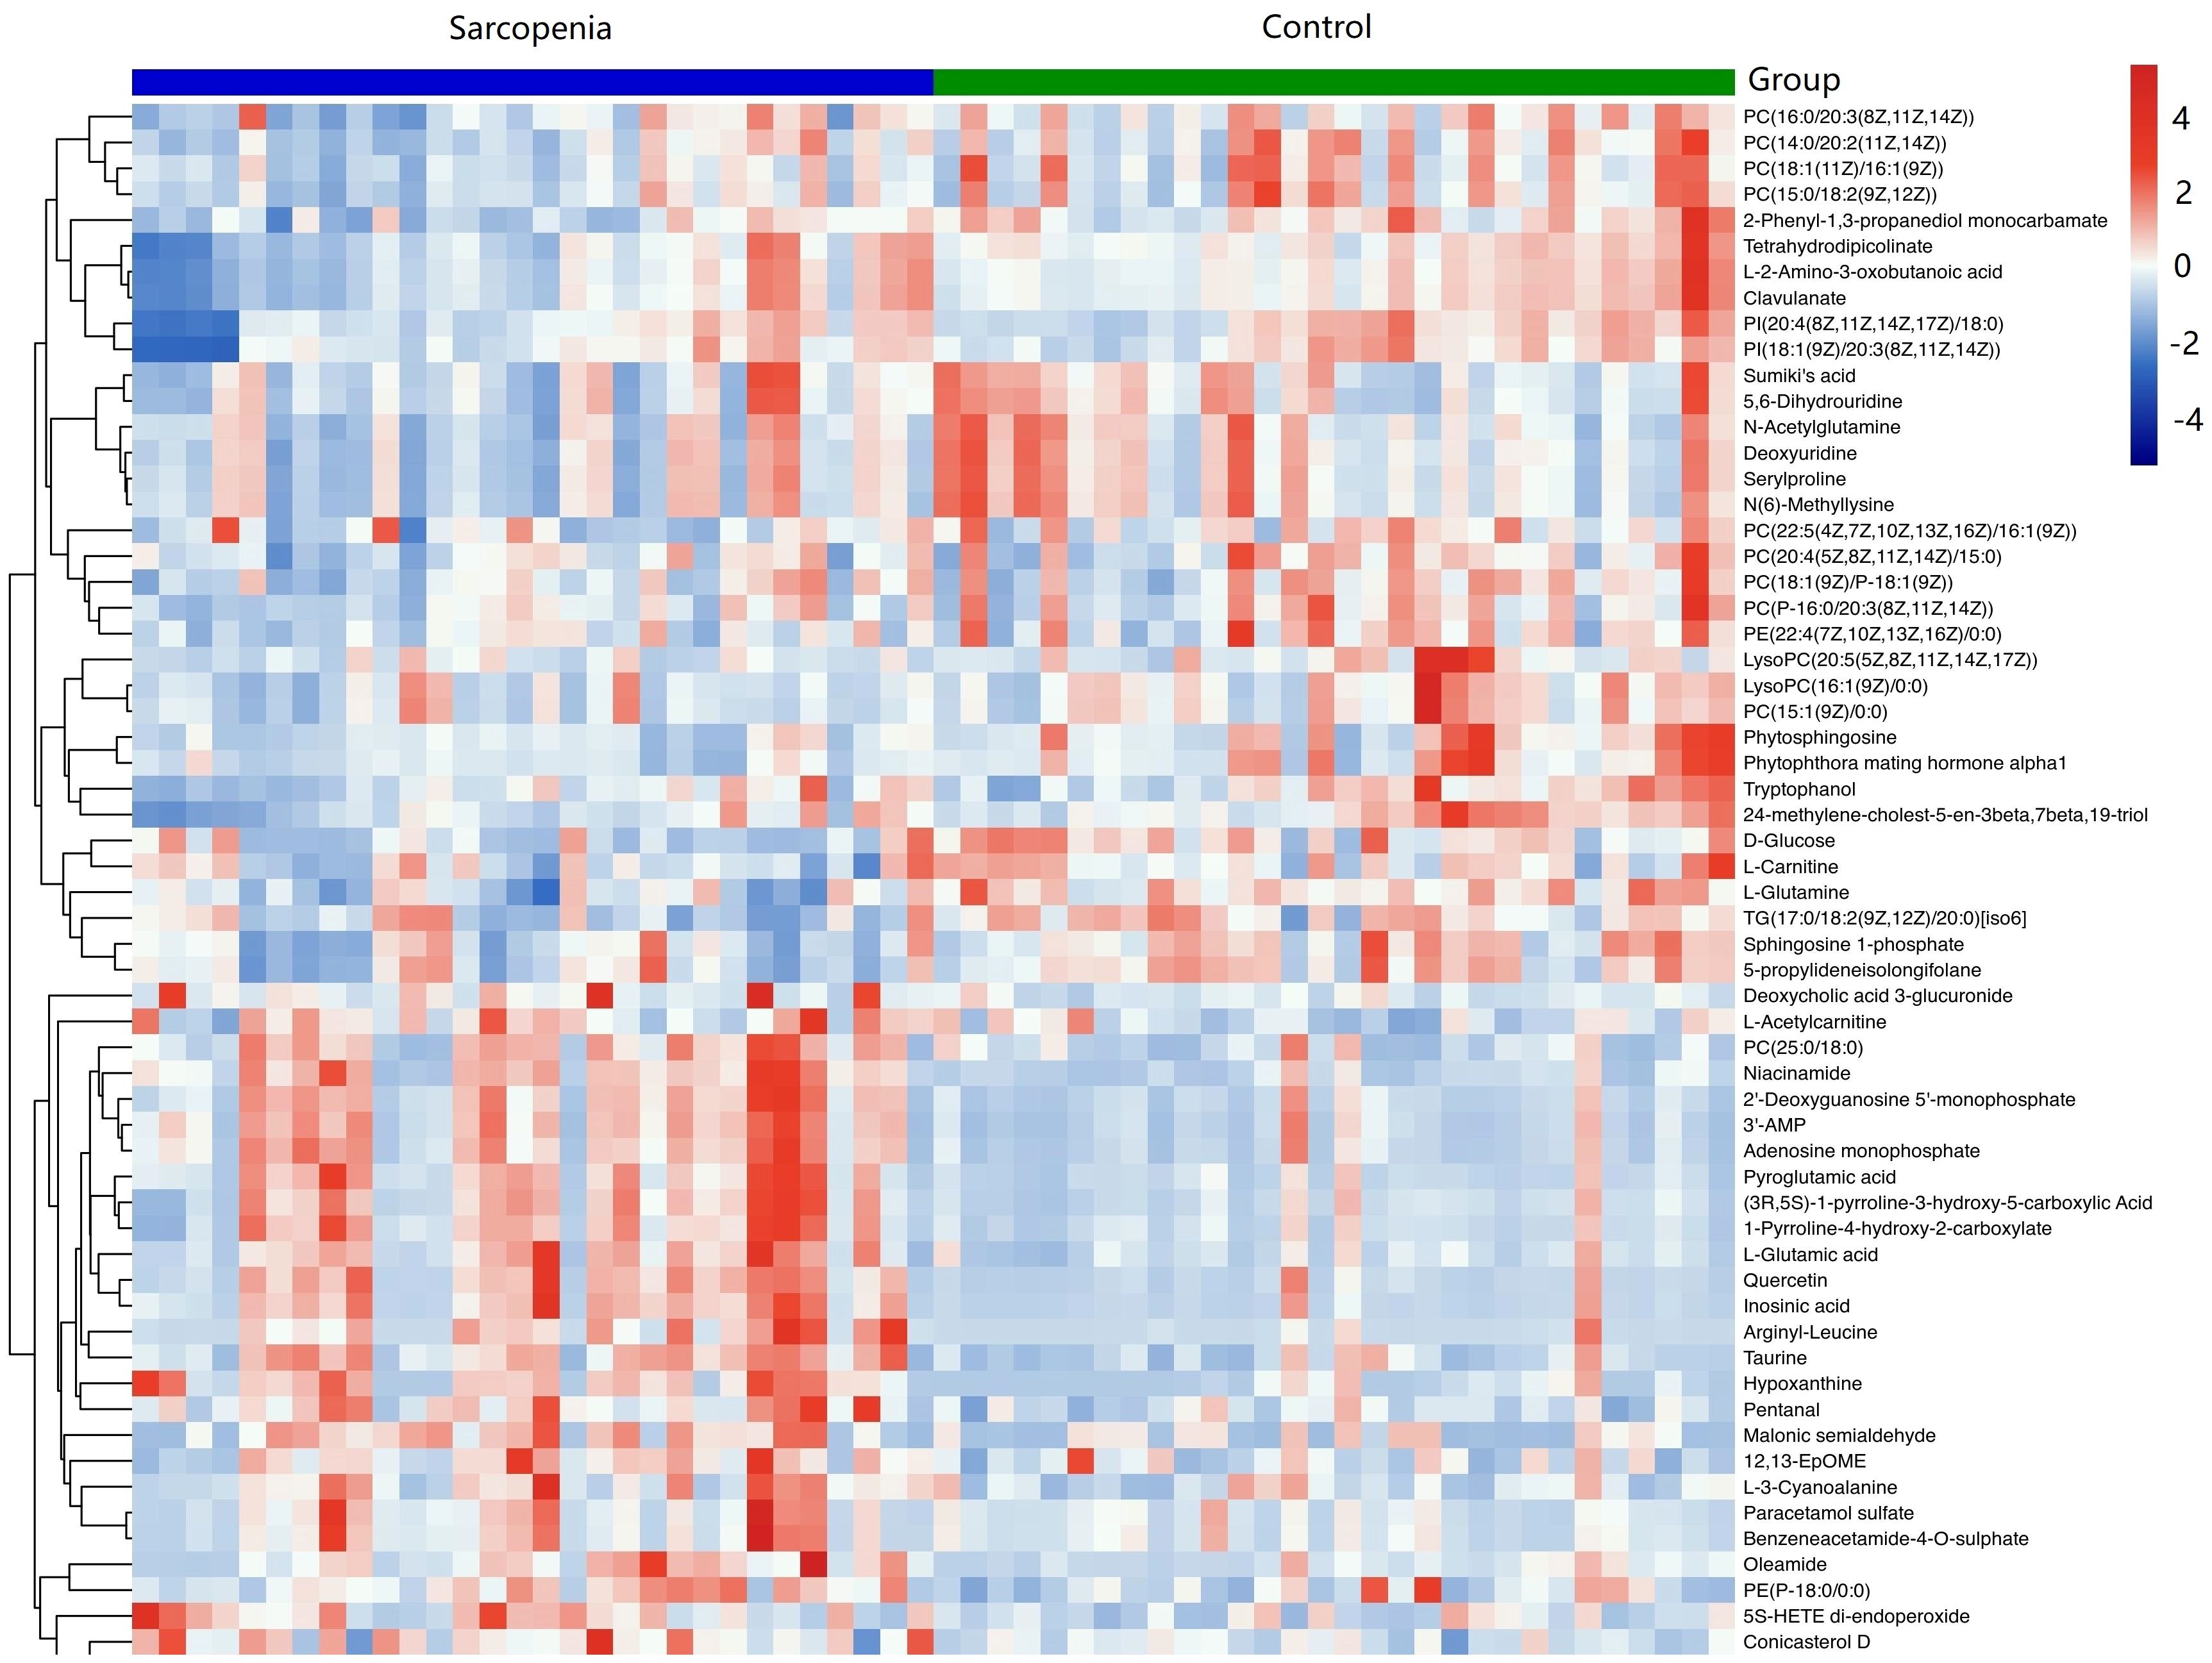
Figure 5 Hierarchical clustering revealed the profiles of important differential metabolites in samples from the new-onset sarcopenia and matched control groups. Blue indicates decreased levels, while red indicates increased levels.
Univariate ROC curve analysis was conducted for the top 10 potential biomarkers. Among these, five metabolites exhibited areas under the ROC curve (AUCs) of at least 0.7 (Table 3). Notably, the three most discriminative metabolites with the highest accuracy were identified as hypoxanthine (AUC=0.819, 95% CI=0.711–0.927), L-2-amino-3-oxobutanoic acid (AUC=0.733, 95% CI=0.598–0.868), and PC(14:0/20:2(11Z,14Z)) (AUC= 0.717, 95% CI=0.587–0.846). We conducted a further analysis of the correlation between these three metabolites and the components of sarcopenia (muscle mass, grip strength, and walking speed). The results indicated that hypoxanthine is negatively correlated with walking speed, whereas L-2-amino-3-oxobutanoic acid and PC (14:0/20:2(11Z,14Z)) are positively correlated with both grip strength and walking speed.
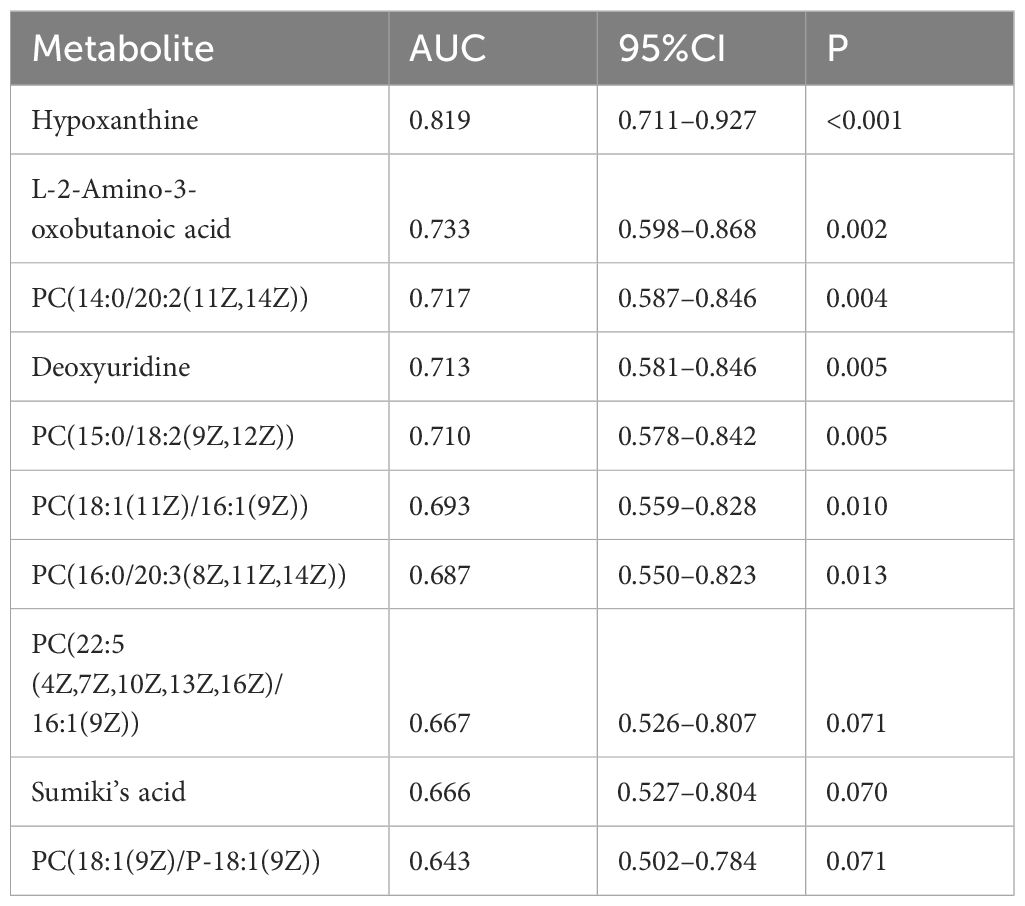
Table 3 The AUC values for metabolites.
We examined the metabolic pathways potentially implicated in the observed changes in metabolic profiles associated with new-onset sarcopenia. Through pathway enrichment analysis, we demonstrated that “purine metabolism”, “parathyroid hormone synthesis, secretion and action”, “choline metabolism in cancer”, and “tuberculosis” emerged as the most significantly perturbed pathways in new-onset sarcopenia (Figure 6).
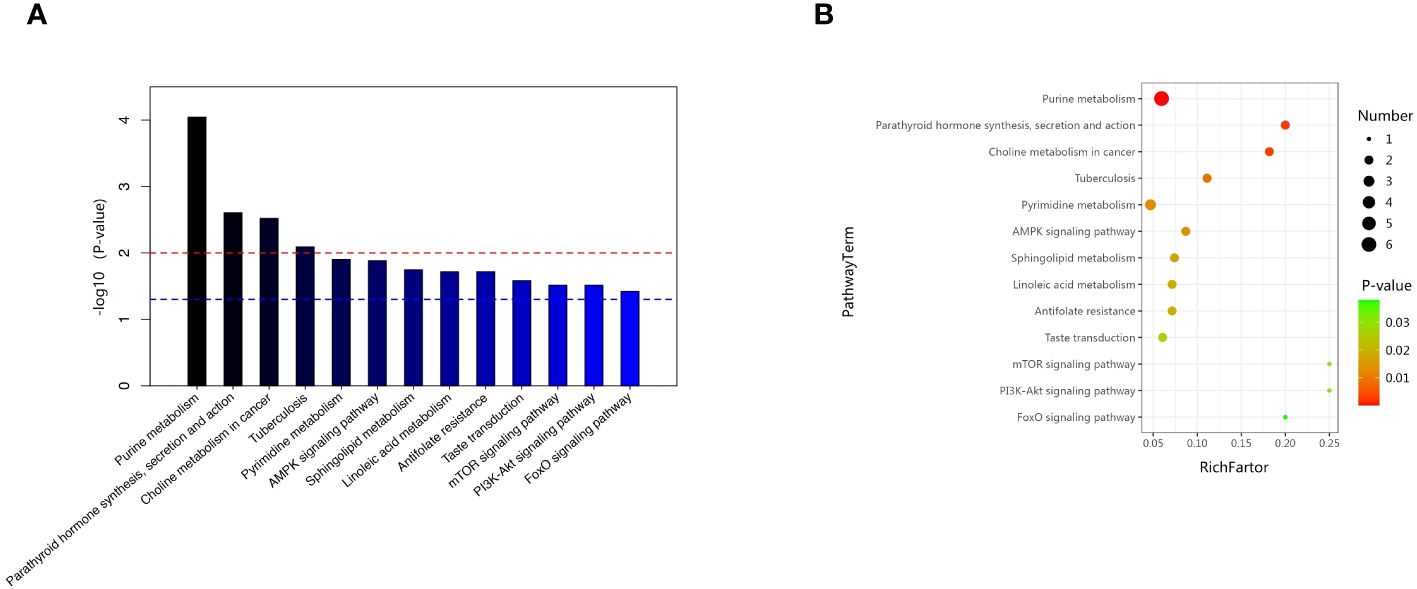
Figure 6 (A) Pathway analysis indicates that sphingolipid metabolism is the most statistically enriched pathway. (B) Metabolic pathway analysis based on plasma metabolites.
In this prospective study, we systematically present the results of our longitudinal investigation into the associations between plasma metabolites and the onset of sarcopenia utilizing LC-MS-based untargeted metabonomics. This investigation includes a nested case–control study that specifically targets new-onset sarcopenia within a cohort study. We identified 62 metabolites that were correlated with an increased risk of developing new-onset sarcopenia. Among these, lipids and lipid-like molecules, as well as organic acids and derivatives, emerged as the predominant altered metabolites in individuals with new-onset sarcopenia compared to the control group. Currently, the few existing studies on non-targeted metabolomics of sarcopenia have yielded inconsistent results (8, 9, 15–18). The reason for the discrepancy is likely due to differences in lifestyle, such as exercise, sleep, diet, and psychological factors, as well as variations in populations and ethnicity. The top three metabolites demonstrating the highest discriminatory power between the groups were hypoxanthine, L-2-amino-3-oxobutanoic acid, and PC(14:0/20:2(11Z,14Z)). In summary, our study delineates a panel of 62 metabolic signatures, which can be broadly classified into four pathways: (1) purine metabolism; (2) parathyroid hormone synthesis, secretion and action; (3) choline metabolism in cancer; and (4) tuberculosis.
In this study, it was discovered that hypoxanthine levels were significantly elevated in the new-onset sarcopenia group compared to the control group, rendering it the most discriminative metabolite. Similarly, the studies by Shida T et al. (24) and Zhou J et al. (12) also observed higher hypoxanthine levels in the sarcopenia group compared to the non-sarcopenia group. Animal models of diabetes corroborate this hypothesis, as metabonomics analysis of atrophied quadriceps femoris muscles demonstrated significantly higher levels of hypoxanthine (25). In addition, previous investigations have reported that increases in circulating AdN degradation products are distinctive features of human sarcopenia (26–28), and hypoxanthine was one of the important AdN degradation products. Given that hypoxanthine originates from inosine metabolized by purine nucleoside phosphorylase activity (29), the observed elevations in the levels of inosine, xanthine, and hypoxanthine collectively indicate signs of oxidative stress within the muscle tissues of mice. Oxidative stress is recognized to play a pivotal role in the pathogenesis of sarcopenia (30).
L-2-amino-3-oxobutanoic acid emerged as the second metabolite with the highest discriminatory power between the groups. To our knowledge, there have been no previous reports of direct observations of L-2-amino-3-oxobutanoic acid in the context of sarcopenia. Previous research has indicated that L-2-amino-3-oxobutanoic acid is a downstream metabolite of glycine metabolism (31), and glycine has been shown in rodent models to reduce plasma insulin levels and decrease fat mass (32). Thus, we hypothesize that L-2-amino-3-oxobutanoic acid may be involved in the pathogenesis of sarcopenia through the modulation of glycine metabolism, potentially affecting insulin sensitivity, antioxidative, and anti-inflammatory capacities. However, we also note that only a few studies have linked L-2-amino-3-oxobutanoic acid to other metabolic diseases such as diabetes (33) and liver injury (31). Therefore, further research is warranted to elucidate the exact role and mechanisms of L-2-amino-3-oxobutanoic acid in the pathogenesis of sarcopenia.
In addition to hypoxanthine and L-2-amino-3-oxobutanoic acid, PC(14:0/20:2(11Z,14Z)) was also among the top three metabolites capable of discriminating between groups with the highest accuracy. It was found that lipids and lipid-like molecules emerged as the predominant altered metabolites in individuals with new-onset sarcopenia compared to the control group. These findings are consistent with the study by Chi JL et al. (3) and Zhou J et al. (12). In our cohort study, we observed that the abundances of nine PC species [for example, PC(14:0/20:2(11Z,14Z)), PC (16:0/20:3(8Z,11Z,14Z)), and PC (18:1(11Z)/16:1(9Z))] were markedly reduced in subjects with sarcopenia compared to those in the control group. Nonetheless, a prior investigation exploring the association between resting phosphorus metabolites and skeletal muscle mass noted that older adults with sarcopenia exhibited heightened levels of PCs (34). The variability in PCs levels may be attributed to the presence of unsaturated double bonds. Wang et al. suggested that a decline in the levels of PCs with greater unsaturated double bonds could be closely associated with an elevated risk of sarcopenia in elderly populations (35). Diminished levels of PCs may potentially contribute to the buildup of enlarged mitochondria, which could become impaired and resistant to standard degradation processes via the autophagosomal/lysosomal pathway. This could result in heightened production of reactive oxygen species, thereby potentially exacerbating the aging process. However, additional evidence is necessary to substantiate this novel speculation.
In a previous study, it was suggested that metabolites showed remarkable enrichment of purine metabolism for KEGG pathway analysis (12), which supports our findings. Purine metabolism is integral to numerous physiological and pathological processes in mammals, encompassing the inflammatory response, oxidative stress reactions, and cancer (36, 37). The significance of inflammation and oxidative stress as pivotal factors in the pathogenesis of sarcopenia is widely acknowledged (38). KEGG pathway enrichment analysis indicated that hypoxanthine participated in this metabolic pathway. No study has investigated the role of parathyroid hormone synthesis in sarcopenia until now. Parathyroid hormone is a key regulator of calcium and phosphorus homeostasis. KEGG pathway enrichment indicated that 25(OH)D3 participates in this metabolic pathway. In our study, we observed higher plasma 25(OH)D3 levels in subjects with sarcopenia compared to healthy controls. This finding contradicts the findings of most studies, which have reported low 25(OH)D3 levels attributed to chronic inflammation or bacterial etiology (39). However, Zielińska et al. also found that 25(OH)D3 levels are elevated in inflammatory bowel diseases (40). Moreover, in an experimental model using C57BL/6 mice with induced muscle injury, the administration of excessive doses of 1α,25(OH)D3 or its intramuscular delivery did not show beneficial effects on muscle regeneration.it was observed to potentially have detrimental effects on satellite cell activity, ultimately compromising muscle fiber formation (41). In addition, the differentially expressed metabolite 25(OH)D3 also participates in the pathway of tuberculosis. The pathogenesis of sarcopenia in tuberculosis remains unknown. A thorough comprehension of the parathyroid hormone pathway’s involvement in tuberculosis can enhance our understanding of sarcopenia’s pathogenesis. In cancer, elevated levels of phosphocholine and total choline-containing compounds characterize the choline metabolite profile. Additionally, several studies have identified connections between choline metabolism in muscle tissue and both muscle protein synthesis and degradation. Therefore, further investigation into these metabolic pathways can advance our understanding of the pathological mechanisms underlying sarcopenia, thereby facilitating the development of more effective treatments.
This study represents one of the initial attempts to explore the connections between plasma metabolic signatures and the susceptibility to sarcopenia in Asian populations using an untargeted metabonomics platform. The untargeted metabonomics approach facilitates the identification of a wide array of metabolites, which will enhance our comprehension of the comprehensive landscape of crucial metabolic pathway alterations in sarcopenia. However, it is important to acknowledge several limitations of our study. Firstly, our findings were derived from a single cohort with a restricted number of cases and controls. Due to the small sample size, the analysis was not adjusted for multiple comparisons. Future research endeavors should incorporate more targeted omics analyses in other thoroughly characterized cohorts or larger validation cohorts to corroborate these findings, while implementing multiple comparison correction techniques. Second, further investigations are warranted to elucidate the precise molecular mechanisms underlying the observed results. Specifically, the role of metabolites such as PCs in sarcopenia remains to be evaluated, and mechanistic studies are imperative to delineate the exact contribution of these metabolites to the pathogenesis of sarcopenia. Additionally, we did not observe significant associations between amino acid metabolism pathways and sarcopenia, possibly due to the relatively small sample size. Sarcopenia is a complex condition influenced by various genetic, lifestyle, and environmental factors. A relatively small sample size may limit the ability to capture the full spectrum of metabolic changes associated with sarcopenia. Finally, the short follow-up time was also a major limitation of this study. Consequently, we plan to extend the follow-up duration in future research to enhance the power to evaluate the risk factors.
In conclusion, we examined the connections between metabolic profiles and the susceptibility to sarcopenia utilizing LC-MS-based untargeted metabolomics methodologies. This investigation unveiled 62 early metabolic signatures and identified four metabolic pathways associated with sarcopenia, potentially enhancing the prognostication and prevention of sarcopenia in Chinese suburb-dwelling older adults. Notably, the top three metabolites, hypoxanthine, L-2-amino-3-oxobutanoic acid, and PC(14:0/20:2(11Z,14Z)), exhibit promise as novel plasma biomarkers for diagnosing sarcopenia. Nonetheless, these findings stem from a single, limited cohort, underscoring the necessity for future validation through robust, large-scale studies.
The original contributions presented in the study are included in the article/supplementary material. Further inquiries can be directed to the corresponding author.
The studies involving humans were approved by Ethics Committee of Shanghai University of Medicine and Health Sciences. The studies were conducted in accordance with the local legislation and institutional requirements. The participants provided their written informed consent to participate in this study.
PH: Funding acquisition, Methodology, Formal Analysis, Writing – original draft. XC: Writing – original draft, Investigation, Validation. ZL: Validation, Writing – original draft, Methodology. YL: Data curation, Resources, Writing – review & editing. XY: Data curation, Writing – review & editing, Methodology, Software. PS: Data curation, Writing – review & editing, Formal Analysis. YZ: Data curation, Writing – review & editing, Methodology. HZ: Data curation, Methodology, Writing – review & editing, Investigation. SZ: Investigation, Writing – review & editing. XS: Writing – review & editing. QG: Writing – review & editing, Funding acquisition, Methodology, Supervision, Validation.
The author(s) declare financial support was received for the research, authorship, and/or publication of this article. This work was supported by the National Natural Science Foundation of China (82202814; 82172552); Shanghai Municipal Health Commission (GWVI-11.2-YQ08; 20214Y0329; 202240367); and Academic Mentorship for Scientific Research Cadre Project (AMSCP-23-03-01).
We thank all patients and families for their study participation, and Xiaoyue Gu from the Chongming public health center for providing place and organization.
The authors declare that the research was conducted in the absence of any commercial or financial relationships that could be construed as a potential conflict of interest.
All claims expressed in this article are solely those of the authors and do not necessarily represent those of their affiliated organizations, or those of the publisher, the editors and the reviewers. Any product that may be evaluated in this article, or claim that may be made by its manufacturer, is not guaranteed or endorsed by the publisher.
1. Delmonico MJ, Harris TB, Visser M, Park SW, Conroy MB, Velasquez-Mieyer P, et al. Longitudinal study of muscle strength, quality, and adipose tissue infiltration. Am J Clin Nutr. (2009) 90:1579–85. doi: 10.3945/ajcn.2009.28047
2. Fielding RA, Vellas B, Evans WJ, Bhasin S, Morley JE, Newman AB, et al. Sarcopenia: an undiagnosed condition in older adults. Current consensus definition: prevalence, etiology, and consequences. International working group on sarcopenia. J Am Med Directors Assoc. (2011) 12:249–56. doi: 10.1016/j.jamda.2011.01.003
3. Morley JE. Pharmacologic options for the treatment of sarcopenia. Calcif Tissue Int. (2016) 98:319–33. doi: 10.1007/s00223-015-0022-5
4. Zhao Q, Shen H, Liu J, Chiu CY, Su KJ, Tian Q, et al. Pathway-based metabolomics study of sarcopenia-related traits in two US cohorts. Aging (Albany NY). (2022) 14:2101–12. doi: 10.18632/aging.v14i5
5. Meng L, Yang R, Wang D, Wu W, Shi J, Shen J, et al. Specific lysophosphatidylcholine and acylcarnitine related to sarcopenia and its components in older men. BMC Geriatr. (2022) 22:249. doi: 10.1186/s12877-022-02953-4
6. Gonzalez-Freire M, Moaddel R, Sun K, Fabbri E, Zhang P, Khadeer M, et al. Targeted metabolomics shows low plasma lysophosphatidylcholine 18:2 predicts greater decline of gait speed in older adults: the baltimore longitudinal study of aging. J Gerontol A Biol Sci Med Sci. (2019) 74:62–7. doi: 10.1093/gerona/gly100
7. Liu JC, Dong SS, Shen H, Yang DY, Chen BB, Ma XY, et al. Multi-omics research in sarcopenia: Current progress and future prospects. Ageing Res Rev. (2022) 76:101576. doi: 10.1016/j.arr.2022.101576
8. Zhao Q, Shen H, Su KJ, Tian Q, Zhao LJ, Qiu C, et al. A joint analysis of metabolomic profiles associated with muscle mass and strength in Caucasian women. Aging (Albany NY). (2018) 10:2624–35. doi: 10.18632/aging.v10i10
9. Opazo R, Angel B, Marquez C, Lera L, Cardoso Dos Santos GR, Monnerat G, et al. Sarcopenic metabolomic profile reflected a sarcopenic phenotype associated with amino acid and essential fatty acid changes. Metabolomics. (2021) 17:83. doi: 10.1007/s11306-021-01832-0
10. Shin HE, Won CW, Kim M. Metabolomic profiles to explore biomarkers of severe sarcopenia in older men: A pilot study. Exp Gerontol. (2022) 167:111924. doi: 10.1016/j.exger.2022.111924
11. Lu Y, Karagounis LG, Ng TP, Carre C, Narang V, Wong G, et al. Systemic and metabolic signature of sarcopenia in community-dwelling older adults. J Gerontol A Biol Sci Med Sci. (2020) 75:309–17. doi: 10.1093/gerona/glz001
12. Zhou J, Liu J, Lin Q, Shi L, Zeng Z, Guan L, et al. Characteristics of the gut microbiome and metabolic profile in elderly patients with sarcopenia. Front Pharmacol. (2023) 14:1279448. doi: 10.3389/fphar.2023.1279448
13. He Y, Cui W, Fang T, Zhang Z, Zeng M. Metabolites of the gut microbiota may serve as precise diagnostic markers for sarcopenia in the elderly. Front Microbiol. (2023) 14:1301805. doi: 10.3389/fmicb.2023.1301805
14. Lu Y, Karagounis LG, Ng TP, Carre C, Narang V, Wong G, et al. Systemic and metabolic signature of sarcopenia in community-dwelling older adults. J Gerontol A Biol Sci Med Sci. (2020) 75:309–17. doi: 10.1093/gerona/glz001
15. Korostishevsky M, Steves CJ, Malkin I, Spector T, Williams FM, Livshits G. Genomics and metabolomics of muscular mass in a community-based sample of UK females. Eur J Hum Genet. (2016) 24:277–83. doi: 10.1038/ejhg.2015.85
16. Murphy RA, Moore SC, Playdon M, Meirelles O, Newman AB, Milijkovic I, et al. Metabolites associated with lean mass and adiposity in older black men. J Gerontol A Biol Sci Med Sci. (2017) 72:1352–9. doi: 10.1093/gerona/glw245
17. Lo CJ, Ko YS, Chang SW, Tang HY, Huang CY, Huang YC, et al. Metabolic signatures of muscle mass loss in an elderly Taiwanese population. Aging (Albany NY). (2020) 13:944–56. doi: 10.18632/aging.v13i1
18. Liu H, Lin X, Gong R, Shen H, Qu Z, Zhao Q, et al. Identification and functional characterization of metabolites for skeletal muscle mass in early postmenopausal chinese women. J Gerontol A Biol Sci Med Sci. (2022) 77:2346–55. doi: 10.1093/gerona/glac075
19. Ma W, Zhang H, Wu N, Liu Y, Han P, Wang F, et al. Relationship between obesity-related anthropometric indicators and cognitive function in Chinese suburb-dwelling older adults. PloS One. (2021) 16:e0258922. doi: 10.1371/journal.pone.0258922
20. Chen LK, Woo J, Assantachai P, Auyeung TW, Chou MY, Iijima K, et al. Asian working group for sarcopenia: 2019 consensus update on sarcopenia diagnosis and treatment. J Am Med Directors Assoc. (2020) 21:300–307 e302. doi: 10.1016/j.jamda.2019.12.012
21. Han P, Kang L, Guo Q, Wang J, Zhang W, Shen S, et al. Prevalence and factors associated with sarcopenia in suburb-dwelling older chinese using the asian working group for sarcopenia definition. J Gerontol A Biol Sci Med Sci. (2016) 71:529–35. doi: 10.1093/gerona/glv108
22. Zhao Y, Song P, Zhang H, Chen X, Han P, Yu X, et al. Alteration of plasma metabolic profile and physical performance combined with metabolites is more sensitive to early screening for mild cognitive impairment. Front Aging Neurosci. (2022) 14:951146. doi: 10.3389/fnagi.2022.951146
23. Wang W, Yang GJ, Zhang J, Chen C, Jia ZY, Li J, et al. Plasma, urine and ligament tissue metabolite profiling reveals potential biomarkers of ankylosing spondylitis using NMR-based metabolic profiles. Arthritis Res Ther. (2016) 18:244. doi: 10.1186/s13075-016-1139-2
24. Shida T, Yoshida Y, Ohta T, Kojima N, Osuka Y, Takekoshi K, et al. Identification of a novel biomarker for sarcopenia diagnosis using serum metabolomic analysis: a pilot study. Eur Geriatr Med. (2024) 15:571–7. doi: 10.1007/s41999-023-00914-7
25. Xiang L, Zhang H, Wei J, Tian XY, Luan H, Li S, et al. Metabolomics studies on db/db diabetic mice in skeletal muscle reveal effective clearance of overloaded intermediates by exercise. Anal Chim Acta. (2018) 1037:130–9. doi: 10.1016/j.aca.2017.11.082
26. Durham WJ, Casperson SL, Dillon EL, Keske MA, Paddon-Jones D, Sanford AP, et al. Age-related anabolic resistance after endurance-type exercise in healthy humans. FASEB J. (2010) 24:4117–27. doi: 10.1096/fj.09-150177
27. Beavers KM, Beavers DP, Serra MC, Bowden RG, Wilson RL. Low relative skeletal muscle mass indicative of sarcopenia is associated with elevations in serum uric acid levels: findings from NHANES III. J nutrition Health Aging. (2009) 13:177–82. doi: 10.1007/s12603-009-0054-5
28. Lawton KA, Berger A, Mitchell M, Milgram KE, Evans AM, Guo L, et al. Analysis of the adult human plasma metabolome. Pharmacogenomics. (2008) 9:383–97. doi: 10.2217/14622416.9.4.383
29. Yegutkin GG. Enzymes involved in metabolism of extracellular nucleotides and nucleosides: functional implications and measurement of activities. Crit Rev Biochem Mol Biol. (2014) 49:473–97. doi: 10.3109/10409238.2014.953627
30. Derbre F, Gratas-Delamarche A, Gomez-Cabrera MC, Vina J. Inactivity-induced oxidative stress: a central role in age-related sarcopenia? Eur J Sport Sci. (2014) 14 Suppl 1:S98–108. doi: 10.1080/17461391.2011.654268
31. Yao W, Gu H, Zhu J, Barding G, Cheng H, Bao B, et al. Integrated plasma and urine metabolomics coupled with HPLC/QTOF-MS and chemometric analysis on potential biomarkers in liver injury and hepatoprotective effects of Er-Zhi-Wan. Anal Bioanal Chem. (2014) 406:7367–78. doi: 10.1007/s00216-014-8169-x
32. El Hafidi M, Perez I, Zamora J, Soto V, Carvajal-Sandoval G, Banos G. Glycine intake decreases plasma free fatty acids, adipose cell size, and blood pressure in sucrose-fed rats. Am J Physiol Regul Integr Comp Physiol. (2004) 287:R1387–1393. doi: 10.1152/ajpregu.00159.2004
33. Gu X, Al Dubayee M, Alshahrani A, Masood A, Benabdelkamel H, Zahra M, et al. Distinctive metabolomics patterns associated with insulin resistance and type 2 diabetes mellitus. Front Mol Biosci. (2020) 7:609806. doi: 10.3389/fmolb.2020.609806
34. Hinkley JM, Cornnell HH, Standley RA, Chen EY, Narain NR, Greenwood BP, et al. Older adults with sarcopenia have distinct skeletal muscle phosphodiester, phosphocreatine, and phospholipid profiles. Aging Cell. (2020) 19:e13135. doi: 10.1111/acel.13135
35. Wang X, Xiao R, Li H, Li T, Guan L, Ding H, et al. Correlation between mild cognitive impairment and sarcopenia: the prospective role of lipids and basal metabolic rate in the link. Nutrients. (2022) 14:1–19. doi: 10.2139/ssrn.4099408
36. Antonioli L, Blandizzi C, Pacher P, Hasko G. Immunity, inflammation and cancer: a leading role for adenosine. Nat Rev Cancer. (2013) 13:842–57. doi: 10.1038/nrc3613
37. Antonioli L, Colucci R, Pellegrini C, Giustarini G, Tuccori M, Blandizzi C, et al. The role of purinergic pathways in the pathophysiology of gut diseases: pharmacological modulation and potential therapeutic applications. Pharmacol Ther. (2013) 139:157–88. doi: 10.1016/j.pharmthera.2013.04.002
38. Nishikawa H, Fukunishi S, Asai A, Yokohama K, Nishiguchi S, Higuchi K. Pathophysiology and mechanisms of primary sarcopenia (Review). Int J Mol Med. (2021) 48. doi: 10.3892/ijmm
39. Mangin M, Sinha R, Fincher K. Inflammation and vitamin D: the infection connection. Inflammation Res. (2014) 63:803–19. doi: 10.1007/s00011-014-0755-z
40. Zielinska A, Sobolewska-Wlodarczyk A, Wisniewska-Jarosinska M, Gasiorowska A, Fichna J, Salaga M. The 25(OH)D3, but not 1,25(OH)2D3 levels are elevated in IBD patients regardless of vitamin D supplementation and do not associate with pain severity or frequency. Pharm (Basel). (2021) 14:1–14. doi: 10.3390/ph14030284
Keywords: LC-MS, risk, sarcopenia, untargeted metabonomics, Chinese
Citation: Han P, Chen X, Liang Z, Liu Y, Yu X, Song P, Zhao Y, Zhang H, Zhu S, Shi X and Guo Q (2024) Metabolic signatures and risk of sarcopenia in suburb-dwelling older individuals by LC-MS–based untargeted metabonomics. Front. Endocrinol. 15:1308841. doi: 10.3389/fendo.2024.1308841
Received: 07 October 2023; Accepted: 04 June 2024;
Published: 19 June 2024.
Edited by:
Kenju Shimomura, Fukushima Medical University, JapanReviewed by:
Pengpeng Ye, Chinese Center For Disease Control and Prevention, ChinaCopyright © 2024 Han, Chen, Liang, Liu, Yu, Song, Zhao, Zhang, Zhu, Shi and Guo. This is an open-access article distributed under the terms of the Creative Commons Attribution License (CC BY). The use, distribution or reproduction in other forums is permitted, provided the original author(s) and the copyright owner(s) are credited and that the original publication in this journal is cited, in accordance with accepted academic practice. No use, distribution or reproduction is permitted which does not comply with these terms.
*Correspondence: Qi Guo, Z3VvcWlqcEBnbWFpbC5jb20=
†These authors have contributed equally to this work and share first authorship
Disclaimer: All claims expressed in this article are solely those of the authors and do not necessarily represent those of their affiliated organizations, or those of the publisher, the editors and the reviewers. Any product that may be evaluated in this article or claim that may be made by its manufacturer is not guaranteed or endorsed by the publisher.
Research integrity at Frontiers
Learn more about the work of our research integrity team to safeguard the quality of each article we publish.