 Kaibin Fang1
 Zhangsheng Dai
- 1Department of Orthopaedic Surgery, The Second Affiliated Hospital of Fujian Medical University, Quanzhou, China
- 2Aviation College, Liming Vocational University, Quanzhou, China
Purpose: The main objective of this study is to assess the possibility of using radiomics, deep learning, and transfer learning methods for the analysis of chest CT scans. An additional aim is to combine these techniques with bone turnover markers to identify and screen for osteoporosis in patients.
Method: A total of 488 patients who had undergone chest CT and bone turnover marker testing, and had known bone mineral density, were included in this study. ITK-SNAP software was used to delineate regions of interest, while radiomics features were extracted using Python. Multiple 2D and 3D deep learning models were trained to identify these regions of interest. The effectiveness of these techniques in screening for osteoporosis in patients was compared.
Result: Clinical models based on gender, age, and β-cross achieved an accuracy of 0.698 and an AUC of 0.665. Radiomics models, which utilized 14 selected radiomics features, achieved a maximum accuracy of 0.750 and an AUC of 0.739. The test group yielded promising results: the 2D Deep Learning model achieved an accuracy of 0.812 and an AUC of 0.855, while the 3D Deep Learning model performed even better with an accuracy of 0.854 and an AUC of 0.906. Similarly, the 2D Transfer Learning model achieved an accuracy of 0.854 and an AUC of 0.880, whereas the 3D Transfer Learning model exhibited an accuracy of 0.740 and an AUC of 0.737. Overall, the application of 3D deep learning and 2D transfer learning techniques on chest CT scans showed excellent screening performance in the context of osteoporosis.
Conclusion: Bone turnover markers may not be necessary for osteoporosis screening, as 3D deep learning and 2D transfer learning techniques utilizing chest CT scans proved to be equally effective alternatives.
Background
Bone turnover markers (BTM) are biochemical substances produced during the dynamic process of bone remodeling, providing a timely and accurate reflection of bone turnover in the human body (1). These markers play a pivotal role in the diagnosis and treatment of osteoporosis, a prevalent bone disorder (2). However, the diagnosis of osteoporosis primarily relies on DXA (3). Although there is some correlation between BTM and BMD, this correlation is not robust enough for the diagnosis of osteoporosis (4). These limitations have hindered the widespread use of these markers. The diagnosis of osteoporosis currently requires quantitative CT or DXA examinations, which may increase additional costs (5). Furthermore, the availability of these devices is limited, particularly QCT, in many medical centers. Simultaneously, it is worth noting that the screening rate for osteoporosis remains unsatisfactory, likely indicating a lack of comprehensive understanding regarding the intricacies of the disease (6).
Chest CT is a crucial and commonly performed medical check-up. Regular chest CT scans are recommended for certain populations, particularly the elderly, who are considered to be at higher risk for lung cancer (7). If this examination can successfully diagnose osteoporosis, it may potentially eliminate the need for DXA scans, thereby reducing radiation exposure.The technologies of deep learning and radiomics provide possibilities for the implementation of this idea. Radiomics refers to the extraction of data that can be analyzed from medical imaging, and it has been extensively applied in enhancing the accuracy of medical diagnosis, prognosis, and clinical decision-making. Its application aims to achieve precise medical treatment (8). This technology has gained widespread adoption and its efficacy has been validated (9, 10). Deep learning is also extensively utilized in the field of medicine. This technology is not only applied for disease diagnosis but also widely employed for the automatic segmentation of medical images (11). This technology has also been employed in the diagnosis of osteoporosis and has yielded promising outcomes. Previously reported studies primarily focused on analyzing 2D images such as lumbar and hip X-rays, using deep learning techniques to diagnose osteoporosis in patients (12). However, in medical imaging, three-dimensional images such as CT scans and MRI scans are more commonly used. In this regard, employing pre-trained 3D deep learning models can significantly enhance the analysis of such medical images.
In this study, we aim to develop a comprehensive screening model for osteoporosis by integrating patient demographics and bone turnover markers.We also utilize radiomics techniques and both 2D and 3D deep learning algorithms to analyze chest CT scans and identify potential cases of osteoporosis. To extract transfer learning, transfer learning will be employed. Transfer learning enables the acquisition of valuable features from a source domain, encoding these features, and transferring them from the source domain to the target domain, thus effectively enhancing the performance of the target domain task (13).
This study aims to identify the most optimal methods for osteoporosis screening utilizing chest CT scans. It will explore and compare various techniques including radiomics, 2D and 3D deep learning, and 2D and 3D transfer learning techniques. Additionally, these methods will be compared to conventional bone turnover markers for their efficacy in osteoporosis screening.
Materials and methods
Participants in the study and development of clinical models
This study retrospectively analyzed a population of patients who underwent both chest CT scans and DXA bone density testing at a large hospital from January 2019 to May 2023. Patients with the following conditions will be excluded from the scope of the study: Severe scoliosis, both the eleventh and twelfth thoracic vertebrae with severe compressibility fractures that cannot be corrected, the fixed artifacts affecting the feature extraction area, and no results of bone turnover marker examination. Approval was obtained from the Hospital Institutional Review Board, and the study was conducted in compliance with the principles outlined in the Declaration of Helsinki. Almost all patients underwent chest CT scans and bone metabolism marker detection. The BTM included in the analysis were vitamin D, total type 1 collagen amino acid extension peptide (TPINP), and β- B-Cross Laps. The gold standard for distinguishing osteoporosis was the result of DXA, whereby a T-value of -2.5 or less indicated the presence of the condition (12).
The patients were randomly assigned to training sets, and their baseline data is depicted in Table 1. The clinical characteristics of the patients were analyzed using either an independent sample t-test or chi-square test, depending on the type of data.
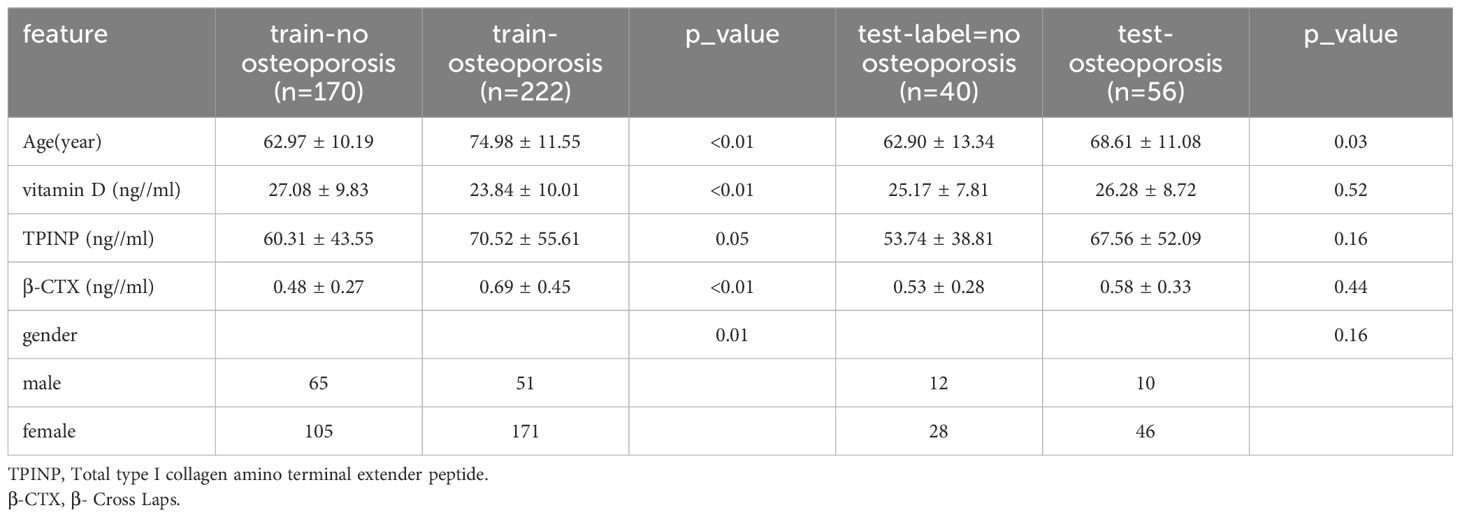
Table 1 The baseline clinical characteristics of patients.
Clinical signature
The training set data underwent initial univariate analysis to identify factors with a p-value less than 0.05, indicating their significance. These selected clinical factors were then used for subsequent multivariate analysis.
To establish a predictive model, the eleven most common machine learning models were trained using the final selected clinical factors. These machine models include SVM (13), KNN (14), RandomForest (15), ExtraTrees (16), XGBoost (17), LightGBM (18), NaiveBayes (19), AdaBoost (20), GradientBoosting (21), LR (22), MLP (23).
Delineation of ROI
The preprocessing step involved adjusting the window width and window level of the images to bone windows, as well as standardizing the resolution of the images. Furthermore, for the purpose of standardization, all images will undergo adjustment to ensure consistent layer thickness and spacing. Radiomics feature extraction primarily focused on the twelfth thoracic vertebra during the analysis. In cases where measurement difficulties were encountered, the eleventh thoracic vertebra was selected instead to minimize potential deviations. This approach considered the physical susceptibility of the chest and waist, which are common areas for osteoporotic fractures resulting from movement and pressure (24). Axial images from the chest CT scans were chosen for analysis, and image reconstruction and delineation of the region of interest (ROI) were performed using ITK SNAP software (25). Typically, the images captured both vertebral bodies in the chest CT scans. Anatomical markers, such as the twelfth rib, the lower edge of the scapula, and the seventh cervical spine spinous process, were used to outline the segment of the thoracic spine for ROI delineation. The process of ROI drawing is illustrated in Figure 1A.
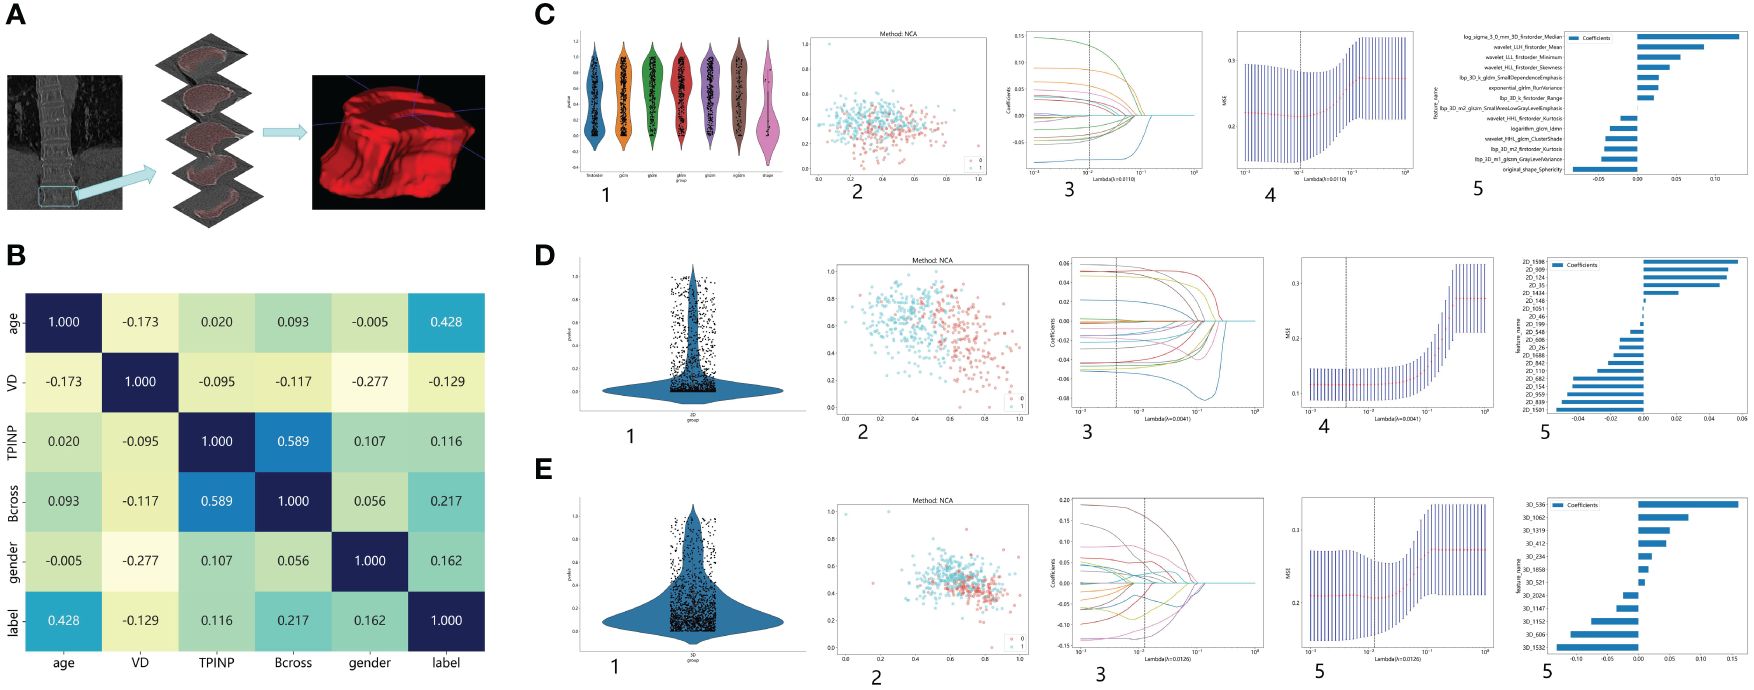
Figure 1 Research Process. (A) The process of outlining ROI. (B) The correlation between various clinical indicators and osteoporosis. (C) Extract Radiomics Features: 1. Overview of Extracted Features. 2. Visualize Results using Spectral Clustering. 3,4. LASOO Regression. 5. Feature Weights. (D) Extract 2D Transfer Learning: 1. Overview of Extracted Features. 2. Visualize Results using Spectral Clustering. 3,4. LASOO Regression. 5. Feature Weights. (E) Extract 3D Transfer Learning: 1. Overview of Extracted Features. 2. Visualize Results using Spectral Clustering. 3,4. LASOO Regression. 5. Feature Weights.
Intra- and inter-observer variability
The intra- and inter-observer variability of the ROI delineation on the CT images was evaluated using the Intraclass correlation coefficient (ICC). One researcher defined the ROI, while another researcher with more than 10 years of experience in orthopedics randomly selected 30 cases and redefined the ROI. Both researchers were unaware of each other’s results. The ICC values were calculated based on these 30 cases. Prior to feature selection, an assessment of intra-observer variability will be performed on the extracted radiomics features of all patients. Features exhibiting intraclass correlation coefficients (ICCs) exceeding 0.9 will be deemed reliable and will proceed to subsequent analyses.
Radiomics feature extraction
The feature extraction process was conducted using the Pyradiomics Module (https://github.com/Radiomics/pyradiomics).
Feature selection
In order to identify the most relevant features associated with the presence of osteoporosis, a meticulous feature selection process was implemented. Initially, the U test (p<0.05) was employed to identify features that exhibited significant differences between the osteoporosis and non-osteoporosis groups. Furthermore, to ensure the inclusion of only statistically significant and reliable features, those with ICC coefficients lower than 0.9 were excluded from this step. This rigorous approach effectively reduced the number of features while maintaining their predictive power.To address the issue of multicollinearity, Pearson correlation analysis was conducted to examine the relationships between features. Calculation of correlation coefficients allowed for identification of feature pairs with values ≥0.9 or ≤-0.9. In such cases, only the feature demonstrating superior diagnostic performance was retained, thereby preventing redundancy within the model introduced by highly correlated features. Employing the Maximum Correlation Minimum Redundancy (mRMR) algorithm for feature selection, we retain only the top 20 most informative features. To further refine the feature set, the least absolute shrinkage and selection operator (LASSO) logistic regression technique was employed. We employed the same machine learning model used for analyzing clinical features to analyze the extracted radiomics features.
2D deep learning
The maximum cross-sectional area of ROI should be selected at first, as it represents the most prominent area of the thoracic vertebral body. These areas can then be cropped from the original CT image using Python. The source code for the cropping process is available open source and can be obtained from the CSDN website (https://blog.csdn.net/).
In this study, a pre-trained model was employed, and the researchers made no alterations to its parameters. Consequently, the study lacked a validation group, comprising solely a training group and a testing group (26). The division of this group aligns with the approach used in prior studies involving clinical and radiomics models.
The 24 most common deep learning neural network architectures are used for learning and recognizing images of these patients. These models are alexnet, densenet121, densenet169, googlenet, mnasnet1_0, mobilenet_v2, mobilenet_v3_large, mobilenet_v3_small, resnet101, resnet152, resnet18, resnet34, resnet50, resnext50_32x4d, squeezenet1_0, squeezenet1_1, vgg11, vgg11_bn, vgg13, vgg13_bn, vgg16, vgg16_bn, vgg19, vgg19_bn.
The cropped image serves as the input for deep learning algorithms. To update the model parameters, the stochastic gradient descent (SGD) optimizer is utilized. The training process consists of 100 epochs, each containing 1800 iterations. A batch size of 32 is used during these iterations. Each slice of the cropped image is treated as an independent input for the deep learning model.
3D deep learning
The complete Region of Interest (ROI) is extracted and serves as both the training and testing dataset for the 3D deep learning model. To update the model parameters, the stochastic gradient descent (SGD) optimizer is utilized. The training process consists of 100 epochs, each containing 1800 iterations. A batch size of 4 is used during these iterations. Each slice of the cropped image is treated as an independent input for the deep learning model. The 8 most common deep learning neural network architectures are used for learning and recognizing images of these patients. These models are denseNet121, resnet10, resnet101, resnet152, resnet18, resnet34, resnet50, shuffleNet. The parameter settings for 3D deep learning mirror those utilized in 2D deep learning.
Transfer learning extraction
After completing both 2D and 3D deep learning, the most efficient deep learning model will be chosen for feature extraction. Once the feature extraction is finalized, these features will undergo a screening process identical to that used for radiomics features. Additionally, the same machine learning models would be employed for training and testing these features.
Statistical analysis
The study will assess the efficacy of osteoporosis screening through a comparative analysis of radiomics models, deep learning models, transfer learning models, and clinical models. Ultimately, we will identify the model that demonstrates the highest screening efficiency.
To evaluate the performance of the model, data from the test set will be used. The effectiveness of the model will be assessed using the Area Under Curve (AUC) (27), a commonly employed metric in evaluating the performance of predictive models. The AUC provides a comprehensive measure of the model’s discriminatory ability and will be used to determine the overall quality of the predictions made by the model.
The patient’s baseline data were analyzed using statistical software packages, specifically SPSS (version 20.0) and Python. Continuous variables were presented as mean ± standard deviation, while categorical variables were described using frequencies and percentages. To assess the distribution of continuous variables, the Kolmogorov-Smirnov (KS) (28) test was employed. Additionally, the Levene test (29) was used to evaluate the homogeneity of continuous variances. To compare inter-group differences, the or Student’s t-test was used, depending on the distribution of the variables. For categorical variables, the Chi-squared test or Fisher’s exact test was employed. Statistical significance was defined as a p-value < 0.05. The AUC was used to evaluate the performance of predictive models, and the 95% confidence interval (CI) of the AUC was calculated using the bootstrap method with 1000 intervals. To compare the AUCs of different models, the DeLong testing method was applied, enabling a statistical assessment of the differences in performance metrics between the models (30). The study aims to compare the performance of radiomics features, transfer learning models, and clinical features in different models. The most effective model will then be compared to the performance of deep learning in order to identify the optimal method for screening patients for osteoporosis using chest CT scans. The Selection Criteria: Evaluating the Performance of Machine Learning Models for Osteoporosis Screening in the Test Group, Prioritizing Accuracy and AUC.
Results
A total of 488 patients were included in the study and randomly divided into a training group and a testing group. In the training group, out of a total of 170 patients, none were diagnosed with osteoporosis, while 222 patients were identified as osteoporosis patients. Similarly, in the test group, 40 patients were found to be free from osteoporosis, while 56 patients were diagnosed with the condition. Figures 1B–E shows the process of feature extractionfor clinical models, radiomics models, and 2D/3D transfer learning models, respectively
Screening of risk factors for osteoporosis
In the univariate analysis, the p-values of gender, age, vitamin D, TPINP, and β-cross, were found to be less than 0.05. These indicators were subsequently chosen for the multivariate analysis. In the multivariate analysis, the p-values of indicators such as gender, age, and β-cross also remained below the 0.05 threshold. Based on these results, these indicators were selected as the foundation for establishing clinical models. The outcomes of both single factor analysis and multivariable analysis are presented in Table 2. Table 3 and Figure 2A displays the performance of these features in the machine learning models. In the testing group, the AdaBoost model exhibited the highest performance. The accuracy of this model is 0.698, and the AUC is 0.665.
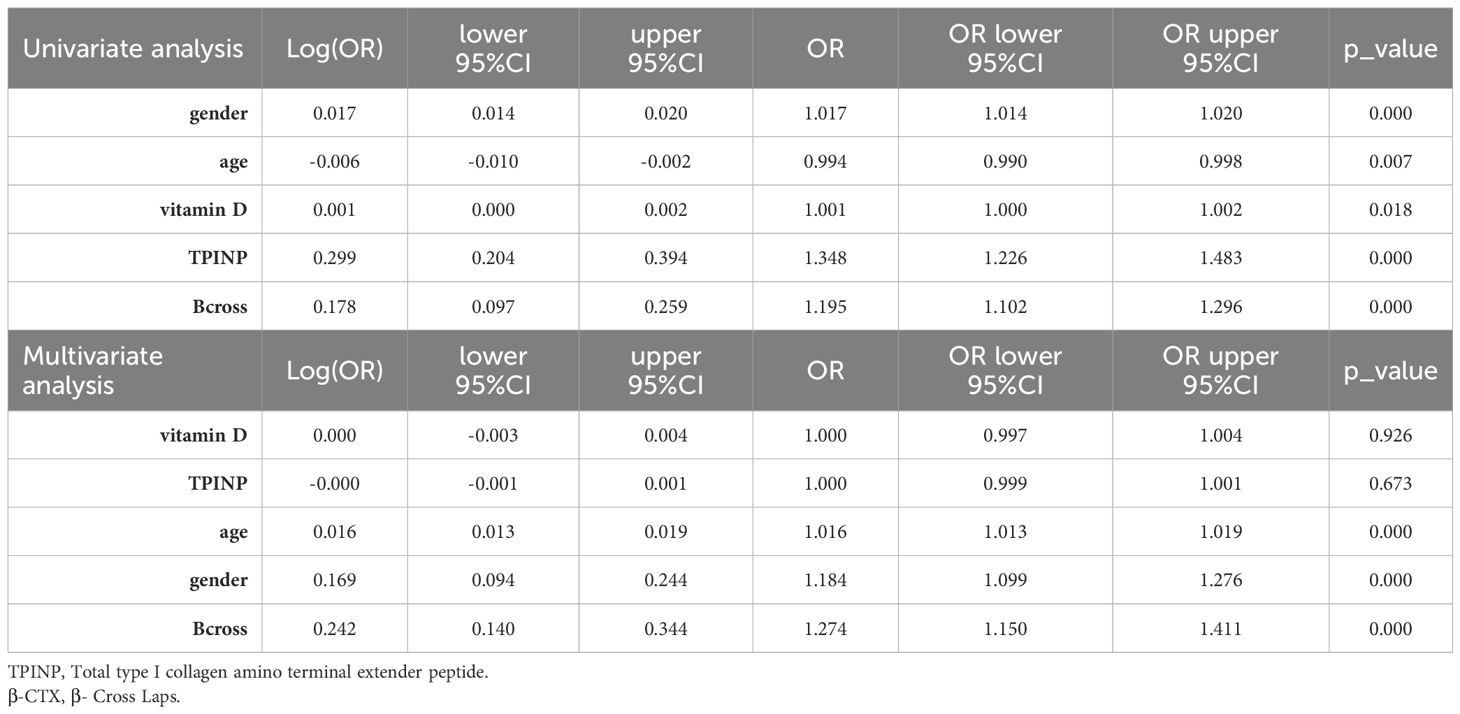
Table 2 Screening of risk factors for osteoporosis and establishment of clinical models.
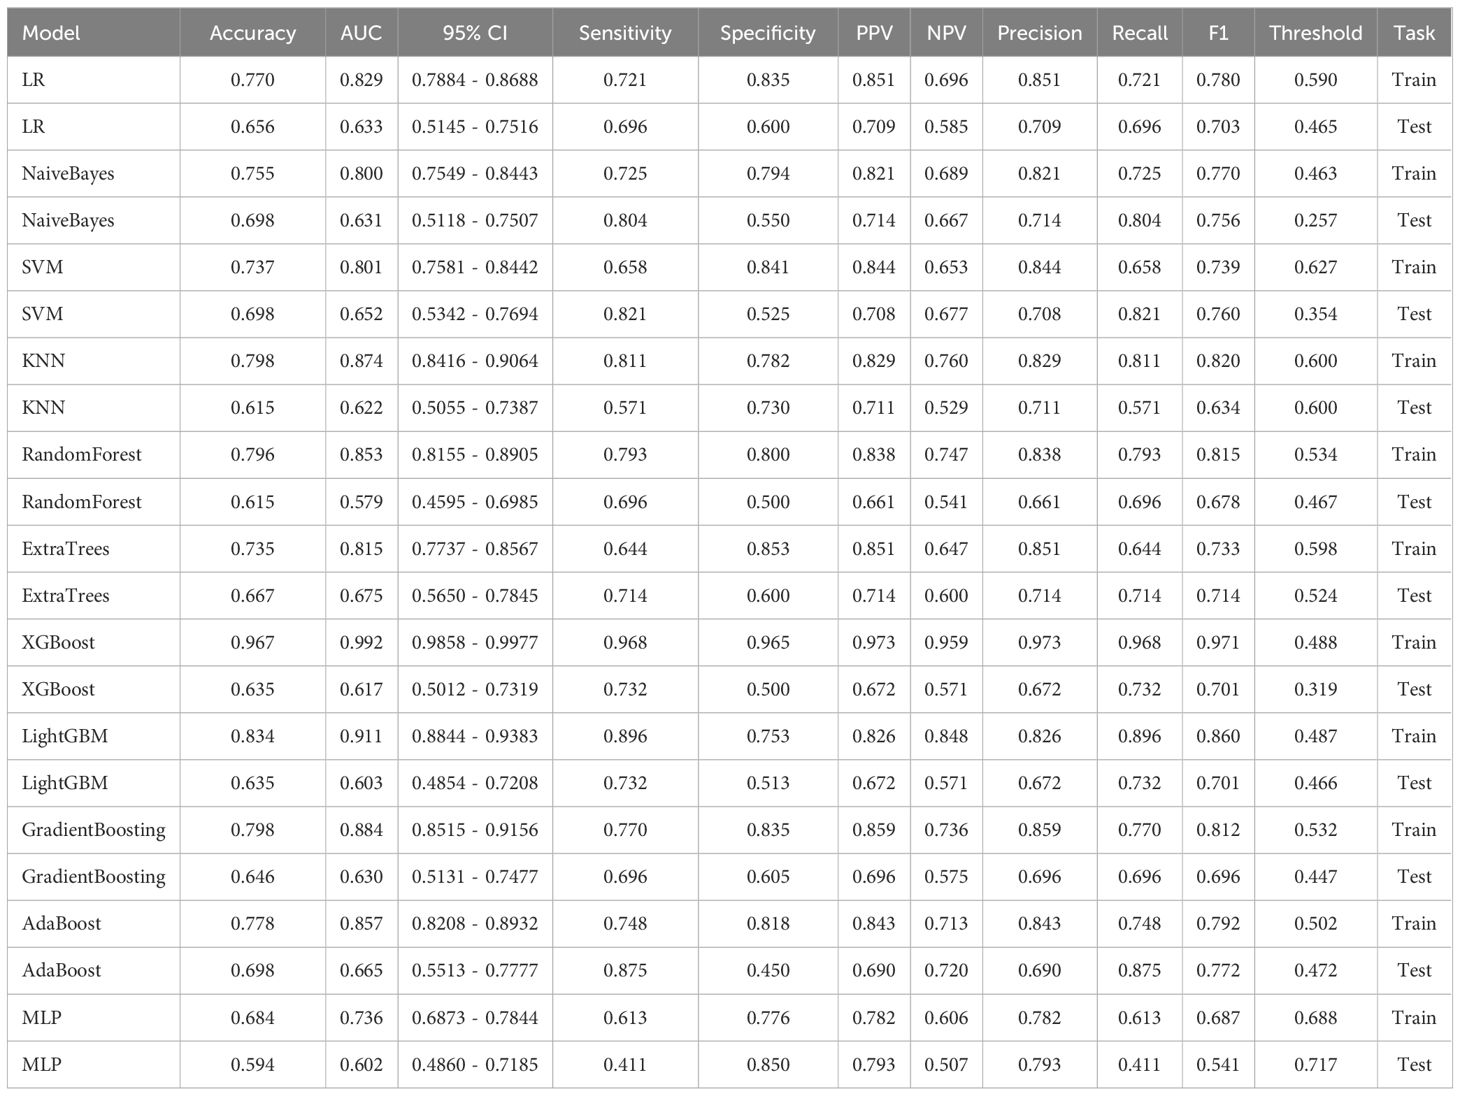
Table 3 Effectiveness of clinical model.
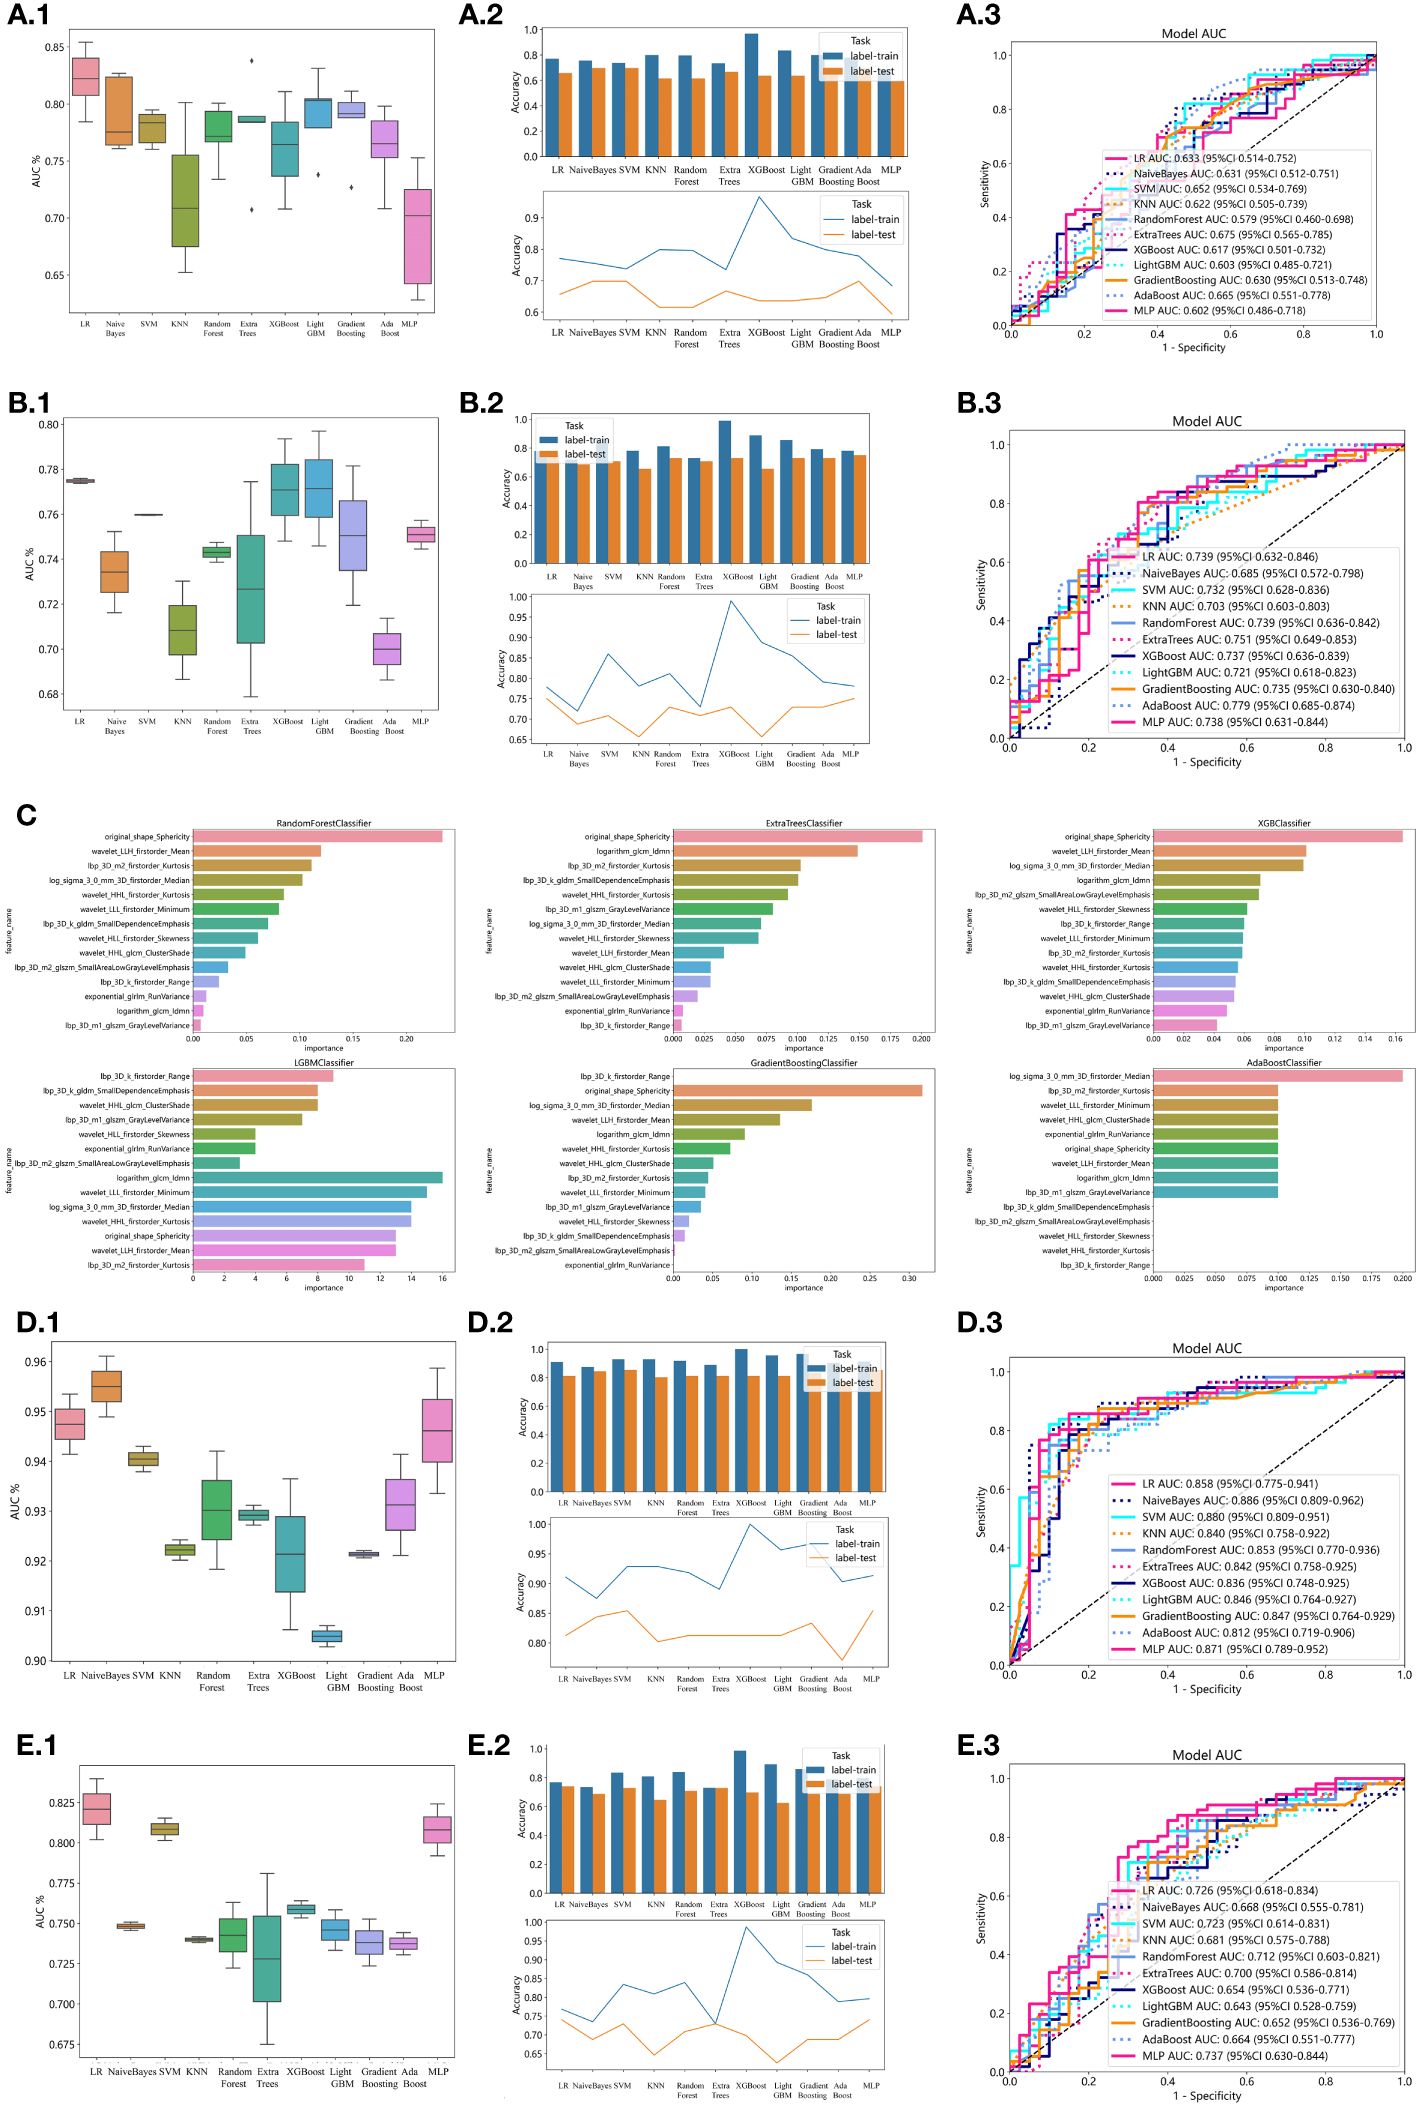
Figure 2 Effectiveness of radiomics models, clinical models, 2D transfer learning models, and 3D transfer models. (A) Effectiveness of clinical models. (A.1) Utilizing Machine Learning Models for Osteoporosis Screening Based on Clinical Features. (A.2) Assessing the Accuracy of Machine Learning Models for Osteoporosis Screening using Clinical Features. (A.3) Evaluation of Machine Learning Models in the Testing Group, Leveraging Clinical Features for Osteoporosis Screening: AUC and Sensitivity Analysis. (B) Effectiveness of radiomics models. (B.1) Utilizing Machine Learning Models for Osteoporosis Screening Based on Radiomics Features. (B.2) Assessing the Accuracy of Machine Learning Models for Osteoporosis Screening using Radiomics Features. (B.3) Evaluation of Machine Learning Models in the Testing Group, Leveraging Radiomics Features for Osteoporosis Screening: AUC and Sensitivity Analysis. (C) Weights of radiomics features in tree models. (D) Effectiveness of 2D Transfer Learning Model. (D.1) Utilizing Machine Learning Models for Osteoporosis Screening Based on 2D Transfer Learning. (D.2) Assessing the Accuracy of Machine Learning Models for Osteoporosis Screening using 2D Transfer Learning. (D.3) Evaluation of Machine Learning Models in the Testing Group, Leveraging 2D Transfer Learning for Osteoporosis Screening: AUC and Sensitivity Analysis. (E) Effectiveness of 3D Transfer Learning Model. (E.1) Utilizing Machine Learning Models for Osteoporosis Screening Based on 3D Transfer Learning. (E.2) Assessing the Accuracy of Machine Learning Models for Osteoporosis Screening using 3D Transfer Learning. (E.3) Evaluation of Machine Learning Models in the Testing Group, Leveraging 3D Transfer Learning for Osteoporosis Screening: AUC and Sensitivity Analysis.
Establishment of radiomics model
1834 radiomics features were extracted for each patient. Finally, 14 features were ultimately included in the study. Table 4 and Figure 2B displays the performance of these radiomics features in the machine learning models. Figure 2C shows the importance ranking of filtered radiomics features among six tree models. In the testing group, the LR model showcased the best performance. The accuracy of this model in the test group is 0.750, and the AUC is 0.739.
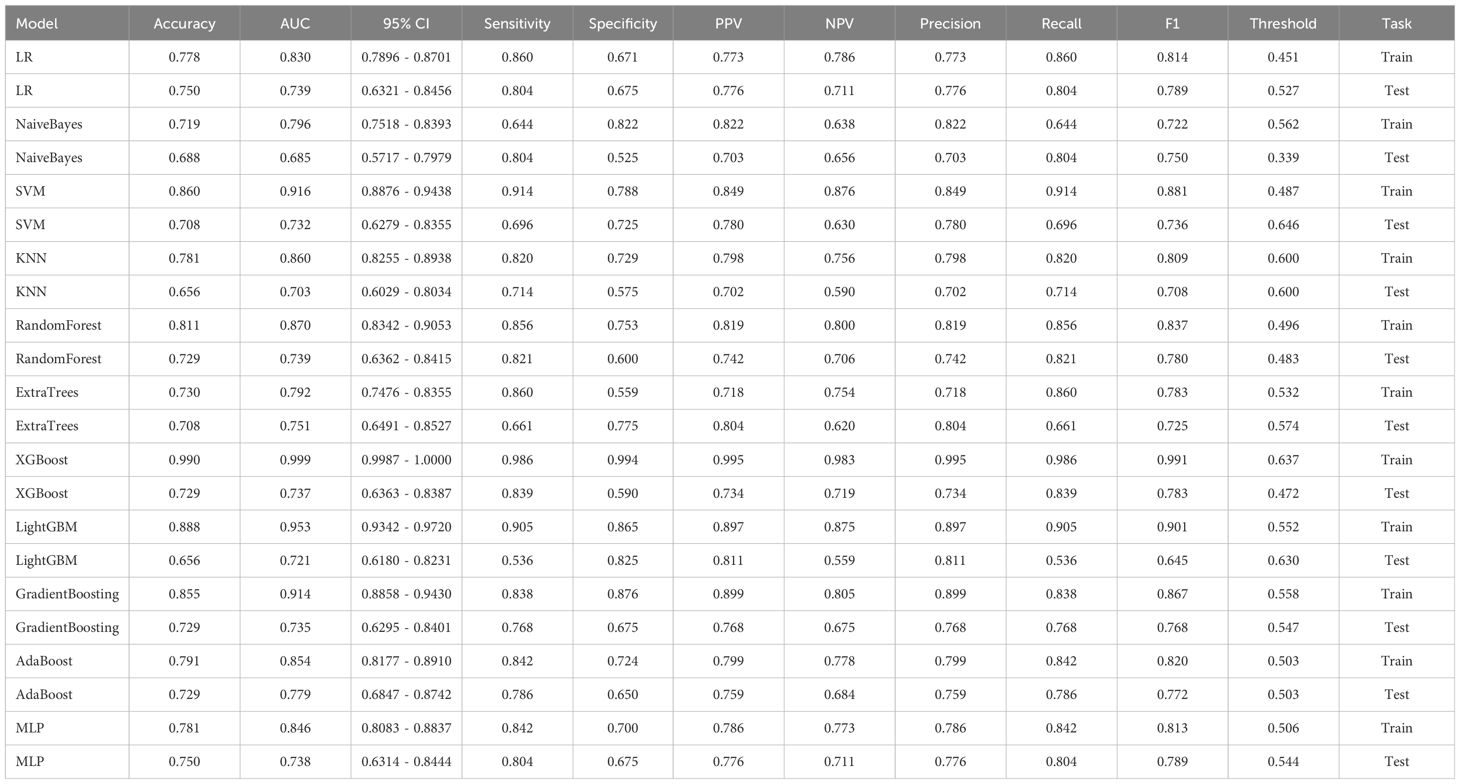
Table 4 Effectiveness of radiomics model.
Efficiency of 2D deep learning models
After performing image processing and inputting the data, a total of 24 2D deep learning models were employed to detect osteoporosis using the maximum cross-sectional area of the ROI in chest CT scans. These findings are summarized in Table 5 and visually presented in Figure 3. Additionally, the visualization results of the model can be observed in Figure 4. Among the various models tested for screening osteoporosis through chest CT, ResNet152 exhibited the most optimal performance. The accuracy of this model in the test group is 0.812, and the AUC is 0.855.

Table 5 Effectiveness of 2D deep learning models.
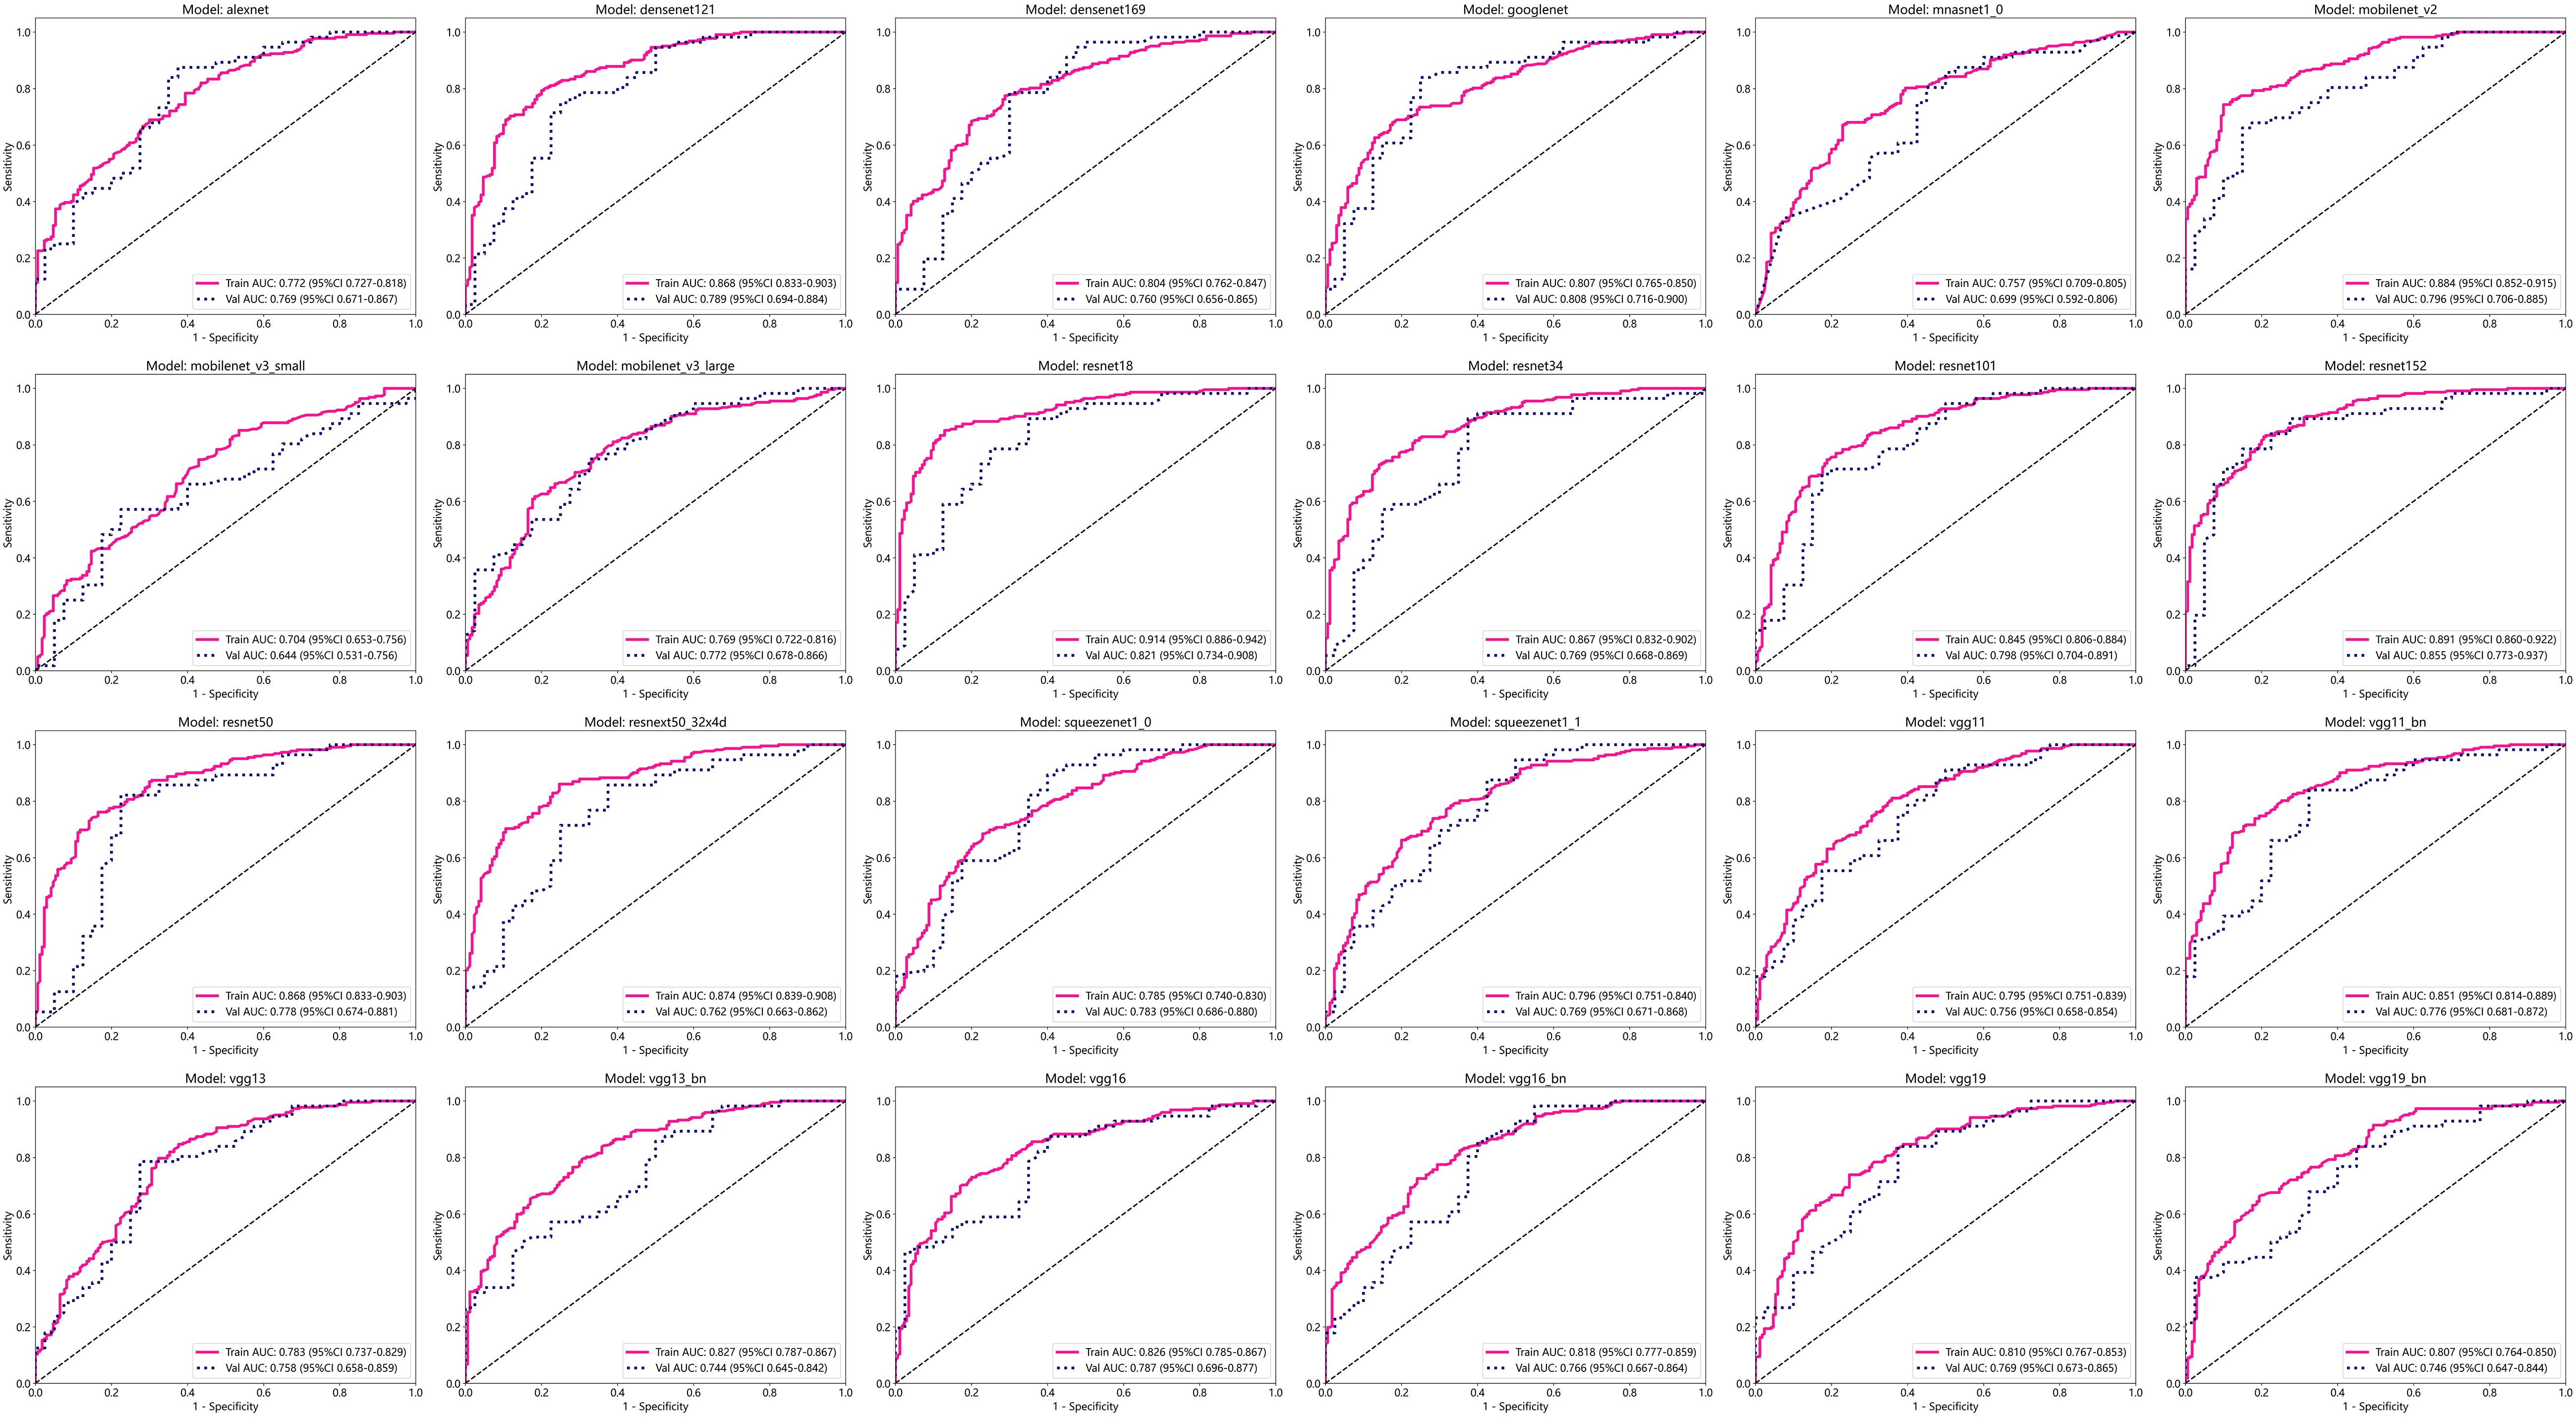
Figure 3 Effectiveness of 2D deep learning models.
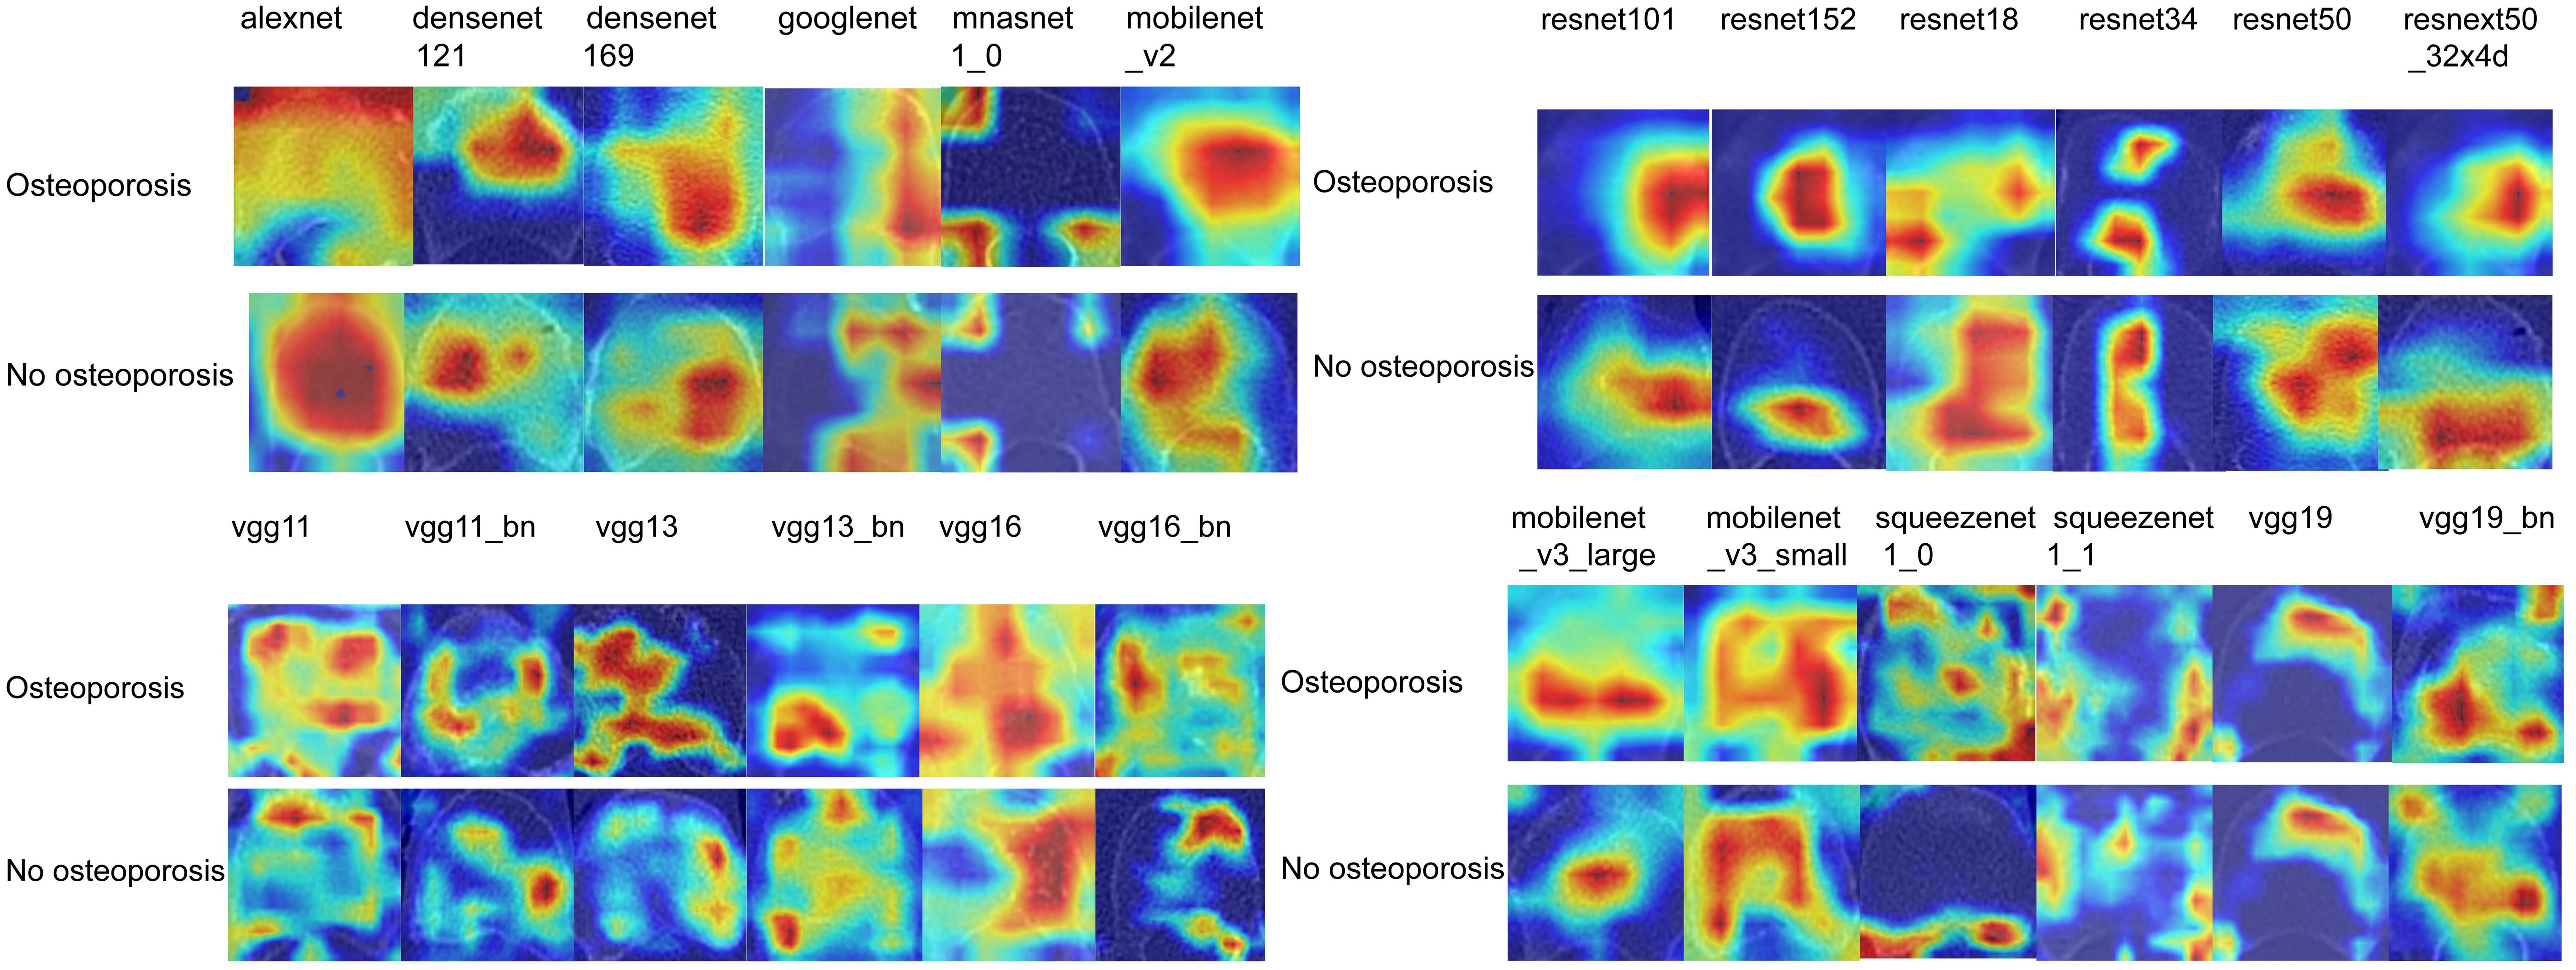
Figure 4 Visualization of 2D deep learning models.
Efficiency of 3D deep learning models
After performing image processing and inputting the data, a total of 8 3D deep learning models were employed to detect osteoporosis using the all regions of the region of interest (ROI) in chest CT scans. These findings are summarized in Table 6 and visually presented in Figure 5. Among the various models tested for screening osteoporosis through chest CT, ResNet10 exhibited the most optimal performance. The accuracy of this model in the test group is 0.854, and the AUC is 0.906.
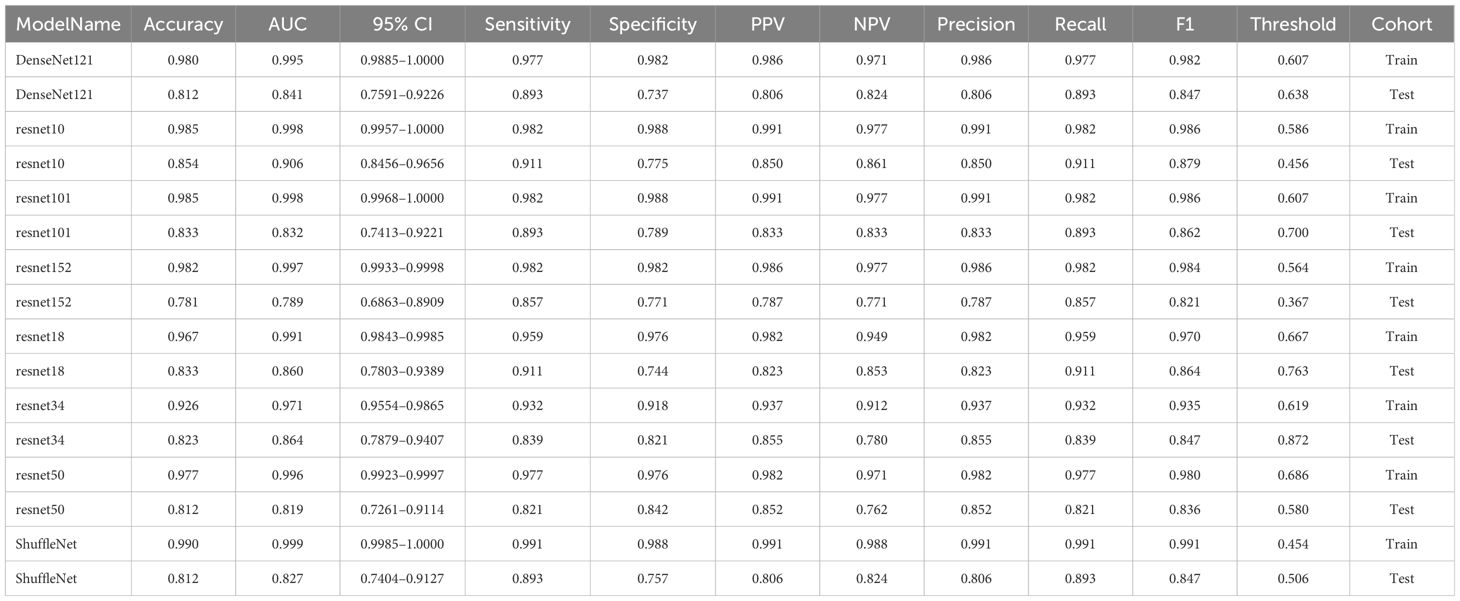
Table 6 Effectiveness of 3D deep learning models.
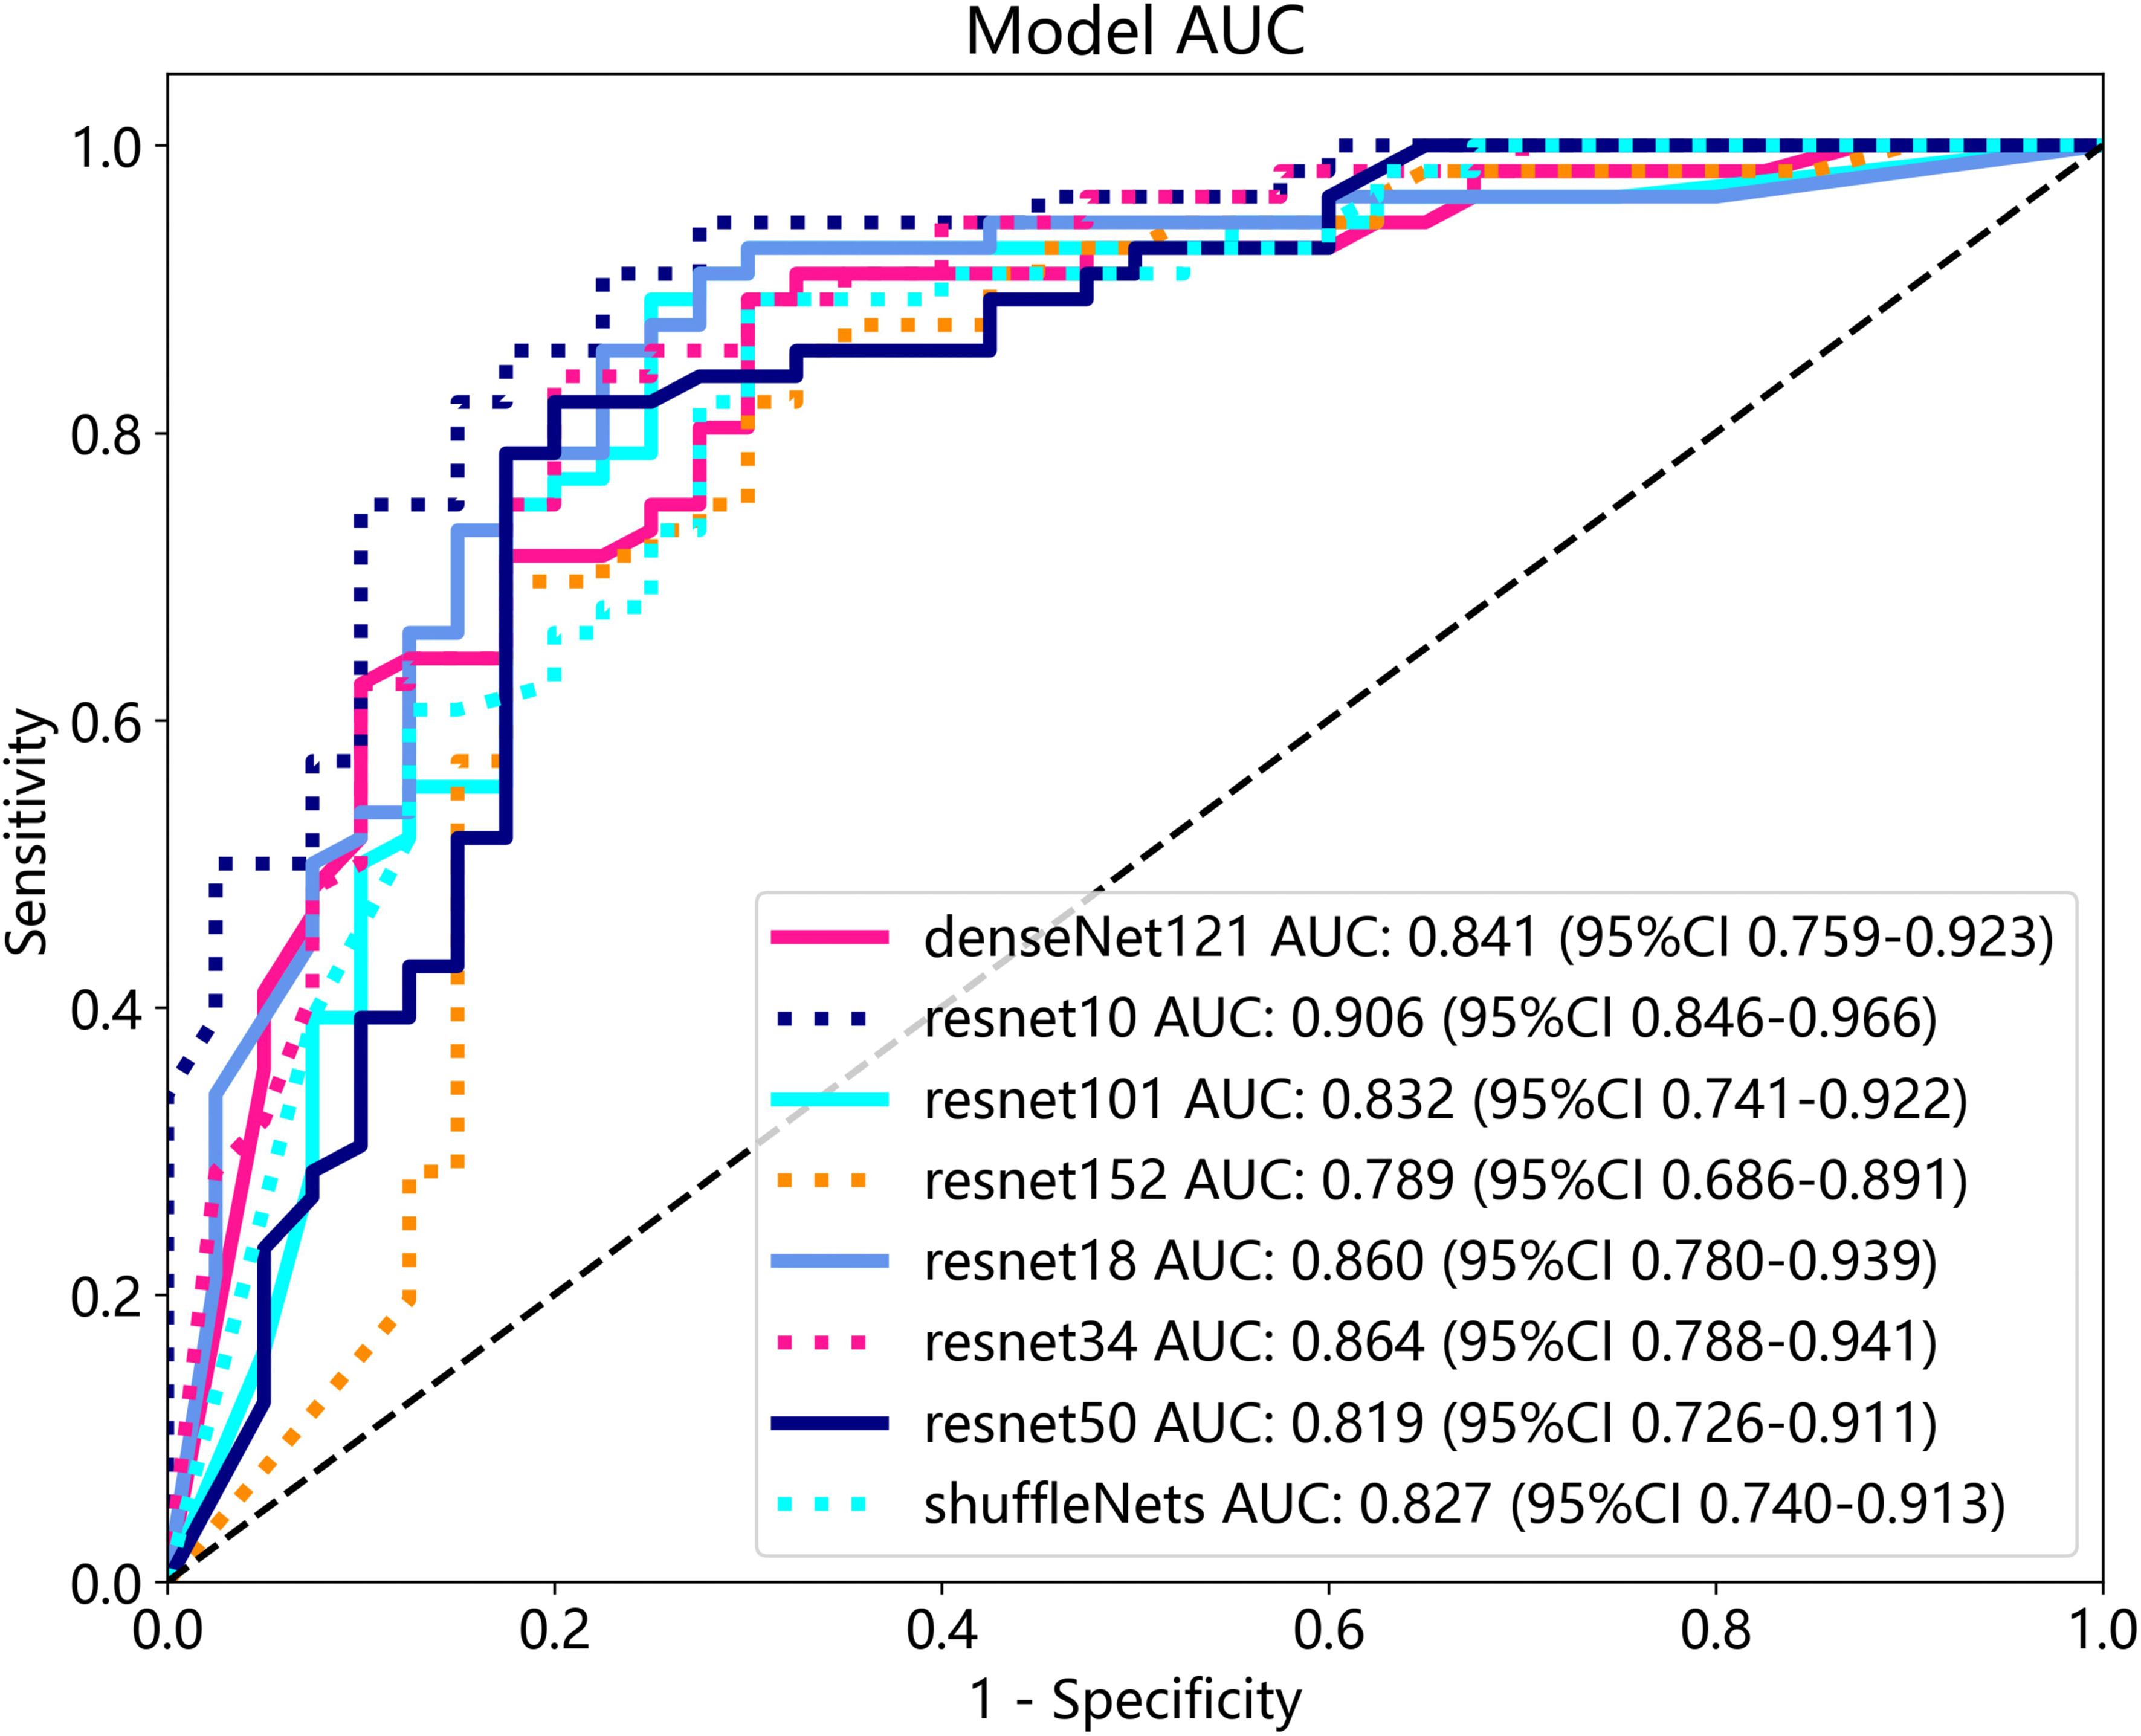
Figure 5 Effectiveness of 3D deep learning models in test group.
Extraction and efficiency of 2D transfer learning
ResNet152, the most potent model in the arena of 2D deep learning, was identified as the top choice for feature extraction in the domain of 2D deep transfer learning based on the results of the previous step. In the testing group, the SVM model showcased the best performance. The accuracy of this model in the test group is 0.854, and the AUC is 0.880. Table 7 and Figure 2D displays the performance of these features.
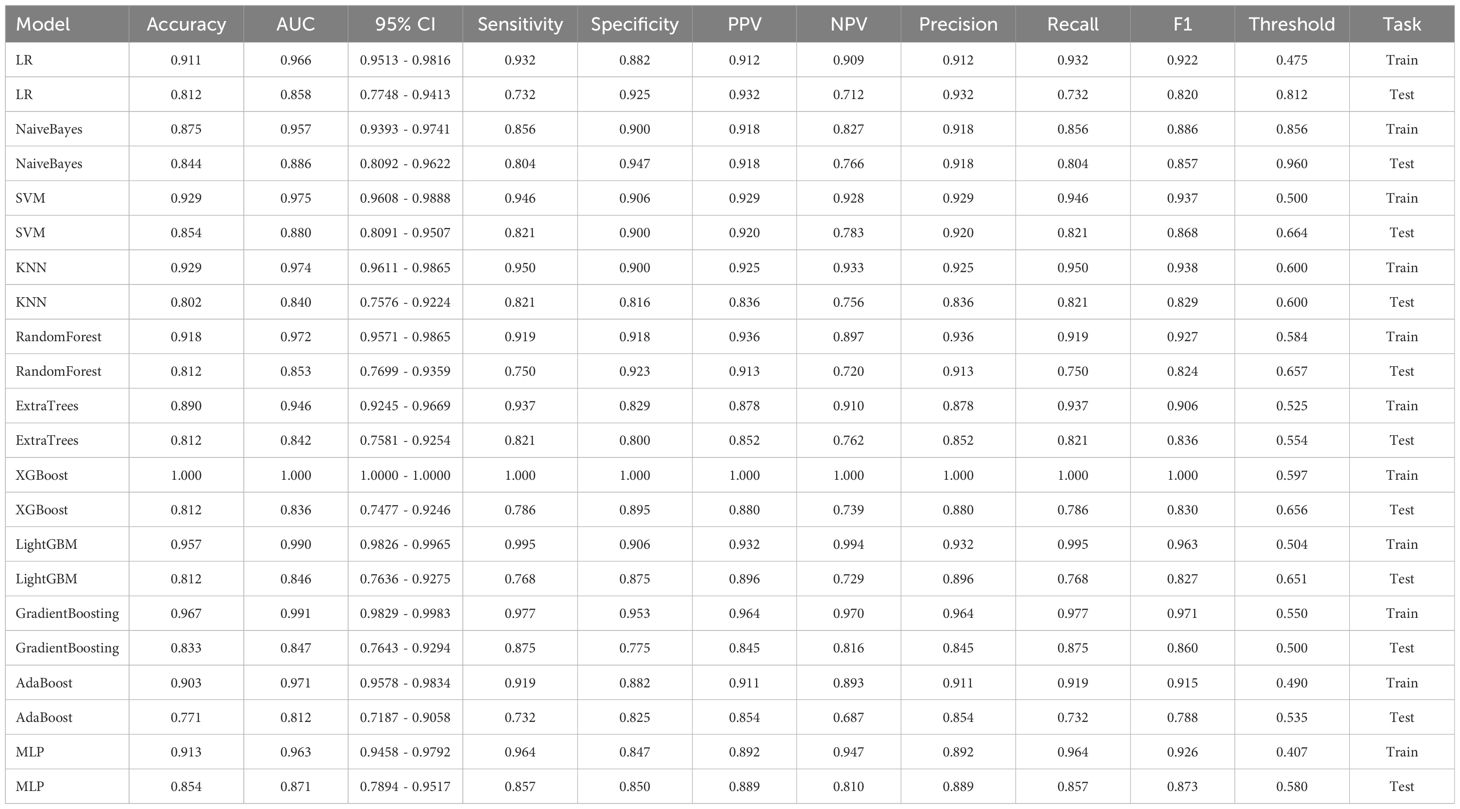
Table 7 Effectiveness of 2D transfer learning.
Extraction and efficiency of 3D transfer learning
ResNet10, the most potent model in the arena of 3D deep learning, was identified as the top choice for feature extraction in the domain of 3D deep transfer learning based on previous research findings. In the testing group, the MLP model showcased the best performance. The accuracy of this model in the test group is 0.740, and the AUC is 0.737. Table 8 and Figure 2E displays the performance of these features.
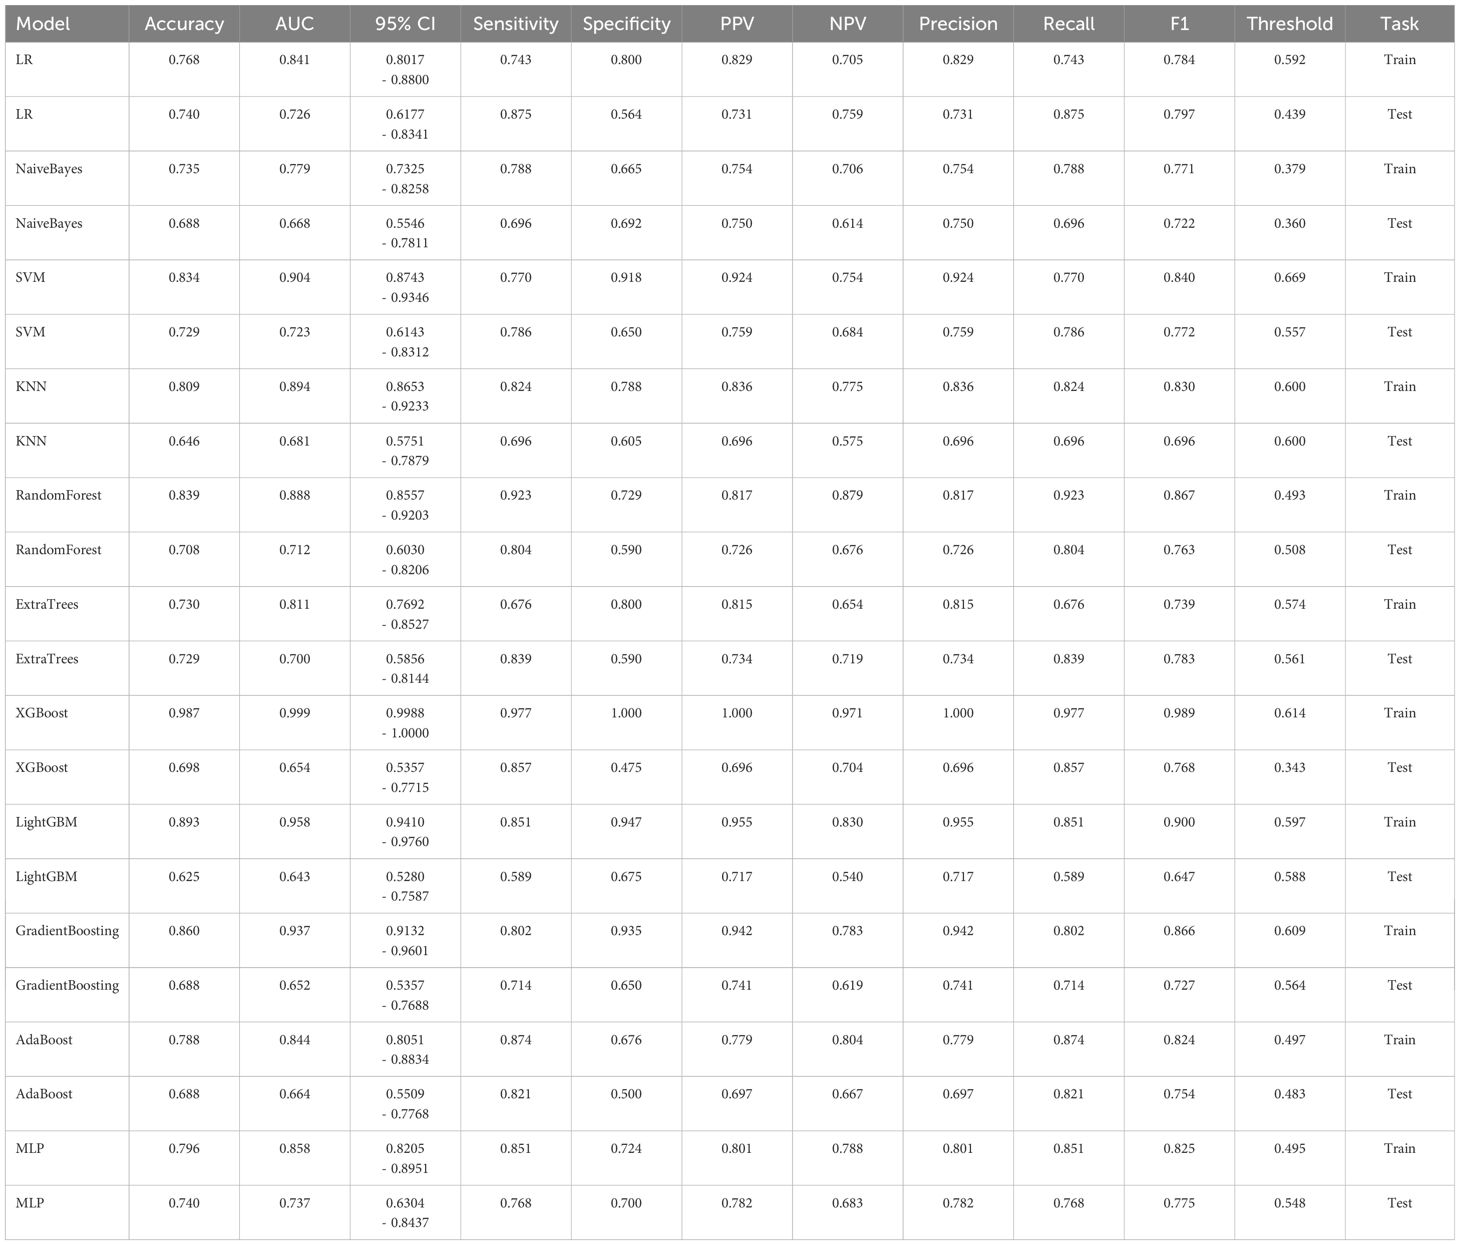
Table 8 Effectiveness of 3D transfer learning.
Comparison of the effectiveness of screening osteoporosis
Table 9 presents the comparison of the effectiveness of various features in screening for osteoporosis among machine learning models. In the LR and AdaBoost models, the radiomics features were found to be more effective in screening for osteoporosis compared to clinical features. However, in the other models, there was no statistically significant difference between the effectiveness of the two feature types. On the other hand, the effectiveness of 3D transfer learning model was not superior to clinical and radiomics features in any of the models. Furthermore, among all the models, the 2D transfer learning model were superior to clinical features in screening for osteoporosis. Additionally, the effectiveness of 2D transfer learning was found to be superior to 3D transfer learning in all models. Moreover, when considering the seven models (LR, NaiveBayes, SVM, KNN, LightGBM, GradientBoosting, and MLP), the effectiveness of 2D transfer learning model in screening for osteoporosis was superior to radiomics features.
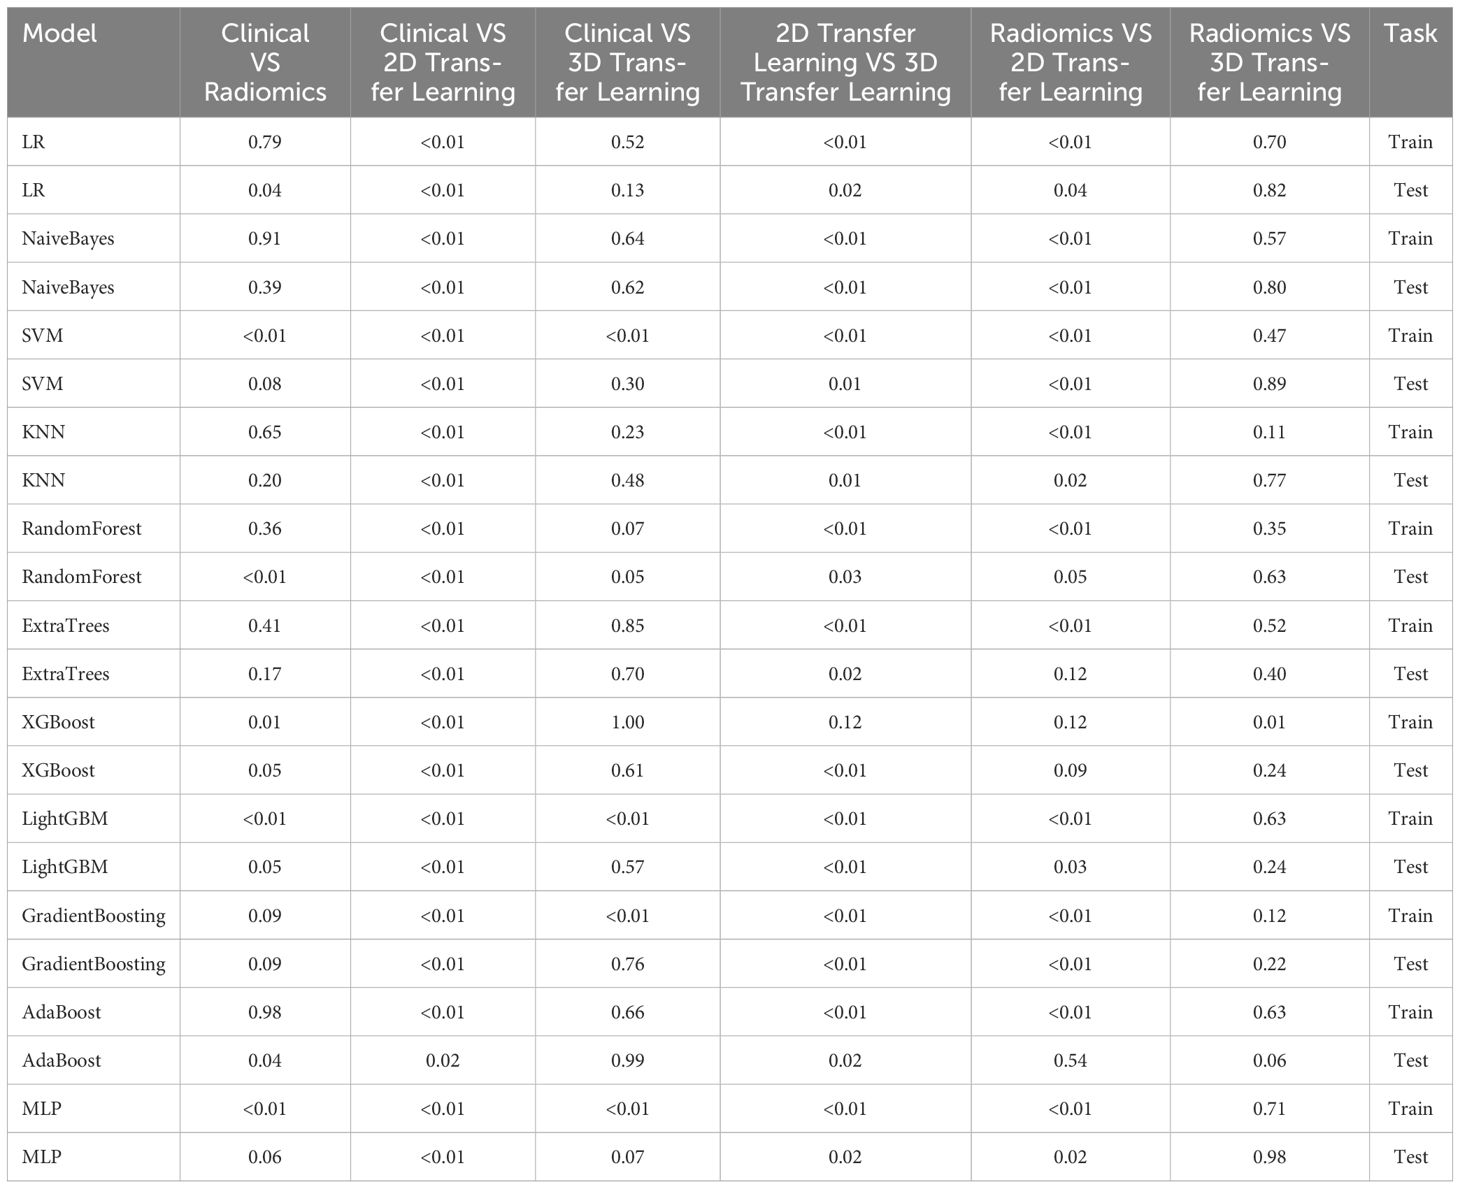
Table 9 Comparison of the effectiveness of screening osteoporosis through clinical models and radiomics, 2D deep learning features, and 3D deep learning features by Delong test.
Assessing the effectiveness of the optimal machine learning model and deep learning technology for osteoporosis screening
The optimal machine models for screening osteoporosis based on each feature were chosen as the reference for comparison with deep learning techniques. When utilizing clinical features for osteoporosis screening, the AdaBoost model demonstrates the highest performance. The LR model, on the other hand, shows the best performance when employing radiomics features for osteoporosis screening. For 2D transfer learning, the SVM model exhibits the most optimal performance, while for 3D transfer learning, the MLP model shows the highest performance. Among the various 2D deeplearning models, ResNet152 exhibited the most optimal performance. Among the various 3D deeplearning models, ResNet10 exhibited the most optimal performance. The comparison between these models is presented in Table 10. In the test group, the AUC (Area Under the Curve) did not show any significant difference between 2D deep learning and 3D deep learning methods. However, when compared to clinical models, radiomics models, and 3D transfer learning models, the AUC of 3D deep learning was significantly better. Interestingly, there was no statistical difference in AUC when comparing 3D deep learning with 2D transfer learning models. On the other hand, the AUC of 2D deep learning was superior to clinical models, but there was no statistically significant difference between the AUC of 2D deep learning and radiomics models or 2D transfer learning models or 3D transfer learning models.These results are presented in Table 10.
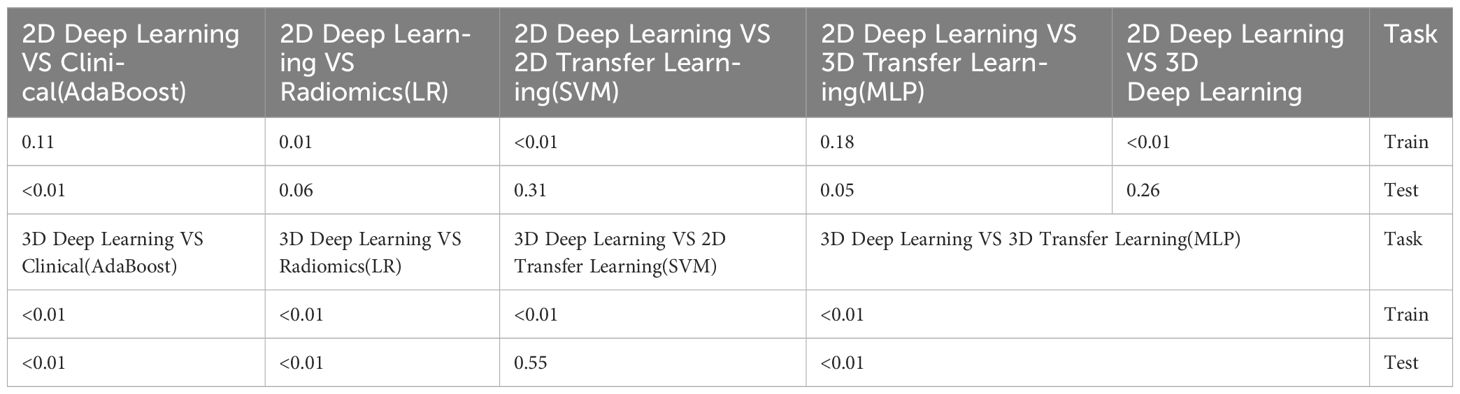
Table 10 Comparison of the optimal machine learning model and deep learning technology for osteoporosis screening by delong test.
Discussion
Our study provides initial evidence supporting the potential of using chest CT for osteoporosis screening. Moreover, we observed that deep learning technology, and transfer learning technology based on chest CT are more effective than bone transition biomarkers for screening osteoporosis. Typically, in a tertiary hospital in China, the cost of a chest CT examination is around $26, while a DXA examination costs approximately $23. On the other hand, a bone turnover marker examination is priced at around $48. Osteoporosis is a silent and widespread condition, making screening crucial for identifying potential patients early on (31). Our findings suggest that conducting bone turnover biomarker testing solely for the purpose of osteoporosis screening may not be necessary. On the other hand, chest CT scans serve multiple purposes such as lung tumor screening and exclusion of pneumonia (32). Elderly individuals and the female demographic, with a particular emphasis on Asian women, are disproportionately susceptible to lung cancer. Consequently, some experts advocate for the inclusion of chest CT scans as part of routine health screenings for these groups (33). Interestingly, our study also found a correlation between age, gender, and osteoporosis, which coincides with the population commonly advised to undergo regular chest CT examinations. Older age and female gender have been consistently identified as risk factors for osteoporosis in various studies (34). Specifically, postmenopausal women in the older age group are considered a high-risk population for this condition (35). Regular chest CT examinations are often recommended for individuals in this group (36). As DXA screening for osteoporosis has not been widely adopted due to limited awareness regarding the risks associated with osteoporosis (37), utilizing chest CT for osteoporosis screening can not only benefit potential patients but also help save a substantial amount of money for medical insurance funds. By combining osteoporosis screening with routine chest CT scans, we can effectively identify at-risk individuals and allocate resources more efficiently.
There are various reasons why bone turnover markers cannot be used for osteoporosis screening. In our study, we examined three different BTM as research subjects, which were vitamin D, TPINP, and β- Cross. Initially, in the univariate regression analysis, all three markers were found to have associations with the occurrence of osteoporosis. However, in the subsequent multivariable analysis, it was determined that only β- Cross showed a significant relationship with the occurrence of osteoporosis, along with the variables of age and gender. Sufficient levels of vitamin D have been shown to enhance the absorption of calcium and facilitate the process of bone mineralization (38). Vitamin D deficiency is a prevalent issue that warrants attention, and it is not limited to individuals with osteoporosis (39). Furthermore, many osteoporosis patients are already receiving vitamin D supplementation as part of their treatment, which can elevate their blood levels of vitamin D. Consequently, this can potentially hinder the diagnostic effectiveness of using vitamin D as a marker for osteoporosis. TPINP primarily indicates bone metabolism and can be utilized to assess the effectiveness of anti-osteoporosis treatments (40). It is important to note that osteoporosis can arise from both bone metabolism abnormalities and bone loss (41). However, not all individuals with osteoporosis will exhibit significant disruptions in bone metabolism. This might explain why TPINP cannot always accurately determine the presence of osteoporosis in patients. β- Cross is a marker that indicates the level of bone resorption activity by osteoclasts (42). It is widely recognized as the most effective bone turnover marker for identifying the presence of osteoporosis in patients (43). In our research, β- Cross is believed to indicate the occurrence of osteoporosis and constitutes a clinical model with two variables: gender and age. However, the clinical efficacy of this model is not entirely satisfactory, with an accuracy of 0.698 and an AUC of 0.665.
However, the imaging features obtained through chest CT imaging greatly improve the accuracy of identifying osteoporosis. This also provides a preliminary screening for the presence of osteoporosis for patients who undergo regular chest CT examinations. The first features to be used were extracted through radiomics methods. As a newly developed technology, computed tomography (CT) radiomics has the ability to identify radiomic features that are challenging to recognize visually. This advanced approach offers a convenient, comprehensive, and accurate method for diagnosing osteoporosis (44). In our study, the radiomics model demonstrated an accuracy of 0.750 and an AUC of 0.739 for recognizing osteoporosis, the 95% confidence interval is 0.6321–0.8456. Compared to clinical models, radiomics models have shown better potential for osteoporosis screening in some machine learning models. However, compared to other previous studies, such as using HU values on chest CT to screen for osteoporosis with accuracy and AUC of 0.831 and 0.972 (45), the effectiveness of using chest CT radiomics technology to screen for osteoporosis in this study is still unsatisfactory.
Deep learning technology has emerged as a valuable tool for the diagnosis of osteoporosis, with numerous studies demonstrating its effectiveness (46). In our study, we employed a combination of 2D and 3D deep learning models to screen for osteoporosis using chest CT scans. Specifically, we utilized 24 widely used 2D deep learning models and 8 commonly used 3D deep learning models. The effectiveness of 2D and 3D deep learning models based on chest CT scans in screening for osteoporosis is significantly improved compared to clinical models that rely on bone turnover markers. While there was no statistically significant difference in performance between 2D and 3D deep learning models in the test group, it was observed that the 3D deep learning model outperformed radiomics models in terms of performance. The method of extracting 2D transfer learning has been proven to improve the effectiveness of disease prediction (47). In our study, the 2D transfer learning model showed good performance, with an accuracy of 0.854 and an AUC of 0.880. However, it is worth noting that the 3D transfer learning model did not demonstrate a better AUC (Area Under the Curve), possibly due to the overfitting phenomenon caused by the recognition of excessive image information by the extracted 3D deep learning model (47). The development of enhanced deep learning models based on 3D medical images holds the potential to further improve this phenomenon. Although 2D transfer learning models demonstrate better AUC when compared to standard 2D deep learning models, they do not significantly outperform 3D deep learning models. Therefore, researchers suggest that both 3D deep learning technology and 2D transfer learning technology should be prioritized when utilizing chest CT scans for osteoporosis screening.
Recognizing several limitations of this study is of utmost importance. Firstly, the absence of external validation is a noteworthy concern and should be given priority in future research efforts. Secondly, it is worth noting that the ROI delineation utilized in this study employed a combination of manual and semi-automatic methods.
In conclusion, our study indicates that bone turnover markers may not be necessary for osteoporosis screening. Instead, a combination of 3D deep learning and 2D transfer learning techniques based on chest CT scans can be considered as effective alternatives for osteoporosis screening.
Data availability statement
The datasets presented in this study can be found in online repositories. The names of the repository/repositories and accession number(s) can be found in the article/supplementary material.
Ethics statement
The studies involving humans were approved by The Second Affiliated Hospital of Fujian Medical University. The studies were conducted in accordance with the local legislation and institutional requirements. Written informed consent for participation was not required from the participants or the participants’ legal guardians/next of kin in accordance with the national legislation and institutional requirements. Written informed consent was not obtained from the individual(s) for the publication of any potentially identifiable images or data included in this article because This is a retrospective study. After application, the ethics committee agreed to cancel informed consent, but the patient’s privacy was protected.
Author contributions
KF: Writing – original draft. XZ: Software, Writing – original draft. XL: Data curation, Writing – review & editing. ZD: Writing – review & editing.
Funding
The author(s) declare that no financial support was received for the research, authorship, and/or publication of this article.
Conflict of interest
The authors declare that the research was conducted in the absence of any commercial or financial relationships that could be construed as a potential conflict of interest.
Publisher’s note
All claims expressed in this article are solely those of the authors and do not necessarily represent those of their affiliated organizations, or those of the publisher, the editors and the reviewers. Any product that may be evaluated in this article, or claim that may be made by its manufacturer, is not guaranteed or endorsed by the publisher.
References
1. Brown JP, Don-Wauchope A, Douville P, Albert C, Vasikaran SD. Current use of bone turnover markers in the management of osteoporosis. Clin Biochem. (2022) 109–110:1–10. doi: 10.1016/j.clinbiochem.2022.09.002
2. Vasikaran S, Eastell R, Bruyère O, Foldes AJ, Garnero P, Griesmacher A, et al. Markers of bone turnover for the prediction of fracture risk and monitoring of osteoporosis treatment: a need for international reference standards. Osteoporos Int. (2011) 22:391–420. doi: 10.1007/s00198-010-1501-1
3. Lane NE. Epidemiology, etiology, and diagnosis of osteoporosis. Am J Obstet Gynecol. (2006) 194:S3–11. doi: 10.1016/j.ajog.2005.08.047
4. Eastell R, Szulc P. Use of bone turnover markers in postmenopausal osteoporosis. Lancet Diabetes Endocrinol. (2017) 5:908–23. doi: 10.1016/S2213-8587(17)30184-5
5. Carlson BB, Salzmann SN, Shirahata T, Ortiz Miller C, Carrino JA, Yang J, et al. Prevalence of osteoporosis and osteopenia diagnosed using quantitative CT in 296 consecutive lumbar fusion patients. Neurosurg Focus. (2020) 49:E5. doi: 10.3171/2020.5.FOCUS20241
6. Helmrich G. Screening for osteoporosis. Clin Obstet Gynecol. (2013) 56:659–66. doi: 10.1097/GRF.0b013e3182a99814
7. Guerrini S, Del Roscio D, Zanoni M, Cameli P, Bargagli E, Volterrani L, et al. Lung cancer imaging: screening result and nodule management. Int J Environ Res Public Health. (2022) 19:2460. doi: 10.3390/ijerph19042460
8. Mayerhoefer ME, Materka A, Langs G, Häggström I, Szczypiński P, Gibbs P, et al. Introduction to radiomics. J Nucl Med. (2020) 61:488–95. doi: 10.2967/jnumed.118.222893
9. Binczyk F, Prazuch W, Bozek P, Polanska J. Radiomics and artificial intelligence in lung cancer screening. Transl Lung Cancer Res. (2021) 10:1186–99. doi: 10.21037/tlcr
10. Jiang YW, Xu XJ, Wang R, Chen CM. Radiomics analysis based on lumbar spine CT to detect osteoporosis. Eur Radiol. (2022) 32:8019–26. doi: 10.1007/s00330–022-08805–4
11. Wang H, Pujos-Guillot E, Comte B, de Miranda JL, Spiwok V, Chorbev I, et al. Deep learning in systems medicine. Brief Bioinform. (2021) 22:1543–59. doi: 10.1093/bib/bbaa237
12. Zhang B, Yu K, Ning Z, Wang K, Dong Y, Liu X, et al. Deep learning of lumbar spine X-ray for osteopenia and osteoporosis screening: A multicenter retrospective cohort study. Bone. (2020) 140:115561. doi: 10.1016/j.bone.2020.115561
13. Kim HE, Cosa-Linan A, Santhanam N, Jannesari M, Maros ME, Ganslandt T. Transfer learning for medical image classification: a literature review. BMC Med Imaging. (2022) 22:69. doi: 10.1186/s12880-022-00793-7
14. Chen Q, Li D, Tang CK. KNN matting. IEEE Trans Pattern Anal Mach Intell. (2013) 35:2175–88. doi: 10.1109/TPAMI.2013.18
15. Alderden J, Pepper GA, Wilson A, Whitney JD, Richardson S, Butcher R, et al. Predicting pressure injury in critical care patients: A machine-learning model. Am J Crit Care. (2018) 27:461–8. doi: 10.4037/ajcc2018525
16. Shtar G, Rokach L, Shapira B, Nissan R, Hershkovitz A. Using machine learning to predict rehabilitation outcomes in postacute hip fracture patients. Arch Phys Med Rehabil. (2021) 102:386–94. doi: 10.1016/j.apmr.2020.08.011
17. Gan L. XGBoost-based E-commerce customer loss prediction. Comput Intell Neurosci. (2022) 2022:1858300. doi: 10.1155/2022/1858300
18. Liao H, Zhang X, Zhao C, Chen Y, Zeng X, Li H. LightGBM: an efficient and accurate method for predicting pregnancy diseases. J Obstet Gynaecol. (2022) 42:620–9. doi: 10.1080/01443615.2021.1945006
20. Keshvari S, Farizhendi SA, Ghiasi MM, Mohammadi AH. AdaBoost metalearning methodology for modeling the incipient dissociation conditions of clathrate hydrates. ACS Omega. (2021) 6:26919–31. doi: 10.1021/acsomega.1c03214
21. Xu Y, Ju L, Tong J, Zhou CM, Yang JJ. Machine learning algorithms for predicting the recurrence of stage IV colorectal cancer after tumor resection. Sci Rep. (2020) 10:2519. doi: 10.1038/s41598-020-59115-y
22. Christodoulou E, Ma J, Collins GS, Steyerberg EW, Verbakel JY, Van Calster B. A systematic review shows no performance benefit of machine learning over logistic regression for clinical prediction models. J Clin Epidemiol. (2019) 110:12–22. doi: 10.1016/j.jclinepi.2019.02.004
23. Kwon K, Kim D, Park H. A parallel MR imaging method using multilayer perceptron. Med Phys. (2017) 44:6209–24. doi: 10.1002/mp.12600
24. Rajasekaran S, Kanna RM, Schnake KJ, Vaccaro AR, Schroeder GD, Sadiqi S, et al. Osteoporotic thoracolumbar fractures-how are they different?-classification and treatment algorithm. J Orthop Trauma. (2017) 31 Suppl 4:S49–56. doi: 10.1097/BOT.0000000000000949
25. Yushkevich PA, Piven J, Hazlett HC, Smith RG, Ho S, Gee JC, et al. User-guided 3D active contour segmentation of anatomical structures: Significantly improved efficiency and reliability. Neuroimage. (2006) 31:1116–28. doi: 10.1016/j.neuroimage.2006.01.015
27. Martínez-Camblor P, Pérez-Fernández S, Díaz-Coto S. The area under the generalized receiver-operating characteristic curve. Int J Biostat. (2021) 18:293–306. doi: 10.1515/ijb-2020-0091
28. Cui Y, Peng L. Assessing dynamic covariate effects with survival data. Lifetime Data Anal. (2022) 28:675–99. doi: 10.1007/s10985–022-09571–7
29. Neuhäuser M. Wilcoxon test after Levene's transformation can have an inflated Type I error rate. Psychol Rep. (2004) 94:1419–20. doi: 10.2466/pr0.94.3c.1419-1420
30. Demler OV, Pencina MJ, D'Agostino RB Sr. Misuse of DeLong test to compare AUCs for nested models. Stat Med. (2012) 31:2577–87. doi: 10.1002/sim.5328
31. Caliri A, De Filippis L, Bagnato GL, Bagnato GF. Osteoporotic fractures: mortality and quality of life. Panminerva Med. (2007) 49:21–7. doi: 10.1111/j.1526-4637.2006.00140.x
32. Adams SJ, Stone E, Baldwin DR, Vliegenthart R, Lee P, Fintelmann FJ. Lung cancer screening. Lancet. (2023) 401:390–408. doi: 10.1016/S0140-6736(22)01694-4
33. Wang M, Lin S, He N, Yang C, Zhang R, Liu X, et al. The introduction of low-dose CT imaging and lung cancer overdiagnosis in chinese women. Chest. (2023) 163:239–50. doi: 10.1016/j.chest.2022.08.2207
34. LeBoff MS, Greenspan SL, Insogna KL, Lewiecki EM, Saag KG, Singer AJ, et al. The clinician's guide to prevention and treatment of osteoporosis. Osteoporos Int. (2022) 33:2049–102. doi: 10.1007/s00198-021-05900-y
35. Baccaro LF, Conde DM, Costa-Paiva L, Pinto-Neto AM. The epidemiology and management of postmenopausal osteoporosis: a viewpoint from Brazil. Clin Interv Aging. (2015) 10:583–91. doi: 10.2147/CIA
36. Manser R, Lethaby A, Irving LB, Stone C, Byrnes G, Abramson MJ, et al. Screening for lung cancer. Cochrane Database Syst Rev. (2013) 2013:CD001991. doi: 10.1002/14651858
37. Oumer KS, Liu Y, Yu Q, Wu F, Yang S. Awareness of osteoporosis among 368 residents in China: a cross-sectional study. BMC Musculoskelet Disord. (2020) 21:197. doi: 10.1186/s12891-020-03217-1
38. Reid IR, Bolland MJ, Grey A. Effects of vitamin D supplements on bone mineral density: a systematic review and meta-analysis. Lancet. (2014) 383:146–55. doi: 10.1016/S0140-6736(13)61647-5
39. Holick MF. The vitamin D deficiency pandemic: Approaches for diagnosis, treatment and prevention. Rev Endocr Metab Disord. (2017) 18:153–65. doi: 10.1007/s11154-017-9424-1
40. Krege JH, Lane NE, Harris JM, Miller PD. PINP as a biological response marker during teriparatide treatment for osteoporosis. Osteoporos Int. (2014) 25:2159–71. doi: 10.1007/s00198-014-2646-0
41. Yuan Y, Zhang P, Tian W, Deng X, Yue R, Ge X, et al. Application of bone turnover markers and DXA and QCT in an elderly Chinese male population. Ann Palliat Med. (2021) 10:6351–8. doi: 10.21037/apm
42. Vasikaran SD, Miura M, Pikner R, Bhattoa HP, Cavalier E. IOF-IFCC joint committee on bone metabolism (C-BM). Practical considerations for the clinical application of bone turnover markers in osteoporosis. Calcif Tissue Int. (2023) 112:148–57. doi: 10.1007/s00223-021-00930-4
43. Qu XL, Zheng B, Chen TY, Cao ZR, Qu B, Jiang T. Bone turnover markers and bone mineral density to predict osteoporotic fractures in older women: A retrospective comparative study. Orthop Surg. (2020) 12:116–23. doi: 10.1111/os.12596
44. Wang J, Zhou S, Chen S, He Y, Gao H, Yan L, et al. Prediction of osteoporosis using radiomics analysis derived from single source dual energy CT. BMC Musculoskelet Disord. (2023) 24:100. doi: 10.1186/s12891-022-06096-w
45. Yang J, Liao M, Wang Y, Chen L, He L, Ji Y, et al. Opportunistic osteoporosis screening using chest CT with artificial intelligence. Osteoporos Int. (2022) 33:2547–61. doi: 10.1007/s00198-022-06491-y
46. Hong N, Cho SW, Shin S, Lee S, Jang SA, Roh S, et al. Deep-learning-based detection of vertebral fracture and osteoporosis using lateral spine X-ray radiography. J Bone Miner Res. (2023) 38:887–95. doi: 10.1002/jbmr.4814
Keywords: deep learning, osteoporosis, computed tomography, radiomics, transfer learning
Citation: Fang K, Zheng X, Lin X and Dai Z (2024) A comprehensive approach for osteoporosis detection through chest CT analysis and bone turnover markers: harnessing radiomics and deep learning techniques. Front. Endocrinol. 15:1296047. doi: 10.3389/fendo.2024.1296047
Received: 18 September 2023; Accepted: 22 May 2024;
Published: 04 June 2024.
Edited by:
Nicole Horwood, University of East Anglia, United KingdomReviewed by:
Bilgin Kadri Aribas, Bülent Ecevit University, TürkiyeWilliam Ian Duncombe Rae, University of New South Wales, Australia
Copyright © 2024 Fang, Zheng, Lin and Dai. This is an open-access article distributed under the terms of the Creative Commons Attribution License (CC BY). The use, distribution or reproduction in other forums is permitted, provided the original author(s) and the copyright owner(s) are credited and that the original publication in this journal is cited, in accordance with accepted academic practice. No use, distribution or reproduction is permitted which does not comply with these terms.
*Correspondence: Zhangsheng Dai, ZGFpemhhbmdzaGVuZzU2QGZqbXUuZWR1LmNu