 Shaima Albeloushi1
 Amal Hasan2
 Hossein Arefanian1
 Sardar Sindhu3
 Fatema Al-Rashed1
 Shihab Kochumon1
 Nermeen Abukhalaf3Texy Jacob1Steve Shenouda1
 Ashraf Al Madhoun3
 Fahd Al-Mulla2
 Rasheed Ahmad1*
- 1Immunology and Microbiology Department, Dasman Diabetes Institute, Dasman, Kuwait
- 2Translational Research Department, Dasman Diabetes Institute, Dasman, Kuwait
- 3Animal and Imaging Core Facility, Dasman Diabetes Institute, Dasman, Kuwait
Introduction: A high-fat/high-sucrose diet leads to adverse metabolic changes that affect insulin sensitivity, function, and secretion. The source of fat in the diet might inhibit or increase this adverse effect. Fish oil and cocoa butter are a significant part of our diets. Yet comparisons of these commonly used fat sources with high sucrose on pancreas morphology and function are not made. This study investigated the comparative effects of a fish oil-based high-fat/high-sucrose diet (Fish-HFDS) versus a cocoa butter-based high-fat/high-sucrose diet (Cocoa-HFDS) on endocrine pancreas morphology and function in mice.
Methods: C57BL/6 male mice (n=12) were randomly assigned to dietary intervention either Fish-HFDS (n=6) or Cocoa-HFDS (n=6) for 22 weeks. Intraperitoneal glucose and insulin tolerance tests (IP-GTT and IP-ITT) were performed after 20-21 weeks of dietary intervention. Plasma concentrations of c-peptide, insulin, glucagon, GLP-1, and leptin were measured by Milliplex kit. Pancreatic tissues were collected for immunohistochemistry to measure islet number and composition. Tissues were multi-labelled with antibodies against insulin and glucagon, also including expression on Pdx1-positive cells.
Results and discussion: Fish-HFDS-fed mice showed significantly reduced food intake and body weight gain compared to Cocoa-HFDS-fed mice. Fish-HFDS group had lower fasting blood glucose concentration and area under the curve (AUC) for both GTT and ITT. Plasma c-peptide, insulin, glucagon, and GLP-1 concentrations were increased in the Fish-HFDS group. Interestingly, mice fed the Fish-HFDS diet displayed higher plasma leptin concentration. Histochemical analysis revealed a significant increase in endocrine pancreas β-cells and islet numbers in mice fed Fish-HFDS compared to the Cocoa-HFDS group. Taken together, these findings suggest that in a high-fat/high-sucrose dietary setting, the source of the fat, especially fish oil, can ameliorate the effect of sucrose on glucose homeostasis and endocrine pancreas morphology and function.
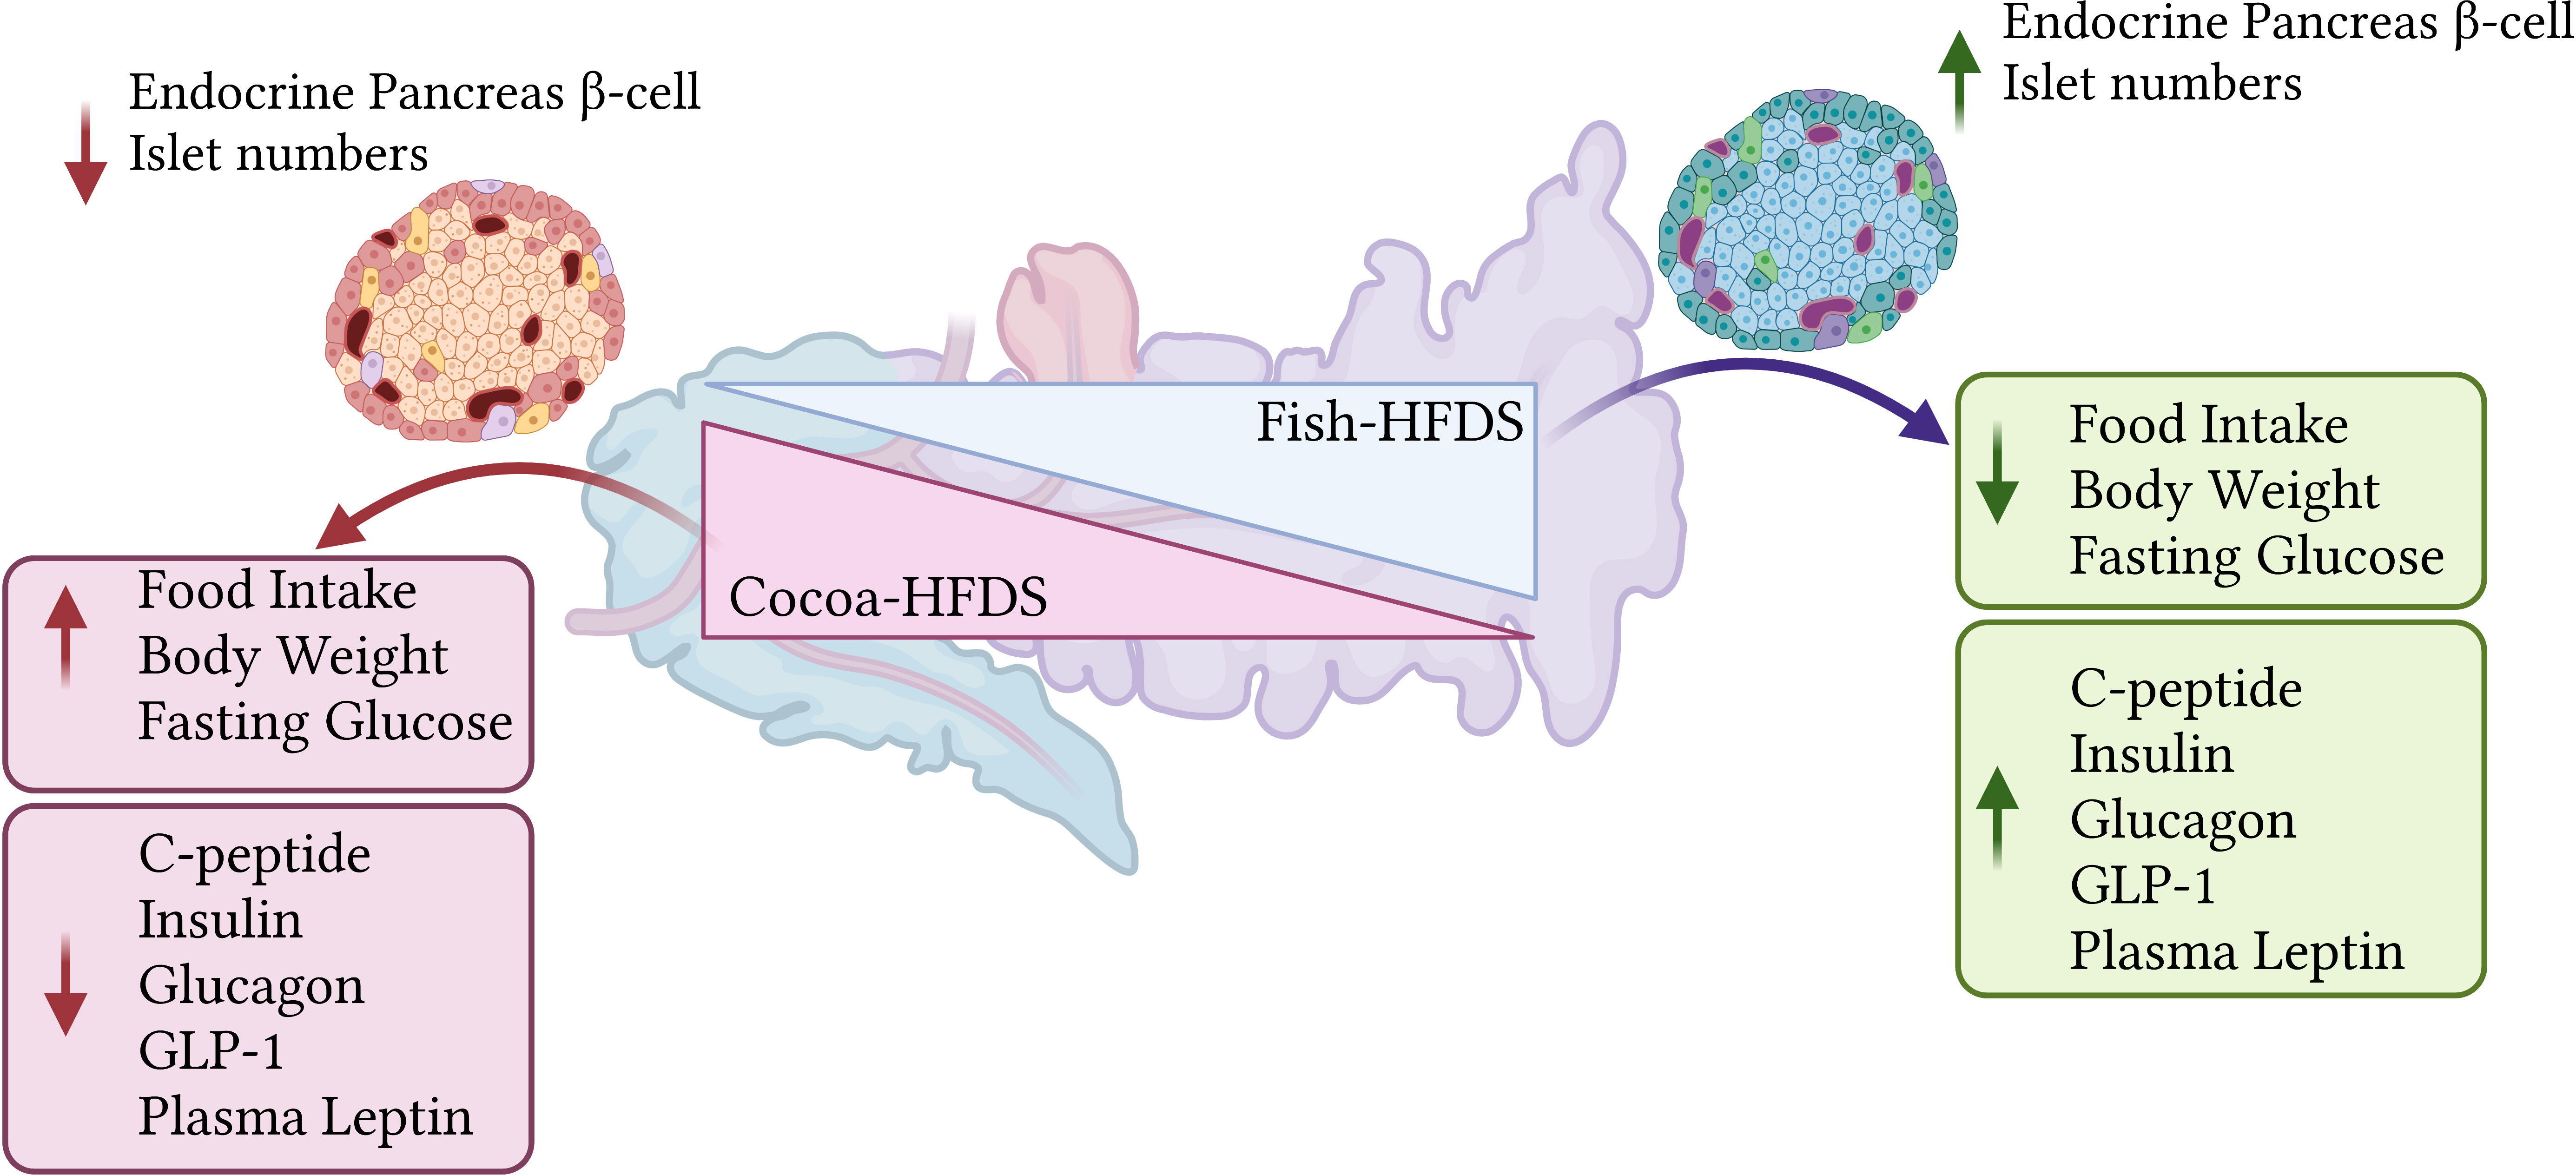
Graphical Abstract
1 Introduction
The macronutrients in the diet play an important role in developing metabolic syndrome (1). It has been found that excessive consumption of fat and sugar (a high-energetic diet) is a risk factor for metabolic diseases, and the quality and quantity of ingested dietary components are directly correlated with obesity and diabetes (2, 3). High fat and sugar diet impairs peripheral glucose transport, which is associated with obesity and insulin resistance (4). Type 2 diabetes is commonly associated with impairments in insulin sensitivity and secretion. Macronutrient composition of the diet determines the quality of insulin action (5, 6).
In vivo, dietary factors such as high-fat or high-sucrose diets impair insulin action (1, 5–7). Using a model of insulin resistance (8, 9), studies have shown that a high-fat/high-sucrose diet is associated with impaired glucose-stimulated insulin secretion (GSIS) that might affect pancreatic β-cells (10). Long-term exposure to high quantities of fat can lead to β-cell dysfunction (8). Indeed, a high-fat diet has been shown to reduce GSIS despite an absolute increase in the islet insulin content (3). Moreover, diets rich in saturated fatty acids play a role in obesity and insulin resistance (11). However, the type of dietary fat affects the endocrine pancreas function and morphology (12), as well as insulin secretion and sensitivity (7), and is associated with obesity and metabolic disease (11). Similarly, animals fed a high sucrose diet show deleterious effects on glucose homeostasis. Rats fed a high sucrose diet for an extended period developed hyperglycemia and insulin resistance (13, 14), while mice fed high sucrose diet developed glucose intolerance and impaired insulin secretion (9).
Various studies have emphasized the beneficial effects of dietary fish oil and its protective role against metabolic diseases. Dietary fish oil can improve or reverse dyslipidemia, adiposity, β-cell dysfunction, insulin secretion, and insulin action on glucose metabolism (1, 8, 14, 15). A high-fish oil diet has been shown to attenuate obesity and related systemic effects such as insulin resistance (11). In addition, supplementation of a high-fat/high-sucrose diet with fish oil restores glucose homeostasis and insulin sensitivity without changing plasma insulin concentration (1, 14, 16). Furthermore, fish oil supplementation can improve islet and β-cell hypertrophy with the amelioration of insulin resistance (17).
In the present study, we aimed to compare the effects of distinct dietary source of high fat (fish oil versus cocoa butter) in the context of a high-fat/high-sucrose diet on glucose tolerance, insulin resistance and secretion, and endocrine pancreas morphology in mice.
2 Research design and methods
2.1 Experimental design
The study was approved by the Animal Care and Ethics Committee of the Dasman Diabetes Institute and registered under the identifier RA AM 2016-007. All experiments were conducted in accordance with the National Institutes of Health guidelines for the care and use of laboratory animals.
C57BL/6 mice were purchased from the Jackson Laboratory (Bar Harbor, Maine, USA) and housed in a temperature-controlled environment (23°C) with a relative humidity of 50–60% under 12 h/12 h light/dark cycles. Mice were provided with a standard chow diet and water ad libitum.
At 8–10 weeks of age, 12 male mice were randomly assigned to one of two calorie-equivalent diets containing high sucrose and 45% fat as either fish oil-based high-fat/high-sucrose diet (Fish-HFDS; D21042007i, Research Diets Inc, USA) or cocoa butter-based high-fat/high-sucrose diet (Cocoa-HFDS; D21042206i, Research Diets Inc, USA) (Table 1) (n = 6/group) and the animals were fed on these diets for 22 weeks. The body weights were measured prior to the diet intervention and weekly during the intervention, along with their food intake.
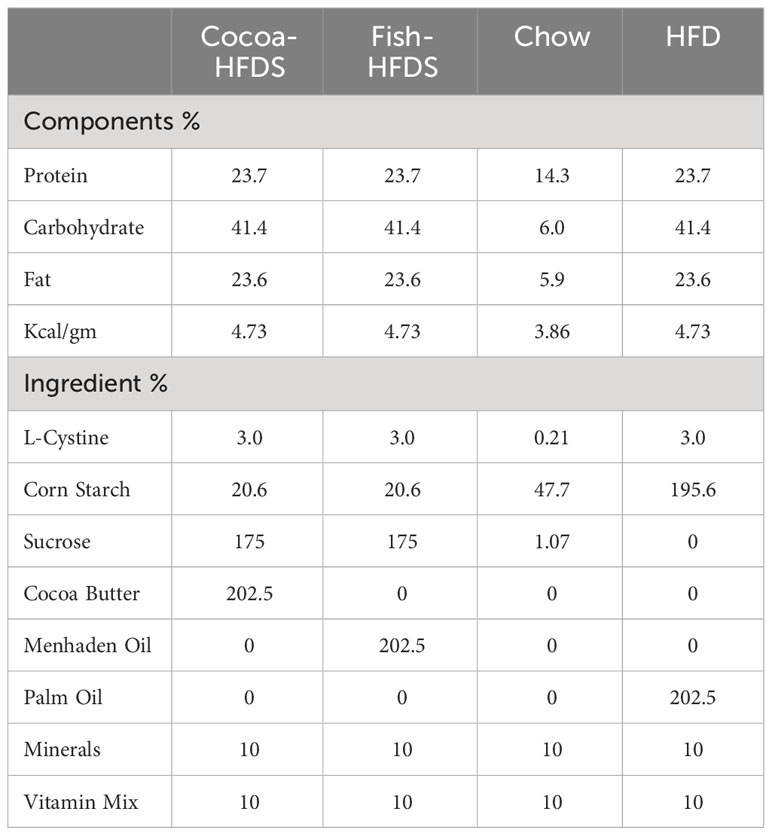
Table 1 Nutritional composition of HFDs.
2.2 Intraperitoneal glucose tolerance test
At 20 weeks of dietary intervention, mice were fasted overnight (12 hours) with free access to water. Fasting blood glucose concentration was measured at 0 minutes, and then, a bolus infusion of glucose (1 g/kg body weight) was administered IP to each mouse. Blood glucose concentrations were measured at 10, 20, 30, 60, 90, and 120 minutes post-glucose infusion using a portable glucometer (Accu-chek, Roche Diagnostic, Germany).
2.3 Insulin tolerance test
At 21 weeks of dietary intervention, mice were fasted for 4 hours, and a bolus infusion of insulin (0.8 U/kg body weight) was administered IP. Blood glucose concentrations were measured at 0, 10, 20, 30, 60, 90, and 120 minutes post-insulin infusion using a portable glucometer.
2.4 Organ/tissue collection
After 22 weeks of dietary intervention, the mice were euthanized. Organs were identified, removed, weighed, and selected tissues were preserved. The pancreas were fixed in 10% neutral buffered formalin for 24 hours and then stored in 70% ethanol at 4°C until processing. Blood samples were collected from the heart, and plasma was separated and stored at -80°C for further analysis.
2.5 Plasma metabolic markers
The concentrations of plasma metabolic markers were measured using a Milliplex kit (MILLIPLEX MAP mouse metabolic magnetic bead panel kit, Millipore, USA), in accordance with the manufacturer’s instructions.
2.6 Immunohistochemistry
The fixed pancreas was paraffin-embedded, and tissues were microsectioned by microtomy and labelled with multiple immunofluorescent antibodies, as previously described (18). Briefly, tissue samples on slides were deparaffinized and rehydrated, and then antigen retrieval was carried out. Samples were blocked with 10% goat serum and the following primary antibodies were used for each slide: guinea pig anti-insulin, rabbit anti-glucagon, rabbit anti-insulin and guinea pig anti-pdx1 antibodies. Secondary antibodies used were goat anti-guinea pig Alexa Flour 488 and goat anti-rabbit Alexa flour 546 antibodies (Table 2). The antibodies were visualized using an Olympus BX53 upright microscope connected to an Olympus DP73 camera (Olympus, Tokyo, Japan) and an inverted Zeiss LSM710 spectral confocal microscope (Carl Zeiss, Gottingen, Germany). Insulin- and glucagon-positive areas were digitally quantified using ImageJ (Fiji is just ImageJ version 2.9.0/1.53t, Maryland, USA).
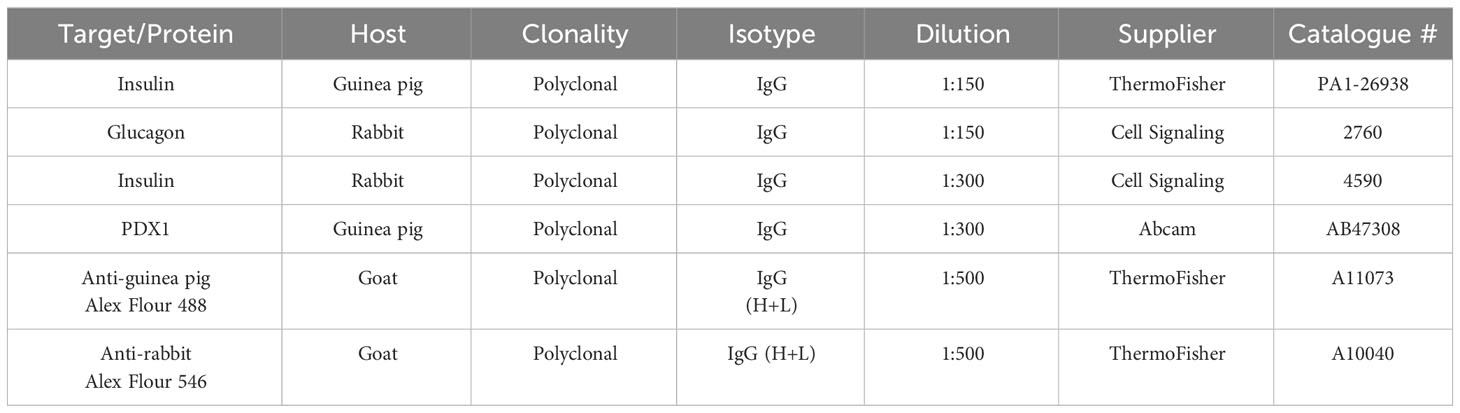
Table 2 Primary and secondary antibodies used insulin and glucagon staining.
2.7 Endocrine cell mass calculation
β-cells and α-cells were marked and calculated as areas positive for insulin and glucagon staining, respectively. The β-cell area is an area of both positive insulin area and β-cell numbers.
The α-cell mass was measured from the above equation (18), using glucagon positive area and α-cell numbers. The total islet cell area was calculated as a sum of the β-cell and α-cell areas per field of view.
2.8 Real-time quantitative RT-PCR
Total RNA was extracted from pancreatic tissues using RNeasy Mini Kit (Qiagen, Valencia, CA, USA) as per the manufacturer’s instructions. The cDNA was synthesized using 1 μg of total RNA using a high-capacity cDNA reverse transcription kit (Applied Biosystems, Foster City, CA, USA). Real-time PCR was performed on a QuantStudio™ 5 Real-Time PCR System (Applied Biosystems, Foster City, CA, USA) using an RT2 SYBR Green qPCR Mastermix (Qiagen, USA). Each reaction contained 50 ng cDNA that was amplified with primers specific to genes including Pdx1, Ins1, Mafa, Gcg, Mafb, and Gapdh (Table 3), selected from PrimerBank and primer blast website. The threshold cycle (Ct) values of the Pdx1 gene expression were normalized to the expression of housekeeping gene Gapdh and the expression of other endocrine gene markers was normalized to the expression of Pdx1 gene. The amounts of target mRNA relative to the control were calculated using the -2ΔΔCt-method. Relative mRNA expression was shown as a fold expression level over that of control expression.
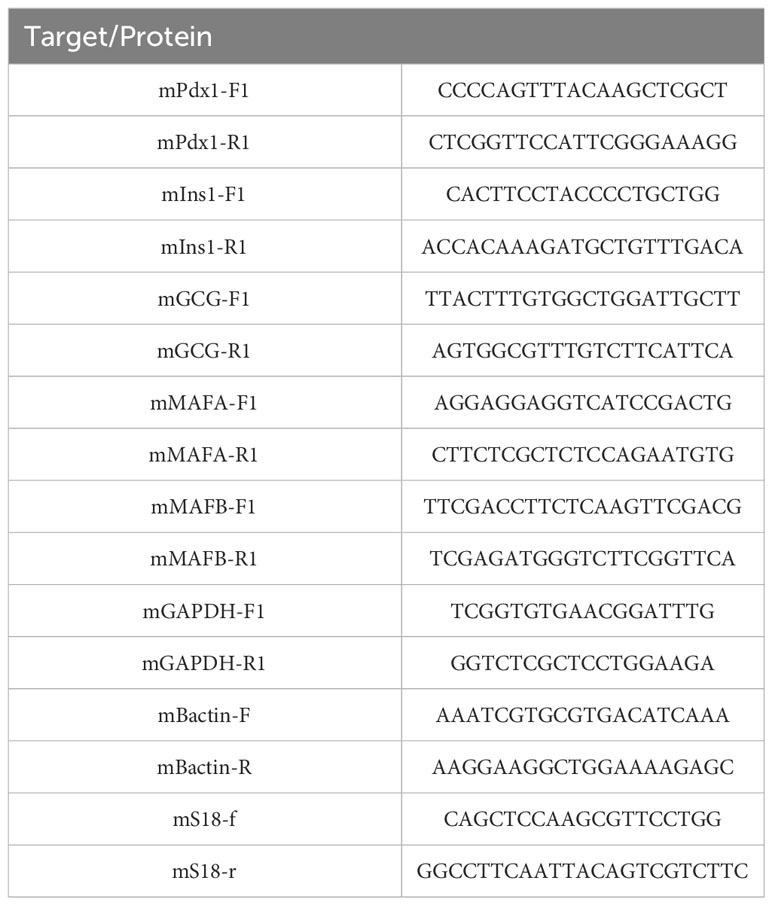
Table 3 List of primers.
2.9 Statistical analysis
Statistical analysis was conducted using JMP (version 17.0.0, SAS Institute Inc., North Carolina, USA) and GraphPad Prism (version 9.5.0, GraphPad Software, Inc., California, USA). Data were analyzed by two-way analysis of variance (ANOVA). Significant differences identified by ANOVA were followed by post hoc analysis student t-test. The area under the curve (AUC) for IP-GTT and ITT was calculated using the trapezoid rule. Pearson’s correlation was used to examine bivariate relationships, and the correlation coefficient (r) was calculated. P ≤ 0.05 was considered statistically significant. Results are reported as mean ± SEM values.
3 Results
3.1 Effect of fish-HFDS and cocoa-HFDS on food intake and weight gain
Bodyweight and food intake were monitored in both groups throughout the diet intervention. There was no significant difference in the starting body weight between Fish-HFDS and Cocoa-HFDS group (Figure 1A). However, after the dietary intervention, body weight of Cocoa-HFDS group was significantly (P = 0.0001) higher than that of Fish-HFDS group (Figure 1B). In fact, the Cocoa-HFDS group gained five times more weight than the Fish-HFDS group (Figure 1C). The Fish-HFDS group had significantly (P = 0.003) lower food intake compared to Cocoa-HFDS, which was consistent with the steady low increase in body weight (Figure 1D).
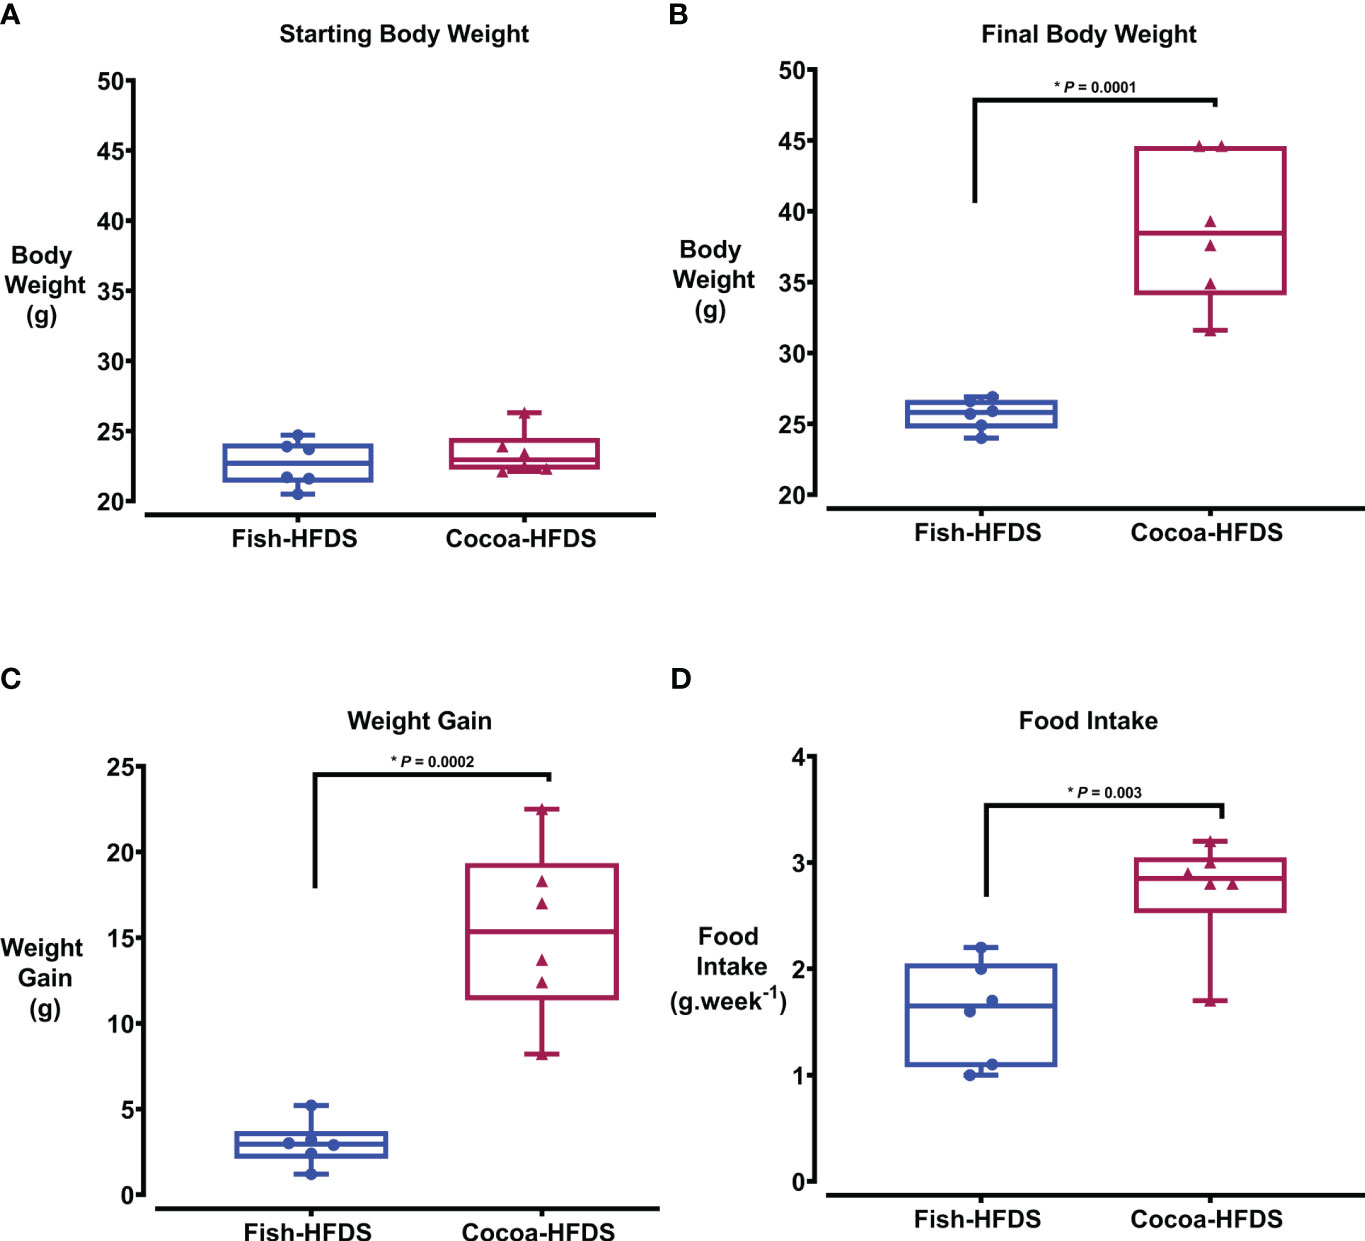
Figure 1 The Effect of different fat-based diets (Fish-HFDS and Cocoa-HFDS) on weight gain and food intake in mice. (A) The starting body weight of both groups. (B) The final body weight of both groups. (C) Weight gain after the diet intervention. (D) Food intake during the diet intervention. Data are mean with ± SEM. P-values for differences between groups by ANOVA and Student’s t-test.
3.2 Effect of fish-HFDS and cocoa-HFDS on glucose homeostasis and islet function
To investigate the effect of Fish-HFDS and Cocoa-HFDS on glucose homeostasis, IP-GTT and ITT were performed. The fasting blood glucose concentration was significantly (P < 0.0001) less in Fish-HFDS group (6.6 ± 0.3 mmol.L-1) compared to Cocoa-HFDS group (Figure 2A; Table 4). IP-GTT showed that clearance of plasma glucose concentration following intraperitoneal injection of glucose was significantly (P = 0.04) higher in mice fed Fish-HFDS compared to mice fed Cocoa-HFDS (Figure 2B). Furthermore, the improved glucose tolerance was reflected in the reduction of the AUC IP-GTT (462 ± 112 µg.L-1.min-1) (Figure 2C). Regarding ITT, the mice fed Fish-HFDS showed a greater reduction in blood glucose concentrations after intraperitoneal injection of insulin compared to mice fed Cocoa-HFDS (Figure 2D). Moreover, the increased insulin sensitivity in mice fed Fish-HFDS was displayed by the reduction of the AUC ITT (327 ± 35 µg.L-1.min-1, P = 0.0006) compared to mice fed Cocoa-HFDS (Figure 2E).
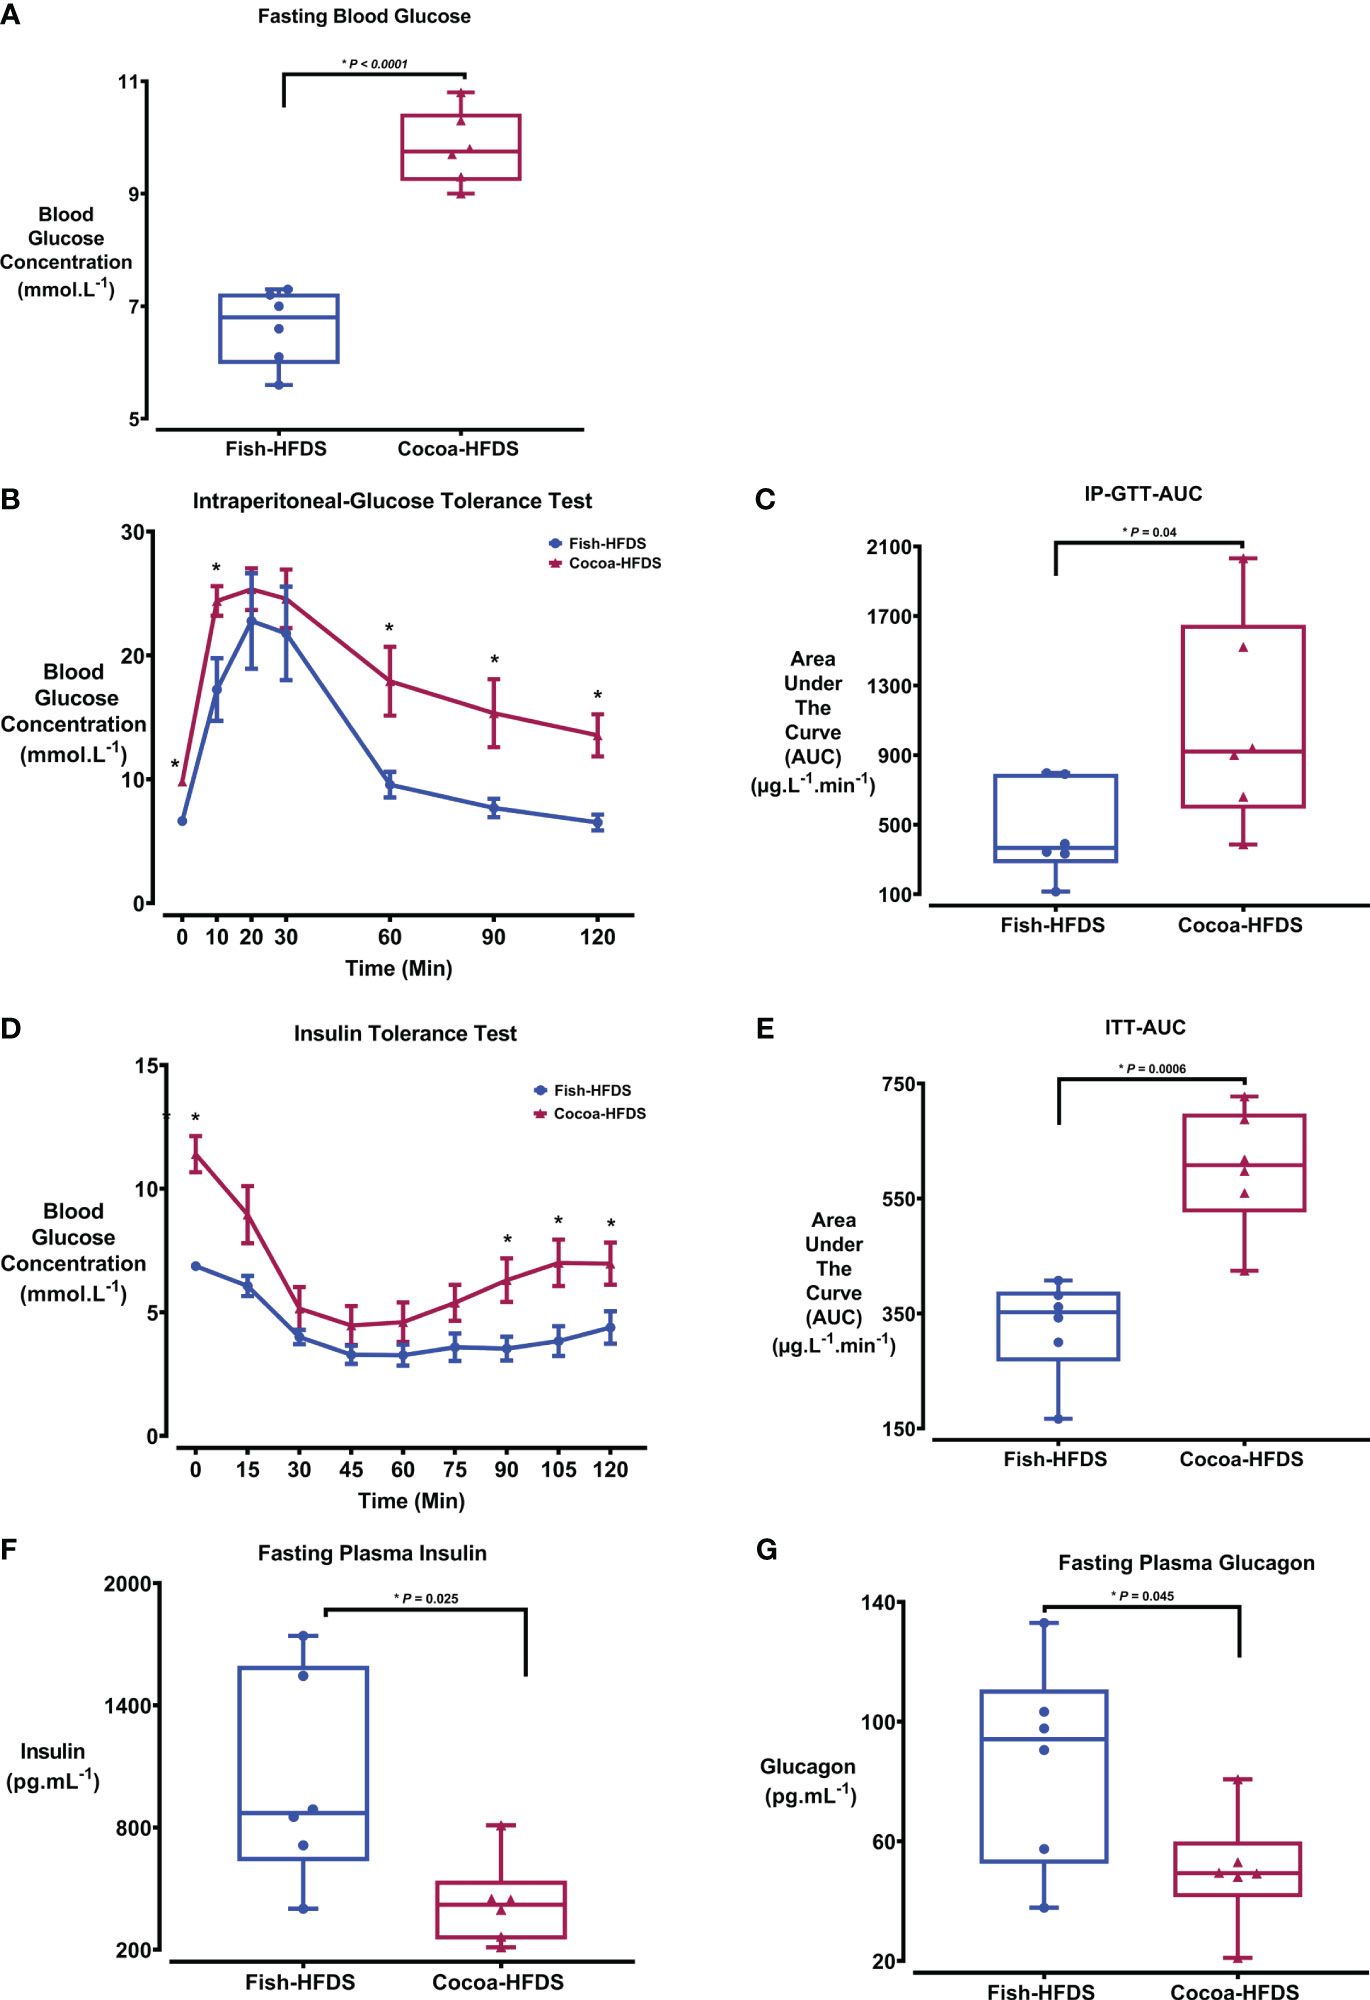
Figure 2 The Effect of different fat-based diets (Fish-HFDS and Cocoa-HFDS) on glucose insulin and glucagon. (A) Fasting blood glucose concentration of both groups. (B) Intraperitoneal glucose tolerance test (IPGTT). (C) AUC IP-GTT. (D) Insulin tolerance test (ITT). (E) AUC ITT. (F) Fasting plasma insulin concentration. (G) Fasting plasma glucagon concentration. Data are mean with ± SEM. P-values for differences between groups by ANOVA and Student’s t-test. The asterisk (*) represent a P-value of ≤ 0.05.
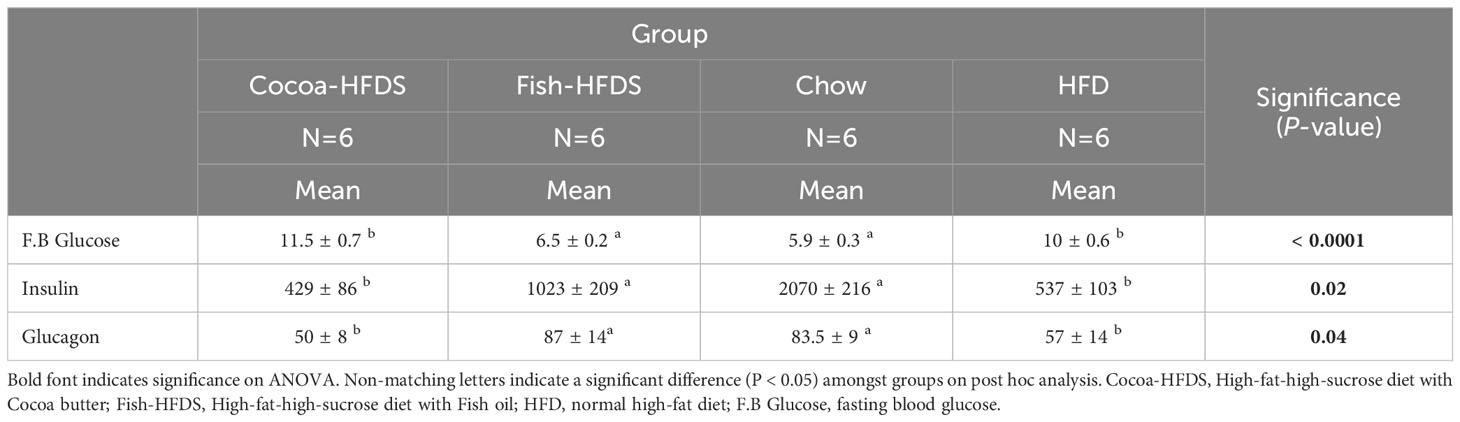
Table 4 The Effect of different fat-based diets (Fish-HFDS and Cocoa-HFDS) on plasma fasting blood glucose, insulin, and glucagon.
Next, we measured the fasting blood insulin in both groups to assess whether Fish-HFDS and Cocoa-HFDS had distinct effects on blood insulin. There was a significant difference in fasting plasma insulin concentrations between the Fish-HFDS and Cocoa-HFDS groups, with mice fed Fish-HFDS having higher concentrations (1023 ± 209 pg.mL-1, P = 0.02) (Figure 2F; Table 4).
Glucagon is a peptide hormone secreted from α-cells of the pancreatic islets, and its secretion is linked to plasma insulin levels. Therefore, we wanted to see whether these different high-fat/high-sucrose diets had distinct effects also on blood glucagon concentrations. Our results showed that mice fed Fish-HFDS displayed high fasting blood glucagon concentrations compared to mice fed Cocoa-HFDS (87 ± 14 pg.mL-1, P = 0.04) (Figure 2G; Table 4).
3.3 Effect of fish-HFDS and cocoa-HFDS on plasma metabolic markers
Metabolic hormones are affected by high-fat/high-sucrose diets and obesity. We wanted to see whether Fish-HFDS and Cocoa-HFDS had distinct effects on the metabolic markers. Our results showed that glucagon-like peptide (GLP-1) concentrations were significantly (108 ± 20 pg.mL-1, P = 0.002) higher in Fish-HFDS group compared to Cocoa-HFDS group (Figure 3A). A negative correlation was observed between food intake and GLP-1 in both groups (Fish-HFDS group: r = -0.97, P = 0.001; Cocoa-HFDS group: r = -0.98, P = 0.005) (Figure 3B). The Fish-HFDS group had significantly (991 ± 14 pg.mL-1, P = 0.0005) higher C-peptide concentrations than the Cocoa-HFDS group (Figure 3C). Plasma leptin concentrations were significantly (3752 ± 871 pg.mL-1, P = 0.006) higher in Fish-HFDS group compared to Cocoa-HFDS group (Figure 3D). An inverse correlation was found between food intake and leptin levels in the Fish-HFDS group only (r = -0.94, P = 0.003) (Figure 3E). Other metabolic markers such as secretin, peptide YY, interleukin (IL)-6, pancreatic polypeptide, glucose-dependent insulinotropic polypeptide-total, and tumor necrosis factor (TNF-α) were also measured, but no significant differences were found between the two dietary groups (Table 5).
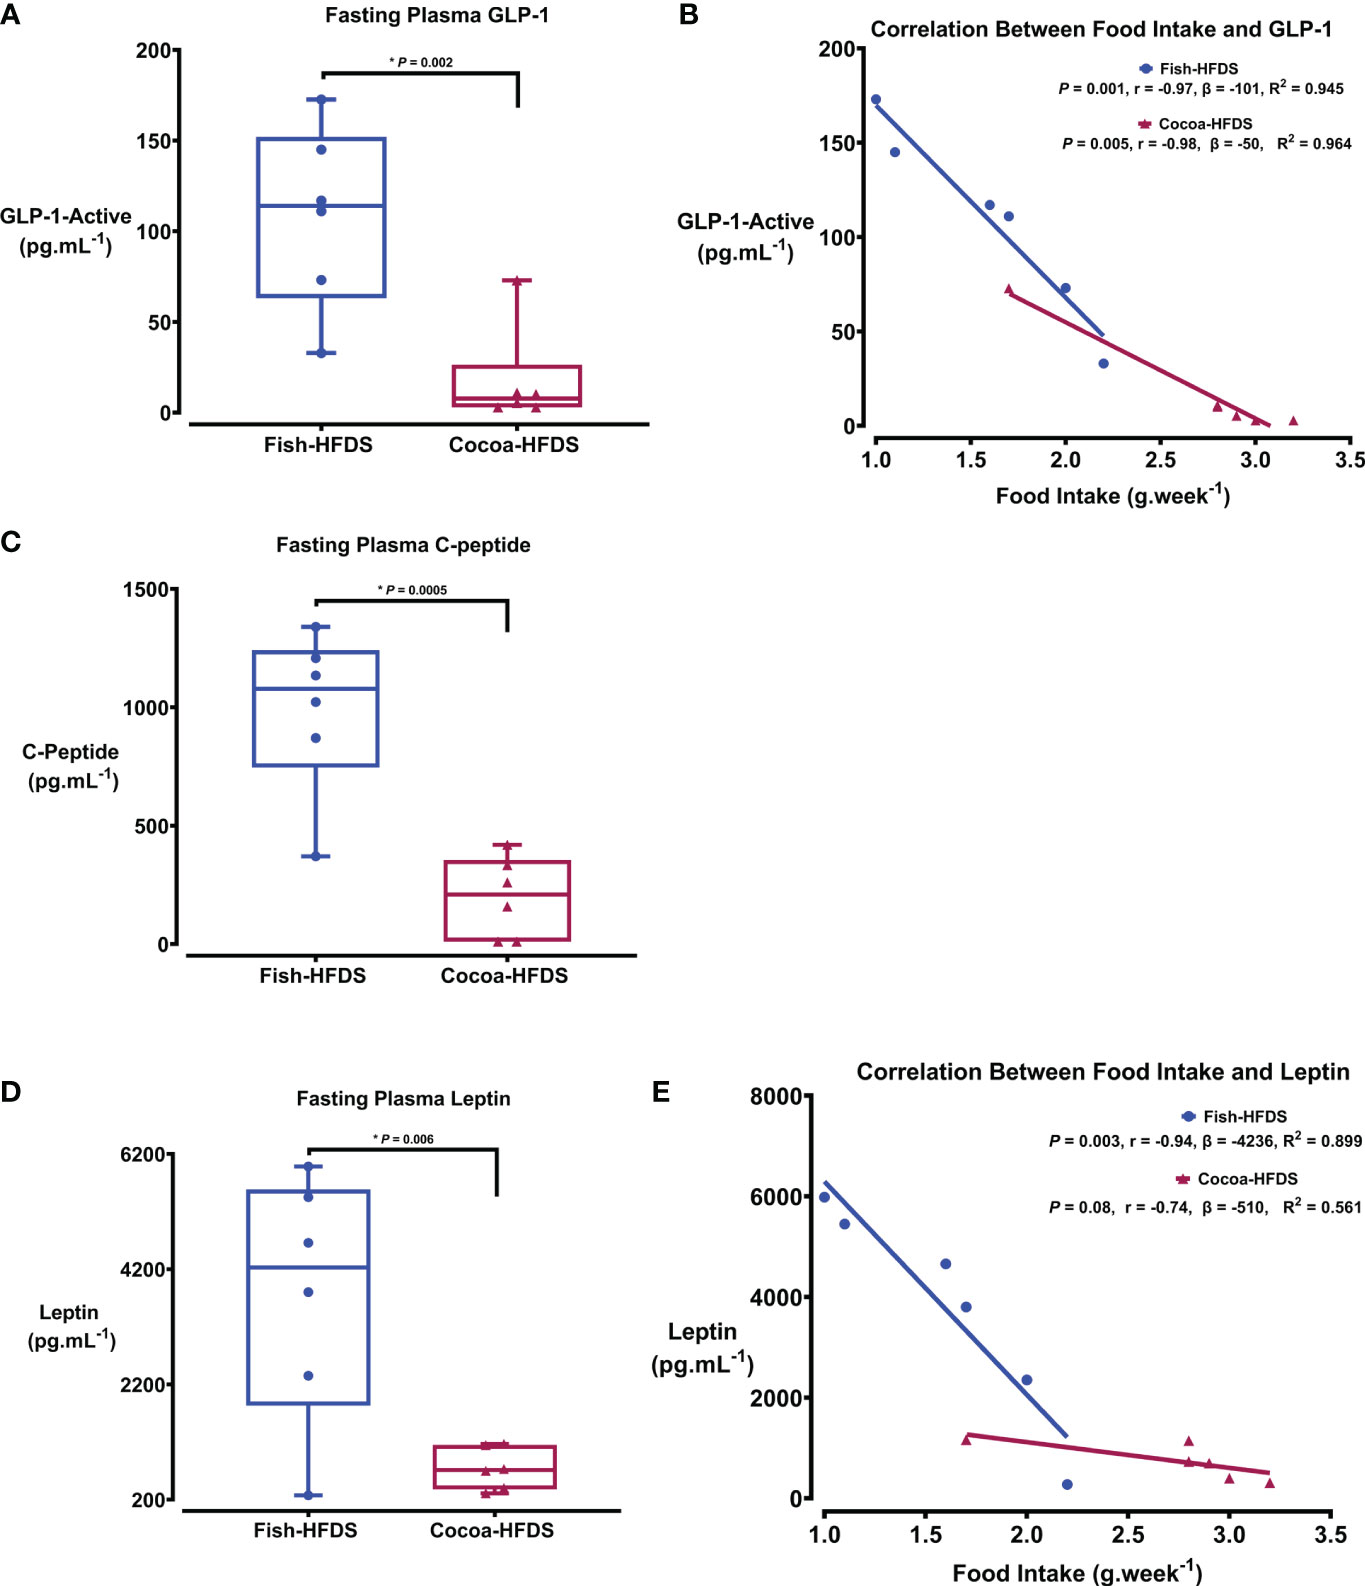
Figure 3 The Effect of different fat-based diets (Fish-HFDS and Cocoa-HFDS) on plasma metabolic markers. (A) Fasting plasma GLP-1concentration. (B) Correlation between food intake and GLP-1. (C) Fasting plasma C-peptide concentration. (D) Fasting plasma leptin concentration. (E) Correlation between food intake and leptin. Data are mean with ± SEM. P-values for differences between groups by ANOVA and Student’s t-test.
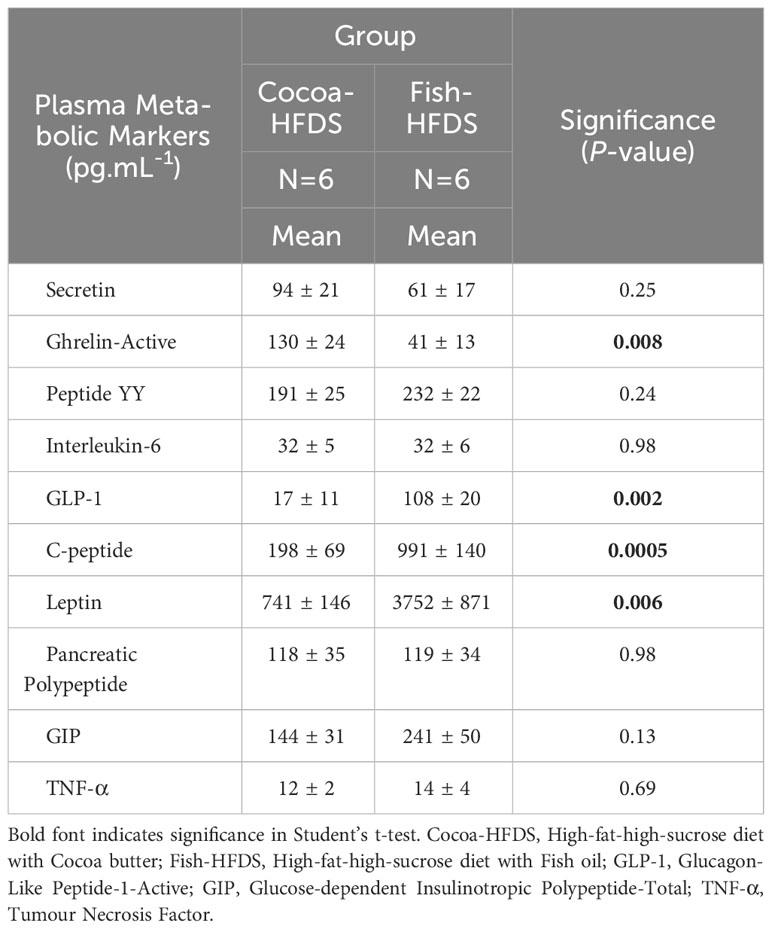
Table 5 The Effect of different fat-based diets (Fish-HFDS and Cocoa-HFDS) on plasma metabolic markers.
3.4 Effect of fish-HFDS and cocoa-HFDS on endocrine pancreas morphology and integrity
When pancreas sections were double stained for insulin and glucagon, the endocrine sections of the pancreas represented by the islets of Langerhans were distributed within the exocrine section of the pancreas (Figure 4). Our pancreatic histology data showed that α-cells, β-cells, and islet numbers were higher in Fish-HFDS group compared to Cocoa-HFDS group. However, only β-cells and islet numbers reached statistical significance (P = 0.025, P = 0.03, respectively) (Figures 5A, B). Insulin and glucagon-positive areas and α-cells, β-cells, and islet mass were similar between two groups. As a key regulatory marker of endocrine pancreas function, the expression of Pdx1 was detected which differed non-significantly between two groups (Figure 6). In addition, we also compared gene expression of Ins1, Gcg and several critical transcriptional regulators of β-cell (Pdx1, Mafa) and α cell (Pdx1, Mafb) development. Except the Ins1 gene expression (P = 0.008), all other markers differed non-significantly between two dietary groups (Table 6).
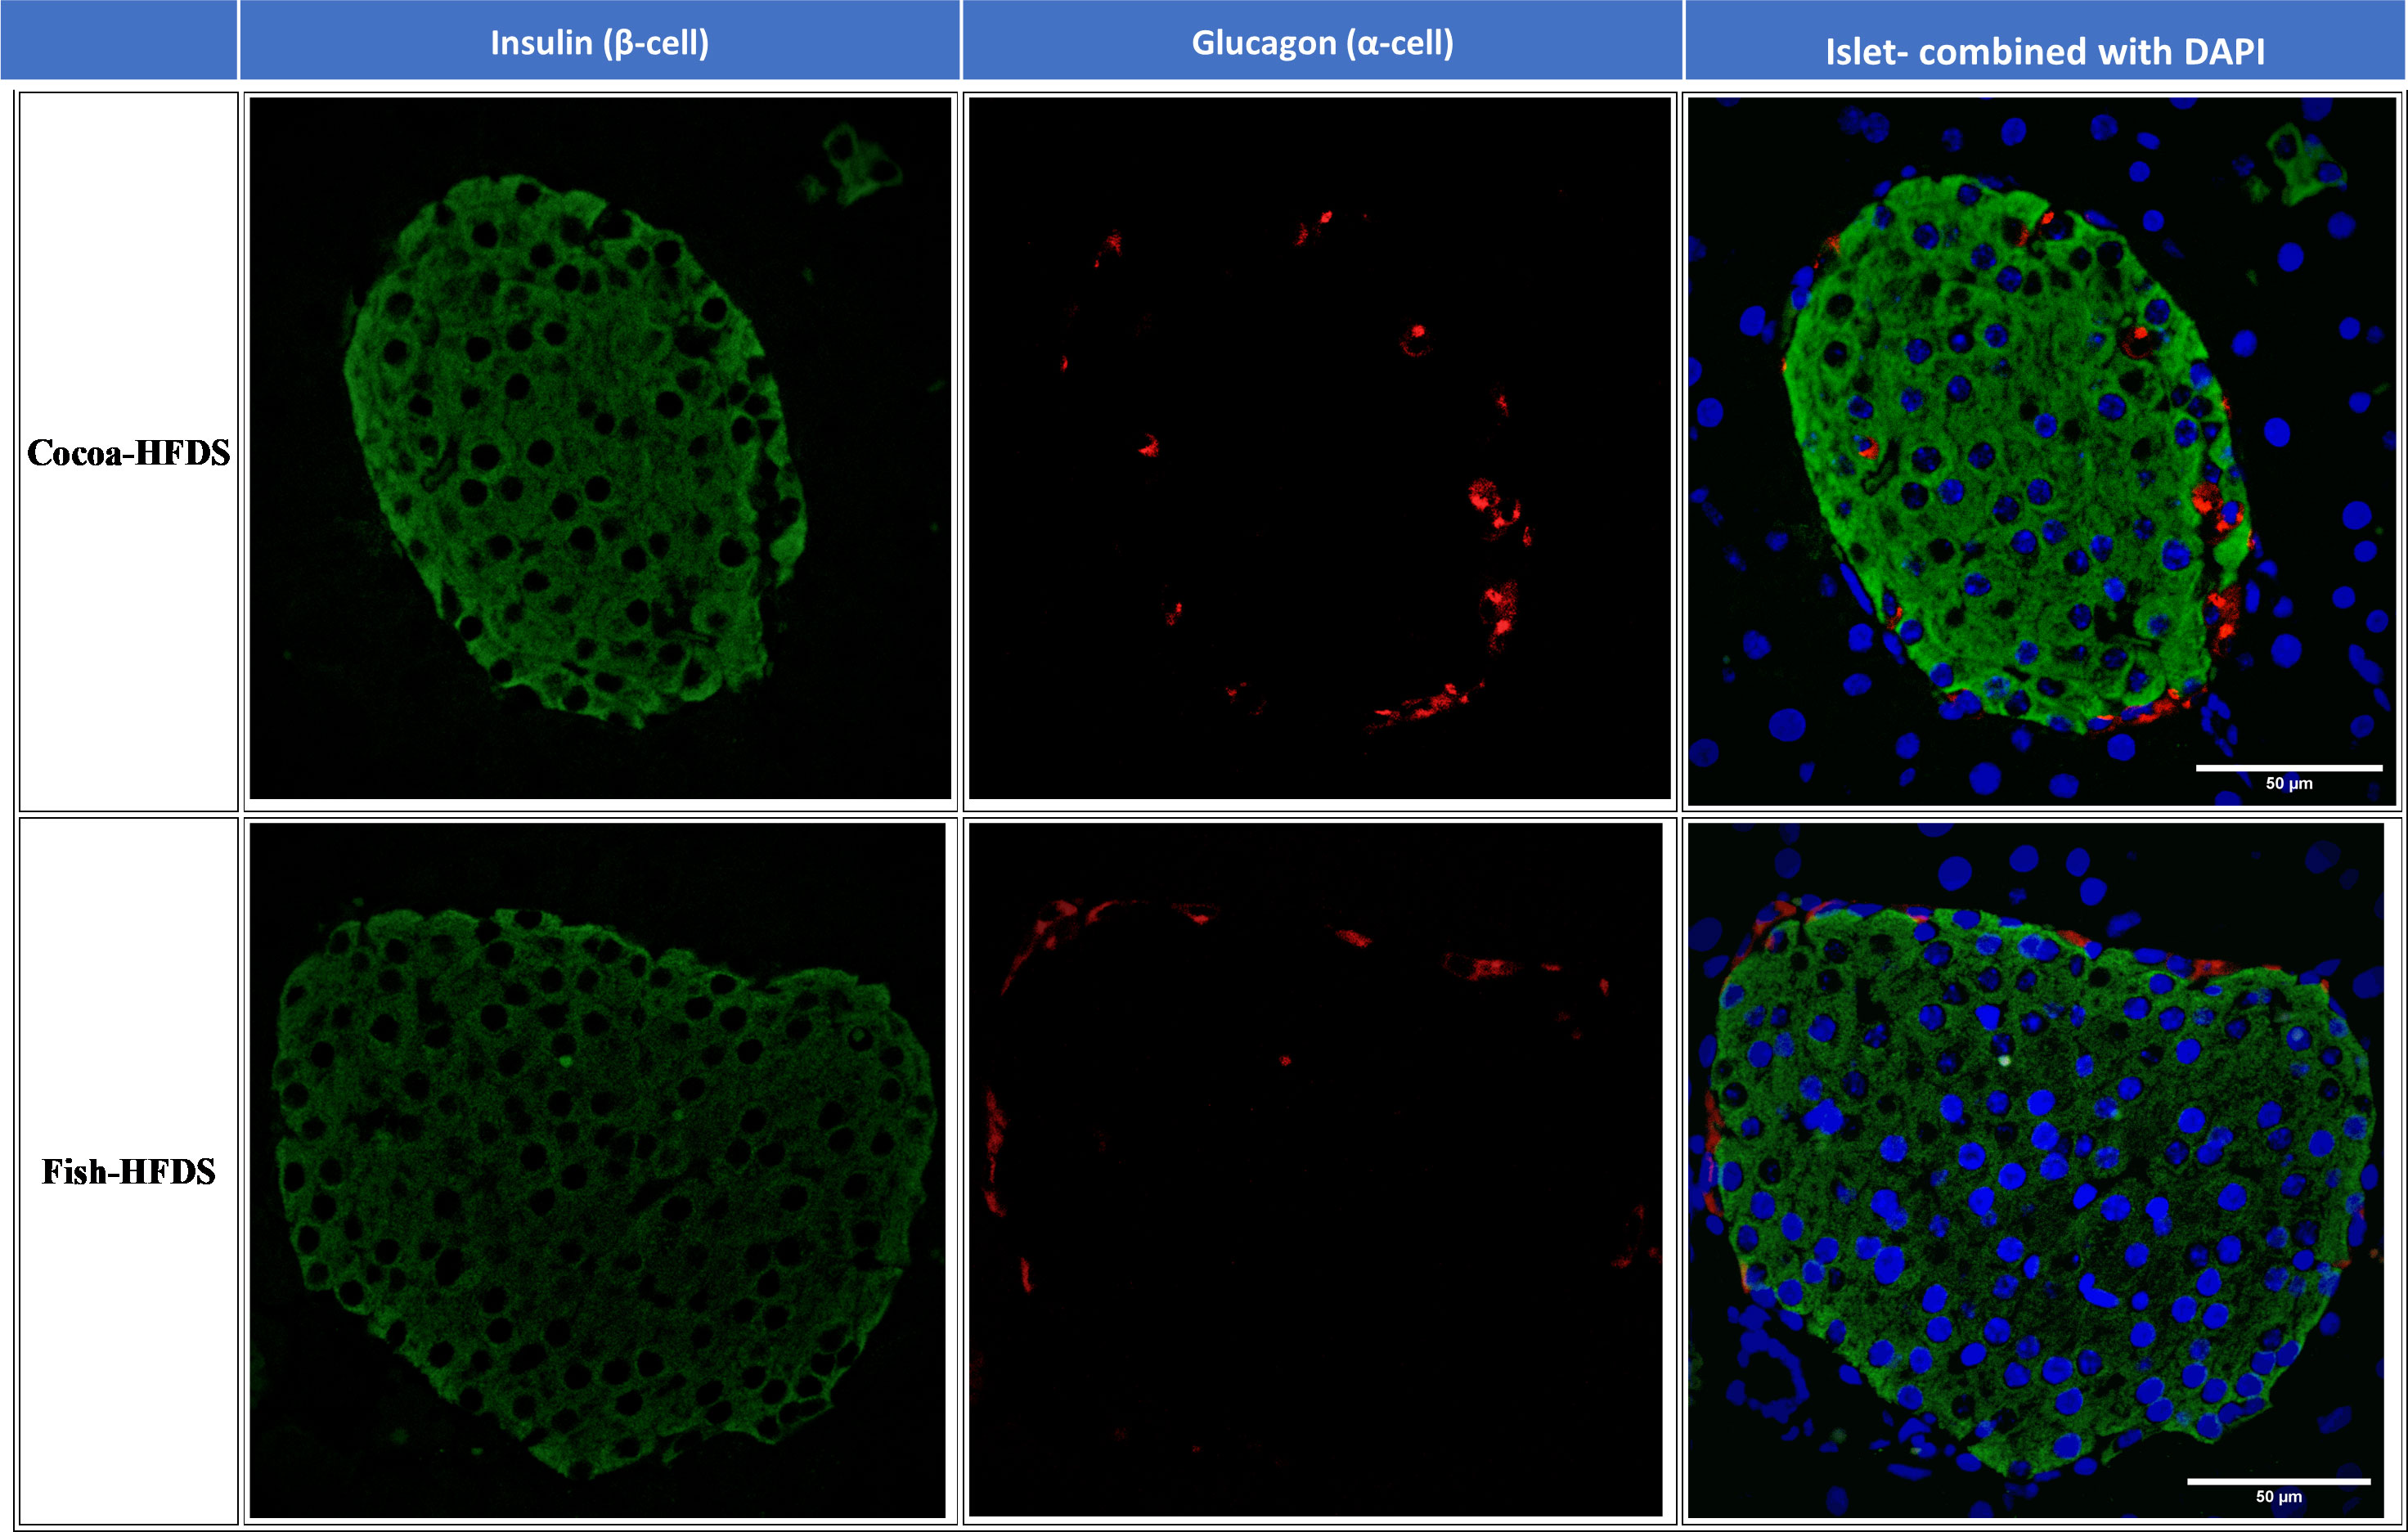
Figure 4 Representative photomicrographs of double staining of insulin and glucagon. Scale bar 50 µm.
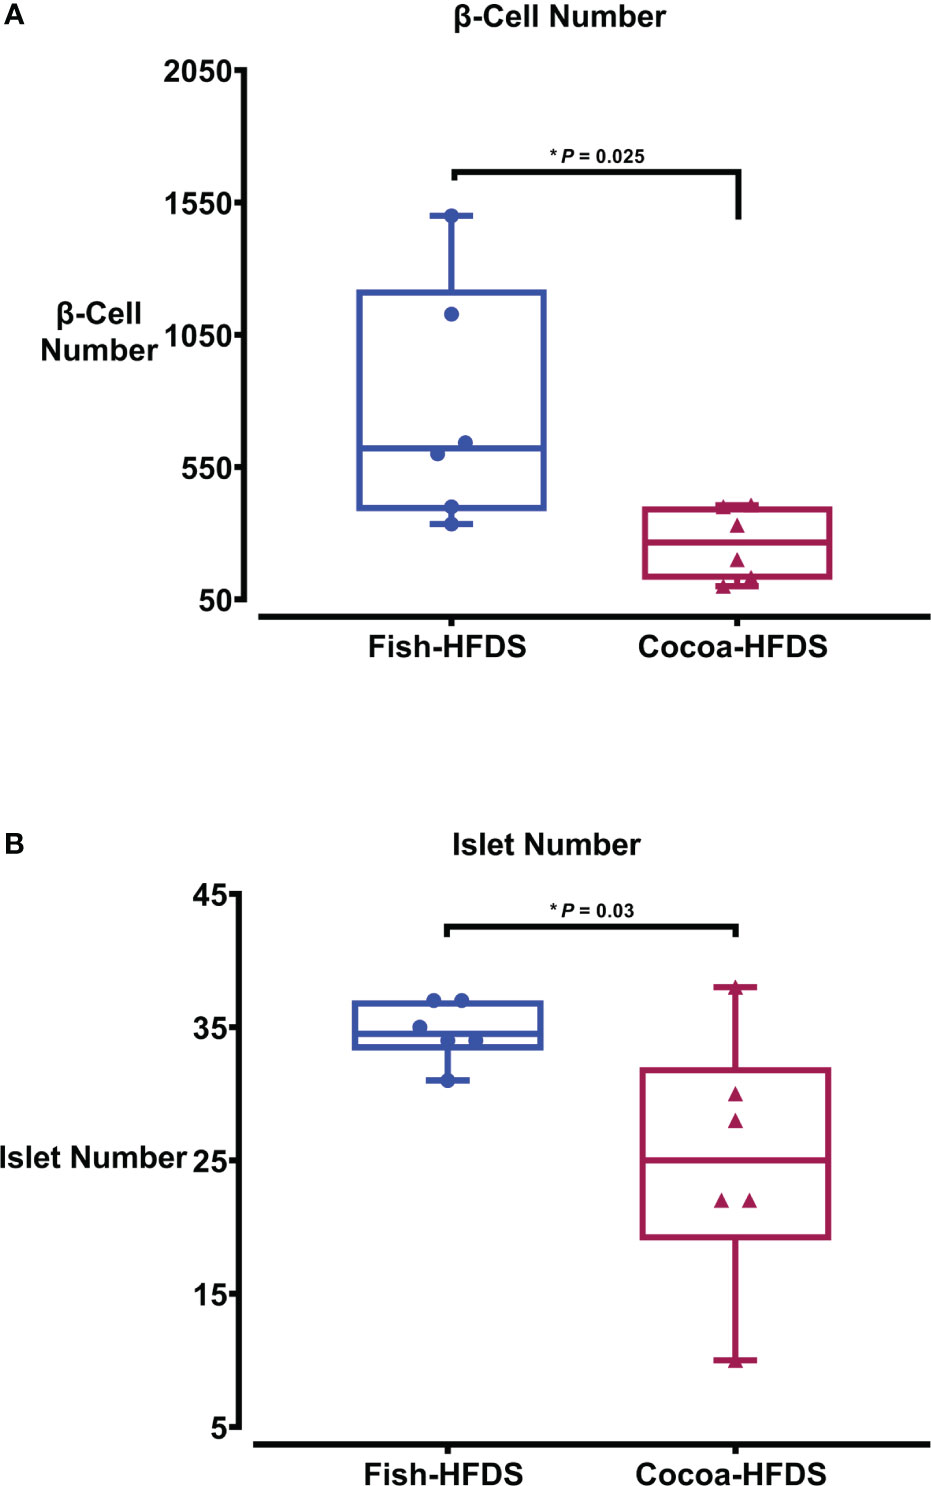
Figure 5 The Effect of different fat-based diets (Fish-HFDS and Cocoa-HFDS) on endocrine pancreas morphology. (A) Number of β-cells. (B) Number of islets. Data are mean with ± SEM. P-values for differences between groups by ANOVA and Student’s t-test.
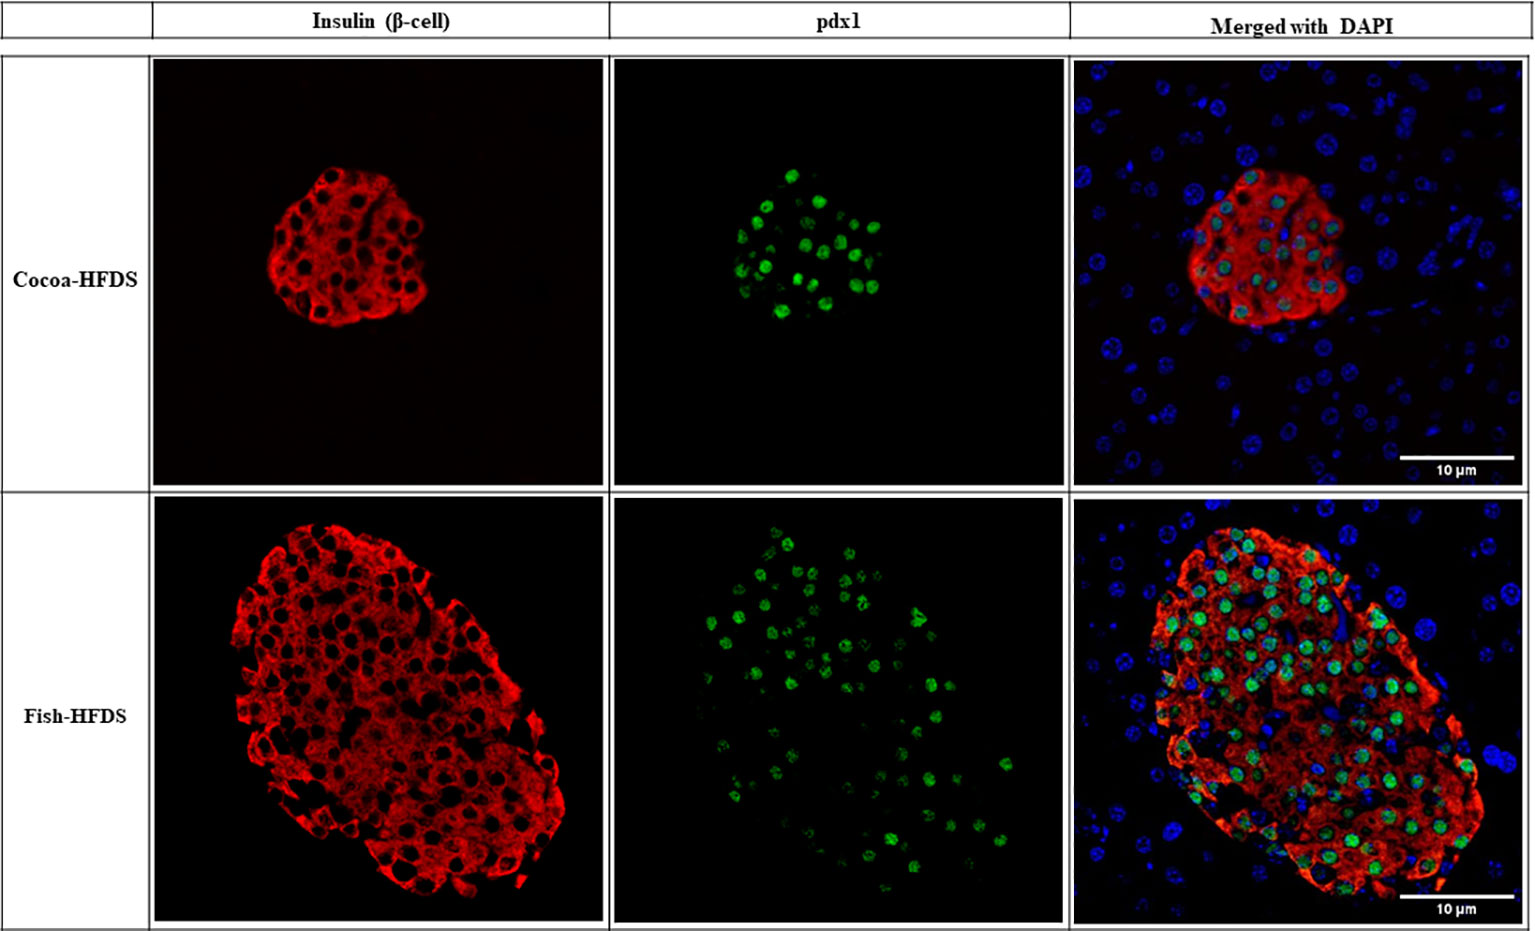
Figure 6 Representative photomicrographs of double staining of insulin and pdx1. Scale bar 10 µm.
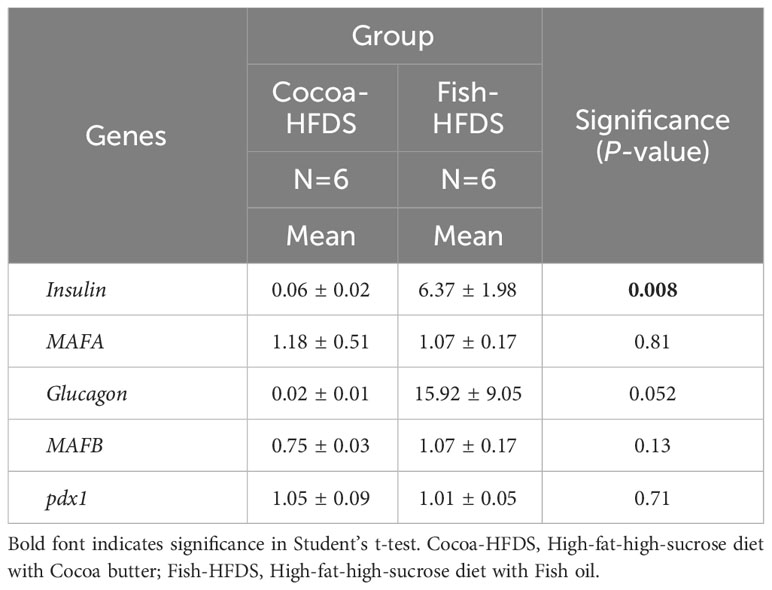
Table 6 The Effect of different fat-based diets (Fish-HFDS and Cocoa-HFDS) on the gene expression of Insulin, MAFA, Glucagon, MAFB and pdx1.
4 Discussion
The present study investigated and compared the effects of fish oil and cocoa butter as high-fat/high-sucrose diets on glucose tolerance, β-cell function, insulin sensitivity, and endocrine pancreas morphology and integrity in mice. This study used a mouse model to mimic a human nutritional setting of intake of high-fat diets. The components and ingredients of our diets were similar to the regular HFD, with the difference in the source of fat.
High-sucrose diets are known to increase body weight (2, 6, 10); however, when supplemented with fish oil, using different models, animals either gained (8, 19, 20), lost (21, 22), or showed no change (2, 10, 14, 15, 23–25) in their body weight. Here, we show that fish oil fat source in high fat/high sucrose diet does not, in fact, increase the body weight when compared to a high-fat diet based on cocoa butter as fat source. To determine whether the increase in body weight was due to increased food intake, we assessed the dietary intake of the mice. To this end, the Fish-HFDS group showed a lower food intake compared to Cocoa-HFDS group, which was consistent with the steady low increase in body weight of mice in Fish-HFDS group. Comparing with other studies, mice fed with high-fat/high-sucrose diets supplemented with fish oil either showed an increase (26) or a decrease in the food intake (2). The discrepancies in results of these studies can possibly be attributed to differences with regard to mice ages, fat and sugar percentages in diets, as well as dietary components other than fat and sucrose and feeding durations.
The Cocoa-HFDS group had higher fasting blood glucose concentrations than the Fish-HFDS group, which raises the possibility of a disturbance of glucose metabolism in the Cocoa-HFDS group. It was shown previously by several studies that the presence of fish oil in the high-sucrose diet affects the fasting glucose concentration, albeit within the normal range, in comparison to other groups that had only a high-sucrose diet alone or with a different source of fat (e.g., corn oil, lard, argan oil, and krill oil) (1, 2, 8, 14, 22, 25). In our study, compared to normal (chow) diet and regular HFD, the mice fed with Fish-HFDS had similar fasting blood glucose concentrations as the mice fed with chow diet and had lower fasting blood glucose concentrations than the mice fed with regular HFD.
Insulin resistance is a condition characterized by low peripheral tissue (muscle, liver, and adipose tissues) response to insulin (27, 28). A high-fat/high-sucrose diet is commonly used as a model of diet-induced insulin resistance and impaired glucose homeostasis, shown by the increased fasting glucose concentrations and amplified glucose and insulin responses to IP-GTT (2). Of note, it has been suggested that sucrose per se does not affect insulin-glucose uptake (7), in spite of the fact that rats fed a high-sucrose diet showed mild hyperglycemia (8, 16). The best method, considered a gold standard, for determining insulin resistance is the hyperinsulinemic-euglycemic clamp procedure. However, since this technique cannot be implemented routinely, ITT was developed as a simple alternative technique to evaluate insulin action in vivo (28). Accordingly, IP-GTT and ITT tests were used in this study to measure and compare the insulin action between Fish-HFDS and Cocoa-HFDS dietary groups. Our data showed that the AUC was lower in Fish-HFDS group compared to Cocoa-HFDS group, indicating a higher blood glucose clearance rate and hence a more proficient glycemic control in mice of Fish-HFDS group.
The Fish-HFDS group showed a better glucose tolerance test outcome, compared to Cocoa-HFDS group indicating that fish oil does not have harmful effects on β-cell sensitivity and may in fact have beneficial effects. This may suggest that the presence of good fat in the diet can either prevent insulin resistance or even promote insulin sensitivity, irrespective of the percentage of fat or calorie intake. The Fish-HFDS group had remarkedly lower fasting blood glucose concentrations compared to Cocoa-HFDS group, which may indicate that the Fish-HFDS group may have had more sensitive β-cells responding to glucose sensing. Moreover, the Fish-HFDS group also had higher blood insulin concentrations compared to Cocoa-HFDS group, which suggests that the fish oil may have had a positive modulatory impact on the β-cell secretory capacity, leading to an increase in insulin secretion. In support of our findings, previous studies have demonstrated that rats fed on high sucrose diet supplemented with fish oil showed normal glucose tolerance tests (1, 2, 16, 23) and did not develop insulin resistance. This indicates that the fish oil ameliorated and prevented insulin resistance (5). Of note, although previous studies have suggested that a high-fat diet impairs glucose tolerance independent of macronutrient composition (19), our study provides evidence that the type of fat does make a difference.
Moreover, it was suggested that sucrose, but not protein or fat, strongly stimulates pancreatic insulin secretion (19). In our study, the Fish-HFDS group had higher plasma insulin and glucagon concentrations compared to the Cocoa-HFDS group. However, the Fish-HFDS group had lower plasma insulin and glucagon concentrations compared to mice fed normal chow diet and higher plasma insulin and glucagon concentrations than mice fed regular HFD. Therefore, the fish oil as a source of fat in a high-sucrose high-fat diet effectively increased these hormones in mice. However, the previous studies on rats (25) and rabbits (22) fed a high-sucrose diet showed that insulin concentration was either not affected (25) or decreased (22) by fish oil supplementation. We speculate that different feeding regimens used in these dietary investigations, including ours, may be the source of differences in results regarding the circulatory insulin levels. Besides, the diets induce metabolic effects differentially across different species.
Insulin plays a vital role in glucose homeostasis; it inhibits glucose production and stimulates glucose uptake (29). During fasting, glucagon maintains glucose availability by stimulating the hepatic gluconeogenesis. Glucagon secretion is stimulated during hypoglycemia and is suppressed during hyperglycemia (30), providing the first line of defense in glucose counter-regulation (31). However, the balance between glucagon and insulin in the prandial state is responsible for normal glucose tolerance (32). Taken together, glucose homeostasis depends on the cooperation between α- and β-cells, not exclusively on the β-cells (31). Rather than having opposing roles in regulation of glucose homeostasis, α- and β-cells cooperate in the prandial state to regulate the metabolic control of nutrients (33). Besides, the role of certain enzymes such as acetylcholinesterase, α-glycosidase, butyrylcholinesterase, and carbonic anhydrase II could be considered in relation to glucose homeostasis, as some natural products studies have shown potential anti-diabetic effects by targeting these enzymes (34–36). However, glucagon measurements are still rarely reported in animal studies of glucose metabolism, which may represent an area of growing interest in metabolic research studies.
Plasma leptin concentrations were higher in Fish-HFDS group compared to Cocoa-HFDS group. Similar to our findings, previous studies showed that adipose tissue and plasma leptin concentrations were high in rats fed high sucrose, high-fat fish oil based diet (21, 26). In our study, fish oil increased plasma leptin concentrations without significant changes in body weight gains, which is consistent with what was found in previous studies (13, 26). Nonetheless, an inverse correlation was found between food intake and plasma leptin concentrations in the Fish-HFDS group, which is expected considering the metabolic role of leptin as a satiety regulatory hormone.
Our data suggest that high concentrations of GLP-1, and leptin also, could be responsible for the reduced food intake, lower blood glucose concentrations, and less weight gains in the Fish-HFDS group compared to Cocoa-HFDS group, although both groups showed a negative correlation between food intake and GLP-1. Importantly, the Fish-HFDS group had higher C-peptide concentrations than the Cocoa-HFDS group, which indicates a better β-cell function in mice fed Fish-HFDS. However, other studies reported that the C-peptide concentration was not affected by the supplementation of fish oil to a normal diet in both lean and obese rats (37). Clearly, the insulinotropic effect varied as fish oil was added as supplement to a normal diet or fed to mice concurrently as a high-fat high-sucrose diet (the regimen used in our study).
An optimal pancreatic endocrine cell mass is necessary for organ function, and changes in the mass lead to metabolic disorders (12). The pancreatic endocrine cell mass is calculated from the cell size; however, the mass can be increased due to proliferation and hypertrophy or decreased by apoptosis and atrophy (38, 39). Under normal conditions during adulthood, pancreatic β-cells have a steady low rate of proliferation and apoptosis (39). Maintaining β-cell mass during adulthood is vital to maintain blood glucose homeostasis and prevent diabetes (39). Cell mass, especially β-cell mass, can expand during adulthood in response to increased body weight and insulin resistance (38, 39), thereby displaying an ability to adapt to the increased insulin demand (38).
Given the critical role that the endocrine pancreas plays in maintaining blood glucose homeostasis, we assessed endocrine pancreas cell number and expression of endocrine pancreas regulatory markers. Our data showed that the α-cells, β-cells, and islet numbers were higher in Fish-HFDS group compared to Cocoa-HFDS group. However, only β-cells and islet numbers reached statistical significance. The insulin and glucagon-positive areas and α-cells, β-cells, and islet mass were similar between two groups. We observed nonsignificant differences between two dietary groups regarding gene expression of Pdx1, Mafa/b and Gcg while significant difference was observed regarding Ins. Other studies showed that when fish oil was added to a normal diet, it did not affect islet size in both obese or lean rats (37). However, a high-fat diet is known to increase pancreatic β-cell mass by both hypertrophy and hyperplasia to produce more insulin as a compensatory mechanism against insulin resistance (10, 40). β-cell hypertrophy and hyperplasia are associated with the loss of β-cell function, leading to a defect in insulin secretion (27). Prolonged insulin resistance leads to the activation of the apoptotic pathways increasing β-cell apoptosis and decreasing β-cell mass (40). β-cell function and β-cell mass are correlated, and both decrease with glucose intolerance (41). Decreased β-cell mass is associated with impaired fasting glucose and glucose tolerance (41); in our study, the Cocoa-HFDS group had high fasting blood glucose concentration and impaired glucose tolerance with no significant difference in β-cell mass compared to the Fish-HFDS group, suggesting an impairment in glucose homeostasis. However, further studies that incorporate additional control groups (high-sucrose or/and normal diet) are needed to confirm these possibilities. Interestingly, many findings suggest that changes in α-cell mass are attributed to glucose intolerance (41). However, we measured α-cell mass and found no difference between two dietary groups. Further research measuring the β-cell apoptosis to proliferation ratios will be needed to confirm whether the increase in β-cell numbers in the Fish-HFDS group is not a compensatory mechanism against the diet-induced insulin resistance. Moreover, pre-intervention with fish oil has a favorable impact on islet morphology (42), which needs to be further evaluated in various settings.
5 Conclusion
Our findings suggest that manipulating dietary fats within a high sucrose diet may improve certain features of the metabolic syndrome improving glucose homeostasis. In this regard, replacing the fat content in the high-fat/high-sucrose diet with fish oil seems to be associated with the following: reduced food intake, reduced weight gain, reduced fasting blood glucose concentrations, improved glucose tolerance tests and insulin sensitivity, and a favorable effect on islet morphology. However, the molecular mechanisms that underlie the fish oil effects need to be further investigated.
Data availability statement
The original contributions presented in the study are included in the article/supplementary material. Further inquiries can be directed to the corresponding author.
Ethics statement
The animal study and all animal experimental protocols were approved by the Dasman Diabetes Institute Animal Care and Ethics Committee (RA AM- 2016-007). All institutional and national/international guidelines for the care and use of laboratory animals were followed. The study was conducted in accordance with the local legislation and institutional requirements.
Author contributions
SA: Data curation, Formal Analysis, Investigation, Methodology, Writing – original draft. AH: Formal Analysis, Writing – review & editing. HA: Writing – review & editing, Data curation, Methodology. SaS: Resources, Writing – review & editing. FA-R: Formal Analysis, Writing – review & editing. SK: Data curation, Formal Analysis, Methodology, Writing – review & editing. NA: Data curation, Methodology, Writing – review & editing. TJ: Data curation, Methodology, Writing – review & editing. StS: Data curation, Methodology, Writing – review & editing. AA: Resources, Writing – review & editing. FA-M: Formal Analysis, Resources, Writing – review & editing. RA: Conceptualization, Funding acquisition, Resources, Supervision, Writing – review & editing.
Funding
The author(s) declare financial support was received for the research, authorship, and/or publication of this article. This work was supported and funded by the Kuwait Foundation for the Advancement of Sciences (KFAS) grant No. (RA AM-2016-007).
Conflict of interest
The authors declare that the research was conducted in the absence of any commercial or financial relationships that could be construed as a potential conflict of interest.
Publisher’s note
All claims expressed in this article are solely those of the authors and do not necessarily represent those of their affiliated organizations, or those of the publisher, the editors and the reviewers. Any product that may be evaluated in this article, or claim that may be made by its manufacturer, is not guaranteed or endorsed by the publisher.
References
1. Lombardo YB, Hein G, Chicco A. Metabolic syndrome: effects of n-3 PUFAs on a model of dyslipidemia, insulin resistance and adiposity. Lipids. (2007) 42:427–37. doi: 10.1007/s11745-007-3039-3
2. Samane S, Christon R, Dombrowski L, Turcotte S, Charrouf Z, Lavigne C, et al. Fish oil and argan oil intake differently modulate insulin resistance and glucose intolerance in a rat model of dietary-induced obesity. Metabolism: Clin Exp. (2009) 58:909–19. doi: 10.1016/j.metabol.2009.02.013
3. Brown MR, Matveyenko AV. It’s what and when you eat: an overview of transcriptional and epigenetic responses to dietary perturbations in pancreatic islets. Front Endocrinol (Lausanne). (2022) 13:842603. doi: 10.3389/fendo.2022.842603
4. Rasool S, Geetha T, Broderick TL, Babu JR. High fat with high sucrose diet leads to obesity and induces myodegeneration. Front Physiol. (2018) 9:1054. doi: 10.3389/fphys.2018.01054
5. Podolin DA, Gayles EC, Wei Y, Thresher JS, Pagliassotti MJ. Menhaden oil prevents but does not reverse sucrose-induced insulin resistance in rats. Am J Physiol. (1998) 274:R840–8. doi: 10.1152/ajpregu.1998.274.3.R840
6. Chicco A, D’Alessandro ME, Karabatas L, Pastorale C, Basabe JC, Lombardo YB. Muscle lipid metabolism and insulin secretion are altered in insulin-resistant rats fed a high sucrose diet. J Nutr. (2003) 133:127–33. doi: 10.1093/jn/133.1.127
7. Chun MR, Lee YJ, Kim KH, Kim YW, Park SY, Lee KM, et al. Differential effects of high-carbohydrate and high-fat diet composition on muscle insulin resistance in rats. J Korean Med Sci. (2010) 25:1053–9. doi: 10.3346/jkms.2010.25.7.1053
8. Pighin D, Karabatas L, Rossi A, Chicco A, Basabe JC, Lombardo YB. Fish oil affects pancreatic fat storage, pyruvate dehydrogenase complex activity and insulin secretion in rats fed a sucrose-rich diet. J Nutr. (2003) 133:4095–101. doi: 10.1093/jn/133.12.4095
9. Sakamoto E, Seino Y, Fukami A, Mizutani N, Tsunekawa S, Ishikawa K, et al. Ingestion of a moderate high-sucrose diet results in glucose intolerance with reduced liver glucokinase activity and impaired glucagon-like peptide-1 secretion. J Diabetes Invest. (2012) 3:432–40. doi: 10.1111/j.2040-1124.2012.00208.x
10. Nascimento FA, Barbosa-da-Silva S, Fernandes-Santos C, Mandarim-de-Lacerda CA, Aguila MB, tissue A. liver and pancreas structural alterations in C57BL/6 mice fed high-fat-high-sucrose diet supplemented with fish oil (n-3 fatty acid rich oil). Exp Toxicologic Pathol. (2010) 62:17–25. doi: 10.1016/j.etp.2008.12.008
11. Lionetti L, Mollica MP, Sica R, Donizzetti I, Gifuni G, Pignalosa A, et al. Differential effects of high-fish oil and high-lard diets on cells and cytokines involved in the inflammatory process in rat insulin-sensitive tissues. Int J Mol Sci. (2014) 15:3040–63. doi: 10.3390/ijms15023040
12. Roche E, Ramírez-Tortosa CL, Arribas MI, Ochoa JJ, Sirvent-Belando JE, Battino M, et al. Comparative analysis of pancreatic changes in aged rats fed life long with sunflower, fish, or olive oils. Journals Gerontol Ser A Biol Sci Med Sci. (2014) 69:934–44. doi: 10.1093/gerona/glt157
13. Rossi AS, Lombardo YB, Lacorte JM, Chicco AG, Rouault C, Slama G, et al. Dietary fish oil positively regulates plasma leptin and adiponectin levels in sucrose-fed, insulin-resistant rats. Am J Physiol Regulatory Integr Comp Physiol. (2005) 289:R486–r494. doi: 10.1152/ajpregu.00846.2004
14. Rossi AS, Lombardo YB, Chicco AG. Lipogenic enzyme activities and glucose uptake in fat tissue of dyslipemic, insulin-resistant rats: effects of fish oil. Nutr (Burbank Los Angeles County Calif.). (2010) 26:209–17. doi: 10.1016/j.nut.2009.04.006
15. Castellano CA, Audet I, Laforest JP, Chouinard Y, Matte JJ. Fish oil diets do not improve insulin sensitivity and secretion in healthy adult male pigs. Br J Nutr. (2010) 103:189–96. doi: 10.1017/S0007114509991590
16. Lombardo YB, Chicco A, D’Alessandro ME, Martinelli M, Soria A, Gutman R. Dietary fish oil normalize dyslipidemia and glucose intolerance with unchanged insulin levels in rats fed a high sucrose diet. Biochim Biophys Acta. (1996) 1299:175–82. doi: 10.1016/0005-2760(95)00197-2
17. Nakasatomi M, Kim H, Arai T, Hirako S, Shioda S, Iizuka Y, et al. Fish oil and fenofibrate inhibit pancreatic islet hypertrophy, and improve glucose and lipid metabolic dysfuntions with different ways in diabetic KK mice. Obes Res Clin Pract. (2018) 12:29–38. doi: 10.1016/j.orcp.2016.03.012
18. Albeloushi SM. Effect of branched-chain amino acid supplements on pancreatic development in preterm lambs. Univ Auckland. (2022), 210.
19. Ma T, Liaset B, Hao Q, Petersen RK, Fjære E, Ngo HT, et al. Sucrose counteracts the anti-inflammatory effect of fish oil in adipose tissue and increases obesity development in mice. PloS One. (2011) 6:e21647. doi: 10.1371/journal.pone.0021647
20. Hao Q, Lillefosse HH, Fjaere E, Myrmel LS, Midtbø LK, Jarlsby RH, et al. High-glycemic index carbohydrates abrogate the antiobesity effect of fish oil in mice. Am J Physiol Endocrinol Metab. (2012) 302:E1097–112. doi: 10.1152/ajpendo.00524.2011
21. Selenscig D, Rossi A, Chicco A, Lombardo YB. Increased leptin storage with altered leptin secretion from adipocytes of rats with sucrose-induced dyslipidemia and insulin resistance: effect of dietary fish oil. Metabolism: Clin Exp. (2010) 59:787–95. doi: 10.1016/j.metabol.2009.09.025
22. Grigorova N, Ivanova Z, Bjørndal B, Berge RK, Vachkova E, Milanova A, et al. Diet restriction alone improves glucose tolerance and insulin sensitivity than its coadministration with krill or fish oil in a rabbit model of castration-induced obesity. J Anim Physiol Anim Nutr. (2022) 106:1396–407. doi: 10.1111/jpn.13742
23. Soria A, Chicco A, D’Alessandro ME, Rossi A, Lombardo YB. Dietary fish oil reverse epididymal tissue adiposity, cell hypertrophy and insulin resistance in dyslipemic sucrose fed rat model☆ ☆A preliminary report was presented at the 19th International Symposium on Diabetes and Nutrition, June 2001, Dusseldorf, Germany. J Nutr Biochem. (2002) 13:209–18. doi: 10.1016/S0955-2863(01)00214-5
24. Yamazaki T, Nakamori A, Sasaki E, Wada S, Ezaki O. Fish oil prevents sucrose-induced fatty liver but exacerbates high-safflower oil-induced fatty liver in ddy mice. Hepatol (Baltimore Md.). (2007) 46:1779–90. doi: 10.1002/hep.21934
25. Hein GJ, Chicco A, Lombardo YB. Fish oil normalizes plasma glucose levels and improves liver carbohydrate metabolism in rats fed a sucrose-rich diet. Lipids. (2012) 47:141–50. doi: 10.1007/s11745-011-3623-4
26. Peyron-Caso E, Taverna M, Véronèse A, Pacher N, Slama G, Rizkalla SW, et al. Dietary (n-3) polyunsaturated fatty acids up-regulate plasma leptin in insulin-resistant rats. J Nutr. (2002) 132:2235–40. doi: 10.1093/jn/132.8.2235
27. Bhaswant M, Poudyal H, Brown L. Mechanisms of enhanced insulin secretion and sensitivity with n-3 unsaturated fatty acids. J Nutr Biochem. (2015) 26:571–84. doi: 10.1016/j.jnutbio.2015.02.001
28. Cózar-Castellano I, Perdomo G. Assessment of insulin tolerance in vivo in mice. In: King AJF, editor. Animal Models of Diabetes: Methods and Protocols. New York, NY: Springer US (2020). p. 217–24.
29. Petersen MC, Shulman GI. Mechanisms of insulin action and insulin resistance. Physiol Rev. (2018) 98:2133–223. doi: 10.1152/physrev.00063.2017
30. Drucker DJ. Chapter 34 - glucagon and the glucagon-like peptides. In: Jameson JL, De Groot LJ, de Kretser DM, Giudice LC, Grossman AB, Melmed S, Potts JT, Weir GC, editors. Endocrinology: Adult and Pediatric, Seventh Edition. Philadelphia: W.B. Saunders (2016). p. 586–597.e5.
31. Rodriguez-Diaz R, Molano RD, Weitz JR, Abdulreda MH, Berman DM, Leibiger B, et al. Paracrine interactions within the pancreatic islet determine the glycemic set point. Cell Metab. (2018) 27:549–558.e4. doi: 10.1016/j.cmet.2018.01.015
32. Capozzi ME, Wait JB, Koech J, Gordon AN, Coch RW, Svendsen B, et al. Glucagon lowers glycemia when β-cells are active. JCI Insight. (2019) 5(16):e129954. doi: 10.1172/jci.insight.129954
33. El K, Capozzi ME, Campbell JE. Repositioning the alpha cell in postprandial metabolism. Endocrinology. (2020) 161(11):bqaa169. doi: 10.1210/endocr/bqaa169
34. Durmaz L, Kiziltas H, Guven L, Karagecili H, Alwasel S, Gulcin I. Antioxidant, antidiabetic, anticholinergic, and antiglaucoma effects of magnofluorine. Mol (Basel Switzerland). (2022) 27(18):5902. doi: 10.3390/molecules27185902
35. Yilmaz MA, Taslimi P, Kilic O, Gulcin I, Dey A, Bursal E. Unravelling the phenolic compound reserves, antioxidant and enzyme inhibitory activities of an endemic plant species, Achillea pseudoaleppica. J Biomol Struct Dyn. (2023) 41:445–56. doi: 10.1080/07391102.2021.2007792
36. Karagecili H, Izol E, Kirecci E, Gulcin I. Determination of antioxidant, anti-alzheimer, antidiabetic, antiglaucoma and antimicrobial effects of Zivzik pomegranate (Punica granatum)-A chemical profiling by LC-MS/MS. Life (Basel). (2023) 13:735. doi: 10.3390/life13030735
37. Gillam M, Noto A, Zahradka P, Taylor CG. Improved n-3 fatty acid status does not modulate insulin resistance in fa/fa Zucker rats. Prostaglandins Leukotrienes Essential Fatty Acids. (2009) 81:331–9. doi: 10.1016/j.plefa.2009.09.008
38. Bartolome A, Guillén C. Role of the mammalian target of rapamycin (mTOR) complexes in pancreatic β-cell mass regulation. Vitamins Hormones. (2014) 95:425–69. doi: 10.1016/B978-0-12-800174-5.00017-X
39. Ackermann AM, Gannon M. Molecular regulation of pancreatic beta-cell mass development, maintenance, and expansion. J Mol Endocrinol. (2007) 38:193–206. doi: 10.1677/JME-06-0053
40. Iizuka Y, Kim H, Izawa T, Sakurai K, Hirako S, Wada M, et al. Protective effects of fish oil and pioglitazone on pancreatic tissue in obese KK mice with type 2 diabetes. Prostaglandins Leukotrienes Essential Fatty Acids. (2016) 115:53–9. doi: 10.1016/j.plefa.2016.10.007
41. Inaishi J, Saisho Y. Beta-cell mass in obesity and type 2 diabetes, and its relation to pancreas fat: A mini-review. Nutrients. (2020) 12(12):3846. doi: 10.3390/nu12123846
42. Zou HY, Zhang HJ, Zhao YC, Li XY, Wang YM, Zhang TT, et al. N-3 PUFA Deficiency Aggravates Streptozotocin-Induced Pancreatic Injury in Mice but Dietary Supplementation with DHA/EPA Protects the Pancreas via Suppressing Inflammation, Oxidative Stress and Apoptosis. Mar Drugs. (2023) 21(1):39. doi: 10.3390/md21010039
Keywords: fish oil, cocoa butter, high-fat/sucrose diet, insulin, glucagon, α-cell, β-cell
Citation: Albeloushi S, Hasan A, Arefanian H, Sindhu S, Al-Rashed F, Kochumon S, Abukhalaf N, Jacob T, Shenouda S, Al Madhoun A, Al-Mulla F and Ahmad R (2024) Differential effects of fish-oil and cocoa-butter based high-fat/high-sucrose diets on endocrine pancreas morphology and function in mice. Front. Endocrinol. 15:1265799. doi: 10.3389/fendo.2024.1265799
Received: 23 July 2023; Accepted: 29 January 2024;
Published: 13 February 2024.
Edited by:
Ping Wang, Michigan State University, United StatesReviewed by:
Yifan Bao, Johnson & Johnson, United StatesDenggang Fu, Indiana University, United States
Ilhami Gulcin, Atatürk University, Türkiye
Copyright © 2024 Albeloushi, Hasan, Arefanian, Sindhu, Al-Rashed, Kochumon, Abukhalaf, Jacob, Shenouda, Al Madhoun, Al-Mulla and Ahmad. This is an open-access article distributed under the terms of the Creative Commons Attribution License (CC BY). The use, distribution or reproduction in other forums is permitted, provided the original author(s) and the copyright owner(s) are credited and that the original publication in this journal is cited, in accordance with accepted academic practice. No use, distribution or reproduction is permitted which does not comply with these terms.
*Correspondence: Rasheed Ahmad, cmFzaGVlZC5haG1hZEBkYXNtYW5pbnN0aXR1dGUub3Jn