 Mohammad Nazmus Sakib
 Reza Ramezan3
 Peter A. Hall
- 1Department of Health Research Methods, Evidence, and Impact, Faculty of Health Sciences, McMaster University, Hamilton, ON, Canada
- 2School of Public Health Sciences, Faculty of Health, University of Waterloo, Waterloo, ON, Canada
- 3Department of Statistics and Actuarial Science, University of Waterloo, Waterloo, ON, Canada
- 4Centre for Bioengineering and Biotechnology, University of Waterloo, Waterloo, ON, Canada
- 5Department of Psychology, University of Waterloo, Waterloo, ON, Canada
Objectives: Diabetes is recognized as a significant risk factor for cognitive impairment. However, this association has not been thoroughly examined using large-scale population-based datasets in the Canadian context. The objective of this study was to investigate the potential association between cognitive function and diabetes in a large population-based sample of middle-aged and older Canadians.
Methods: We utilized baseline data from the Canadian Longitudinal Study on Aging (N=30,097) to test our hypotheses, using five indicators of cognitive function (animal fluency, Stroop interference, reaction time, immediate and delayed memory recall). We conducted multivariate multivariable linear regression and subsequently performed tests for moderation analysis with lifestyle factors and health status.
Results: The analysis revealed that type 2 diabetes (T2DM) was associated with lower performance on most cognitive tasks, including those assessing executive function (b=0.60, 95% CI 0.31 to 0.90), reaction time (b=16.94, 95% CI 9.18 to 24.70), immediate memory recall (b=-0.10, 95% CI -0.18 to -0.02), and delayed memory recall (b=-0.12, 95% CI -0.21 to -0.02). However, no significant association was observed between other types of diabetes and cognitive performance. Moderation effects were largely null for T2DM, with the exception of alcohol intake for reaction time, and physical activity for animal fluency.
Conclusions: The study showed that individuals with T2DM exhibit poor performance on tasks that assess executive function, reaction time, and memory. Therefore, optimizing cognitive health among individuals with T2DM should be a priority in primary care. Additionally, further studies should examine this association using longitudinal data.
Introduction
Type 2 diabetes mellitus (T2DM) is a prevalent chronic condition that affects a significant number of individuals worldwide. Globally, an estimated 462 million people have T2DM, which represents 6.28% of the world’s population (1). In Canada, over 3 million people, or approximately 8.9% of the population, are living with diabetes, making it a notable public health issue (2). People with diabetes are at higher risk of developing macrovascular and microvascular complications, including cardiovascular disease, diabetic retinopathy, neuropathy, and diabetic kidney disease, which can lead to increased mortality, kidney failure, blindness, and reduced quality of life (3).
The association between T2DM and cognitive function is often given only minimal attention in clinical practice, although several previous studies have demonstrated that T2DM is linked to negative cognitive outcomes (4–7). For instance, previous research has shown that T2DM is an independent risk factor associated with a 1.5- to 2.5-fold increased risk of dementia (8, 9). The review of existing literature suggests that T2DM is generally associated with lower cognitive performance (10), particularly in tests of memory, learning, attention, and executive function (11). A recent analysis of the UK Biobank data showed that T2DM is significantly associated with a shorter digit span but not with fluid intelligence, reaction time, visual and prospective memory (12). This indicates that T2DM might predominantly affect higher-order cognitive functions like working memory and executive function. A negative correlation between the degree of cognitive functioning and the number of years since T2DM diagnosis has also been observed (7, 13). The development of cognitive dysfunction is believed to be influenced by microvascular diseases and persistent hyperglycemia that occur in T2DM (11). Additionally, T2DM has been linked to a variety of alterations in the central nervous systems, including cortical atrophy and microstructural anomalies in white matter pathways (11, 14, 15).
It is believed that the association between T2DM and cognitive function is moderated by lifestyle factors and health status. For instance, a higher burden of comorbidities has been shown to be inversely associated with cognitive function (16). According to Wei and colleagues, multimorbidity is linked to both acute decline in cognition and accelerated, persistent cognitive decline over time (17). Physical activity may also moderate the relationship between T2DM and cognitive function. For instance, prior studies have demonstrated that physical activity is not only linked to a reduced risk of cognitive decline (18, 19), but can also improve cognitive function (20). On the other hand, alcohol consumption, especially heavy drinking, has been linked to a higher risk of cognitive dysfunction and dementia (21–23).
Though prior studies have shown a link between T2DM and cognitive performance, there has not been much population-based, large-scale research on this subject in the Canadian context. Furthermore, previous studies have not thoroughly examined the moderating role of lifestyle factors and comorbidity status. Therefore, this study aimed to investigate the relationship between cognitive function and T2DM and determine whether or not lifestyle factors and health status play a role in moderating this relationship. We hypothesize that having diabetes would be associated with decreased performance on cognitive tasks and that lifestyle factors and health status would act as moderators of this association.
Method
Data source
Data from the Canadian Longitudinal Study on Aging (CLSA) were used to conduct this analysis. The CLSA is a large-scale, nationwide prospective study in Canada that included 51,338 participants at baseline. The CLSA is made up of two separate cohorts, namely tracking and comprehensive. The tracking cohort consists of 21,241 participants recruited across 10 Canadian provinces. A 60-minute telephone interview was conducted with these subjects. The comprehensive cohort comprises 30,097 participants who were recruited from 25-50 km radius of one of the 11 Data Collection Sites (DCS) (Vancouver, Victoria, Calgary, Winnipeg, Hamilton, Ottawa, Montréal, Sherbrooke, Halifax, and St. John’s) in 7 Canadian provinces (24–26). These participants underwent 90-minute in-person interviews at their homes and visited a data collection facility for a thorough evaluation.
The collection of baseline data for the CLSA began in 2010 and was completed in 2015. Three sources were used to recruit participants for the CLSA: the Canadian Community Health Survey-Healthy Aging (for the CLSA tracking cohort only), provincial health registries, and telephone sampling using random digit dialing (24, 25, 27). The CLSA recruited men and women who were between the ages of 45 to 85 years. However, residents of three Canadian territories, occupants of federally administered First Nations reserves or other First Nations communities in the provinces, Canadian military personnel serving full-time, people residing in long-term care facilities, people who were cognitively impaired at the time of contact, and people who could not communicate in one of the two official languages (English or French) of Canada were excluded during baseline recruitment (24, 25, 27). Each participant provided their written consent to take part in the CLSA. The sampling strategy and study design have been extensively described in other publications (24, 25).
As several of the relevant cognitive variables (such as the Stroop Neurological Screen Test [SNST] and the Choice Reaction Time [CRT] Test) were not available for the tracking cohort participants, this study solely used baseline data of the comprehensive cohort. Therefore, 30,097 Canadian men and women between the ages of 45 and 85 were included in this cross-sectional analysis.
Measures
Dependent variables
Stroop neurological screen test
SNST is considered a robust measure of executive function (28, 29). In the task, participants are asked to determine the color of the font used to write a word while ignoring the actual meaning of the word. The time it takes to recognize the color increases in comparison to a baseline condition when the written word is inconsistent with the font color (for example, when “Red” is written in “Green” font).
The CLSA employed the Victoria version of the Stroop task (30). In this task, participants were shown three stimulus cards in succession. The first card was a “neutral” condition where a list of neutral words was printed using various ink colors. Participants were instructed to read the neutral words from left to right for each row. The second card was a “congruent” condition where a number of “X”s were printed with different ink colors. Participants were asked to name the color of the ink used to print each “X”. The third card presented an "incongruent" condition where several color words were printed in a manner such that the color words and the ink color did not coincide (for instance, the word "Green" is written in "Blue" ink). Participants were asked to quickly identify the color of the ink used to write the words, omitting their intended meaning.
The responses of the participants and the time taken to complete each block were recorded. The metric of interest was Stroop interference, which represents the delay in completing the incongruent block due to distracting stimuli compared to the congruent condition. This was calculated by subtracting the time required to finish the congruent block from that of the incongruent block.
Choice reaction time test
This task measures general alertness and processing speed (31). The CRT was administered using a touch-enabled computer screen. The task began with four horizontal plus signs and one key sign underneath each plus sign on the screen (30). The plus signs were randomly changed into boxes, and the participants had to press the key sign underneath the box as rapidly as they could. There were 52 iterations of this exercise (30). The computer program automatically generated the test scores. The mean reaction time was calculated by averaging the reaction time of correct responses while omitting timeouts and wrong responses.
Animal fluency test
This task is a measure of verbal fluency and is frequently used to screen cognitive impairment and dementia. For this task, participants are asked to recite as many animals as they can in 60 seconds, with one point awarded for each distinct animal correctly named (30). During the CLSA data collection, the responses of the participants were recorded and uploaded to a database. Test scores were then calculated using a validated algorithm (30). In terms of interpretation, it is assumed patient may be in the early stages of dementia or developing cognitive impairment if they can only name 15 animals or fewer in the allotted 60 seconds (32).
Rey auditory verbal learning test (Rey I)
This task is a widely used neuropsychological memory test that is highly sensitive in detecting early cognitive decline. In this test, a participant is presented with a list of 15 recorded words and is given 90 seconds to recall as many words as possible, in any order (30, 33). Each correctly recalled word (or approved variant) earns the participant one point, while zero points are awarded for any other word provided. The higher the score, the better the memory and verbal learning performance.
Delayed rey auditory verbal learning test (Rey II)
The Rey II is another memory task that requires participants to recall the same list of recorded words played in the Rey I task. In this case, however, they only have 60 seconds to recall as many words as possible in any order (30, 33). The same scoring system applies, with one point being awarded for each primary or variant word correctly recalled, and zero points for any other word provided. By measuring the retention and retrieval of information over a delay period, Rey II adds an additional level of complexity to the assessment.
Independent variables
Diabetes status
Two variables were used to determine diabetes status (and type). Participants were questioned about their diabetes status as follows: “Has a doctor ever told you that you have diabetes, borderline diabetes or that your blood sugar is high?” (34). Those who responded “No” were assumed not to have diabetes. The following question was then asked to participants who responded “Yes” in order to determine the type of diabetes: “Were you diagnosed with: Type I, Type II, or Neither” (34). A nominal variable was then created using the following categories: Type II diabetes, other types of diabetes, and no diabetes.
Covariates and moderators
Age
The age of the participants (in years) was determined based on their birthdate and provided as a numerical variable in the data set (35). For descriptive analyses, it was further transformed into an ordinal variable with the following age ranges: 45–54, 55–64, 65–74, and 75+ years.
Sex. Participants were asked to report their biological sex at birth; men were given the code 1, and women were given the code 0 (35).
Ethnicity
This variable was coded as 1 and 0, where 1 represents White ethnicity, and 0 represents ethnicities other than White (35).
Income
Income was evaluated based on the overall household income. The following question was asked to the participants: “What is your best estimate of the total household income received by all household members, from all sources, before taxes and deductions, in the past 12 months?” (35). The following ranges were used to categorize this variable:< $20,000, $20,000–$50,000, $50,000–$100,000, $100,000–$150,000, and ≥$150,000 (35). The missing values for this variable (n = 1393) were recoded as “no response.”
Education
Education level was determined using two variables. Participants were first asked if they had completed their high school education. Next, participants were asked: “Have you received any other education that could be counted toward a degree, certificate, or diploma from an educational institution?” (35). Respondents who answered “no” were regarded as having a level of education that was “high school or below”. The following question was then posed to those who responded “yes” in order to determine the level of education attained: “What is the highest degree, certificate, or diploma you have obtained?” (35). These variables were combined to create an ordinal variable that had three categories: “high school or less”, “certificates or degrees below a bachelor’s”, and “bachelor’s or higher”.
Residence
Residential area was classified as either rural or urban. In the original variable, the residence was classified into the following categories: rural, urban core, urban fringe, urban population center outside a census metropolitan area, and census agglomeration, secondary core, and postal code link to dissemination area (35). This variable was recoded as rural and urban, with urban including all nonrural groups.
Body mass index
The dataset included each participant’s height (in metres) and weight (in kilograms) (34). The formula for the BMI variable was weight in kg divided by height in m2. A BMI categorical variable was also created, with the following ranges: underweight (BMI< 18.5), normal (BMI = 18.5-24.9), overweight (BMI = 25–29.9), and obese (BMI 30).
Physical activity
The following question was asked to the participants: “Over the past 7 days, how often did you take a walk outside your home or yard for any reason? For example, for pleasure or exercise, walking to work, walking the dog, etc.” (36). The following responses options were provided: never, seldom (1 to 2 days), sometimes (3 to 4 days) and often (5 to 7 days). This variable was dichotomized as follows: seldom ( 2 days) and often (>3 days).
Comorbidity
The sum of the following 25 chronic conditions was used to create a comorbidity index variable: chronic obstructive pulmonary disease, asthma, heart disease, heart attack, hypertension, stroke, peripheral vascular disease, Parkinson’s disease, epilepsy, multiple sclerosis, dementia, migraine, rheumatoid arthritis, osteoarthritis, other arthritis, back problems, hyperthyroidism, hypothyroidism, depression, mood disorder, anxiety disorder, cancer, bowel disorder, stomach ulcer, and kidney disease (34, 37). An ordinal comorbidity variable was also created as follows with the following categories: no comorbidity, 1-2 comorbidities and > 2 comorbidities.
Alcohol intake
To understand the level of alcohol consumption, participants were asked the following question: “About how often during the past 12 months did you drink alcohol?” (35). The response options were almost every day (including 6 times a week), 4-5 times a week, 2-3 times a week, once a week, 2-3 times a month, about once a month, less than once a month, and never. This variable was later dichotomized into two categories: 1 time per week and 2-7 times per week.
Statistical analyses
The R statistical software package, version 4.0.5, was used for statistical analysis. In accordance with the recommendation of the CLSA, we employed trimmed weights for descriptive analyses and analytic weights for inferential analyses (27). The study variables were first subjected to descriptive analysis. Weighted percentages and means were calculated for each of the categorical and continuous variables, respectively.
Multivariate multivariable regressions were conducted to assess the relationship between cognitive function and diabetes status. A total of 3 models were evaluated. Model 1 investigated the relationship between cognitive performance and diabetes status in an unadjusted model. Model 2 was a partially adjusted model controlling for sociodemographic variables (e.g., age, sex, ethnicity, income and education). Model 3 was a fully adjusted model further controlling for residence, physical activity, alcohol consumption, and comorbidity.
Finally, moderation analyses were performed to determine if the relationship between T2DM status and cognitive outcomes varied as a function of a number of exogenous variables. Physical activity, alcohol consumption, and comorbidity load were all examined as putative moderators. In all analyses, two-sided tests with 95% confidence intervals were used, and a significance level of P<.05 was applied to determine statistical significance.
Results
Table 1 provides an overview of the sociodemographic, lifestyle, and health-related characteristics of the CLSA comprehensive cohort (n = 30,097). The participants were a mean age of 59.49 years and 50.36% were female. The majority of participants identified as Caucasian (94.7%), and a large proportion reported an annual household income of $50,000 or more (72.29%) and at least a bachelor’s degree (46.43%). Most participants resided in urban areas (91.53%). The mean number of comorbidities was 2.35 (95% CI 2.32, 2.38) but 42.97% of participants reported having at least 1-2 comorbidities. The average BMI of the participants was 27.8 (95% CI 27.72, 27.88), and 27.47% were obese. In terms of lifestyle behaviors, the majority reported frequent walking activities (68.5%) and infrequent drinking ( 1 time per week, 50.53%). The majority of participants did not have diabetes (84.73%); 7.45% had a diagnosis of T2DM and 7.82% had a diagnosis of “T1DM or other type of diabetes.
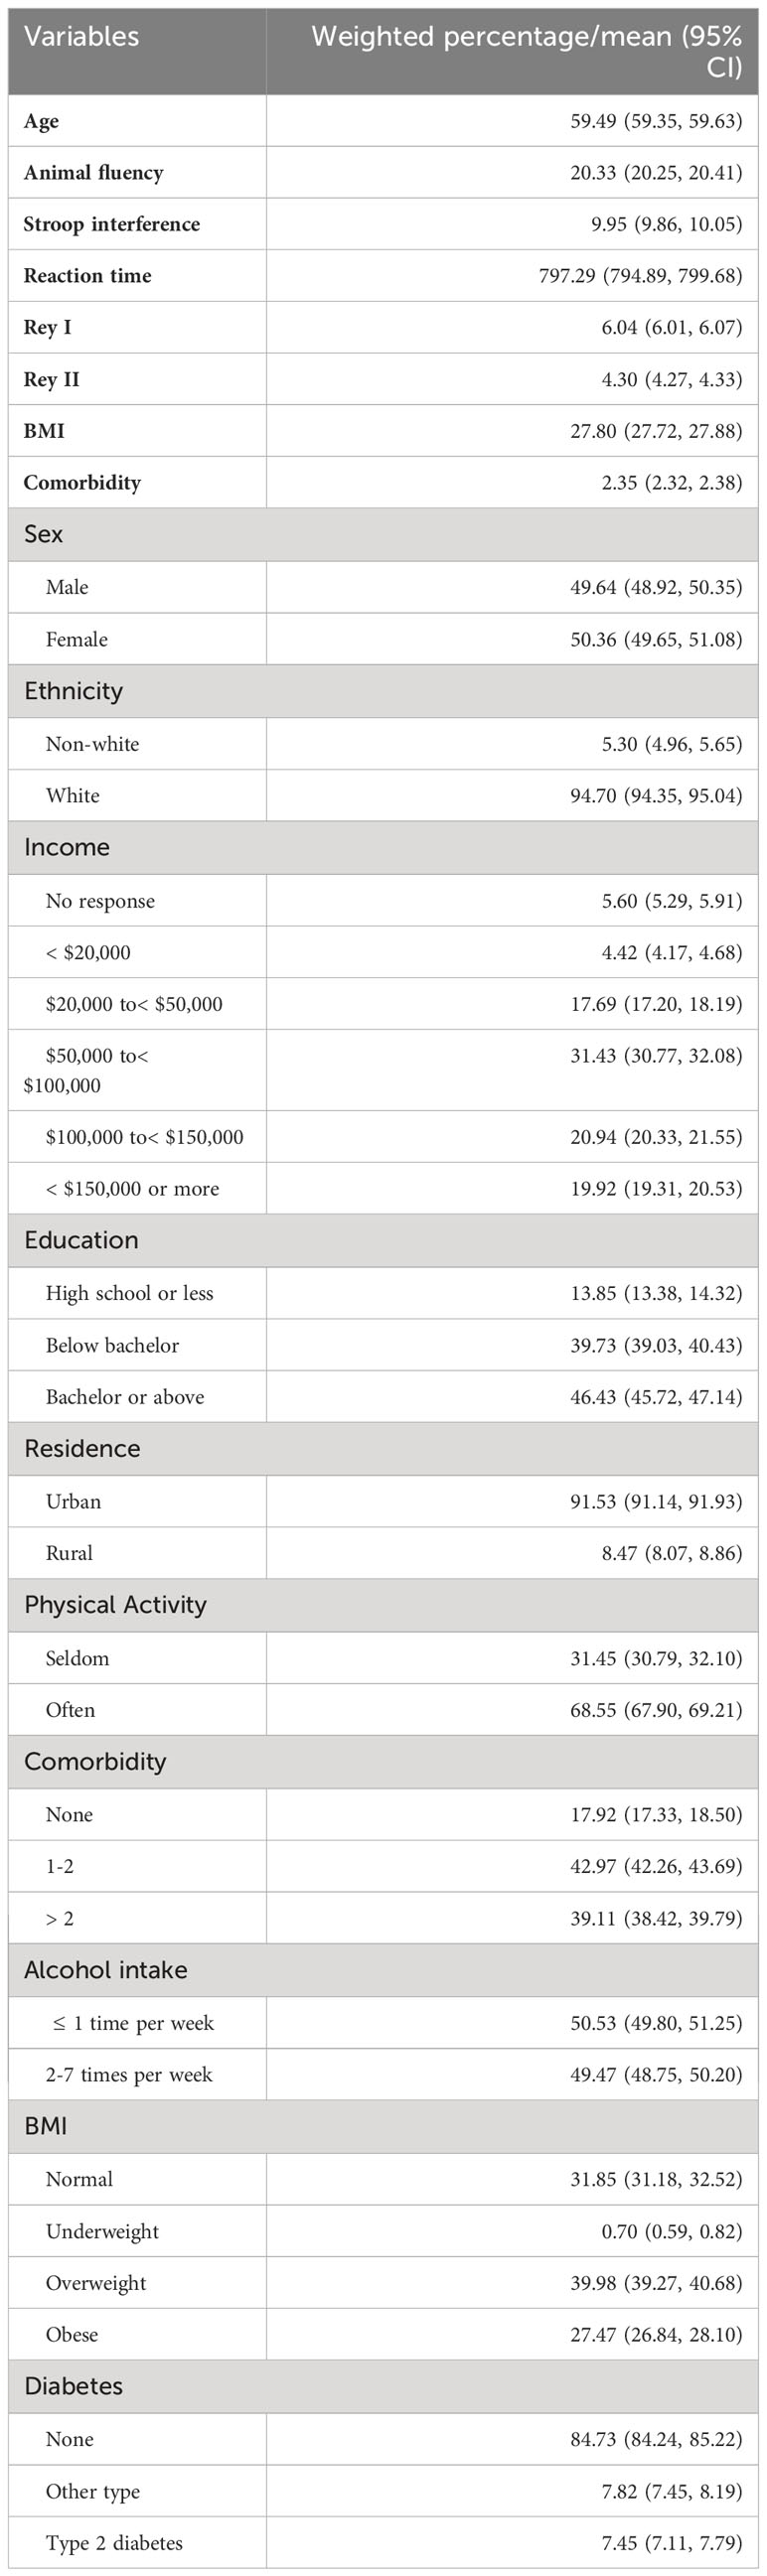
Table 1 Sample characteristics.
In unadjusted models, T2DM was associated with significantly worse performance on all cognitive outcomes (Table 2). In fully adjusted models, most of the sociodemographic variables were significantly associated with cognitive function. When compared to women, men exhibited better performance in the reaction time task (b = -19.74, 95% CI -23.75, -15.72, p< 0.001) but worse performance in the Stroop task (b = 0.47, 95% CI 0.32, 0.62, p< 0.001) and the memory task (Rey I: b = -0.84, 95% CI -0.88, -0.80, p< 0.001; Rey II: b = -1.01, 95% CI -1.06, -0.96, p< 0.001). BMI was not significantly associated with most of the cognitive outcomes, except for the Stroop task, where an increase in BMI was associated with higher Stroop interference (b = 0.02, 95% CI 0.00, 0.03; p = 0.018). Having two or more comorbidities showed a significant association with animal fluency and reaction time tasks, but the direction of the association suggests better verbal fluency (b = 0.20, 95% CI 0.02, 0.39, p = 0.033) and slower reaction time (b = 6.09, 95% CI 0.20, 11.99, p = 0.043). Appendix Table 1 presents the associations between cognitive variables and other sociodemographic variables.
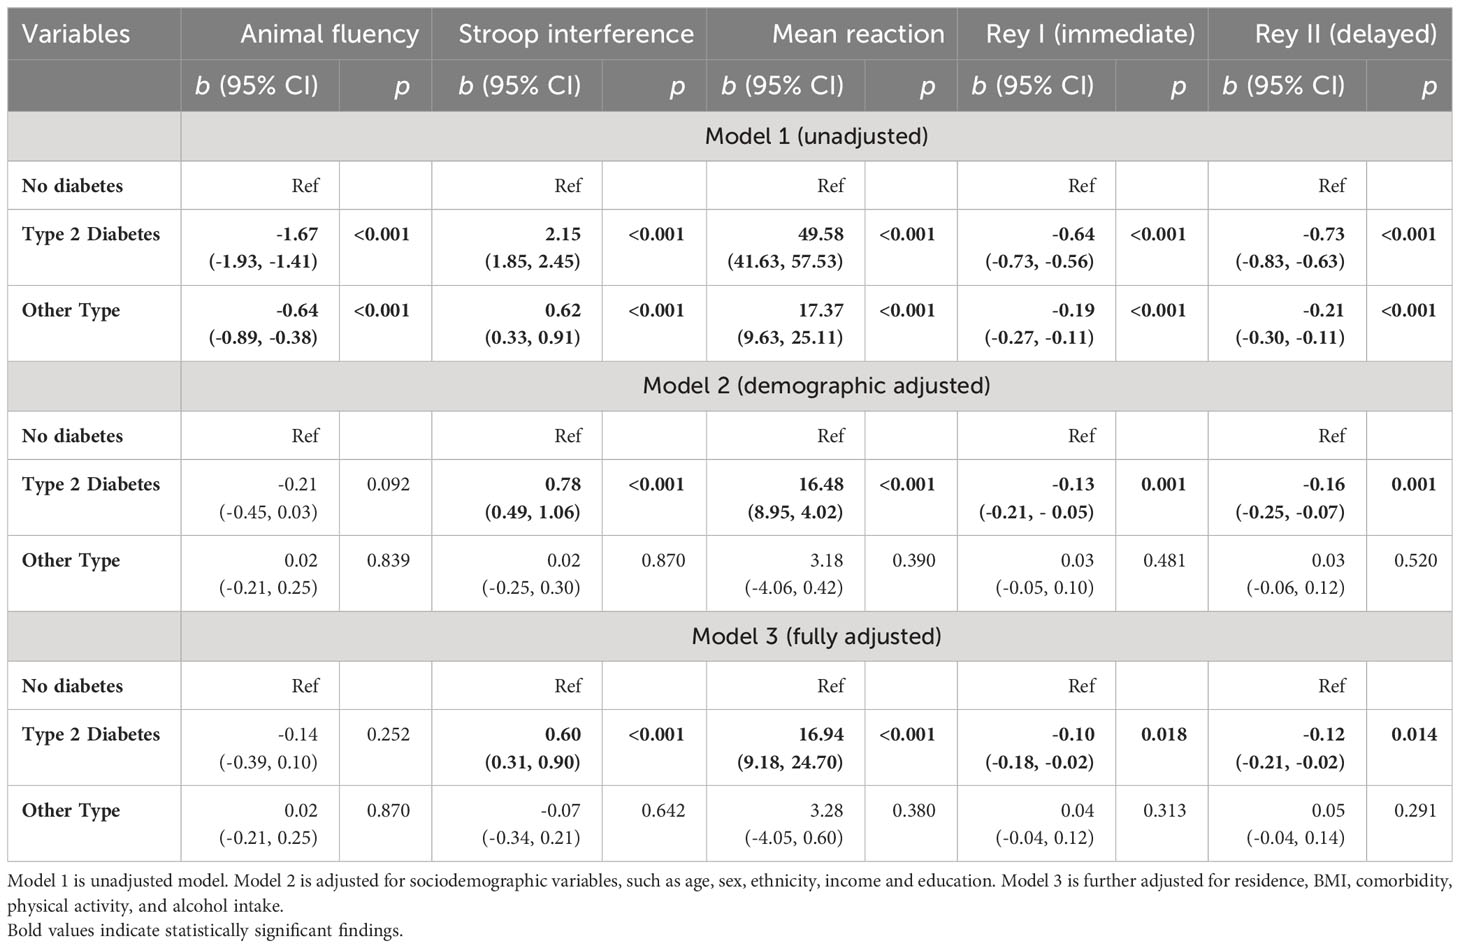
Table 2 Multivariate multivariable regression with cognitive function as an outcome variable (Model 1-3).
Consistent with our hypotheses, there was a reliable association between T2DM and lower Stroop performance (b = 0.60, 95% CI 0.31, 0.90, p< 0.00), slower reaction time (b = 16.94, 95% CI 9.18, 24.70, p< 0.001), lower performance on the Rey I (b = -0.10, 95% CI -0.18, -0.02, p = 0.018) and Rey II (b = -0.12, 95% CI -0.21, -0.02, p = 0.014) memory test in fully adjusted models. Most moderating effects were null. However, T2DM effects on simple reaction time were amplified for those who consumed alcohol 2-7 times per week (b = -16.19, 95% CI -32.32, -0.07, p = 0.049), and animal fluency effects were amplified for those who “seldom” engaged in physical activity (b = 0.64, 95% CI 0.16, 1.13, p = 0.009) (Table 3). In a separate analysis, we examined the categorical BMI variable in interaction with the diabetes status. The results showed that obesity status was significantly associated with animal fluency (b = -0.21, 95% CI -0.39, -0.03, p = 0.023), Stroop interference (b = 0.32, 95% CI 0.11, 0.54, p = 0.004), and Rey I (b = -0.08, 95% CI -0.14, -0.02, p = 0.011) and Rey II (b = -0.12, 95% CI -0.19, -0.05, p = 0.001) memory tasks. However, the interaction terms were mostly nonsignificant (Appendix Table 2).
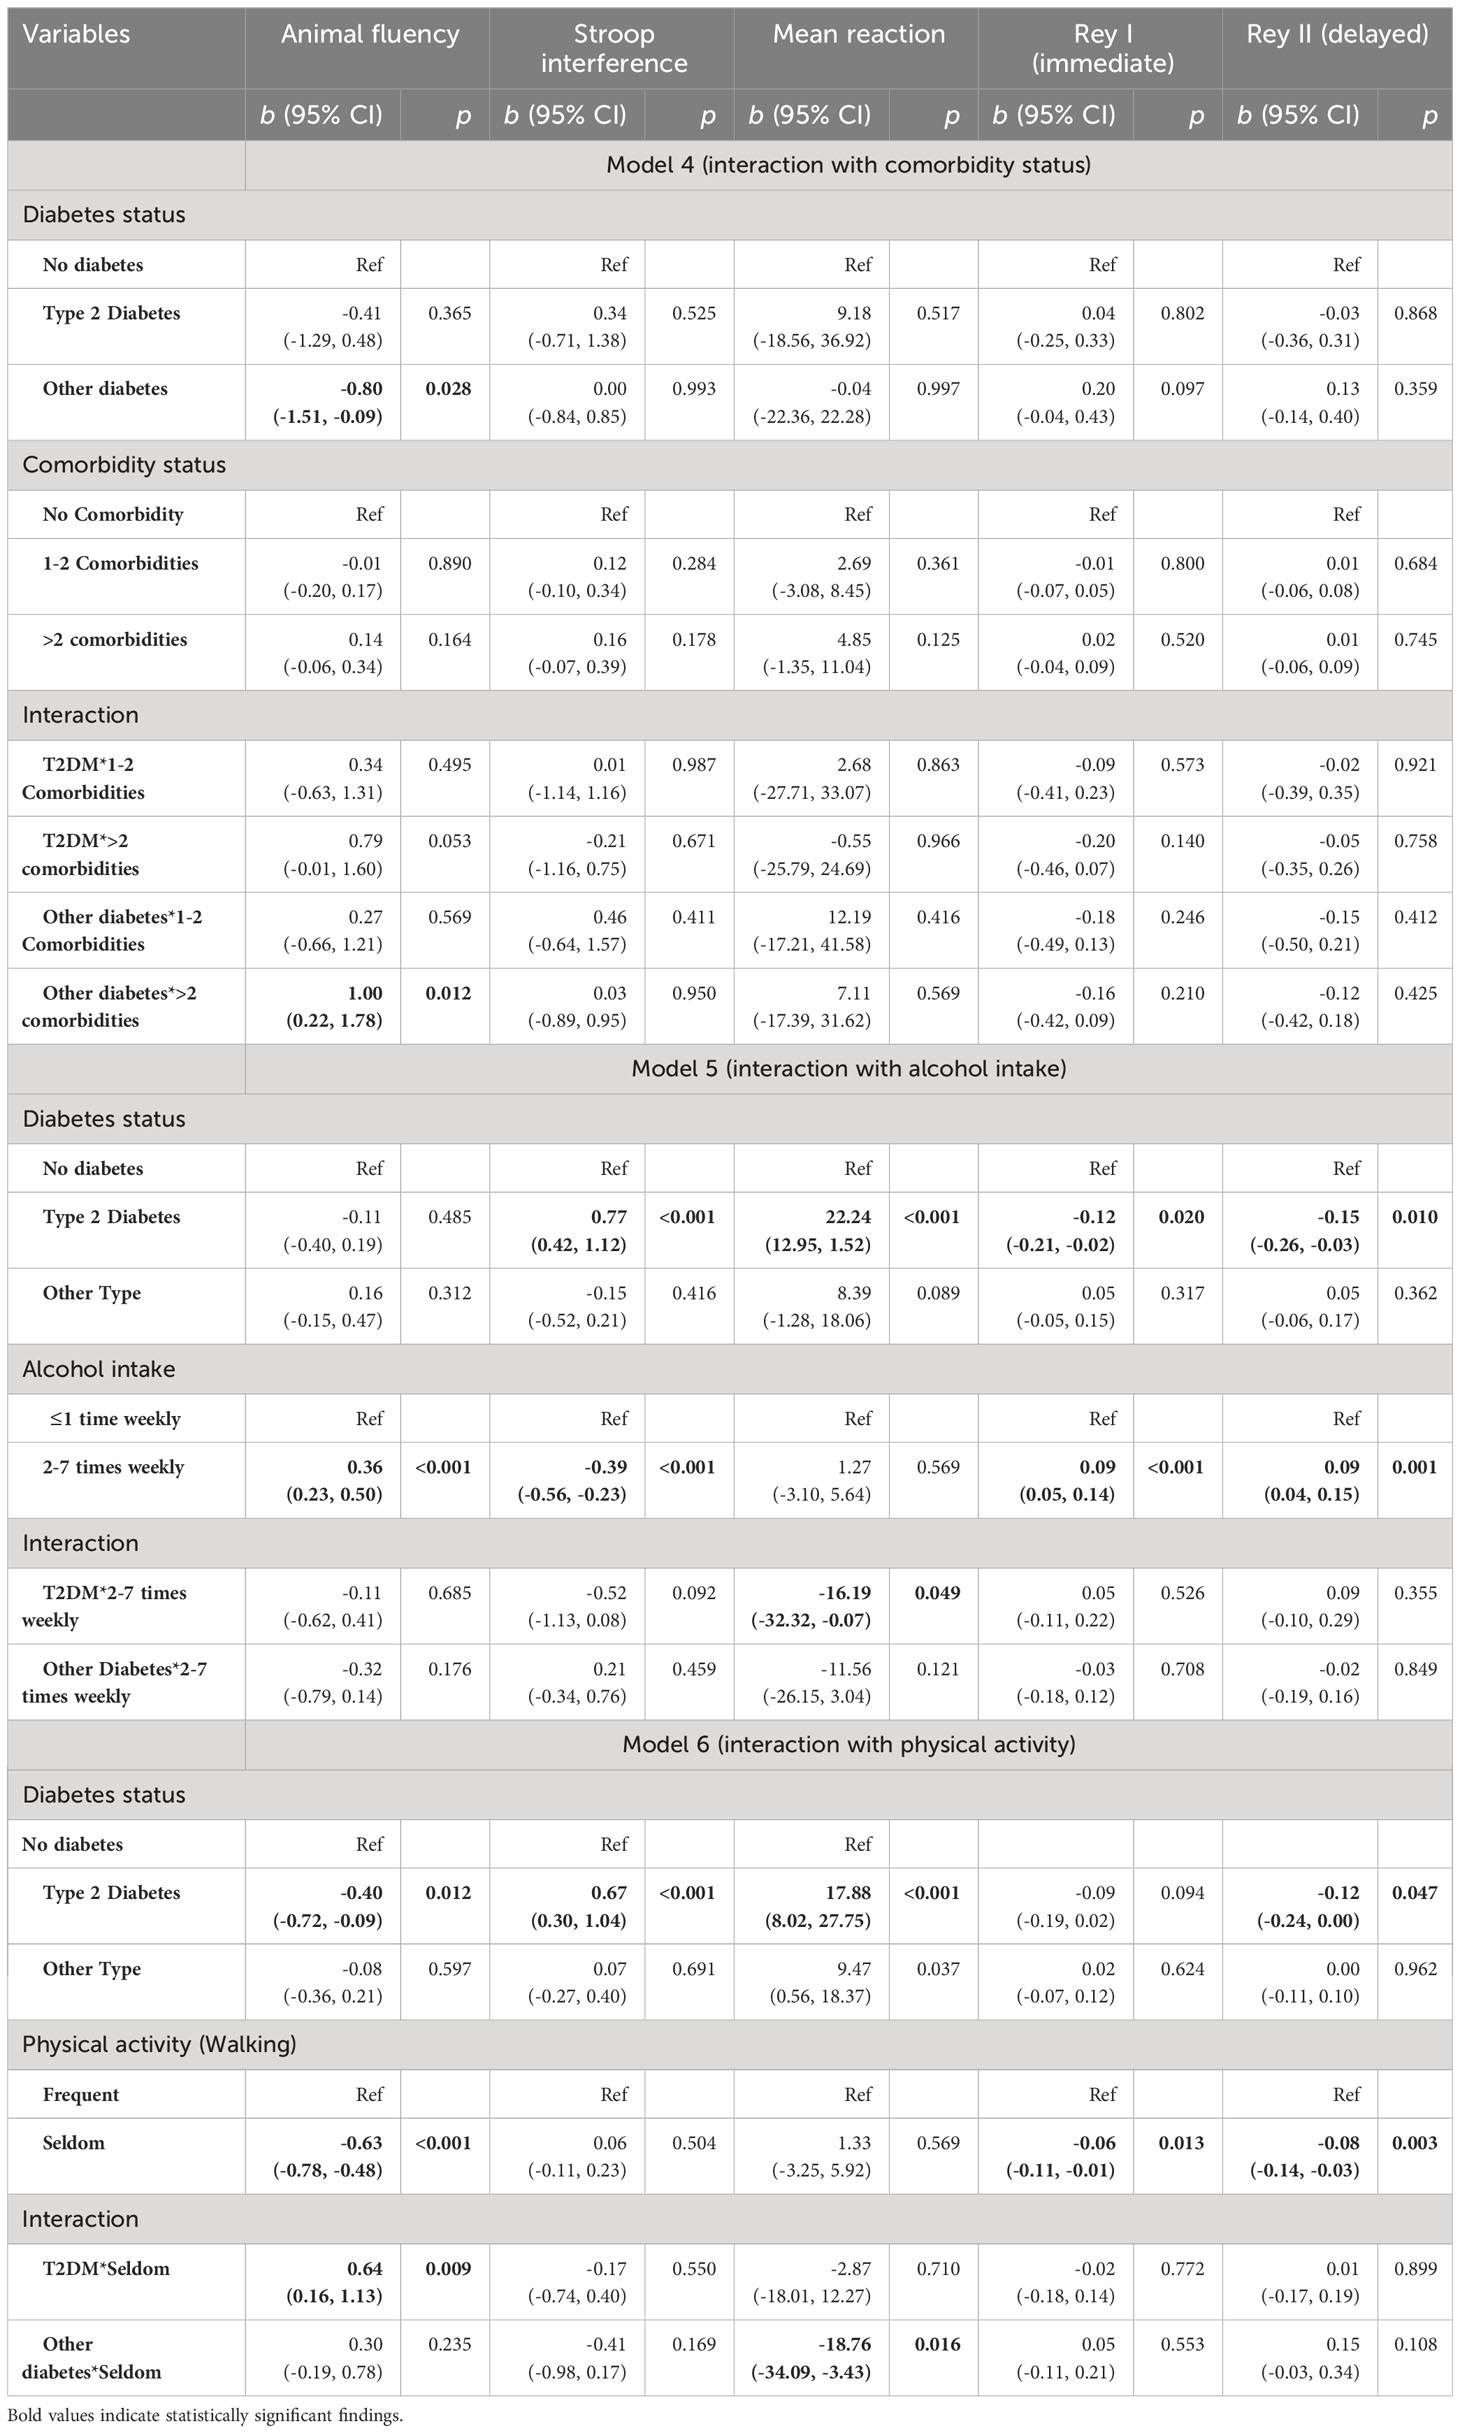
Table 3 Moderation analyses (Model 4-6).
Discussion
Using baseline data from that Canadian Longitudinal Study on Aging (CLSA), we examined the association between diabetes status and several domains of cognitive function, including executive function, simple processing speed, and memory. Our findings indicated that T2DM was associated with impaired cognitive task performance compared to those without diabetes on all five cognitive indicators, with substantial effects on all tests in unadjusted models, and across most tests in fully adjusted models. Other forms of diabetes were not associated with significantly impaired performance on any of the cognitive indicators in fully adjusted models. Our findings are in line with previous literature, including a prior meta-analysis documenting reliable deficits in executive function among those living with T2DM (38, 39). Moderation analyses suggest that frequent alcohol usage and sedentary behavior modify some of the cognitive impact of T2DM. These moderation effects may be a function of greater range of variability in each of these. Given that most moderation effects were null, the most prudent interpretation is that T2DM status is associated with cognitive outcomes with significant uniformity across lifestyle and comorbidity levels.
The current findings are important to the extent that they document reliable differences in cognitive measures among those living with T2DM. The executive functions and simple reaction time are both important in everyday life domains. For example, the ability to think quickly through problems and solve them effectively, and to react to real-time changes in the physical environment may be hindered by slower cognitive processing speed (i.e., the cognitive ability underlying simple reaction time task performance). Likewise, a large volume of research links executive function task performance with impaired regulation of reflexive behaviors, thoughts and emotional responses over time. The ability to keep in check reflexive behaviors and emotional responses is important for many domains of interpersonal functioning in the home, workplace, and social spheres. The provision of social support from others, for instance, can be thwarted by such tendencies, leaving someone with diabetes both adversely affected on a cognitive level, but also vulnerable on a social level, in terms of available emotional supports. Protecting and optimizing brain health may be important for those living with T2DM, in part because such sensitive and consequential cognitive functions are likely to be affected. Among known protective factors, exercise and avoidance of alcohol and other substances of abuse may be important factors for protecting cognitive health in the T2DM context, above and beyond simply facilitating the metabolic aspects of disease management. Given that effects were stronger for those with more alcohol consumption and more sedentary lifestyles, these should be discouraged among those with T2DM, using brain health as a rationale.
Form the above perspective, if reliable decrements in processing speed and executive function are an outcome of T2DM disease process itself, it is possible that good glycemic control may be a mitigating factor. This possibility should be explored in future analyses involving CLSA and similar datasets. Some prior studies have shown that favorable glycemic control is associated with better performance on cognitive tasks in other studies (40–42), although it is not clear if this reflects a cause or consequence of the glycemic control.
The exploration of the underlying mechanisms of T2DM-related cognitive decline is beyond the scope of this paper. However, it is important to recognize that cognitive impairment in T2DM can result from various pathological processes. Commonly hypothesized pathways include small-vessel disease and stroke, chronic hyperglycemia, severe hypoglycemic episodes, insulin resistance and hyperinsulinemia, and chronic inflammation (43). Patients with T2DM frequently present with multiple cardiovascular risk factors, including hypertension, obesity, dyslipidemia, hyperinsulinemia, and proinflammatory states. It is believed that the convergence of these major risk factors accelerates small vessel disease and stroke, eventually leading to the development of cognitive impairment and dementia (44, 45). Prior research has consistently demonstrated a reliable association between chronic hyperglycemia and diminished cognitive performance in patients with T2DM (9, 46, 47). Notably, postprandial hyperglycemia exhibits a stronger association with cognitive impairment when compared to fasting blood glucose (48, 49). Conversely, maintaining tight glycemic control can decelerate cognitive decline, as indicated in a recent meta-analysis by Tang and colleagues (42). Hyperglycemia can lead to cerebral microvascular alterations, irregularities in synaptic plasticity, increased oxidative stress, and the accumulation of advanced glycation end products, all of which contribute to the development of cognitive impairment (50, 51).
While optimal glycemic control is desired for T2DM patients, it is important to note that severe hypoglycemia can often occur in the pursuit of intensive glucose control. Severe hypoglycemia may lead to neuronal cell death, platelet aggregation, and fibrinogen formation, which can result in permanent neurological damage and accelerate cognitive impairment (52). Previous reports suggest that recurrent incidents of severe hypoglycemia can increase the risk of cognitive impairment by a factor of 1.5 to 2.0 (52, 53). Individuals with T2DM typically exhibit insulin resistance and compensatory hyperinsulinemia, both of which play crucial roles in mediating cognitive impairment. Insulin possesses vital neurotropic properties, with its receptors being abundant in brain regions associated with learning and memory (54). Prolonged hyperinsulinemia is known to downregulate insulin receptors, resulting in impaired insulin transport into brain tissues (55) and contributing to learning and memory deficits, possibly through neuroglial energy crises (54, 56). Additionally, hyperinsulinemia can disrupt the metabolism of amyloid beta protein, leading to its accumulation and toxic effects in the brain (50).
Patients with T2DM often present higher levels of circulating inflammatory markers (57). Evidence from previous studies suggests that elevated levels of inflammatory cytokines may be linked to diminished cognitive abilities in T2DM patients (9, 46). Increased cytokine levels are believed to contribute to dementia either directly affecting the brain or by fostering vascular disease or insulin resistance (58). Dysregulation of the hypothalamic-pituitary axis and high cortisol levels in diabetic patients are also thought to contribute to cognitive impairment by facilitating microvascular abnormalities (9, 46). In terms of genetic predisposition, earlier studies have reported that individuals with both diabetes and an APOE ϵ4 allele exhibit more pronounced cortical changes, reductions in cognitive function, and an increased risk for dementia (59–61).
There are a number of important strengths and limitations of the current study. In terms of the former, the CLSA is a very large and demographically diverse population cohort, with ample statistical power to detect subtle effects. Likewise, all of the indicators of cognitive function were standardized and widely used measures of the underlying cognitive constructs. Limitations include the use of self-reported diabetes status in the CLSA as well as sub-typing into Type 1, Type 2 or other. Recall biases and lack of knowledge about their own status may impact the validity of this measure of diabetes status. Further, it is estimated that those with T2DM have likely had the disease for several years prior to formal diagnosis, meaning that a number of those classified as diabetic in this (and any) sample is likely a subset of the true number; the existence of false negatives may dilute the strength of relationship between diabetes status and cognitive consequences of diabetes. From this perspective, the associations between T2DM and cognitive function may be underestimated. Lastly, it is important to note that given the predominant representation of Caucasian participants residing in urban areas within the CLSA comprehensive cohort, the findings of this study may not be entirely representative of a more diverse or wider population.
Conclusion
In conclusion, we found evidence that the presence of T2DM was associated with worse performance on tests of simple processing speed, executive function and memory in a large sample of middle-aged and older adults. Findings were robust to adjustment for a wide variety of demographic and disease-related confounders. The moderation analyses were mostly nonsignificant, indicating largely uniform decrements across lifestyle and comorbidity categories. Future studies should explore prospective relationships between T2DM and cognitive outcomes over longer periods of time, using functional, structural and connectivity analyses.
Data availability statement
The data analyzed in this study is subject to the following licenses/restrictions: Data are available from the Canadian Longitudinal Study on Aging (www.clsa-elcv.ca) for researchers who meet the criteria for access to de-identified CLSA data. Requests to access these datasets should be directed to https://www.clsa-elcv.ca/data-access.
Ethics statement
The studies involving humans were reviewed and approved by the Office of Research Ethics at the University of Waterloo. The patients/participants in the CLSA provided their written informed consent to participate in this study.
Author contributions
MNS: Conceptualization, Data curation, Formal Analysis, Investigation, Methodology, Project administration, Resources, Software, Validation, Writing – original draft, Writing – review & editing. RR: Formal Analysis, Software, Writing - review & editing. PH: Conceptualization, Funding acquisition, Investigation, Methodology, Project administration, Resources, Supervision, Validation, Writing – review & editing.
Funding
The author(s) declare financial support was received for the research, authorship, and/or publication of this article. This work was supported by an operating grant to the last author (PH) from the Natural Sciences and Engineering Research Council of Canada (RGPIN-2019-04606) and Canadian Institutes for Health Research (CIHR), Institute for Population and Public Health (GA3-177733). MNS was provided salary support from the latter mechanism as well as a postdoctoral fellowship from McMaster University.
Acknowledgments
This research was made possible using the data/biospecimens collected by the Canadian Longitudinal Study on Aging (CLSA). Funding for the Canadian Longitudinal Study on Aging (CLSA) is provided by the Government of Canada through the Canadian Institutes of Health Research (CIHR) under grant reference: LSA 94473 and the Canada Foundation for Innovation, as well as the following provinces, Newfoundland, Nova Scotia, Quebec, Ontario, Manitoba, Alberta, and British Columbia. This research has been conducted using the CLSA Baseline Comprehensive Dataset 4.1, under Application Number 1906024. The CLSA is led by Drs. Parminder Raina, Christina Wolfson and Susan Kirkland. Data are available from the Canadian Longitudinal Study on Aging (www.clsa-elcv.ca) for researchers who meet the criteria for access to de-identified CLSA data.
Conflict of interest
The authors declare that the research was conducted in the absence of any commercial or financial relationships that could be construed as a potential conflict of interest.
Publisher’s note
All claims expressed in this article are solely those of the authors and do not necessarily represent those of their affiliated organizations, or those of the publisher, the editors and the reviewers. Any product that may be evaluated in this article, or claim that may be made by its manufacturer, is not guaranteed or endorsed by the publisher.
Author disclaimer
The opinions expressed in this manuscript are the author’s own and do not reflect the views of the Canadian Longitudinal Study on Aging.
References
1. Khan MAB, Hashim MJ, King JK, Govender RD, Mustafa H, Al Kaabi J. Epidemiology of type 2 diabetes - global burden of disease and forecasted trends. J Epidemiol Glob Health (2020) 10(1):107–11. doi: 10.2991/jegh.k.191028.001
2. Public Health Agency of Canada. Framework for diabetes in Canada. Available at: https://www.Canada.ca/en/public-health/services/publications/diseases-conditions/framework-diabetes-Canada.html (Accessed 4 May, 2023).
3. Cole JB, Florez JC. Genetics of diabetes mellitus and diabetes complications. Nat Rev Nephrol (2020) 16(7):377–90. doi: 10.1038/s41581-020-0278-5
4. Palta P, Schneider AL, Biessels GJ, Touradji P, Hill-Briggs F. Magnitude of cognitive dysfunction in adults with type 2 diabetes: a meta-analysis of six cognitive domains and the most frequently reported neuropsychological tests within domains. J Int Neuropsychol Soc (2014) 20(3):278–91. doi: 10.1017/s1355617713001483
5. Xue M, Xu W, Ou YN, Cao XP, Tan MS, Tan L, et al. Diabetes mellitus and risks of cognitive impairment and dementia: A systematic review and meta-analysis of 144 prospective studies. Ageing Res Rev (2019) 55:100944. doi: 10.1016/j.arr.2019.100944
6. Cheng G, Huang C, Deng H, Wang H. Diabetes as a risk factor for dementia and mild cognitive impairment: a meta-analysis of longitudinal studies. Intern Med J (2012) 42(5):484–91. doi: 10.1111/j.1445-5994.2012.02758.x
7. van den Berg E, Kloppenborg RP, Kessels RP, Kappelle LJ, Biessels GJ. Type 2 diabetes mellitus, hypertension, dyslipidemia and obesity: A systematic comparison of their impact on cognition. Biochim Biophys Acta (2009) 1792(5):470–81. doi: 10.1016/j.bbadis.2008.09.004
8. Profenno LA, Porsteinsson AP, Faraone SV. Meta-analysis of Alzheimer's disease risk with obesity, diabetes, and related disorders. Biol Psychiatry (2010) 67(6):505–12. doi: 10.1016/j.biopsych.2009.02.013
9. Strachan MW, Reynolds RM, Marioni RE, Price JF. Cognitive function, dementia and type 2 diabetes mellitus in the elderly. Nat Rev Endocrinol (2011) 7(2):108–14. doi: 10.1038/nrendo.2010.228
10. Ryan CM. Diabetes-associated cognitive dysfunction. In: Neuropsychology of cardiovascular disease. Mahwah, NJ: Psychology Press (2001). p. 77–98.
11. McCrimmon RJ, Ryan CM, Frier BM. Diabetes and cognitive dysfunction. Lancet (2012) 379(9833):2291–9. doi: 10.1016/s0140-6736(12)60360-2
12. Whitelock V, Rutters F, Rijnhart JJM, Nouwen A, Higgs S. The mediating role of comorbid conditions in the association between type 2 diabetes and cognition: A cross-sectional observational study using the UK Biobank cohort. Psychoneuroendocrinology (2021) 123:104902. doi: 10.1016/j.psyneuen.2020.104902
13. Elias PK, Elias MF, D'Agostino RB, Cupples LA, Wilson PW, Silbershatz H, et al. NIDDM and blood pressure as risk factors for poor cognitive performance. The Framingham Study. Diabetes Care (1997) 20(9):1388–95. doi: 10.2337/diacare.20.9.1388
14. Manschot SM, Brands AM, van der Grond J, Kessels RP, Algra A, Kappelle LJ, et al. Brain magnetic resonance imaging correlates of impaired cognition in patients with type 2 diabetes. Diabetes (2006) 55(4):1106–13. doi: 10.2337/diabetes.55.04.06.db05-1323
15. Gao S, Chen Y, Sang F, Yang Y, Xia J, Li X, et al. White matter microstructural change contributes to worse cognitive function in patients with type 2 diabetes. Diabetes (2019) 68(11):2085–94. doi: 10.2337/db19-0233
16. Loprinzi PD. Multimorbidity, cognitive function, and physical activity. Age (Dordr) Feb (2016) 38(1):8. doi: 10.1007/s11357-016-9874-5
17. Wei MY, Levine DA, Zahodne LB, Kabeto MU, Langa KM. Multimorbidity and cognitive decline over 14 years in older Americans. J Gerontol A Biol Sci Med Sci (2020) 75(6):1206–13. doi: 10.1093/gerona/glz147
18. Jedrziewski MK, Lee VM, Trojanowski JQ. Physical activity and cognitive health. Alzheimers Dement (2007) 3(2):98–108. doi: 10.1016/j.jalz.2007.01.009
19. Yaffe K, Barnes D, Nevitt M, Lui LY, Covinsky K. A prospective study of physical activity and cognitive decline in elderly women: women who walk. Arch Intern Med (2001) 161(14):1703–8. doi: 10.1001/archinte.161.14.1703
20. Lautenschlager NT, Cox KL, Flicker L, Foster JK, van Bockxmeer FM, Xiao J, et al. Effect of physical activity on cognitive function in older adults at risk for Alzheimer disease: a randomized trial. JAMA (2008) 300(9):1027–37. doi: 10.1001/jama.300.9.1027
21. Zuccalà G, Onder G, Pedone C, Cesari M, Landi F, Bernabei R, et al. Dose-related impact of alcohol consumption on cognitive function in advanced age: results of a multicenter survey. Alcohol Clin Exp Res (2001) 25(12):1743–8. doi: 10.1111/j.1530-0277.2001.tb02185.x
22. Xu G, Liu X, Yin Q, Zhu W, Zhang R, Fan X. Alcohol consumption and transition of mild cognitive impairment to dementia. Psychiatry Clin Neurosci (2009) 63(1):43–9. doi: 10.1111/j.1440-1819.2008.01904.x
23. Han L, Jia J. Long-term effects of alcohol consumption on cognitive function in seniors: a cohort study in China. BMC Geriatr (2021) 21(1):699. doi: 10.1186/s12877-021-02606-y
24. Raina PS, Wolfson C, Kirkland SA, Griffith LE, Oremus M, Patterson C, et al. The Canadian longitudinal study on aging (CLSA). Can J Aging (2009) 28(3):221–9. doi: 10.1017/S0714980809990055
25. Kirkland SA, Griffith LE, Menec V, Wister A, Payette H, Wolfson C, et al. Mining a unique canadian resource: the Canadian longitudinal study on aging. Can J Aging = La Rev Can du vieillissement (2015) 34(3):366–77. doi: 10.1017/s071498081500029x
26. Menec VH, Newall NE, Mackenzie CS, Shooshtari S, Nowicki S. Examining social isolation and loneliness in combination in relation to social support and psychological distress using Canadian Longitudinal Study of Aging (CLSA) data. PloS One (2020) 15(3):e0230673. doi: 10.1371/journal.pone.0230673
27. Canadian Longitudinal Study on Aging. Sampling and Computation of Response Rates and Sample Weights for the Tracking (Telephone Interview) Participants and Comprehensive Participants. Available at: https://www.clsa-elcv.ca/doc/1041.
28. Tuokko H, Griffith LE, Simard M, Taler V. Cognitive measures in the Canadian longitudinal study on aging. Clin Neuropsychologist (2017) 31(1):233–50. doi: 10.1080/13854046.2016.1254279
29. Parris BA. Task conflict in the Stroop task: When Stroop interference decreases as Stroop facilitation increases in a low task conflict context. Original Res (2014) 5:1182(1182). doi: 10.3389/fpsyg.2014.01182
30. Canadian Longitudinal Study on Aging. CLSA Tracking and Comprehensive Cognition Measurements (Baseline). Available at: https://www.clsa-elcv.ca/doc/3457.
31. Trueman RC, Brooks SP, Dunnett SB. Choice reaction time and learning. In: Seel NM, editor. Encyclopedia of the Sciences of Learning. Springer US: Springer US (2012). p. 534–7.
32. Long LS, Wolpaw JT, Leung JM. Sensitivity and specificity of the animal fluency test for predicting postoperative delirium. Can J anaesthesia = J canadien d'anesthesie (2015) 62(6):603–8. doi: 10.1007/s12630-014-0306-7
33. Raina PS, Wolfson C, Kirkland SA. Canadian Longitudinal Study on Aging Protocol. Available at: https://clsa-elcv.ca/doc/511.
34. Canadian Longitudinal Study on Aging. Data Collection Site Questionnaires (Comprehensive). Available at: https://clsa-elcv.ca/doc/1122.
35. Canadian Longitudinal Study on Aging. In-Home Questionnaire (Baseline - Comprehensive). Available at: https://clsa-elcv.ca/doc/1048.
36. Canadian Longitudinal Study on Aging. Maintaining Contact Questionnaire (Tracking and Comprehensive). Available at: https://clsa-elcv.ca/doc/540.
37. Sakib MN, Shooshtari S, St. John P, Menec V. The prevalence of multimorbidity and associations with lifestyle factors among middle-aged Canadians: an analysis of Canadian Longitudinal Study on Aging data. BMC Public Health (2019) 19(1):243. doi: 10.1186/s12889-019-6567-x
38. Vincent C, Hall PA. Executive function in adults with type 2 diabetes: A meta-analytic review. Psychosom Med (2015) 77(6):631–42. doi: 10.1097/psy.0000000000000103
39. Sadanand S, Balachandar R, Bharath S. Memory and executive functions in persons with type 2 diabetes: a meta-analysis. Diabetes Metab Res Rev (2016) 32(2):132–42. doi: 10.1002/dmrr.2664
40. Cox DJ, Kovatchev BP, Gonder-Frederick LA, Summers KH, McCall A, Grimm KJ, et al. Relationships between hyperglycemia and cognitive performance among adults with type 1 and type 2 diabetes. Diabetes Care (2005) 28(1):71–7. doi: 10.2337/diacare.28.1.71
41. Lin Y, Gong Z, Ma C, Wang Z, Wang K. Relationship between glycemic control and cognitive impairment: A systematic review and meta-analysis. Front Aging Neurosci (2023) 15:1126183. doi: 10.3389/fnagi.2023.1126183
42. Tang X, Cardoso MA, Yang J, Zhou JB, Simó R. Impact of intensive glucose control on brain health: meta-analysis of cumulative data from 16,584 patients with type 2 diabetes mellitus. Diabetes Ther (2021) 12(3):765–79. doi: 10.1007/s13300-021-01009-x
43. Meneilly GS, Tessier DM. Diabetes, dementia and hypoglycemia. Can J Diabetes (2016) 40(1):73–6. doi: 10.1016/j.jcjd.2015.09.006
44. Kalmijn S, Foley D, White L, Burchfiel CM, Curb JD, Petrovitch H, et al. Metabolic cardiovascular syndrome and risk of dementia in Japanese-American elderly men. The Honolulu-Asia aging study. Arterioscler Thromb Vasc Biol (2000) 20(10):2255–60. doi: 10.1161/01.atv.20.10.2255
45. Whitmer RA, Sidney S, Selby J, Johnston SC, Yaffe K. Midlife cardiovascular risk factors and risk of dementia in late life. Neurology (2005) 64(2):277–81. doi: 10.1212/01.Wnl.0000149519.47454.F2
46. Strachan MW, R D Lawrence Lecture. The brain as a target organ in Type 2 diabetes: exploring the links with cognitive impairment and dementia. Diabetes Med (2010) 28(2):141–7. doi: 10.1111/j.1464-5491.2010.03199.x
47. Cukierman-Yaffe T, Gerstein HC, Williamson JD, Lazar RM, Lovato L, Miller ME, et al. Relationship between baseline glycemic control and cognitive function in individuals with type 2 diabetes and other cardiovascular risk factors: the action to control cardiovascular risk in diabetes-memory in diabetes (ACCORD-MIND) trial. Diabetes Care (2009) 32(2):221–6. doi: 10.2337/dc08-1153
48. Ohara T, Doi Y, Ninomiya T, Hirakawa Y, Hata J, Iwaki T, et al. Glucose tolerance status and risk of dementia in the community: the Hisayama study. Neurology (2011) 77(12):1126–34. doi: 10.1212/WNL.0b013e31822f0435
49. Abbatecola AM, Rizzo MR, Barbieri M, Grella R, Arciello A, Laieta MT, et al. Postprandial plasma glucose excursions and cognitive functioning in aged type 2 diabetics. Neurology (2006) 67(2):235–40. doi: 10.1212/01.wnl.0000224760.22802.e8
50. Ninomiya T. Diabetes mellitus and dementia. Curr Diabetes Rep (2014) 14(5):487. doi: 10.1007/s11892-014-0487-z
51. Brownlee M. Biochemistry and molecular cell biology of diabetic complications. Nature (2001) 414(6865):813–20. doi: 10.1038/414813a
52. Whitmer RA, Karter AJ, Yaffe K, Quesenberry CP Jr., Selby JV. Hypoglycemic episodes and risk of dementia in older patients with type 2 diabetes mellitus. JAMA (2009) 301(15):1565–72. doi: 10.1001/jama.2009.460
53. Lin CH, Sheu WH. Hypoglycaemic episodes and risk of dementia in diabetes mellitus: 7-year follow-up study. J Intern Med (2013) 273(1):102–10. doi: 10.1111/joim.12000
54. Zhao WQ, Alkon DL. Role of insulin and insulin receptor in learning and memory. Mol Cell Endocrinol (2001) 177(1-2):125–34. doi: 10.1016/s0303-7207(01)00455-5
55. Neumann KF, Rojo L, Navarrete LP, Farías G, Reyes P, Maccioni RB. Insulin resistance and Alzheimer's disease: molecular links & clinical implications. Curr Alzheimer Res (2008) 5(5):438–47. doi: 10.2174/156720508785908919
56. Riederer P, Korczyn AD, Ali SS, Bajenaru O, Choi MS, Chopp M, et al. The diabetic brain and cognition. J Neural Transm (Vienna) (2017) 124(11):1431–54. doi: 10.1007/s00702-017-1763-2
57. Lee CC, Adler AI, Sandhu MS, Sharp SJ, Forouhi NG, Erqou S, et al. Association of C-reactive protein with type 2 diabetes: prospective analysis and meta-analysis. Diabetologia (2009) 52(6):1040–7. doi: 10.1007/s00125-009-1338-3
58. De Felice FG, Ferreira ST. Inflammation, defective insulin signaling, and mitochondrial dysfunction as common molecular denominators connecting type 2 diabetes to Alzheimer disease. Diabetes (2014) 63(7):2262–72. doi: 10.2337/db13-1954
59. Peila R, Rodriguez BL, Launer LJ. Type 2 diabetes, APOE gene, and the risk for dementia and related pathologies: The Honolulu-Asia Aging Study. Diabetes (2002) 51(4):1256–62. doi: 10.2337/diabetes.51.4.1256
60. Irie F, Fitzpatrick AL, Lopez OL, Kuller LH, Peila R, Newman AB, et al. Enhanced risk for Alzheimer disease in persons with type 2 diabetes and APOE epsilon4: the Cardiovascular Health Study Cognition Study. Arch Neurol (2008) 65(1):89–93. doi: 10.1001/archneurol.2007.29
61. Dore GA, Elias MF, Robbins MA, Elias PK, Nagy Z. Presence of the APOE epsilon4 allele modifies the relationship between type 2 diabetes and cognitive performance: the Maine-Syracuse Study. Diabetologia (2009) 52(12):2551–60. doi: 10.1007/s00125-009-1497-2
Appendix
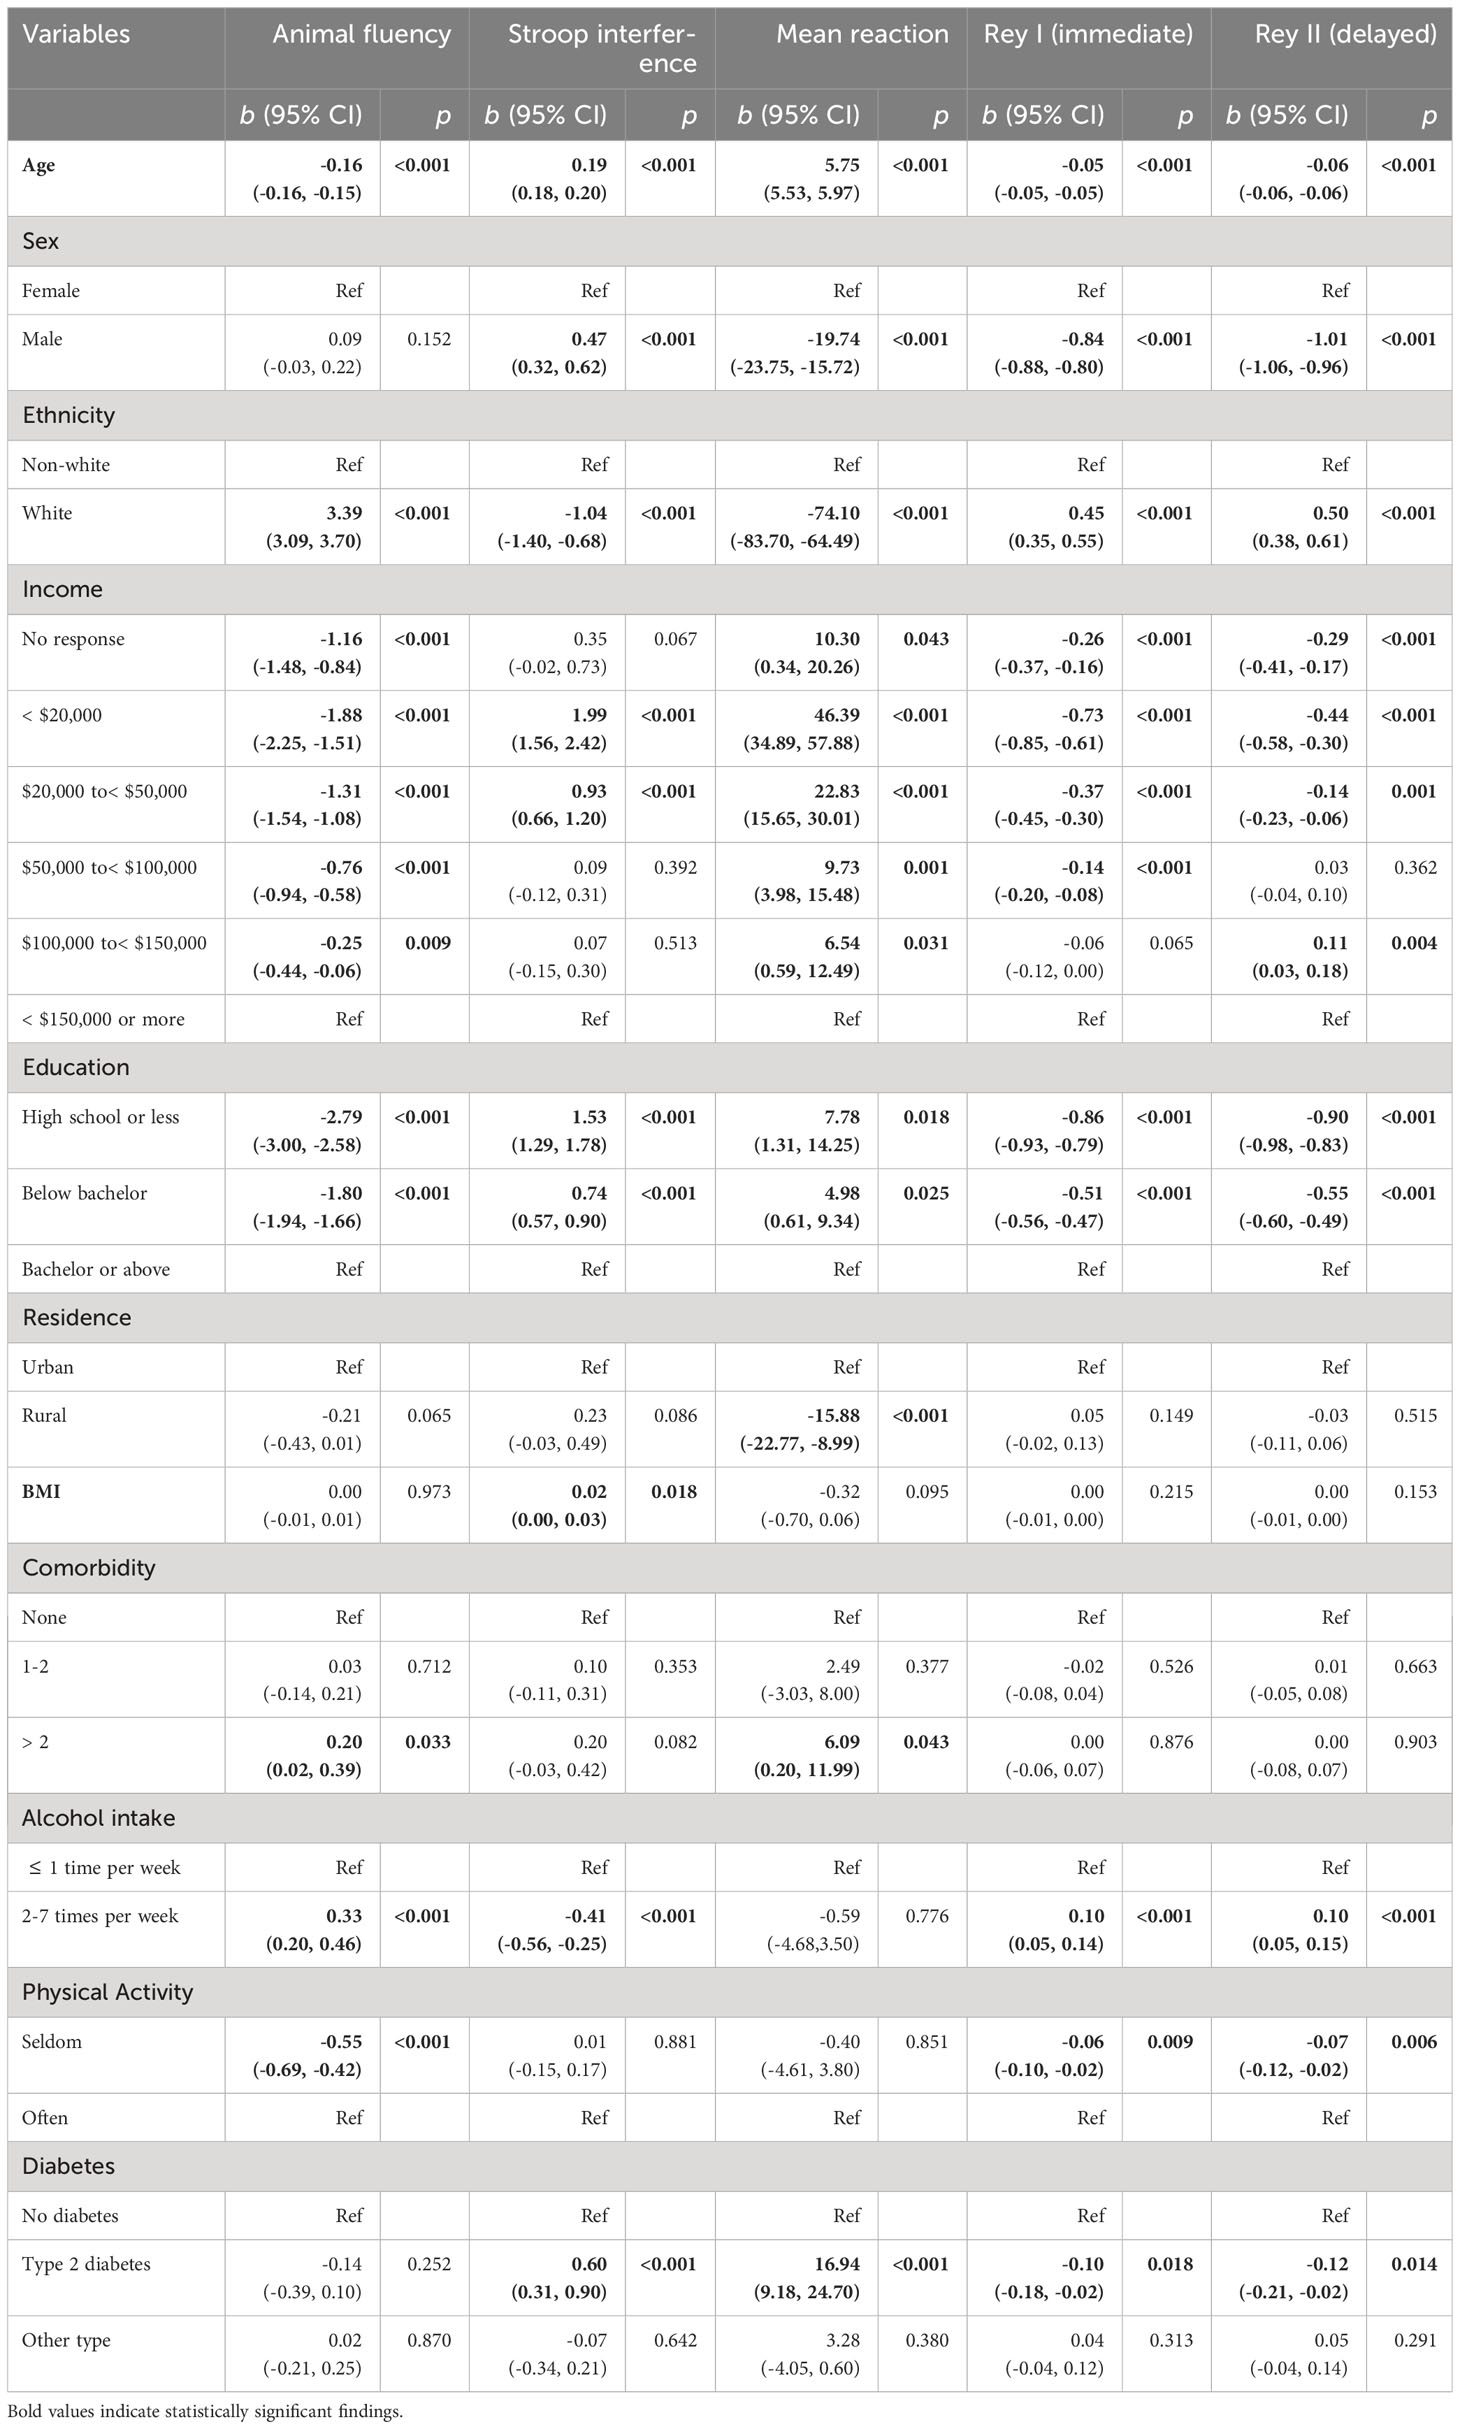
Table 1 Fully adjusted model (Model 3) for the association between diabetes and cognitive function.
Appendix
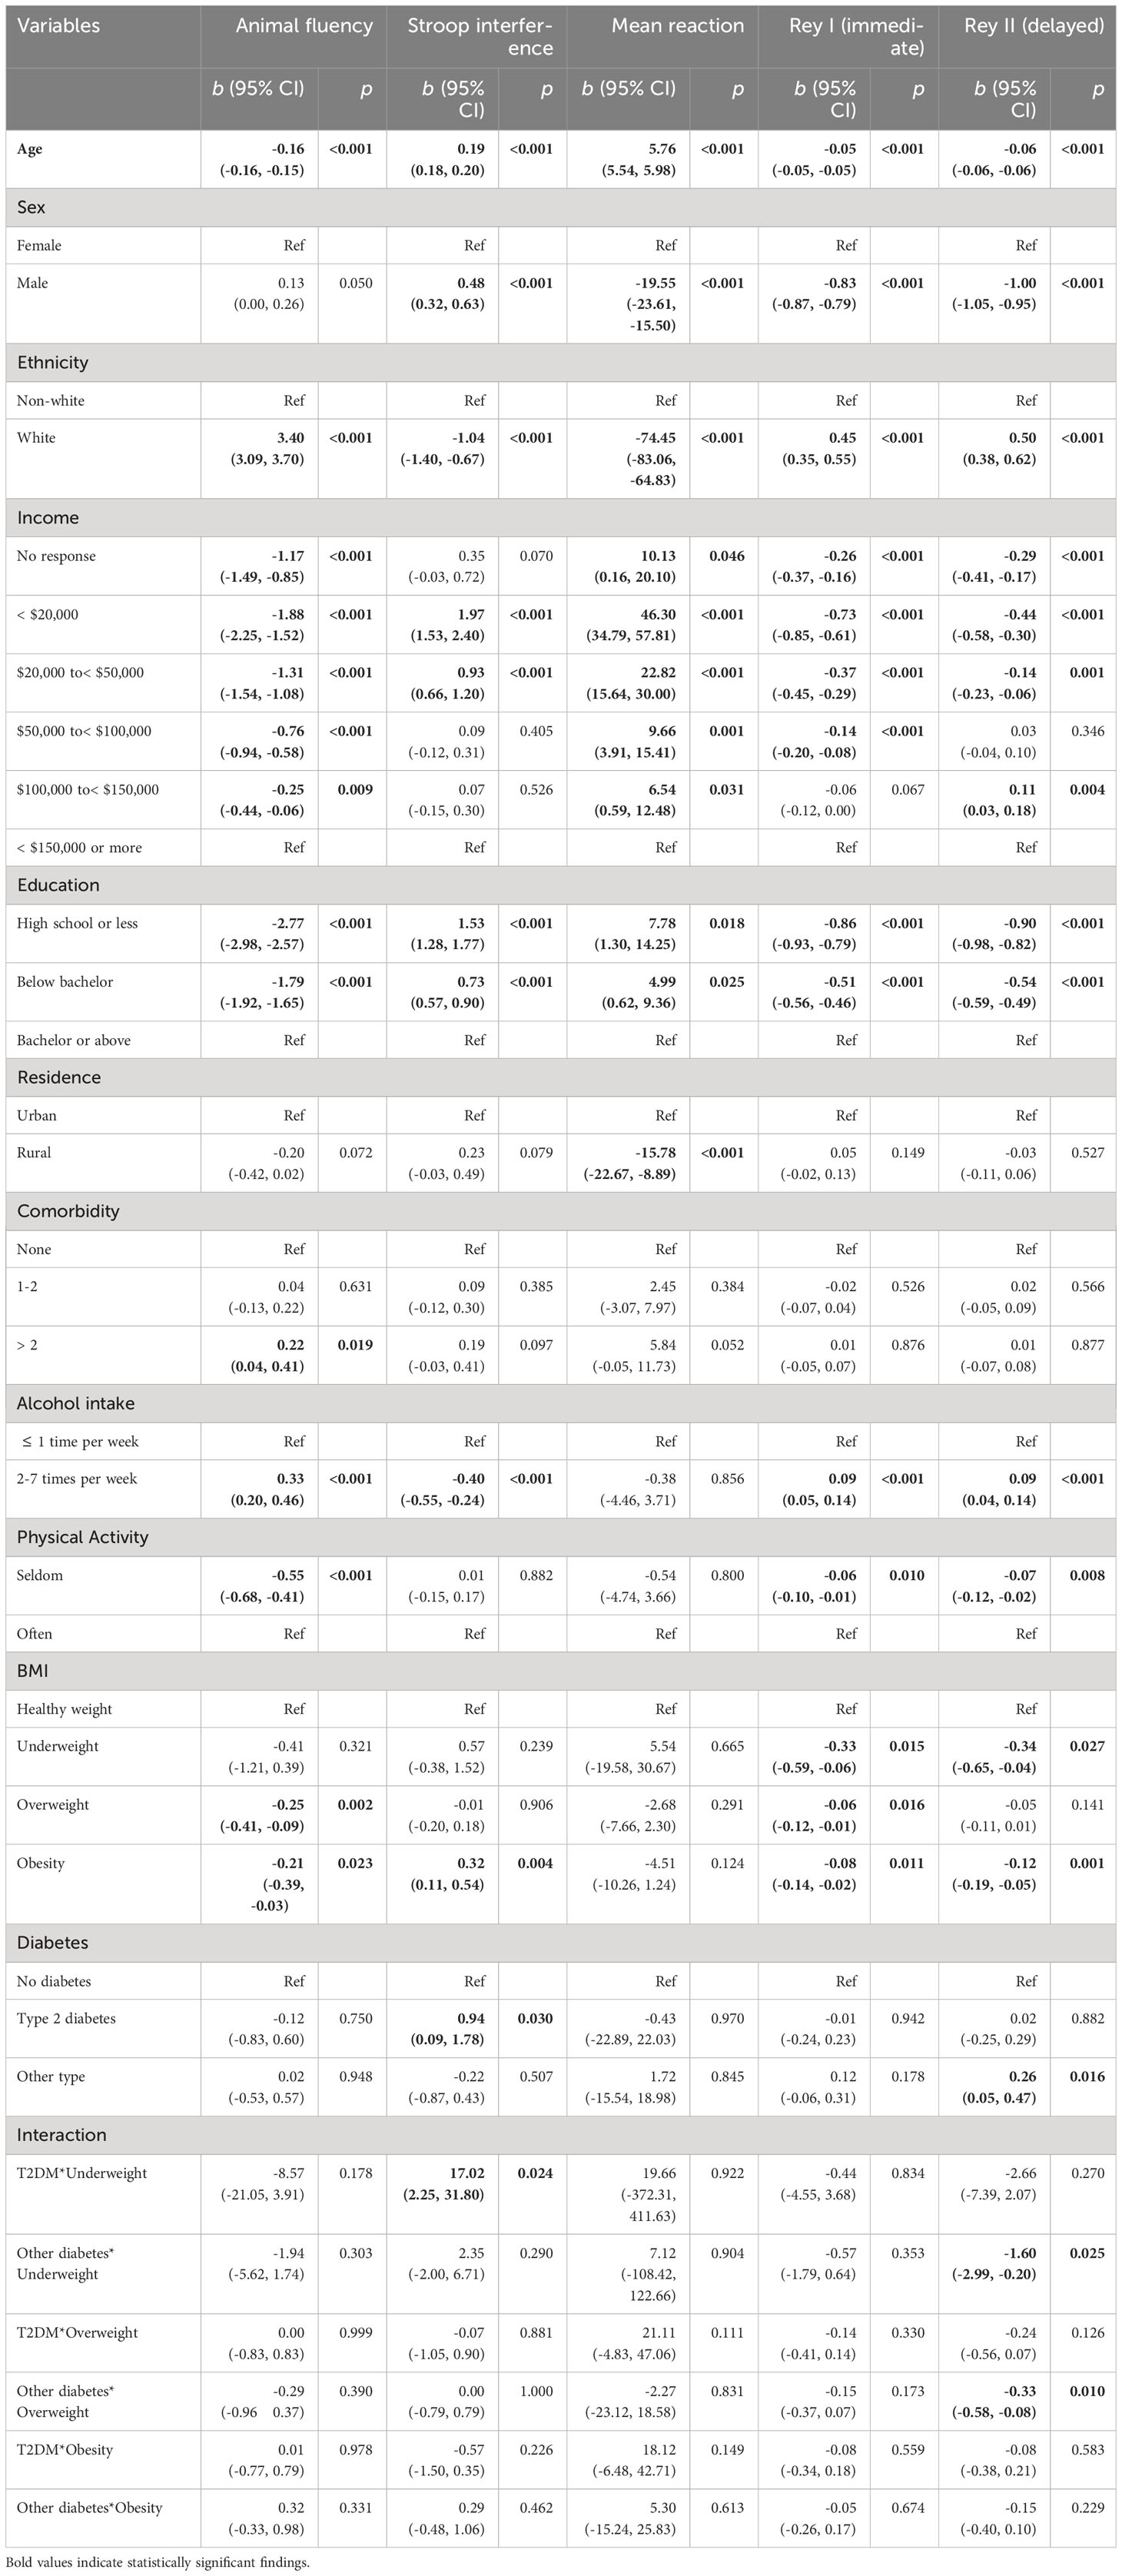
Table 2 Moderation analyses of diabetes and obesity status on cognitive function.
Keywords: CLSA, cognitive function, executive function, reaction time, memory, diabetes
Citation: Sakib MN, Ramezan R and Hall PA (2023) Diabetes status and cognitive function in middle-aged and older adults in the Canadian longitudinal study on aging. Front. Endocrinol. 14:1293988. doi: 10.3389/fendo.2023.1293988
Received: 15 September 2023; Accepted: 07 November 2023;
Published: 01 December 2023.
Edited by:
Gaetano Santulli, Albert Einstein College of Medicine, United StatesReviewed by:
Weinan Zhou, University of Illinois at Urbana-Champaign, United StatesRossana C. Zepeda, Universidad Veracruzana, Mexico
Copyright © 2023 Sakib, Ramezan and Hall. This is an open-access article distributed under the terms of the Creative Commons Attribution License (CC BY). The use, distribution or reproduction in other forums is permitted, provided the original author(s) and the copyright owner(s) are credited and that the original publication in this journal is cited, in accordance with accepted academic practice. No use, distribution or reproduction is permitted which does not comply with these terms.
*Correspondence: Mohammad Nazmus Sakib, c2FraWJtM0BtY21hc3Rlci5jYQ==