 Tong Gong
 Hongjie Di1†
 Shuhang Xu
 Guofang Chen
 Chao Liu
94% of researchers rate our articles as excellent or good
Learn more about the work of our research integrity team to safeguard the quality of each article we publish.
Find out more
ORIGINAL RESEARCH article
Front. Endocrinol., 10 January 2024
Sec. Clinical Diabetes
Volume 14 - 2023 | https://doi.org/10.3389/fendo.2023.1289571
This article is part of the Research TopicGut Microbiota, Obesity, and Associated Metabolic Disorders: Quo Vadis?View all 7 articles
Background and aims: To investigate the effect of short-term very-low-calorie restriction (VLCR) on metabolism in patients with type 2 diabetes (T2D), and elucidate the molecular mechanism through analyses on gut microbiota and small-molecule metabolites.
Methods: Fourteen T2D patients were hospitalized to receive VLCR (300-600 kcal/d) for 9 days. BMI, BP, and HR were taken before and after VLCR. Levels of blood lipids, fasting insulin, FBG, and 2h PBG were assessed. The microbial diversity in feces was detected by 16S rDNA high-throughput sequencing technology, and small-molecule metabolites in plasma and feces by untargeted metabolomics technology.
Results: After VLCR, BW, BMI, WC, BP, and levels of FBG and 2h PBG, insulin, HOMA-IR, and triglyceride decreased significantly in T2D patients (P<0.05). There was no significant change in the α-diversity of fecal microbiota, but the abundance of Bacteroidetes increased significantly, and the Firmicutes/Bacteroidetes ratio decreased significantly from 11.79 to 4.20. Parabacteroides distasonis showed an abundance having increased most prominently after VLCR treatment. Plasma level of amino acid metabolite L-arginine increased significantly. Plasma levels of three lipid metabolites, PC (14:0/20:4 [8Z, 11Z, 14Z, 17Z]), LysoPC (16:1 [9Z]) and LysoPC (18:1 [11Z]), were significantly reduced. Fecal levels of lipid metabolite LysoPC (18:1 [11Z]) and bile acid metabolite glycholic acid were significantly decreased.
Conclusion: In T2DM patients, VLCR can considerably reduce body weight and improve glucose and lipid metabolism without causing severe side effects. LysoPC (18:1 [11Z]) and Parabacteroides distasonis showed the most obvious difference after VLCR, which could be the indicators for VLCR in T2D.
Calorie restriction (CR) is being used to treat an array of diseases, such as aging-associated diseases (1). There is a growing body of evidence pointing to the benefits of CR for glucolipid metabolism. Glucose and lipid homeostasis can be improved by a slight weight loss, which, according to current dietary recommendations, is most often achieved through energy reduction (2). Given the interplay between human obesity and T2DM, CR has been trialed to alleviate T2DM. Low-calorie diets (825-853 kcal/d) for three to five months can dramatically reduce body weight and HbA1c level in T2DM patients (3). Also, after a two-year follow-up period, one-third of T2DM patients reported relief, with their HbA1c levels kept below 6.5% without the use of hypoglycemic medications (4). Our previous studies have yielded similar results (5, 6).
However, the mechanism underpinning this efficacy is still unclear. Taylor believes that this is related to the dissolution of the twin cycle hypothesis and the remission of fatty liver and pancreas (7). So far, many animal experiments have shown that CR may improve glucolipid metabolism and insulin resistance by reshaping gut microbiota (8), the composition of which is closely related with diet (9, 10). When its composition is disrupted, unusual gut microbial metabolites will be produced, such as short-chain fatty acids and bile acids (11). These metabolites can serve as molecules signaling to body metabolism (12).
Against this background, our study aimed to identify the key microbes and metabolites associated with very-low-calorie restriction (VLCR), and the molecular mechanism of VLCR in improving glucolipid metabolism in T2DM. In the meantime, non-targeted metabolomics technology was utilized to detect small molecule metabolites in plasma and fecal samples, and 16S rDNA high-throughput sequencing technology was employed to assess gut microbial diversity in fecal samples before and after VLCR.
Fourteen individuals with T2DM were recruited by advertisement. T2DM was diagnosed according to the criteria of WHO (1999) (13). Included were those with an age 18-65 years, a BMI 24-40 kg/m2, fasting blood glucose ranged from 7.0 to 16.7 mmol/L and a duration less than 10 years. Exclusion criteria were HbA1c >12.0%; hemoglobin ≤ 100 g/L, neutrophil <1.5×10⁹/L; myocardial enzyme profile (Creatine kinase CK and creatine kinase isoenzyme CK-MB) ≥3 × Upper limit of normal (ULN); glutamic-pyruvic transaminase ≥2.5×ULN and/or glutamic-oxalacetic transaminase ≥ 2.5×ULN and/or total bilirubin ≥1.5×ULN (except for metabolic related fatty liver disease); renal function injury defined as eGFR <60 mL/min/1.73 m2; fasting triglyceride ≥5.64 mmol/L (500 mg/ dL); a history of gastrointestinal diseases and gastrointestinal surgery; intake of antibiotics in previous 3 months and probiotic foods in previous 1 week. All participants stopped anti-diabetic therapy two days before VLCR, but still maintained regular lipid-lowering therapy. Antihypertensive medications were decreased as necessary throughout the study. The study protocol was approved by the Chinese Clinical Trial Registry (ChiCTR1800018199), and all participants gave informed written consent.
Participants were given a normal diet for 1-2 days after admission. VLCR started after routine physical examination and laboratory examination during this period. According to 2016 Dietary Guidelines for Chinese Residents, VLCR was designed to contain 55% carbohydrate, 20% protein and 25% fat, and prescribed over three periods, including buffer period, restriction period and recovery period. Buffer period and recovery period lasted 2 days (300 kcal/d). The restriction period lasted 5 days (600 kcal/d). Participants were guided to drink at least 2 L of water per day and to maintain their physical habits. During VLCR, blood glucose, blood pressure and heart rate were monitored daily. Any case of hypoglycemia (blood glucose ≤ 3.9 mmol/L) was treated with 20 g of glucose or equivalent food supplement (calculated according to daily calorie supply), and measured for blood glucose again 15 minutes later. The morning urine ketone body was measured during the restriction period to monitor the subject's compliance. Blood sample was taken on fasting state in the morning of the first day of the VLCR and on the first day after the VLCR. Fecal sample was taken 1-2 days before the VLCR and 1-2 days after the VLCR, and must be the first stool after the VLCR.
Patients’ height and weight were measured by physicians and body mass index (BMI) was calculated (weight in kilograms divided by the square of the height in meters). Height and waist circumference were measured at an accuracy level of 0.01 cm by a stadiometer (Suhong Medical Device Ltd, Jiangsu, China), and weight at an accuracy level of 0.01 kg by an SUHONG RGZ-160 scale (Suhong Medical Device Ltd, Jiangsu, China). According to the guideline for Chinese adults, 18.5 kg/m2 ≤ BMI < 24 kg/m2 was considered as normal weight, BMI ≥ 24 kg/m2 as overweight, and BMI ≥ 28 kg/m2 as obesity.
After fasting for 10 hours overnight, the venous blood was drawn by a nurse in the morning. Roche cobas 8000 (Roche Diagnostics Ltd, Shanghai, China) was used to measure the levels of fasting blood glucose (FBG), total cholesterol (TC), triglyceride (TG), high-density lipoprotein cholesterol (HDL-C), low-density lipoprotein cholesterol (LDL-C), calcium (Ca), phosphorus (P), albumin (ALB), ALT, AST, ALP, γ-GT, Cr, and UA. The level of hemoglobin Alc (HbAlc) was measured with the high pressure liquid chromatography method. Roche cobas 602 (Roche Diagnostics Ltd, Shanghai, China) was used to analyze the levels of fasting insulin (FINS). Insulin resistance (IR) and β-cell function were indirectly ascertained by the Homeostasis Model Assessment (HOMA) as follows: HOMA-IR=FBG (mmol/L)×FINS (mIU/L) /22.5; HOMA-β=20×FBG (mmol/L) / (FINS [mIU/L] -3.5) (%).
Total DNA was extracted from the feces according to the instructions of the E.Z.N.A.® soil kit (Omega Bio-Tek, USA). DNA concentration and purity were detected by NanoDrop2000 (Thermo Fisher Scientific, USA). Sequencing was performed using Miseq PE300 platform of Illumina (Shanghai Magi Biomedical Technology Co., LTD.), and the raw data were uploaded to NCBI database. The original sequencing sequence was quality-controlled by Trimmomatic software and spliced by FLASH software. A cluster of operational taxonomic units (OTUs) operated on sequences based on 97% similarity using UPARSE software. The RDP classifier was used to annotate each sequence, and the comparison threshold was set to 70% for Silva database.
The untargeted metabolomic analysis was used to detect metabolites in the plasma and feces. The instrument platform of LC-MS analysis was UHPLC-Q Exactive system of Thermo Fei. The original data were imported into the metabolomic processing software Progenesis QI (Waters Corporation, Milford, USA) for baseline filtering, peak recognition, integration, retention time correction and peak alignment. Finally, a data matrix of retention time, mass charge ratio and peak area was obtained, and then the data were preprocessed. Only the variables with more than 50% non-zero value in all samples were retained, and the missing values were filled with 1/2 of the minimum value in the original matrix. Then the total peak was normalized, and the variables with relative standard deviation ≥30% of the quality control samples were deleted. Then, log10 transformation was performed to obtain the data matrix for subsequent analysis. The mass spectrometry information was matched with that in the metabolic database. The main databases included public databases and self-built databases.
All data were analyzed using the SPSS SamplePower software, version 24.0 (IBM Corporation, Chicago, IL). Baseline characteristics were presented as means ± SD or as median (interquartile range [IQR]). The data before and after VLCR were compared with student paired and two-sample t test and Wilcoxon rank sum test. Statistical significance was set at a P-value < 0.05.
A total of 16 patients were recruited from January 2019 to December 2020 to participate in the study, among which 1 patient withdrew from the study on the 4th day due to unbearable hunger, and 1 patient was also excluded because he did not get feces after the experiment. On the whole, the relevant indicators of 14 patients (8 males and 6 females) were enrolled. Among them, 9 patients had new onset T2DM, and the remaining 5 patients had a history of 5.34±3.42 years. Mean (SD) values of body weight, waist circumference and HbA1c were 96.46±20.51 kg, 107.79±11.21 cm and 8.08±3.41%, respectively.
After 9 days of VLCR, the mean body weight fell from 96.46±20.51 kg at baseline to 91.50±18.99 kg (P<0.001). Waist circumference fell from 107.79±11.21 cm to 102.82±10.21 cm (P<0.001). Fasting plasma glucose level fell from 8.49±2.69 to 5.42±1.28 mmol/L (P=0.001). Fasting insulin level decreased form 16.76 (9.52, 23.72) to 7.89 (4.92, 13.36) mIU/L (P=0.035). Insulin resistance was reduced significantly when HOMA-IR fell from 6.20 (3.21, 10.31) to 1.92 (1.21, 4.11) (P=0.002). Lipid metabolism was also partially improved when triglyceride level decreased from 2.46±1.06 to 1.54±0.66 mmol/L (P <0.001). VLCR brought no significant changes in the levels of TC, HDL-C, LDL-C, AST, ALT, γ-GT, Cr, eGFR, UA, ALB, Ca and P (P>0.05) (Tables 1, 2).
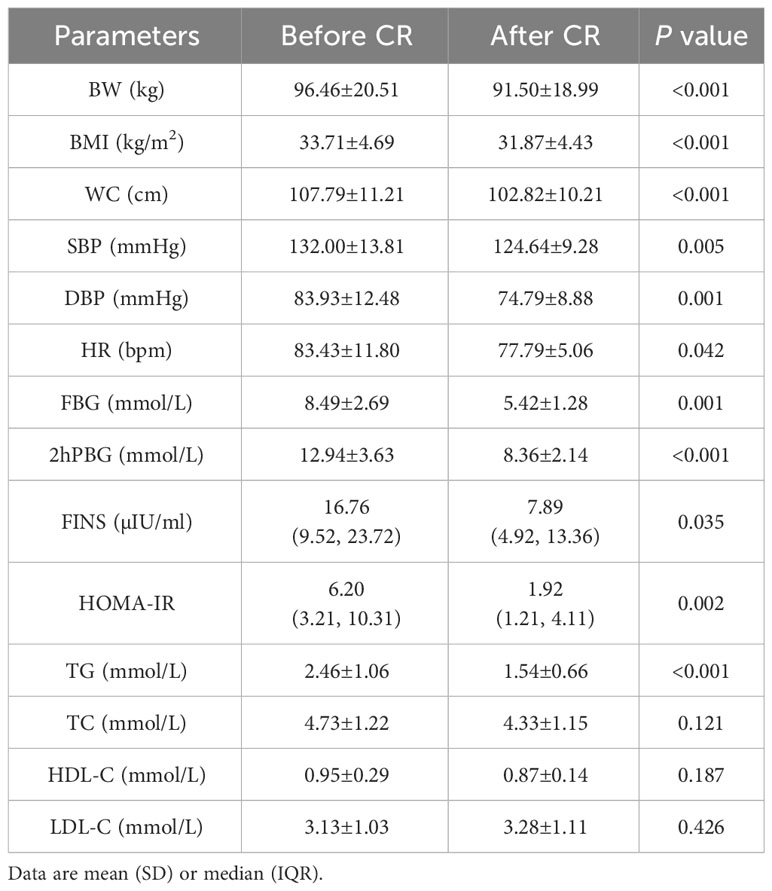
Table 1 Changes of anthropometric measurements and glycolipid parameters in T2DM patients after VLCR (n=14).
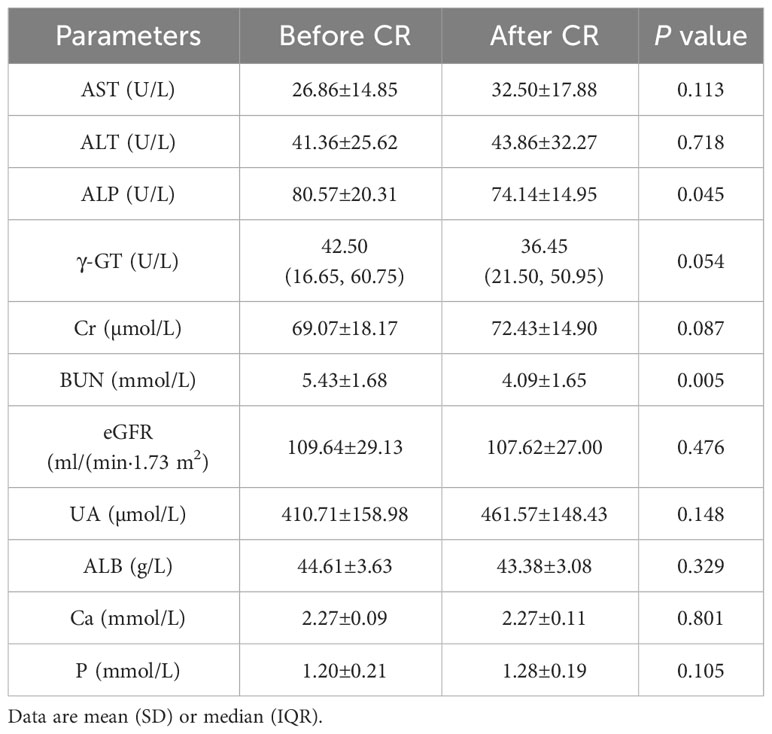
Table 2 Changes of liver and kidney function and electrolyte indexs in T2DM patients after VLCR (n=14).
We compared the composition of gut microbiota using 16S rRNA analysis. Shannon indices showed that the sequencing results could reflect the microbial diversity in the samples (Figure 1A). Wilcoxon rank-sum test was performed for sobs index. As shown in Figure 1B, after VLCR, the α-diversity in gut microbiota was slightly increased, but without statistical significance (P> 0.05). Partial least squares-discriminant analysis (PLS-DA) on the phylum level showed differences in gut microbiota (Figure 1C). The number of species on the phylum level went from 37 to 42 after 9 days of VLCR treatment. The five new species were Armatimonadetes, Fibrobacteres, Kiritimatiellaeota, Margulisbacteria and FCPU426. Among them, the proportions of Armenterobacteria and FCPU426 were 61.11% and 5.56%, respectively; the proportion of the abundance of Fibrillary bacteria, Kiritimatiellaeota and Marguliciaceae was 11.1%.
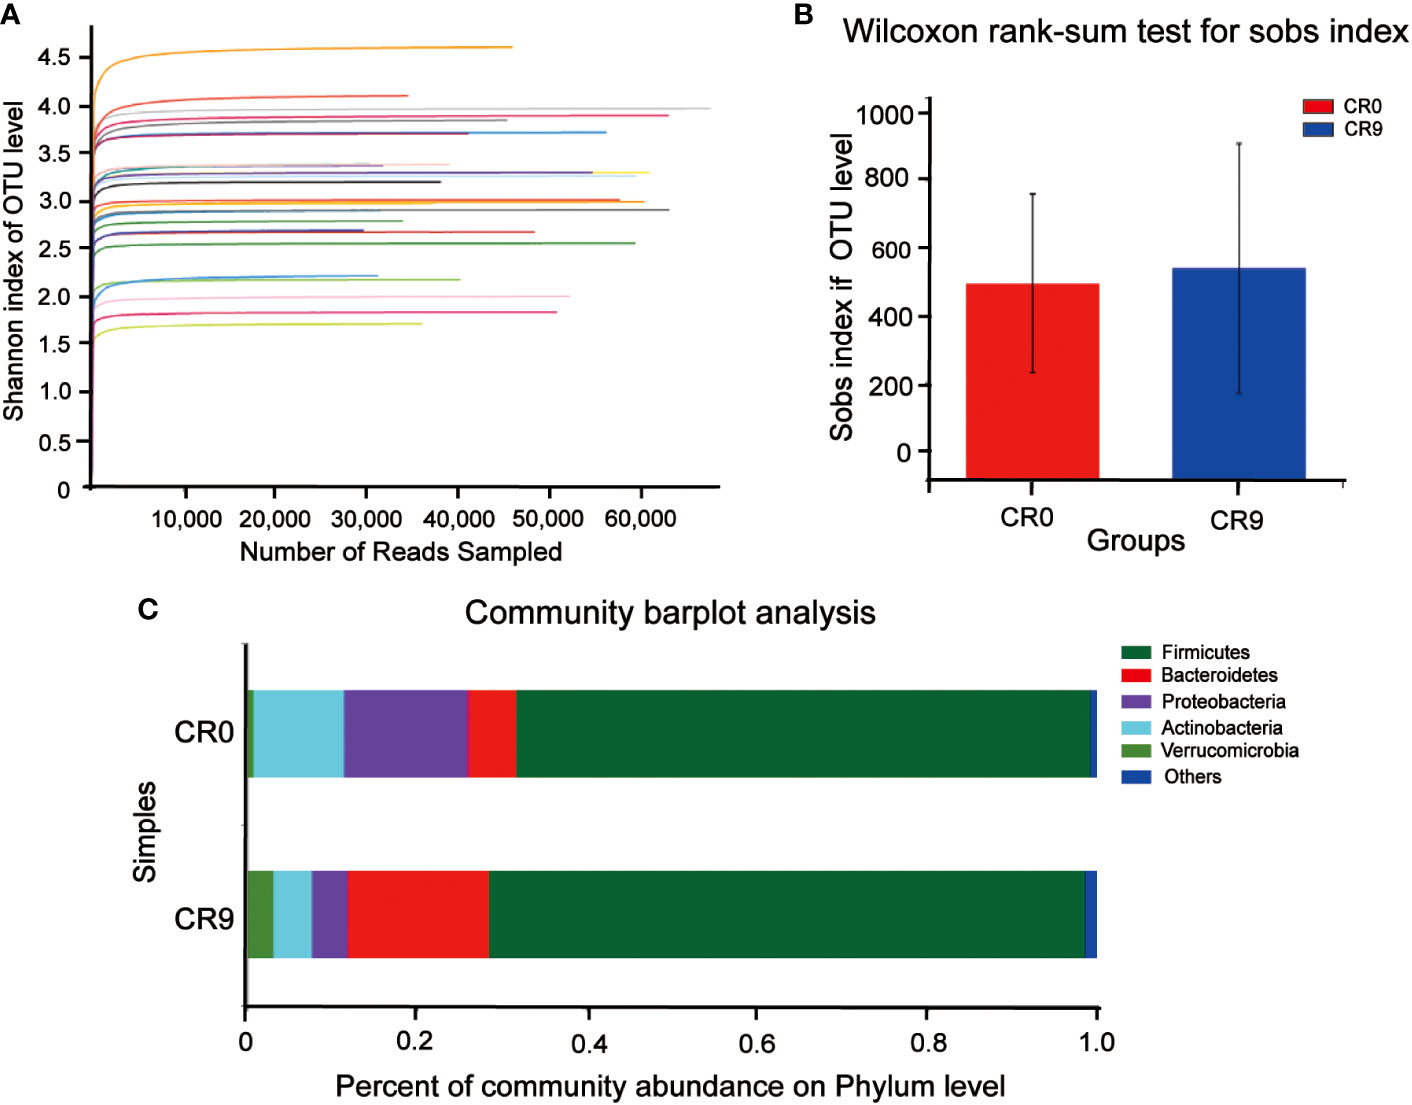
Figure 1 (A) Shannon curve. (B) Gut microbiota α diversity before and after VLCR. (C) Major phylum before and after VLCR.
The community barplot analysis on the phylum level indicated that the abundance of Bacteroidetes increased significantly from 5.73% to 16.70 % (P< 0.05). The abundance of Firmicutes increased from 67.57% to 70.13%, with no statistical significance. However, the abundance of Firmicutes/Bacteroidetes decreased from 11.79 to 4.20 significantly (P<0.05). The abundances of Actinobacteria, Proteobacteria and Verrucomicrobia also changed, but without statistical significance. Wilcoxon signed-rank test barplots showed that Bacteroidia, Bacteroidales and Tannerellaceae families increased significantly in abundance. On the genus level, the abundance of Escherichia-Shigella decreased significantly, and hat of Parabacteroides increased significantly. At the species level, e. coli/Shigella abundance decreased significantly, and those of Parabacteroides distasonis, Bacteroides_ovatus and Bacteroides_cellulosilyticus increased significantly (P<0.05) (Figure 2).
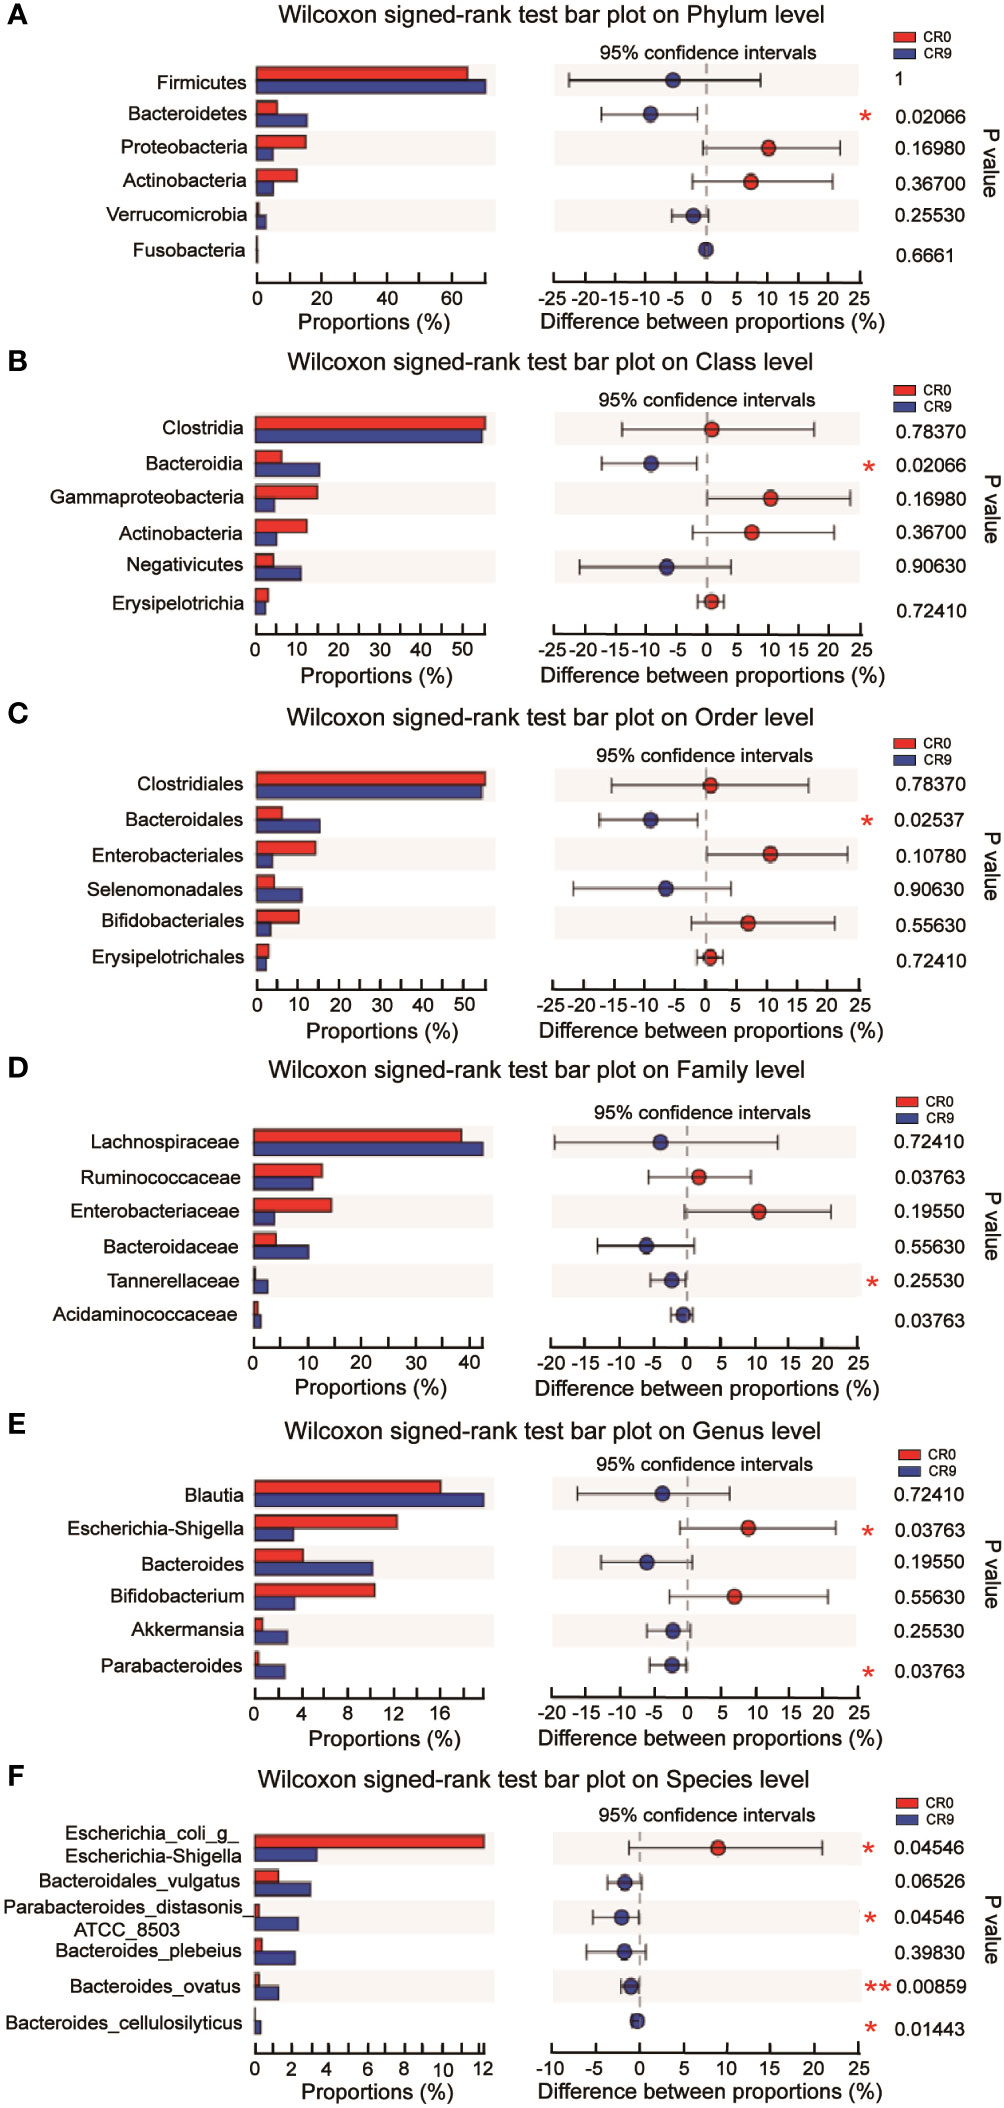
Figure 2 (A) Difference at the level of phylum before and after VLCR. (B) Difference at the level of class before and after VLCR. (C) Difference at the level of order before and after VLCR. (D) Difference at the level of family before and after VLCR. (E) Difference at the level of genus before and after VLCR. (F) Difference at the level of species before and after VLCR. *, P<0.05; **, P<0.01; ***, P<0.001.
We performed LEfSe and Linear discriminant analysis (LDA) to estimate the key species. Tannerellaceae and Parabacteroides had the highest LDA scores after VLCR, both of which were 4.014, followed by Bacteroides_vulgatus (3.971) and Parabacteroides distasonis (3.965) (Figure 3A). As shown in Figure 3B, the abundance of Parabacteroides_distasonis_ATCC_850 was negatively correlated with HOMA-IR (P<0.05). The abundance of Bacteroides_ovatus was negatively correlated with HOMA-IR, FBG, TG, LDL-C, WC, BMI and BW (P<0.05). However, the abundance of Bacteroides_vulgatus had no significant correlation with clinical metabolic indexes (P>0.05).
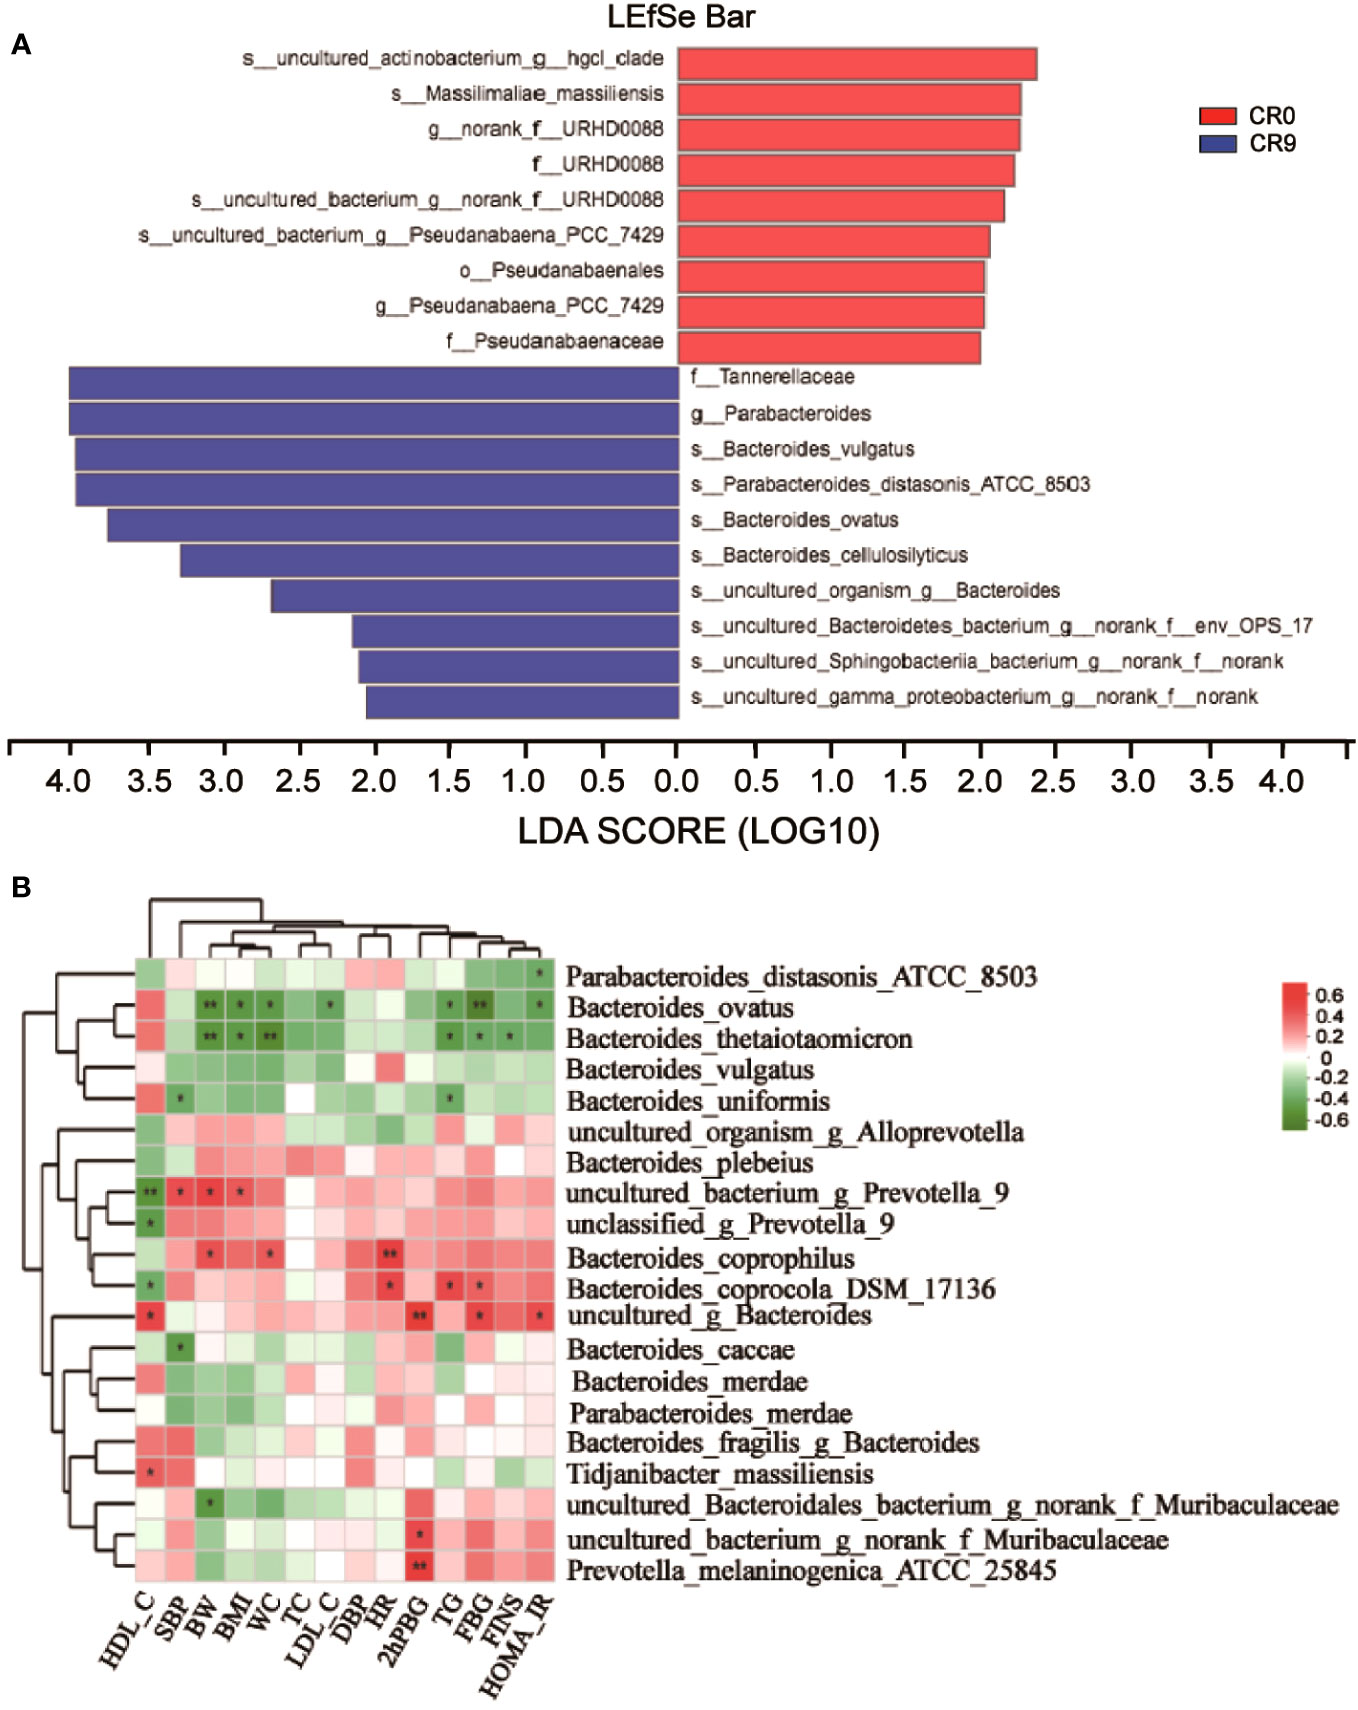
Figure 3 (A) LEfSe analysis on phylum, class, order, family, genus and species. (B) Correlation analysis of gut microbiota and metabolic indexes. *, P<0.05; **, P<0.01.
Partial least squares discriminant analysis (PLS-DA) and orthogonal partial least squares discrimination analysis (OPLS-DA) indicated that the metabolites in plasma changed significantly after VLCR (Figure 4A). According to VIP values obtained in OPLS-DA, differential metabolites between groups were screened out (VIP>1, P< 0.05), and finally four metabolites with biological significance were obtained. Among them, three belongs to the type of lipid metabolites: LysoPC (16:1 [9Z]), PC (14:0/20:4 [8Z, 11Z, 14Z, 17Z]) and LysoPC (18:1 [11Z]) in VIP order. The plasma levels of these three metabolites decreased significantly after VLCR. The other differential metabolite, L-Arginine, as an amino acid, increased significantly after VLCR (Figure 4B).
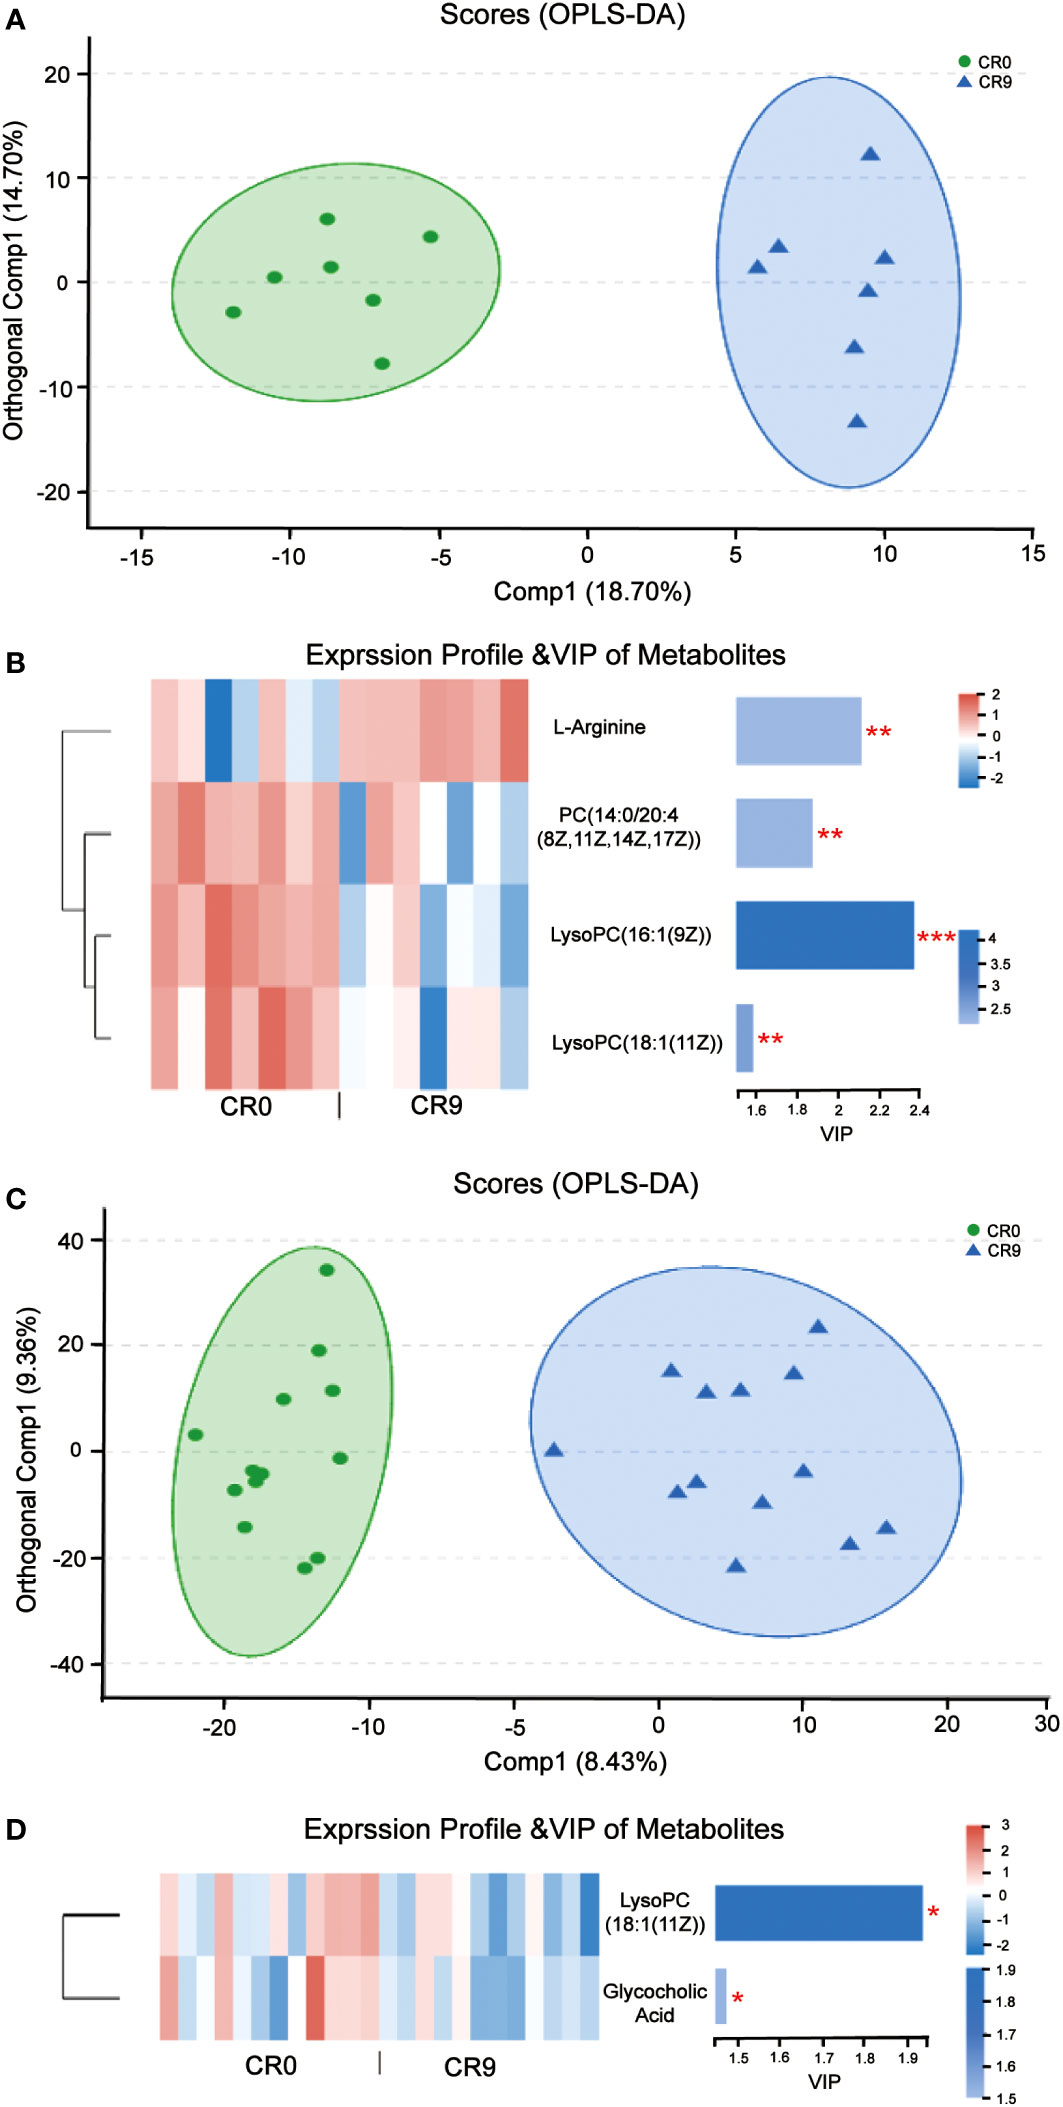
Figure 4 (A) OPLS-DA of plasma metabolites before and after VLCR. (B) The significant changes of plasma metabolites before and after 9-day VLCD. (C) OPLS-DA of fecal metabolites before and after caloric restriction. (D) The significant changes of fecal metabolites before and after 9-day VLCD. *, P<0.05; **, P<0.01; ***, P<0.001.
PLS-DA and OPLS-DA indicated that fecal metabolites changed significantly after VLCR (Figure 4C). According to VIP values obtained in OPLS-DA, the differential metabolites between groups were screened out (VIP> 1, P< 0.05), and finally two small molecule metabolites with biological significance were obtained. The level of LysoPC (18:1 (11Z)), a lipid metabolite, dropped significantly after VLCR. The level of glycholic acid, a bile acid-like metabolite, also decreased significantly after VLCR (Figure 4D).
This study demonstrated a significant improvement in glycolipid metabolism in T2DM patients after a 9-day VLCR. The microbial abundances on all levels showed remarkable changes. The lipid and amino acid metabolites in the plasma and feces underwent considerable alterations.
The diversity of fecal microbiota somewhat increased following VLCR (P > 0.05). Five more kinds of bacteria, namely Armatimonadetes, Fibrobacteres, Kiritimatiellaeota, Margulisbacteria, and FCPU426 appeared at the phylum level. The five can enhance cellulose hydrolysis (14–17). An essential dietary fiber, cellulose serves as the foundation of plant cell walls. The amount of dietary fiber rises in the VLCR diet, and the levels of microorganisms that encourage cellulose hydrolysis increase in tandem. Therefore, VLCR can rapidly change the structure of gut microbiota in T2DM patients.
The abundance of Bacteroidetes considerably increased after VLCR (P<0.05). Bacteroidetes have been revealed directly involved in metabolic diseases (18). Bacteroidetes are less prevalent in obese mice, the weight of which can be reduced by supplement with multiform Bacteroidetes (18). Following VLCR, the abundance of Bacteroidetes and Bacteroidales dramatically increased in the present study. LEfSe and Linear Discriminant Analysis showed that the LDA scores of Tannerellaceae, Parabacteroides, and Parabacteroides distasonis were 4.014, 4.014, and 3.965, respectively, indicating the most notable elevations in their abundances. The relationships among Tannerellaceae, Parabacteroides and Parabacteroides distasonis are superior and subordinate, and all belong to the phylum Bacteroides. The main bacteria at the species level are Tannerellaceae and Parabacteroides. The abundance of Parabacteroides distasonis, one of the primary symbiotic bacteria in the intestinal tract, is adversely linked with the severity of inflammatory bowel disease, non-alcoholic fatty liver disease, and obesity (19). Parabacteroides distasonis has a substantially low level in high-fat-fed mice (20). Furthermore, body weight, glucose level, and hepatic steatosis show beneficial changes in obese mice treated with active Parabacteroides distasonis (21). Consistently, the present study proved that the efficacy of VLCR on T2MD can be partly attributed to Parabacteroides distasonis in the enhancement of glucolipid metabolism.
The plasma level of L-arginine increased significantly after VLCR. In diabetic patients, a significant decrease in plasma L-arginine concentration is observed (22). Basic studies suggest that L-arginine can activate AMP-activated protein kina (AMPK), then stimulate fatty acid oxidation and glucose uptake in skeletal muscles, thereby increasing insulin secretion (23).
On the contrary, plasma levels of lipid metabolites PC (14:0/20:4 [8Z, 11Z, 14Z, 17Z]), LysoPC (16:1 [9Z]) and LysoPC (18:1 [11Z]) were significantly reduced after VLCR. Among them, PC (14:0/20:4 [8Z, 11Z, 14Z, 17Z]) belongs to phosphatidylcholines (PC) which is closely associated with T2DM. High intake of dietary PC content may increase the risk of T2DM by 17% (24). After gastric bypass, serum PC level in T2DM patients decreased significantly (25). LysoPC (16:1 [9Z]) and LysoPC (18:1 [11Z]) are lysophosphatidylcholine (LPC). LPC is an important group of lipid molecules in mammalian tissues, and LPC with different structures carry intertissue fatty acids, phosphatidylglycerol and choline (26). Researchers have observed a higher level of LPC in obese people (27). Plasma LysoPC (18:1) level in diabetic patients is also significantly higher than that in prediabetic patients (28). Taken together, upregulation of PC (14:0/20:4 [8Z, 11Z, 14Z, 17Z]), LysoPC (16:1 [9Z]) and LysoPC 18:1 [11Z]) may promote the occurrence and development of obesity and diabetes. Supportively, the present study found that VLCR can downregulate these metabolites to alleviate the symptoms of T2DM.
Here, VLCR significantly suppressed the fecal levels of LysoPC (18:1 [11Z]) and glycocholic acid (GCA), a conjugated primary bile acid produced by combining cholic acid and glycine (29). The serum level of GCA is higher in patients with liver disease than in healthy individuals (30). The linkage between GCA and obesity has also been verified by recent research. The fecal levels of GCA at 3 and 12 months following gastric bypass surgery are much lower than that prior to surgery in obese T2DM women (31). The role of GCA in metabolic illnesses has been rarely reported. This study indicates that it may be targeted to intervene metabolic diseases relevant to T2DM and obesity.
Remarkably, the LysoPC (18:1) levels in both the plasma and feces demonstrated similar decreasing trends following VLCR. Studies have revealed that LPC directly promotes inflammation by inducing the production and release of interleukin-1 (IL-1) (32). In the meantime, the nuclear factor-activated B cells are triggered to create pro-inflammatory effects, which enhances the nuclear factor-K-gene binding K (NF-KB) signaling pathway (33). Besides, procytokines can be transformed into active forms of IL-1, IL-18, and IL-33 by casparase-1, when stimulated by LPC-dependent activation of nicotinamide adenine dinucleotide phosphate oxidase and generation of reactive oxygen species (34). During VLCR, the LysoPC (18:1) levels in the plasma and feces decreased, implying the mitigation of inflammation in the body, which further alleviates T2MD. It is also believed that reduced inflammation after VLCR is directly linked to a higher abundance of Parabacteroides distasonis. Mice fed with Parabacteroides distasonis produce fewer pro-inflammatory cytokines, such as tumor necrosis factor-alpha (TNF-alpha), which represses intestinal inflammation and restores gut microbiota (35). We therefore speculate that the efficacy of VLCR on T2MD may involve a crosstalk between Parabacteroides distasonis, LysoPC (18:1) and inflammatory factors.
In conclusion, VLCR can significantly reduce body weight, blood glucose and triglycerides, and weaken insulin resistance in patients with T2DM. VLCR may function mainly through increasing the abundance of Parabacteroides distasonis, a dominant bacterium in the intestinal tract, and decreasing the LysoPC (18:1) levels in the plasma and feces.
There are also some deficiencies in this study. First, the study did not include healthy controls, so we should further analyze the differences in gut microbiota and metabolites between T2DM patients and healthy controls, as well as the effect of VLCR on these differences. Second, the sample size was small and should be expanded in the future. Finally, no basic experiments were performed to prove the relationship between Parabacteroides distasonis and LysoPC (18:1). We will clarify this relationship, and provide more theoretical evidence for VLCR in the treatment of T2DM.
The data presented in the study are deposited in the National Center for Biotechnology Information repository, accession number PRJNA1014817.
The studies involving humans were approved by the Ethics Committee of Affiliated Hospital of Integrated Traditional Chinese and Western Medicine, Nanjing University of Chinese Medicine. The studies were conducted in accordance with the local legislation and institutional requirements. The participants provided their written informed consent to participate in this study.
TG: Data curation, Formal analysis, Investigation, Methodology, Visualization, Writing – original draft. HD: Investigation, Methodology, Writing – review & editing. YH: Investigation, Methodology, Writing – review & editing, Resources. SX: Investigation, Writing – review & editing, Data curation, Formal analysis. JC: Investigation, Writing – review & editing, Methodology, Resources. GC: Supervision, Writing – review & editing, Conceptualization, Funding acquisition, Resources. XW: Project administration, Supervision, Writing – review & editing, Validation, Visualization. CL: Conceptualization, Project administration, Supervision, Writing – review & editing.
The author(s) declare financial support was received for the research, authorship, and/or publication of this article. National Nature Science Foundation of China (No. 81800756); Six Talent Peaks Project in Jiangsu Province (WSN-035).
The authors declare that the research was conducted in the absence of any commercial or financial relationships that could be construed as a potential conflict of interest.
All claims expressed in this article are solely those of the authors and do not necessarily represent those of their affiliated organizations, or those of the publisher, the editors and the reviewers. Any product that may be evaluated in this article, or claim that may be made by its manufacturer, is not guaranteed or endorsed by the publisher.
1. Mccay CM, Maynard LA, Sperling G, Barnes LL. The journal of nutrition. volume 18 july-december, 1939. pages 1-13. retarded growth, life span, ultimate body size and age changes in the albino rat after feeding diets restricted in calories. Nutr Rev (1975) 33(8):241–3. doi: 10.1111/j.1753-4887.1975.tb05227.x
2. Liu D, Huang Y, Huang C, Yang S, Wei X, Zhang P, et al. Calorie restriction with or without time-restricted eating in weight loss. N Engl J Med (2022) 386(16):1495–504. doi: 10.1056/NEJMoa2114833
3. Lean ME, Leslie WS, Barnes AC, Brosnahan N, Thom G, McCombie L, et al. Primary care-led weight management for remission of type 2 diabetes (DiRECT): an open-label, cluster-randomised tria. Lancet (2018) 391(10120):541–51. doi: 10.1016/S0140-6736(17)33102-1
4. Lean ME, Leslie WS, Barnes AC, et al. Durability of a primary care-led weightmanagement intervention for remission of type 2 diabetes: 2-year results of the DiRECT open-label, cluster-randomised trial. Lancet Diabetes Endocrinol (2019) 7(5):344–55. doi: 10.1016/S2213-8587(19)30068-3
5. Lean MEJ, Leslie WS, Barnes AC, Brosnahan N, Thom G, McCombie L, et al. Effects of a very low-calorie diet on insulin sensitivity and insulin secretion in overweight/obese and lean type 2 diabetes patients. Diabetes Metab (2015) 41(6):513–5. doi: 10.1016/j.diabet.2015.09.003
6. Wei J, Chen J, Wei X, Xiang X, Cheng Q, Xu J, et al. Long-term remission of type 2 diabetes after very-lowcalorie restriction and related predictors. Front Endocrinol (2022) 13:968239. doi: 10.3389/fendo.2022.968239
7. Taylor R. Type 2 diabetes and remission: practical management guided by pathophysiology. J Intern Med (2021) 289(6):754–70. doi: 10.1111/joim.13214
8. Li G, Xie C, Lu S, Nichols RG, Tian Y, Li L, et al. Intermittent fasting promotes white adipose browning and decreases obesity by shaping the gut microbiota. Cell Metab (2017) 26(4):672–85. doi: 10.1016/j.cmet.2017.08.019
9. David LA, Maurice CF, Carmody RN, Gootenberg DB, Button JE, Wolfe BE, et al. Diet rapidly and reproducibly alters the human gut microbiome. Nature (2014) 505(7484):559–63. doi: 10.1038/nature12820
10. Wu GD, Chen J, Hoffmann C, Bittinger K, Chen YY, Keilbaugh SA, et al. Linking long-term dietary patterns with gut microbial enterotypes. Science (2011) 334(6052):105–8. doi: 10.1126/science.1208344
11. Dalile B, Van Oudenhove L, Vervliet B, Verbeke K. The role of short-chain fatty acids in microbiota-gut-brain communication. Nat Rev Gastroenterol Hepatol (2019) 16(8):461–78. doi: 10.1038/s41575-019-0157-3
12. Ahmed H, Leyrolle Q, Koistinen V, Kärkkäinen O, Layé S, Delzenne N, et al. Microbiota-derived metabolites as drivers of gut-brain communication. Gut Microbes (2022) 14(1):2102878. doi: 10.1080/19490976.2022.2102878
13. World Health Organization. Definition and diagnosis of diabetes mellitus and intermediate hyperglycemia: report of a WHO/IDF consultation, 2006. Geneva: WHO Document Production Services (2006).
14. Lee KC, Morgan XC, Dunfield PF, Tamas I, McDonald IR, Stott MB. Genomic analysis of chthonomonas calidirosea, the first sequenced isolate of the phylum armatimonadetes. ISME J (2014) 8(7):1522–33. doi: 10.1038/ismej.2013.251
15. Abdul Rahman N, Parks DH, Vanwonterghem I, Morrison M, Tyson GW, Hugenholtz P. A phylogenomic analysis of the bacterial phylum fibrobacteres. Front Microbiol (2015) 6:1469(1469). doi: 10.3389/fmicb.2015.01469
16. Daan M. Anaerobic degradation of sulfated polysaccharides by two novel kiritimatiellales strains isolated from black sea sediment. Front Microbiol (2019) 10(2):253. doi: 10.3389/fmicb.2019.00253
17. Utami YD, Kuwahara H, Igai K, Murakami T, Sugaya K, Morikawa T. Genome analyses of uncultured TG2/ ZB3 bacteria in 'Margulisbacteria' specifically attached to ectosymbiotic spirochetes of protists in the termite gut. Isme J (2018) 13(2):455–67. doi: 10.1038/s41396-018-0297-4
18. Liu R, Hong J, Xu X, Feng Q, Zhang D, Gu Y, et al. Gut microbiome and serum metabolome alterations in obesity and after weight-loss intervention. Nat Med (2017) 23(7):859–68. doi: 10.1038/nm.4358
19. Del Chierico F, Nobili V, Vernocchi P, Russo A, De Stefanis C, Gnani D, et al. Gut microbiota profiling of pediatric nonalcoholic fatty liver disease and obese patients unveiled by an integrated metaomics-based approach. Hepatology (2017) 65(2):451–64. doi: 10.1002/hep.28572
20. Liu S, Qin P, Wang J. High-fat diet alters the intestinal microbiota in streptozotocin-induced type 2 diabetic mice. Microorganisms (2019) 7(6):176–89. doi: 10.3390/microorganisms7060176
21. Wang K, Liao M, Zhou N, Bao L, Ma K, Zheng Z, et al. Parabacteroides distasonis alleviates obesity and metabolic dysfunctions via production of succinate and secondary bile acids. Cell Rep (2019) 26(1):222–35. doi: 10.1016/j.celrep.2018.12.028
22. Palm F, Friederich M, Carlsson PO, Hansell P, Teerlink T, Liss P, et al. Reduced nitric oxide in diabetic kidneys due to increased hepatic arginine metabolism: implications for renomedullary oxygen availability. Amercian J Physiol Renal Physiol (2008) 294(1):30–7. doi: 10.1152/ajprenal.00166.2007
23. Linden KC, Wadley GD, Garnham AP, McConell GK. Effect of l-arginine infusion on glucose disposal during exercise in humans. Med Sci Sports Exercise (2011) 43(9):1626–34. doi: 10.1249/MSS.0b013e318212a317
24. Li Y, Wang DD, Chiuve SE, Manson JE, Willett WC, Hu FB. Dietary phosphatidylcholine intake and type 2 diabetes in men and women. Diabetes Care (2015) 38(2):13–4. doi: 10.2337/dc14-2093
25. Carlsson ER, Allin KH, Madsbad S, Fenger M. Phosphatidylcholine and its relation to apolipoproteins a-1 and b changes after roux-en-Y gastric bypass: a cohort study. Lipids Health Dis (2019) 18(1):169. doi: 10.1186/s12944-019-1111-7
26. Xu Y. Sphingosylphosphorylcholine and lysophosphatidylcholine: G proteincoupled receptors and receptor-mediated signal transduction. Biochim Biophys Acta (2002) 1582(1):81–8. doi: 10.1016/S1388-1981(02)00140-3
27. Graessler J, Schwudke D, Schwarz PE, Herzog R, Shevchenko A, Bornstein SR. Top-down lipidomics reveals ether lipid deficiency in blood plasma of hypertensive patients. PloS One (2009) 4(7):6261–9. doi: 10.1371/journal.pone.0006261
28. Zeng H, Tong R, Tong W, Yang Q, Qiu M, Xiong A, et al. Metabolic biomarkers for prognostic prediction of pre-diabetes: results from a longitudinal cohort study. Sci Rep (2017) 7(1):6575. doi: 10.1038/s41598-017-06309-6
29. Peña López A, Conde AJ, Estevez R, Valencia de Pablo O, Rossi-Fedele G, Cisneros R. Sodium hypochlorite and a preparation containing glycocholic acid and surfactants have a synergistic action on organic tissue dissolution in vitro. J Endodontics (2018) 44(5):813–5. doi: 10.1016/j.joen.2018.01.007
30. Ma Z, Wang X, Yin P, Wu R, Zhou L, Xu G, et al. Serum metabolome and targeted bile acid profiling reveals potential novel biomarkers for drug-induced liver injury. Medicine (2019) 98(31):e16717. doi: 10.1097/MD.0000000000016717
31. De Siqueira Cardinelli C, Torrinhas RS, Sala P, Pudenzi MA, Fernando F Angolini C, Marques da Silva M. Fecal bile acid profile after roux-en-Y gastric bypass and its association with the remission of type 2 diabetes in obese women: A preliminary study. Clin Nutr (2019) 38(6):2906–12. doi: 10.1016/j.clnu.2018.12.028
32. Christian S, Tom S, Albrecht S, Eder C. Lysophosphatidylcholine stimulates IL1beta release from microglia via a P2X7 receptor-independent mechanism. J Immunol (2006) 177(12):8560–8. doi: 10.4049/jimmunol.177.12.8560
33. Sevastou I, Kaffe E, Mouratis MA, Aidinis V. Lysoglycerophospholipids in chronic inflammatory disorders: the PLA(2)/LPC and ATX/LPA axes. Biochim Biophys Acta (2013) 1831(1):42–60. doi: 10.1016/j.bbalip.2012.07.019
34. Schilling T, Eder C. Importance of lipid rafts for lysophosphatidylcholineinduced caspase-1 activation and reactive oxygen species generation. Cell Immunol (2010) 265(2):87–90. doi: 10.1016/j.cellimm.2010.08.003
Keywords: type 2 diabetes, very-low-calorie restriction, insulin resistance, gut microbiota, metabonomics
Citation: Gong T, Di H, Hu Y, Xu S, Chen J, Chen G, Wei X and Liu C (2024) Gut microbiota and metabolites exhibit different profiles after very-low-caloric restriction in patients with type 2 diabetes. Front. Endocrinol. 14:1289571. doi: 10.3389/fendo.2023.1289571
Received: 06 September 2023; Accepted: 11 December 2023;
Published: 10 January 2024.
Edited by:
Xiaoying Ding, Shanghai General Hospital, ChinaReviewed by:
Emanuel Vamanu, University of Agricultural Sciences and Veterinary Medicine, RomaniaCopyright © 2024 Gong, Di, Hu, Xu, Chen, Chen, Wei and Liu. This is an open-access article distributed under the terms of the Creative Commons Attribution License (CC BY). The use, distribution or reproduction in other forums is permitted, provided the original author(s) and the copyright owner(s) are credited and that the original publication in this journal is cited, in accordance with accepted academic practice. No use, distribution or reproduction is permitted which does not comply with these terms.
*Correspondence: Guofang Chen, Y2hlbmd1b2ZhbmdAanNhdGNtLmNvbQ==; Xiao Wei, d2VpeGlhb0Bqc2F0Y20uY29t
†These authors have contributed equally to this work
‡ORCID: Guofang Chen, orcid.org/0000-0003-2499-5594
Disclaimer: All claims expressed in this article are solely those of the authors and do not necessarily represent those of their affiliated organizations, or those of the publisher, the editors and the reviewers. Any product that may be evaluated in this article or claim that may be made by its manufacturer is not guaranteed or endorsed by the publisher.
Research integrity at Frontiers
Learn more about the work of our research integrity team to safeguard the quality of each article we publish.