 Ruixia Bao1
 Haiyang Yu
 Yi Zhang
 Tao Wang
94% of researchers rate our articles as excellent or good
Learn more about the work of our research integrity team to safeguard the quality of each article we publish.
Find out more
ORIGINAL RESEARCH article
Front. Endocrinol., 16 November 2023
Sec. Adrenal Endocrinology
Volume 14 - 2023 | https://doi.org/10.3389/fendo.2023.1279205
This article is part of the Research TopicModel Organisms in Adrenal EndocrinologyView all 4 articles
Background: Hyperuricemia is a known risk factor of lipid metabolism disorder. However, the mechanisms have not been fully understood.
Methods: The serum samples from hyperuricemia subjects were used to analyze the correlation between serum uric acid and clinical characteristics. Hyperuricemia mice induced by potassium oxonate (PO) and adenine were used to explore glucocorticoid metabolism.
Results: In hyperuricemia patients, the levels of serum uric acid were positively correlated with the levels of γ-glutamyltransferase, associated with a cortisol metabolism disorder. In hyperuricemia state, the adrenal glands failed to respond to adrenocorticotropic hormone properly, leading to low cortisol, but not corticosterone production, and decreased mRNA levels of aldosterone synthase, 11β-hydroxylase, and 3β-hydroxysteroid dehydrogenase 1, three key enzymes for cortisol synthesis. The expression of both hepatic 5α-reductase and renal 11β-hydroxysteroid dehydrogenase 2 was significantly reduced, which led to low cortisol clearance. We denominated this cortisol metabolism disorder in hyperuricemia as pseudohypoadrenalism (PHAL).
Conclusion: PHAL increased exposure to the bioavailable cortisol in the liver, leading to local amplification of the biological action of corticosteroids. Unregulated biosynthesis pathway of bile acid expanded bile acid pool, and further aggravated cholestatic liver injury.
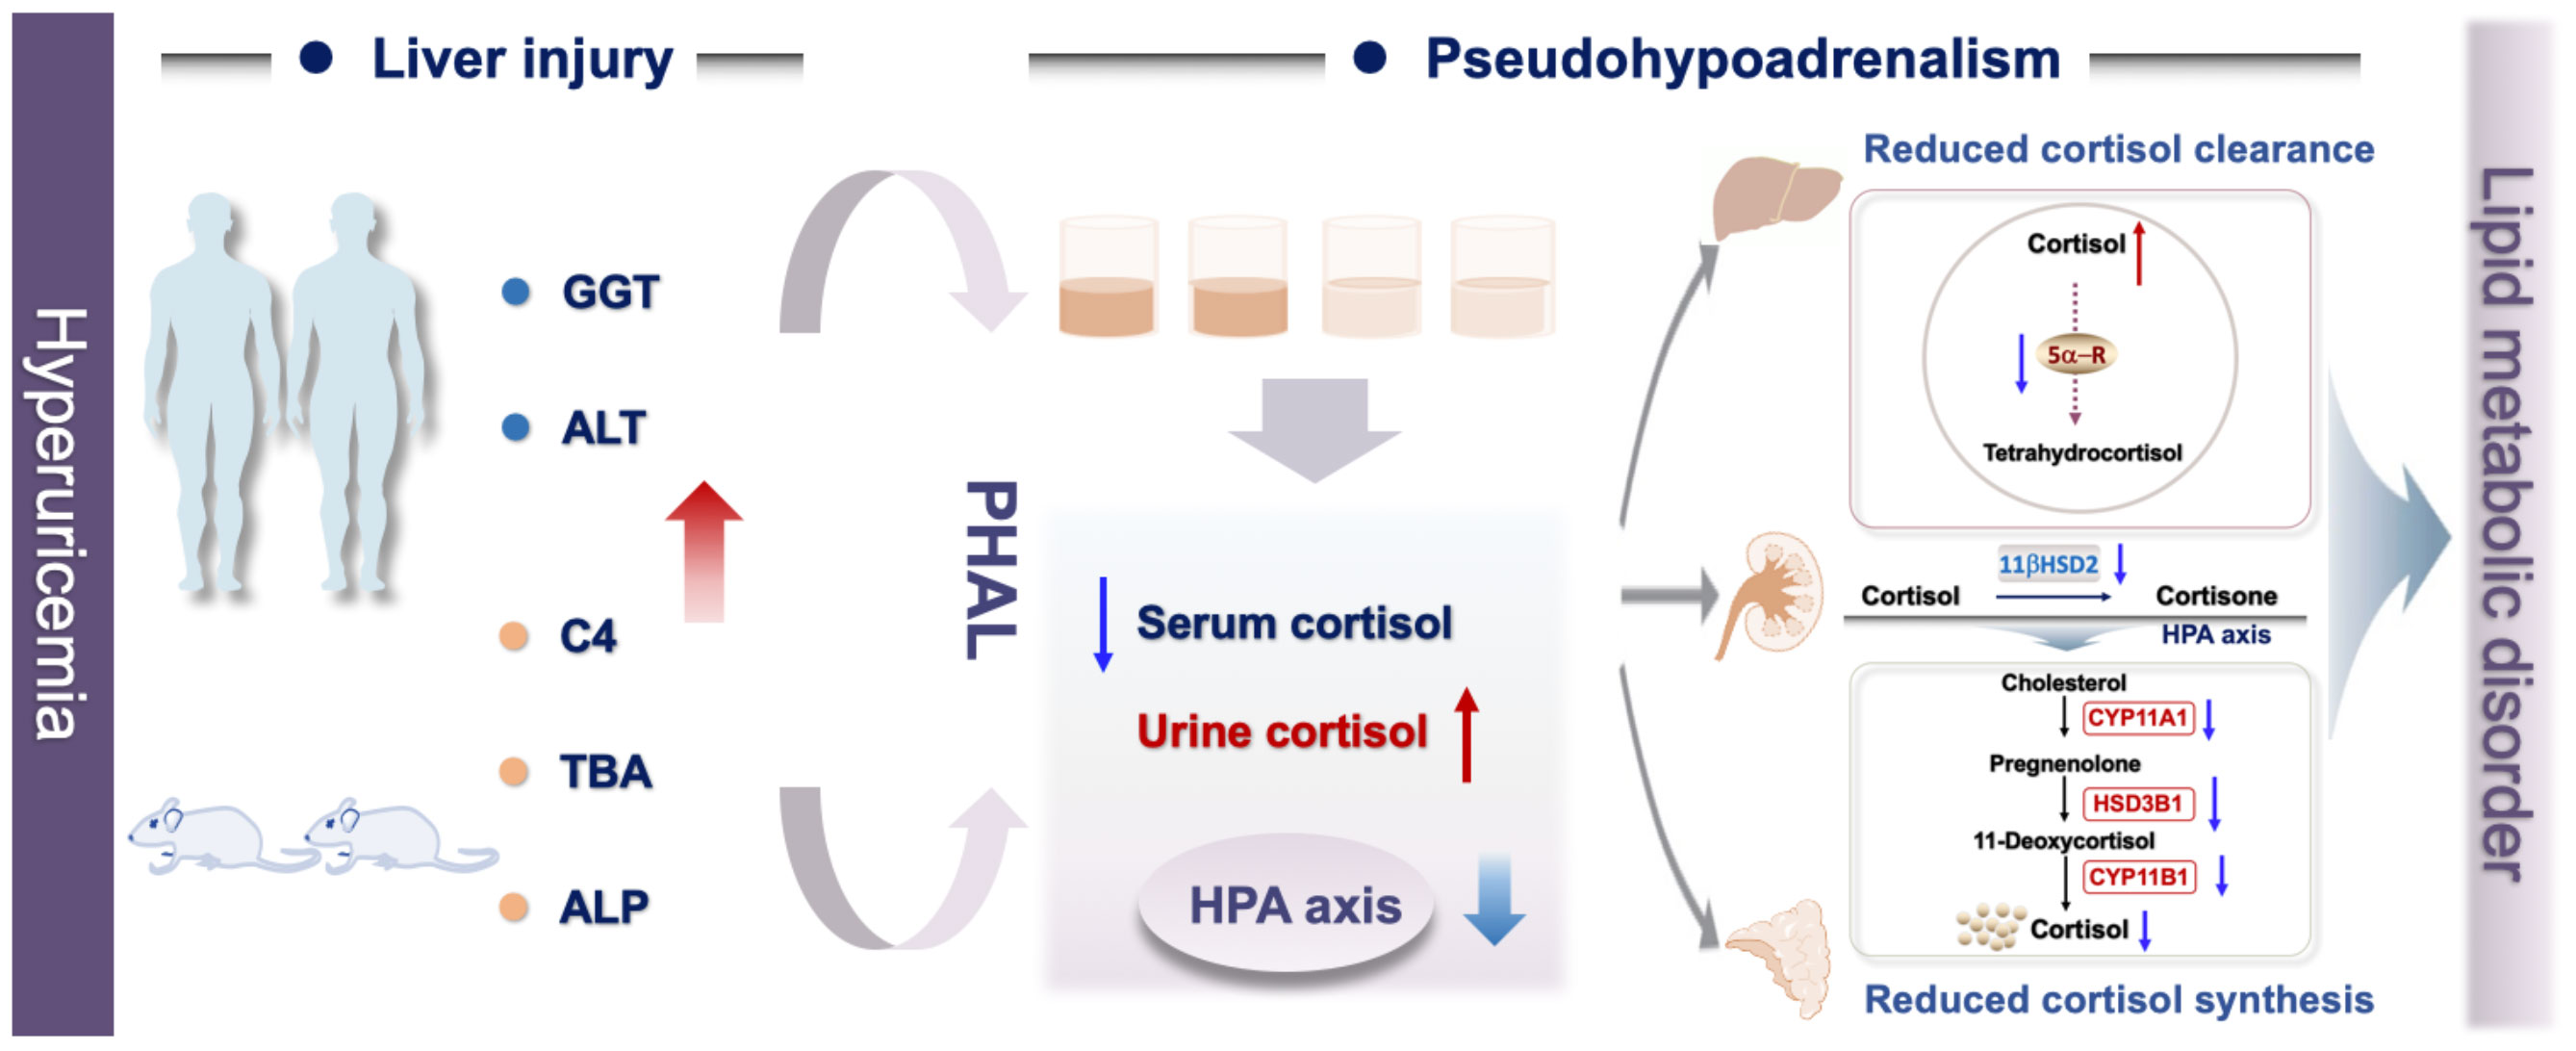
Graphical Abstract Associated with hyperuricemia, liver injury induced imbalanced cortisol metabolism with the characteristics include suppressed HPA axis, decreased cortisol production and secretion, impaired cortisol clearance, and higher bioactive cortisol level.
It is well established that hyperuricemia is strongly associated with depression, lipid metabolism disorder, hypertension, and atherosclerosis (1). However, the pathological mechanism between them is unclear. Our group analyzed the serum samples of hyperuricemia patients, and found that serum uric acid levels were positively correlated with γ-glutamyltransferase (GGT), a biomarker of damage to the hepatic cells or bile ducts (2).
A variety of factors could elevate serum GGT level. Extrinsic factors include medications, viruses, and mechanical damage (3), while intrinsic factors are reported as imbalanced hormones, bile acids, and amino acids (4). Cortisol is a glucocorticoid hormone secreted by the adrenal cortex, modulating the biosynthesis of lipids, regulating stress response and blood pressure, controlling sleep-wake cycle. It has been reported that over-exposure to intrinsic glucocorticoids led to cholestasis, liver injury, and cardiovascular disease (5; 6). Our group found higher levels of free cortisol in the hyperuricemia mice. We hypothesized that hyperuricemia caused abnormal metabolism of cortisol, which could be one of the causes of hyperuricemia related hepatic injury and other hyperuricemia complications.
In this study, we found that hyperuricemia suppressed hypothalamic–pituitary–adrenal (HPA) axis, and decreased cortisol production and secretion. Meanwhile, due to impaired renal and hepatic functions caused by hyperuricemia, the cortisol clearance decreased, which led to higher cumulative exposure to bioavailable cortisol in the hyperuricemia patients compared to that in the control group. We denominated this abnormal metabolism of cortisol as “pseudohypoadrenalism (PHAL)”, which might be one of the causes of hyperuricemia related diseases, such as depression, hyperlipidemia and cardiovascular disease.
Potassium oxonate (PO), adenine, and dexamethasone were purchased from Sigma-Aldrich (St. Louis, MO). Adrenocorticotropic Hormone (ACTH) Fragment 1-24 human was purchased from Yuanye Biotechnology Co., Ltd. (Shanghai, China). Cortisol assay kit (Human and Mouse), GGT assay kit (Mouse) and ACTH assay kit (mouse) were purchased from AmyJet Scientific Co., Ltd (Wuhan, China).
Participants were men who had undergone healthy examinations in the Second teaching hospital of Tianjin University of Traditional Chinese Medicine. All participants gave written informed consent, and the study was approved by local ethics committees (No. 2021-020-01).
Male.
Participants 18 ≤ age ≤60 years at the time informed consent was obtained.
Participants were diagnosed with hyperuricemia.
Secondary hyperuricemia.
Participants with a previous history of organ transplantation or extracorporeal circulation.
Participants with heart, lung, brain, liver, kidney, hematopoietic system and other serious diseases, including hypertension, viral hepatitis B or C, kidney stones, polycystic kidney disease, hematological malignancy or other unconfirmed malignant diseases and HIV.
A total of 422 participants were included according to the inclusion and exclusion criteria.
After overnight fast, serum sample of healthy and hyperuricemia participants were collected under aseptic conditions at 7:00 am to 9:00 am. According to the manufacturer’s instructions, serum cortisol levels were determined with a commercial ELISA kit.
Measurement data include age, height, weight, body mass index (BMI), systolic blood pressure (SBP), diastolic blood pressure (DBP) and heart rate. Laboratory indicators include direct bilirubin, GGT, high-density lipoprotein (HDL), low-density lipoprotein (LDL), globulin, aspartate aminotransferase (AST), total protein, albumin, alanine aminotransferase (ALT), total bilirubin, total cholesterol (TC), triglyceride (TG), fasting glucose, blood urea nitrogen (BUN), serum uric acid, creatinine. All clinical biochemical indicators were uniformly determined in the laboratory of the hospital.
Male C57BL/6J mice, SPF grade, 8 weeks old, were purchased from Beijing Vital River Laboratory Animal Technology Co., Ltd. (Beijing, China). All animals had free access to standard diet and water, and were housed in experimental conditions at 25 ± 2°C with humidity of 60 ± 5% in a fixed 12 h artificial light period. Before the experiments, they were allowed at least 7 days to adapt to their living environment. All animal experiment designs were approved by the Science and Technological Committee and the Animal Use and Care Committee of TJUTCM (TCM-LAEC2022007).
Potassium oxonate was use as uricase inhibitor to block conversion uric acid to allantoin and oral administration of adenine was used to increase purine intake. Mice were randomly divided into the control group and the hyperuricemia group, each group included 8 mice. Hyperuricemia mice were induced by oral administration of adenine (50 mg/kg/day, 20 ml/kg body weight) and PO (200 mg/kg/day, 20 ml/kg body weight) once a day in the morning for 20 consecutive days. The control mice received the same volume of distilled water. At the end of the administration, serum, liver, kidney and adrenal glands were collected under isoflurane anesthesia.
Mice were randomly divided into the control group and the hyperuricemia group, each group including 8 mice. Hyperuricemia mice were induced by oral administration of adenine (50 mg/kg/day, 20 ml/kg body weight) and PO (200 mg/kg/day, 20 ml/kg body weight) once a day in the morning for 20 consecutive days. On the 21st day, blood samples at baseline were collected before the control and hyperuricemia were received ACTH Fragment 1-24 human (100 μg/kg body weight) by intraperitoneal injection. And then, mice were decapitated rapidly, blood samples were collected 30 and 60 min after the ACTH administration. According to the manufacturer’s instructions, serum cortisol levels were determined with a commercial ELISA kit.
C57BL/6J mice were randomly divided into the control group and the hyperuricemia group (n=8). Hyperuricemia mice were induced by oral administration of adenine and PO as previously described in “ACTH stimulation test on hyperuricemia mice”. On the 21st day, the control and hyperuricemia mice were intraperitoneally injected with dexamethasone (0.1 mg/kg body weight), and eight hours later, mice were decapitated rapidly, and the blood samples were collected. According to the manufacturer’s instructions, serum cortisol and ACTH levels were determined with a commercial ELISA kit.
Ultra-Performance Liquid Chromatography (UPLC) analysis was used to determine serum uric acid levels in mice as described previously (7). Serum TC, alkaline phosphatase (ALP), GGT, and total bile acid (TBA) were determined with commercial kits according to the manufacturer’s instructions.
Serum C4 levels were determined through UPLC-MS analysis, a serum sample (25 μL) was added into 1 mL of ice-cold acetonitrile and then d7-C4 (10 ng/mL) was added as an internal standard. After vortexed thoroughly for 5 min, the mixture was centrifuged at 14,000 g for 10 minutes under 4 °C. The supernatant was evaporated under nitrogen flow. The residue was re-dissolved in 50 μL of 100% methanol, and centrifuged at 20,000 g for 10 minutes under 4°C. The supernatant was directly used for UHPLC/Q-Orbitrap-MS analysis. Detection and quantification were achieved by Waters UPLC system (Waters Corporation, Milford, MA, USA) coupled with a Exactive™ Plus Orbitrap mass spectrometer equipped with an ESI source (ThermoFisher Scientific, Waltham, MA, USA). Mass spectrometry acquisition mode was parallel reaction monitoring and the collision energy was 30 V. C4 were separated using a Waters ACQUITY UPLC HSS T3 column (2.1 × 100 mm, 1.8 μm) with 10 mM ammonium formate (Sigma-Aldrich (ST. Louis, MO, USA) in methanol. The working solution were prepared at a series concentration of 100 ng/mL, 50 ng/mL, 20 ng/mL, 10 ng/mL, 4 ng/mL, 2 ng/mL, 0.8 ng/mL, 0.4 ng/mL of serum C4. The column temperature was 40°C, the flow rate was 0.2 mL/min, and the injection volume was 5 μl. The data acquisition and analysis were carried out using Xcalibur™ Software 4.0.
RNA isolation, cDNA synthesis, and qRT-PCR analysis were performed as described previously (8). The primers used for qRT-PCR were synthesized by Dingguo Bio Co. Ltd, Shanghai, China. Sequences used for qRT-PCR were shown in Table 1. Results were presented as levels of expression relative to those of controls after normalization to GAPDH using the 2-△△CT methods.
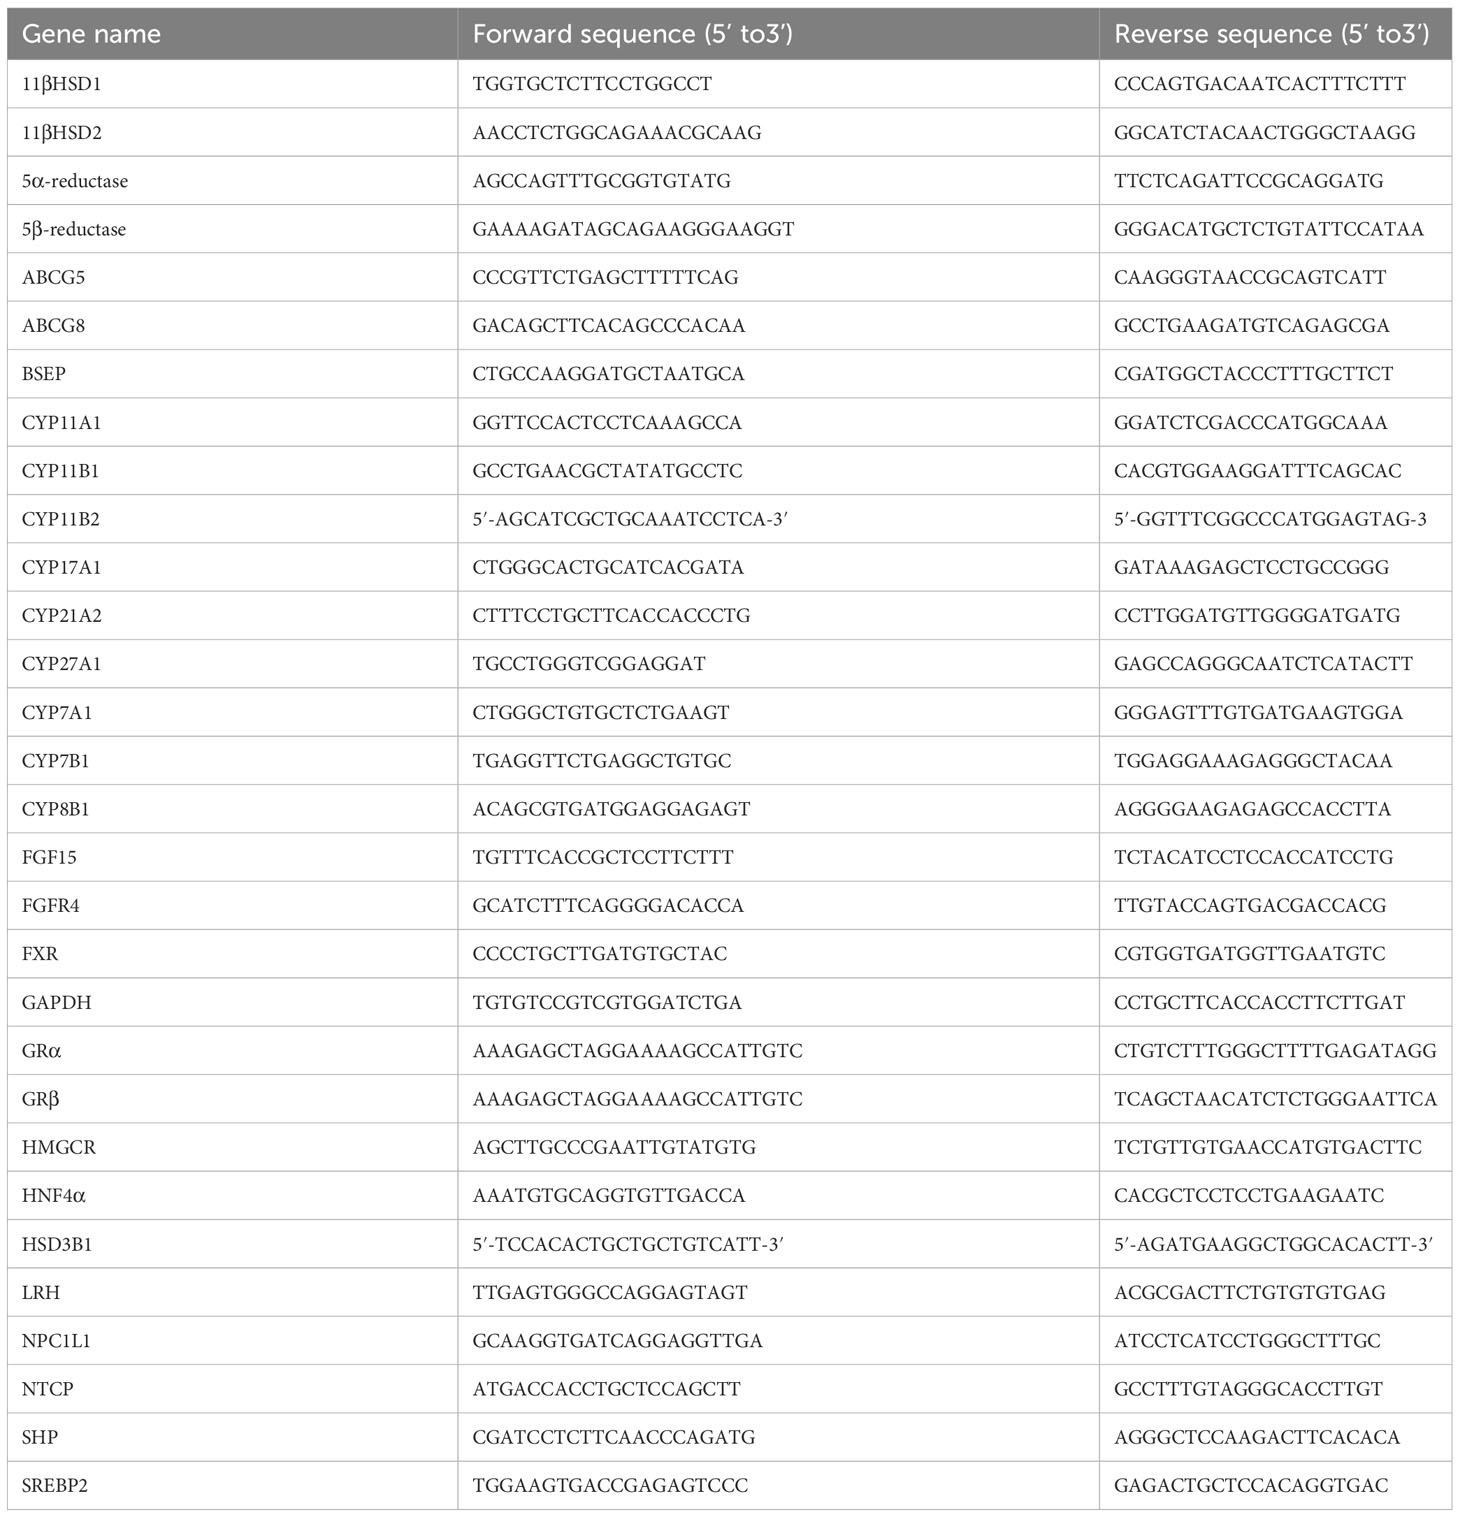
Table 1 Primer Sequences for qRT-PCR.
Adrenal glands were fixed with 4% paraformaldehyde and then embedded in paraffin. The tissues were sectioned into 5 μm-thick and stained with H&E according to a standard protocol, and the treated slices were photographed (magnification, 100×) with Axio Imager D2 (Zeiss, Oberkochen, Germany). The number of cells of zona fasciculata in the adrenal glands was counted using Image J analysis software (Version 1.0, National Institutes of Health, Bethesda, MD, USA).
SPSS 20.0 statistical software (version 20, SPSS; IBM, Armonk, NY, USA) was used to perform statistical analysis. Data were expressed as the mean ± S.E.M. Spearman correlation analyses were used to evaluate the correlation between serum uric acid and clinical characteristics. The independent t-test was used to compare the differences between the control mice and the hyperuricemia mice. Significant differences between the means of SUA quartile 1- quartile 4 groups were evaluated by one-way analysis of variance (ANOVA). The LSD and Dunnett’s test were used for post hoc evaluations. p<0.05 was considered to represent a statistically significant difference.
Spearman correlation analyses were used to determine whether there were associations between serum uric acid level and clinical characteristics. As shown in Table 2, the levels of ALT (r=0.167, p=0.000), creatinine (r=0.211, p=0.000), GGT (r=0.228, p=0.000), LDL-C (r=0.223, p=0.000), TC (r=0.223, p=0.000) and TG (r=0.214, p=0.000) were significantly positively correlated with serum uric acid levels in hyperuricemia patients. In addition, demographic characteristics including age, height, and weight were also significantly correlated with serum uric acid levels in the hyperuricemia subjects.
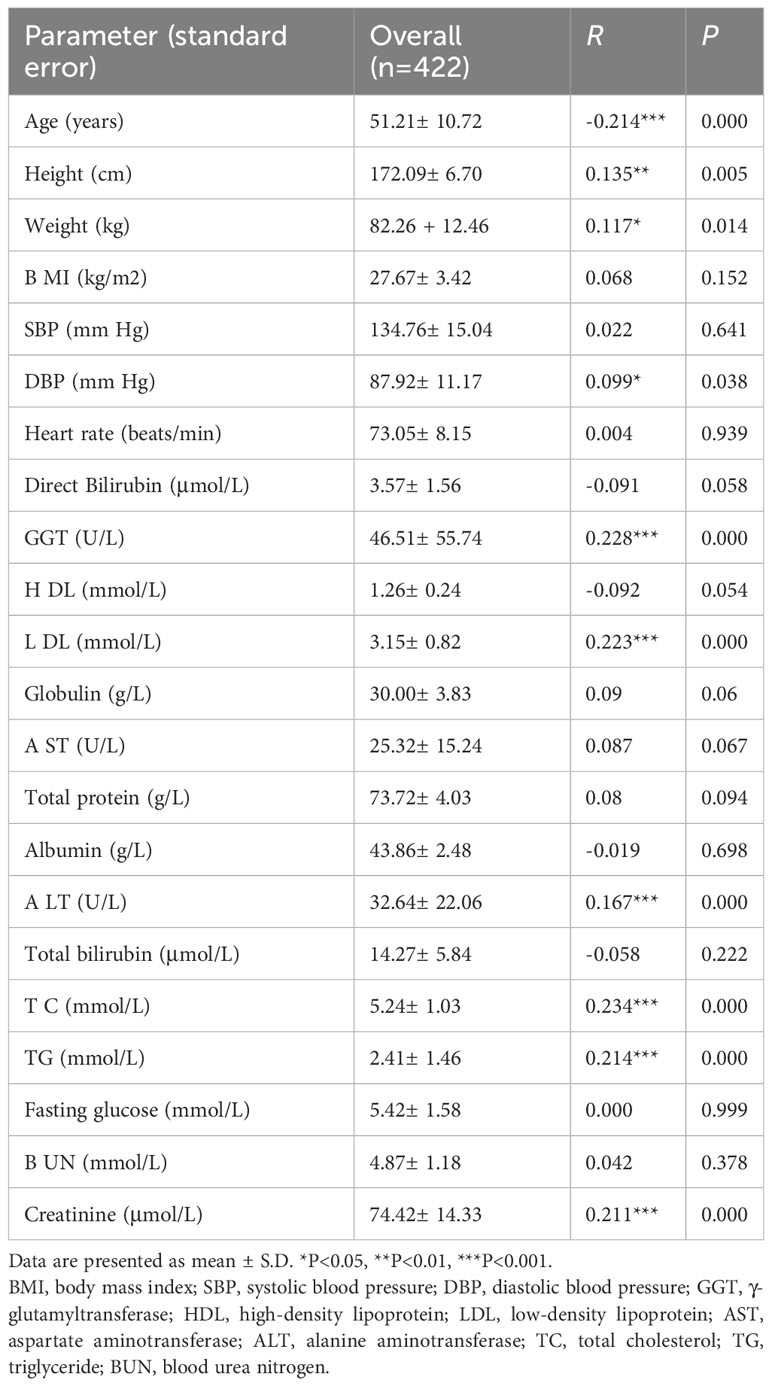
Table 2 Correlation between serum uric acid and clinical characteristics in hyperuricemia subjects.
The slightly elevated serum levels of ALT and GGT indicated a mild to moderate progression of liver cell and duct cell damage (2). The characteristics of individuals according to quartiles of serum uric acid levels are summarized in Table 3. The Q1, Q2, Q3 and Q4 quartiles of serum uric acid were 352.89± 52.62, 449.35± 19.62, 509.84 ± 17.76 and 610.09 ± 57.73 μmol/L, respectively. There were no statistically significant differences in BMI, SBP, DBP, HDL-C, AST, total protein, albumin, total bilirubin, fasting glucose, and BUN among the quartiles of serum uric acid. However, it is notable that the GGT and ALT levels were 39.41% and 28.19% higher, respectively, in the Q4 quartile than the counterparts in the Q1 quartile of serum uric acid. These results confirmed that hyperuricemia was associated with higher prevalence of mild liver injury.
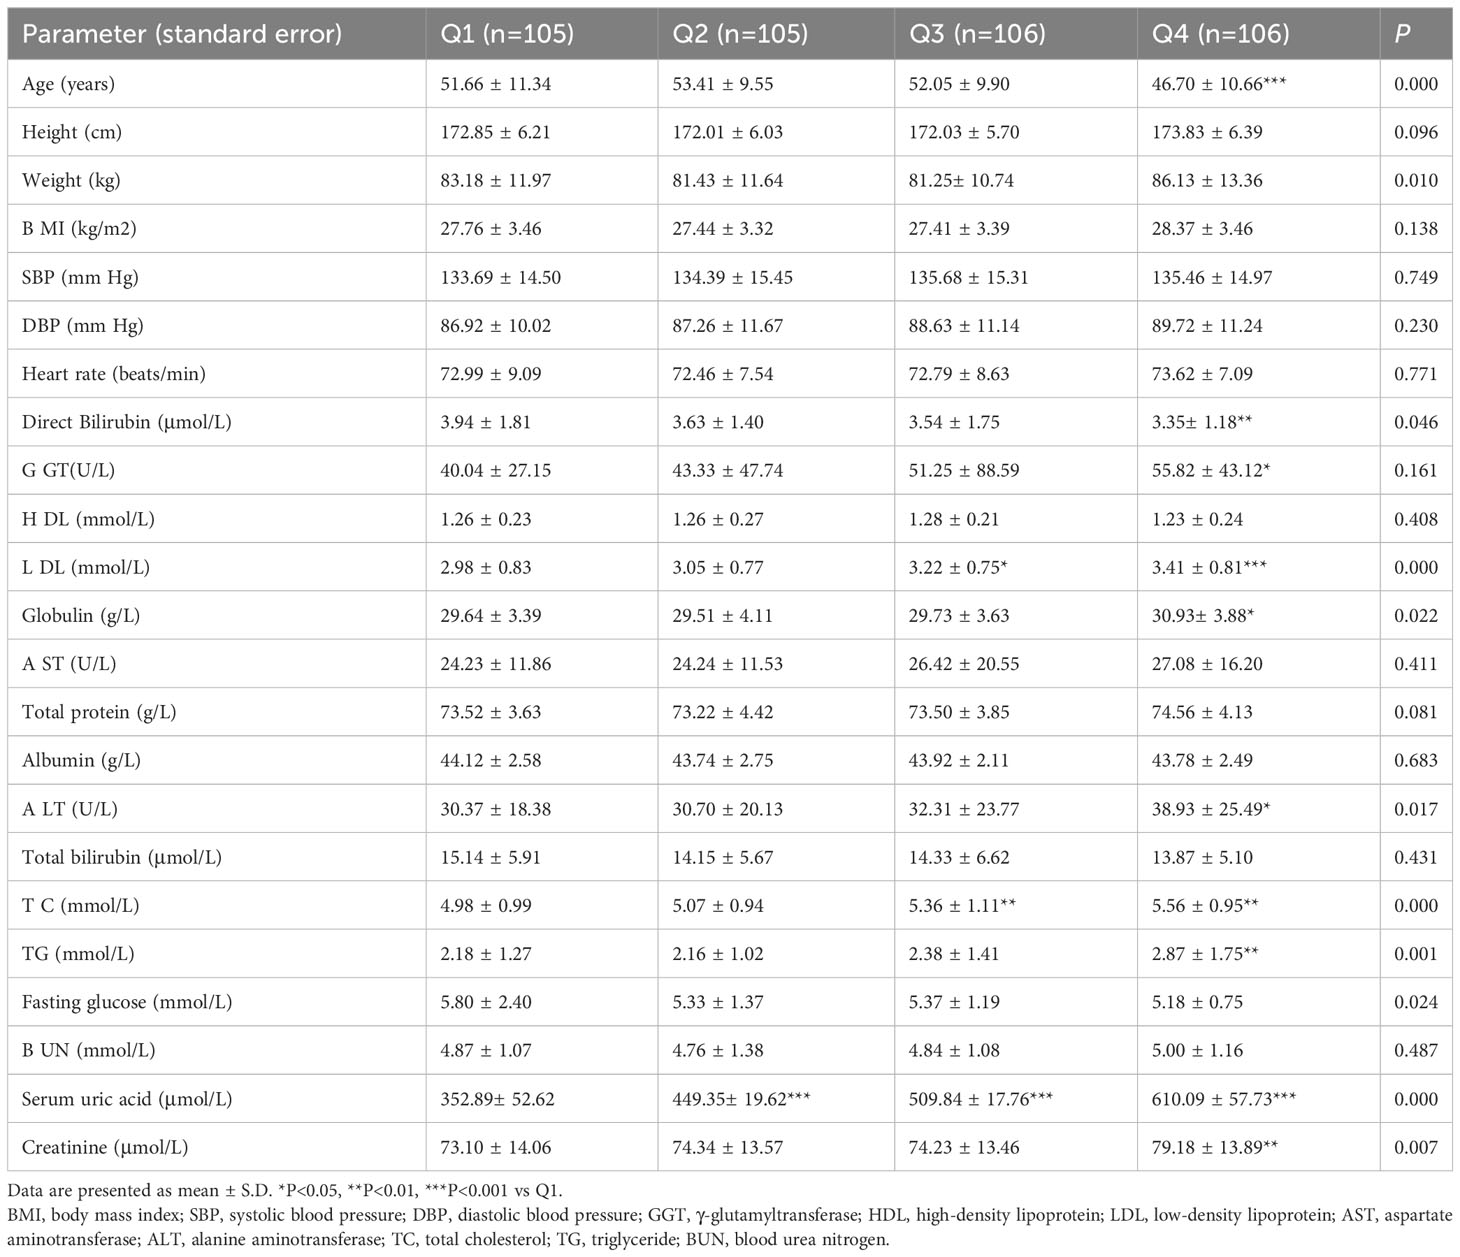
Table 3 Demographic and clinical characteristics of hyperuricemia subjects according to the quartiles of serum uric acid.
We next examined the effects of hyperuricemia on liver injury in mice. As shown in Figure 1A, unlike patients with hyperuricemia, PO and adenine induced hyperuricemia mice have markedly lower body weights compared to the control mice. The liver index and kidney index were significantly lower, with no significant difference in spleen index in the hyperuricemia mice when compared to those in the controls (Figure 1B). As expected, the serum uric acid level of the hyperuricemia group was 62% higher compared with the control (Figure 1C). Meanwhile, the serum TC level was higher in the hyperuricemia group compared with the control (Figure 1D), consistent with the clinical characteristics of hyperuricemia patients. The serum TG level was slightly elevated in the hyperuricemia mice more than the control mice (Figure 1E). The serum BUN and creatinine levels were significantly higher in the hyperuricemia mice, 160% more than the control mice (Figures 1F, G), similarly, in hyperuricemia patients, there is a significant positive correlation between serum uric acid and creatinine levels. Urine uric acid levels and 24 h clearances of uric acid and creatinine were significantly lower in the hyperuricemia group in comparison to the control group (Figures 1H–J).
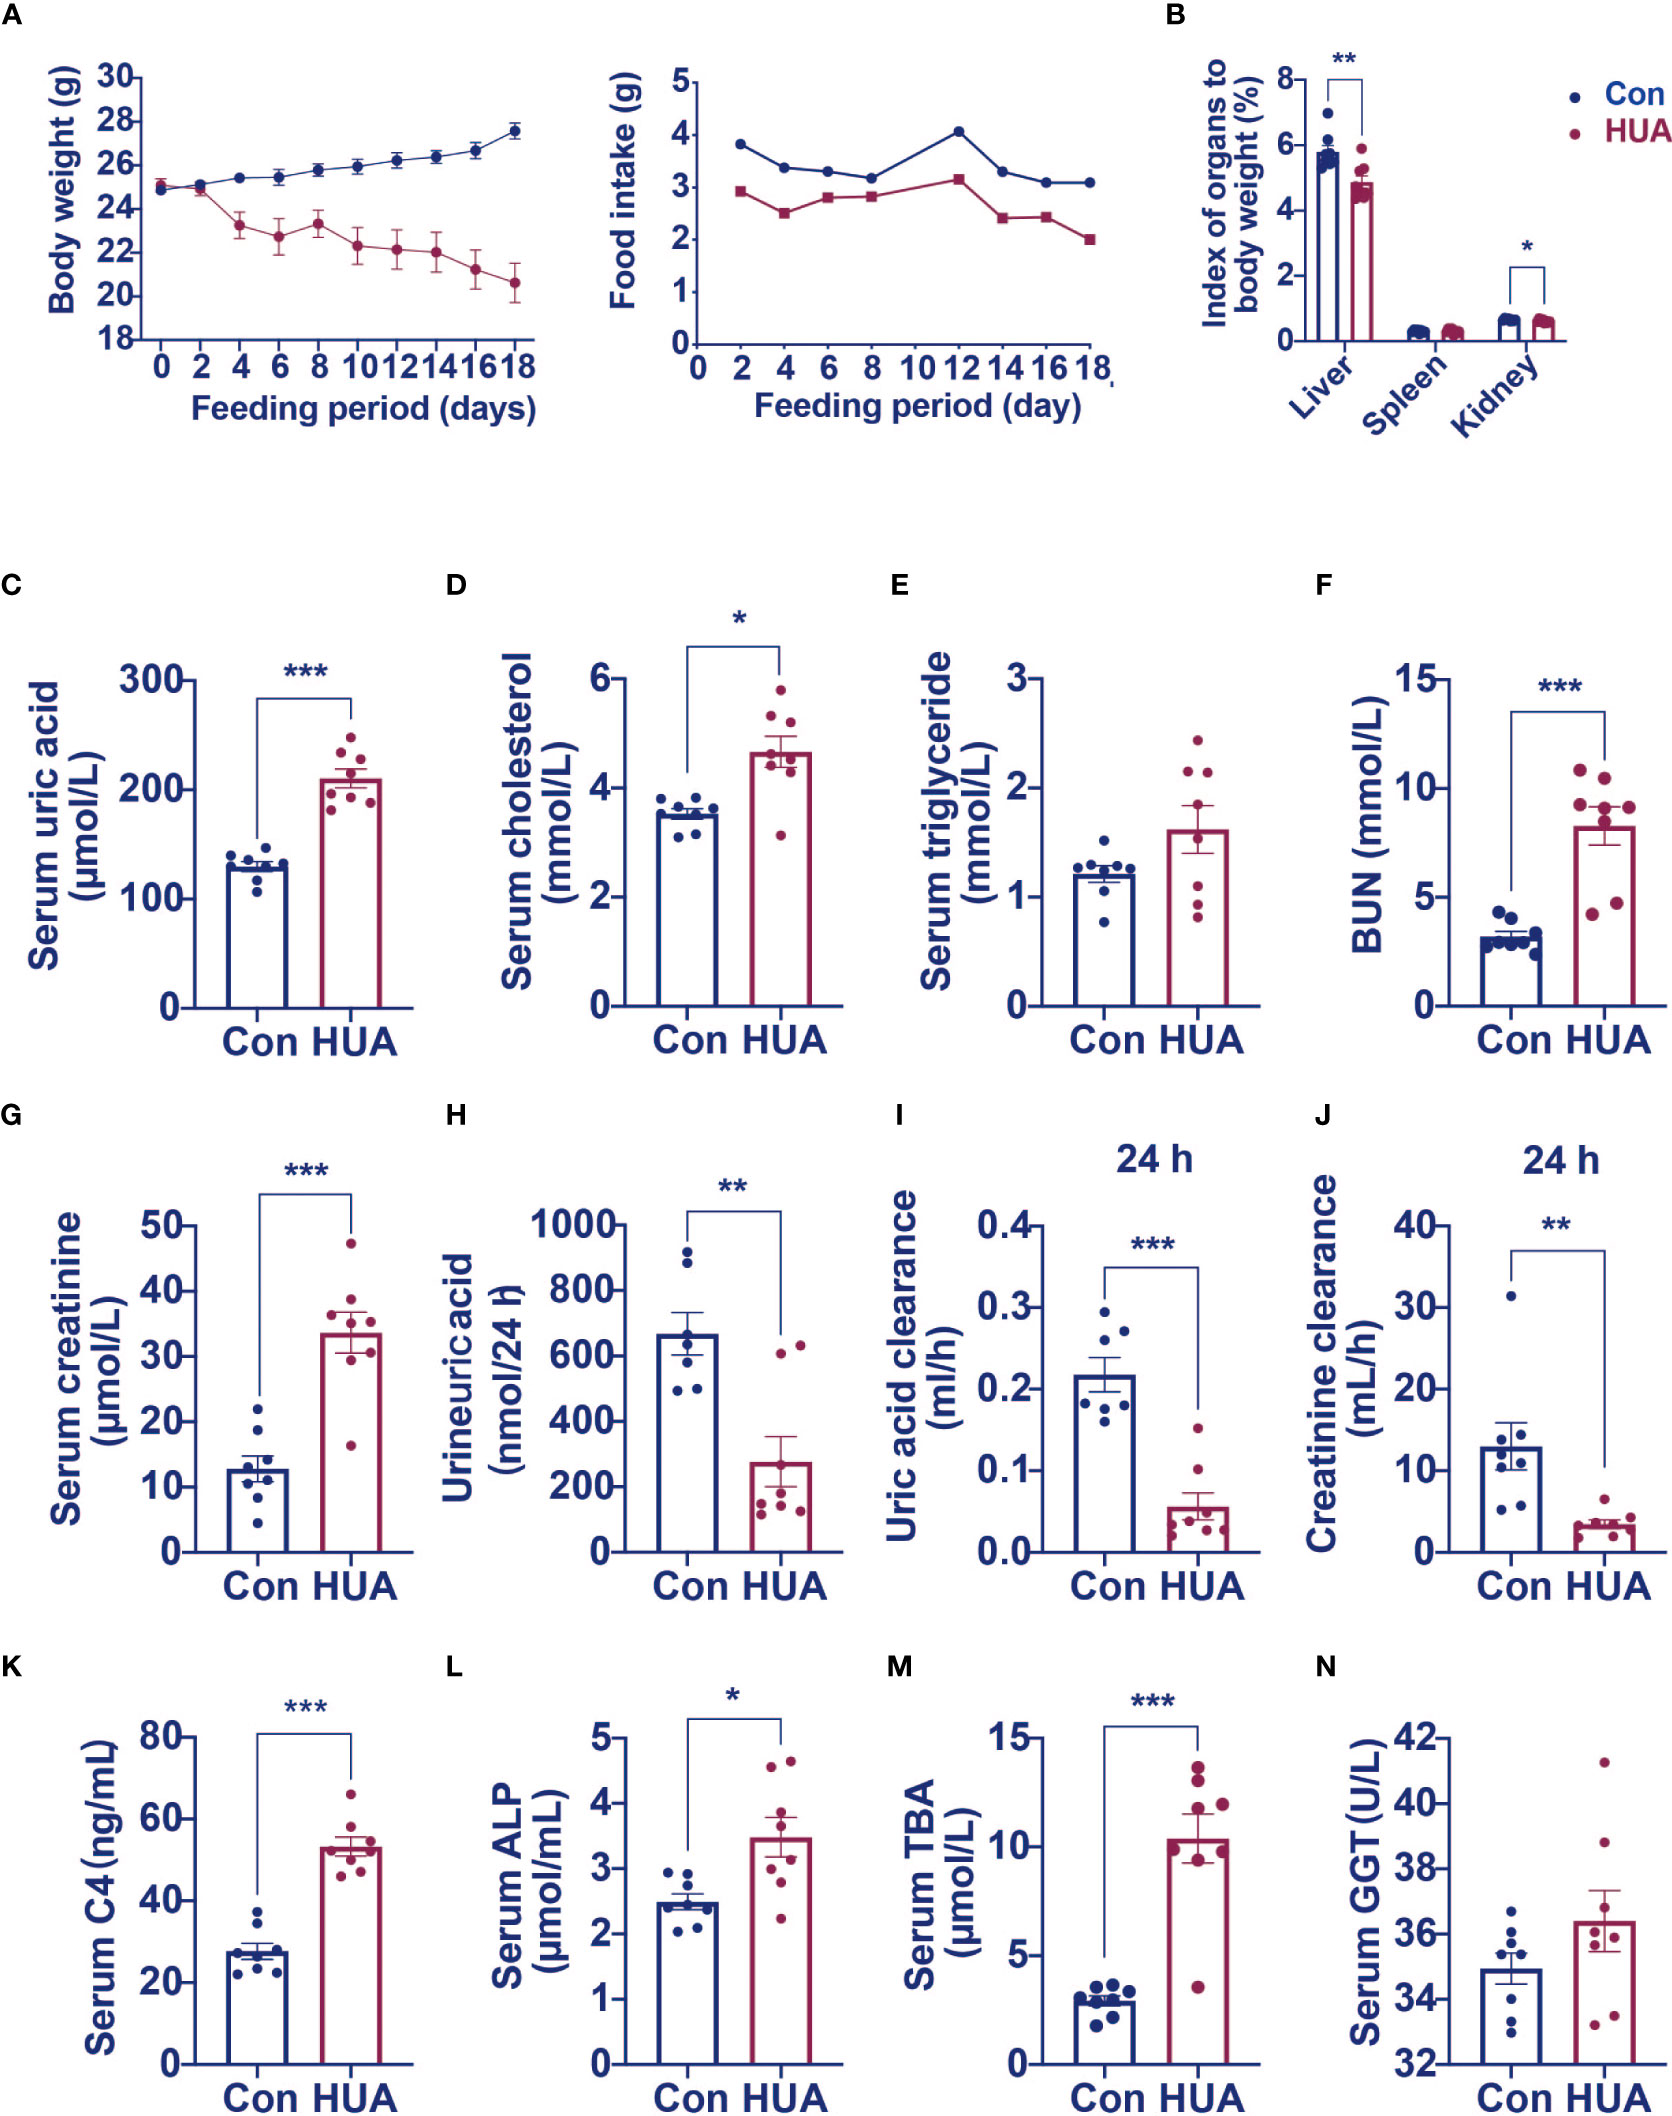
Figure 1 Serum levels of C4, ALP and TBA were elevated in hyperuricemia mice (n=8). Normal control C57BL/6J mice group (Con), PO and adenine induced hyperuricemia mice group (HUA). (A) The body weight and food intake of control and hyperuricemia mice. (B) The organ index of control and hyperuricemia mice. (C) Serum uric acid level. (D) Serum cholesterol level. (E) Serum triglycerides level. (F) Serum BUN level. (G) Serum creatinine level. (H) Uric acid excretion in 24h urine. (I) Uric acid clearance in 24 h. (J) Creatinine clearance in 24 h. (K) Serum C4 level. (L) Serum ALP level. (M) Serum TBA level. (N) Serum GGT level. Data are presented as mean ± S.E.M. *p < 0.05, **p < 0.01, ***p < 0.001 vs control mice group.
High level of GGT was considered as a biomarker of liver or bile duct damage. We measured C4 (a marker of bile acid synthesis), ALP (a marker of cholestasis), and TBA levels to identify changes in bile acid metabolism in the hyperuricemia mice. We found significantly higher serum C4 (92% higher), ALP (40% higher), and TBA (254% higher) levels in the hyperuricemia group when compared to the control group (Figures 1K–M). GGT level was only slightly elevated in the hyperuricemia mice Figure 1N, however, there is a significant positive correlation between blood uric acid and GGT in hyperuricemia patients. These data indicated that hyperuricemia led to dysregulation of bile acid metabolism, which might partly contribute to the liver cell damage.
Hyperuricemia mice showed elevated levels of ALP, TBA, and C4, which are similar to the early changes in cholestasis (9). We further tested the expression of cholesterol synthesis genes, bile acid synthesis genes, and bile acid transport genes in hyperuricemia mice. Compared with the control group, the mRNA levels of cholesterol synthesis regulatory enzyme 3-hydroxy-3-methylglutaryl-CoA reductase (HMGCR) was 77% higher (Figure 2C), and transcription factors hepatocyte nuclear factor 4α (HNF4α) 60% higher, whereas the mRNA levels of transcription factors small heterodimer partner (SHP) and liver receptor homolog (LRH) (Figure 2D) were 88% and 60% lower, respectively, and bile acid transporters bile salt export pump (BSEP) and sodium taurocholate co-transporting polypeptide (NTCP) 62% and 57% lower, respectively (Figure 2B).
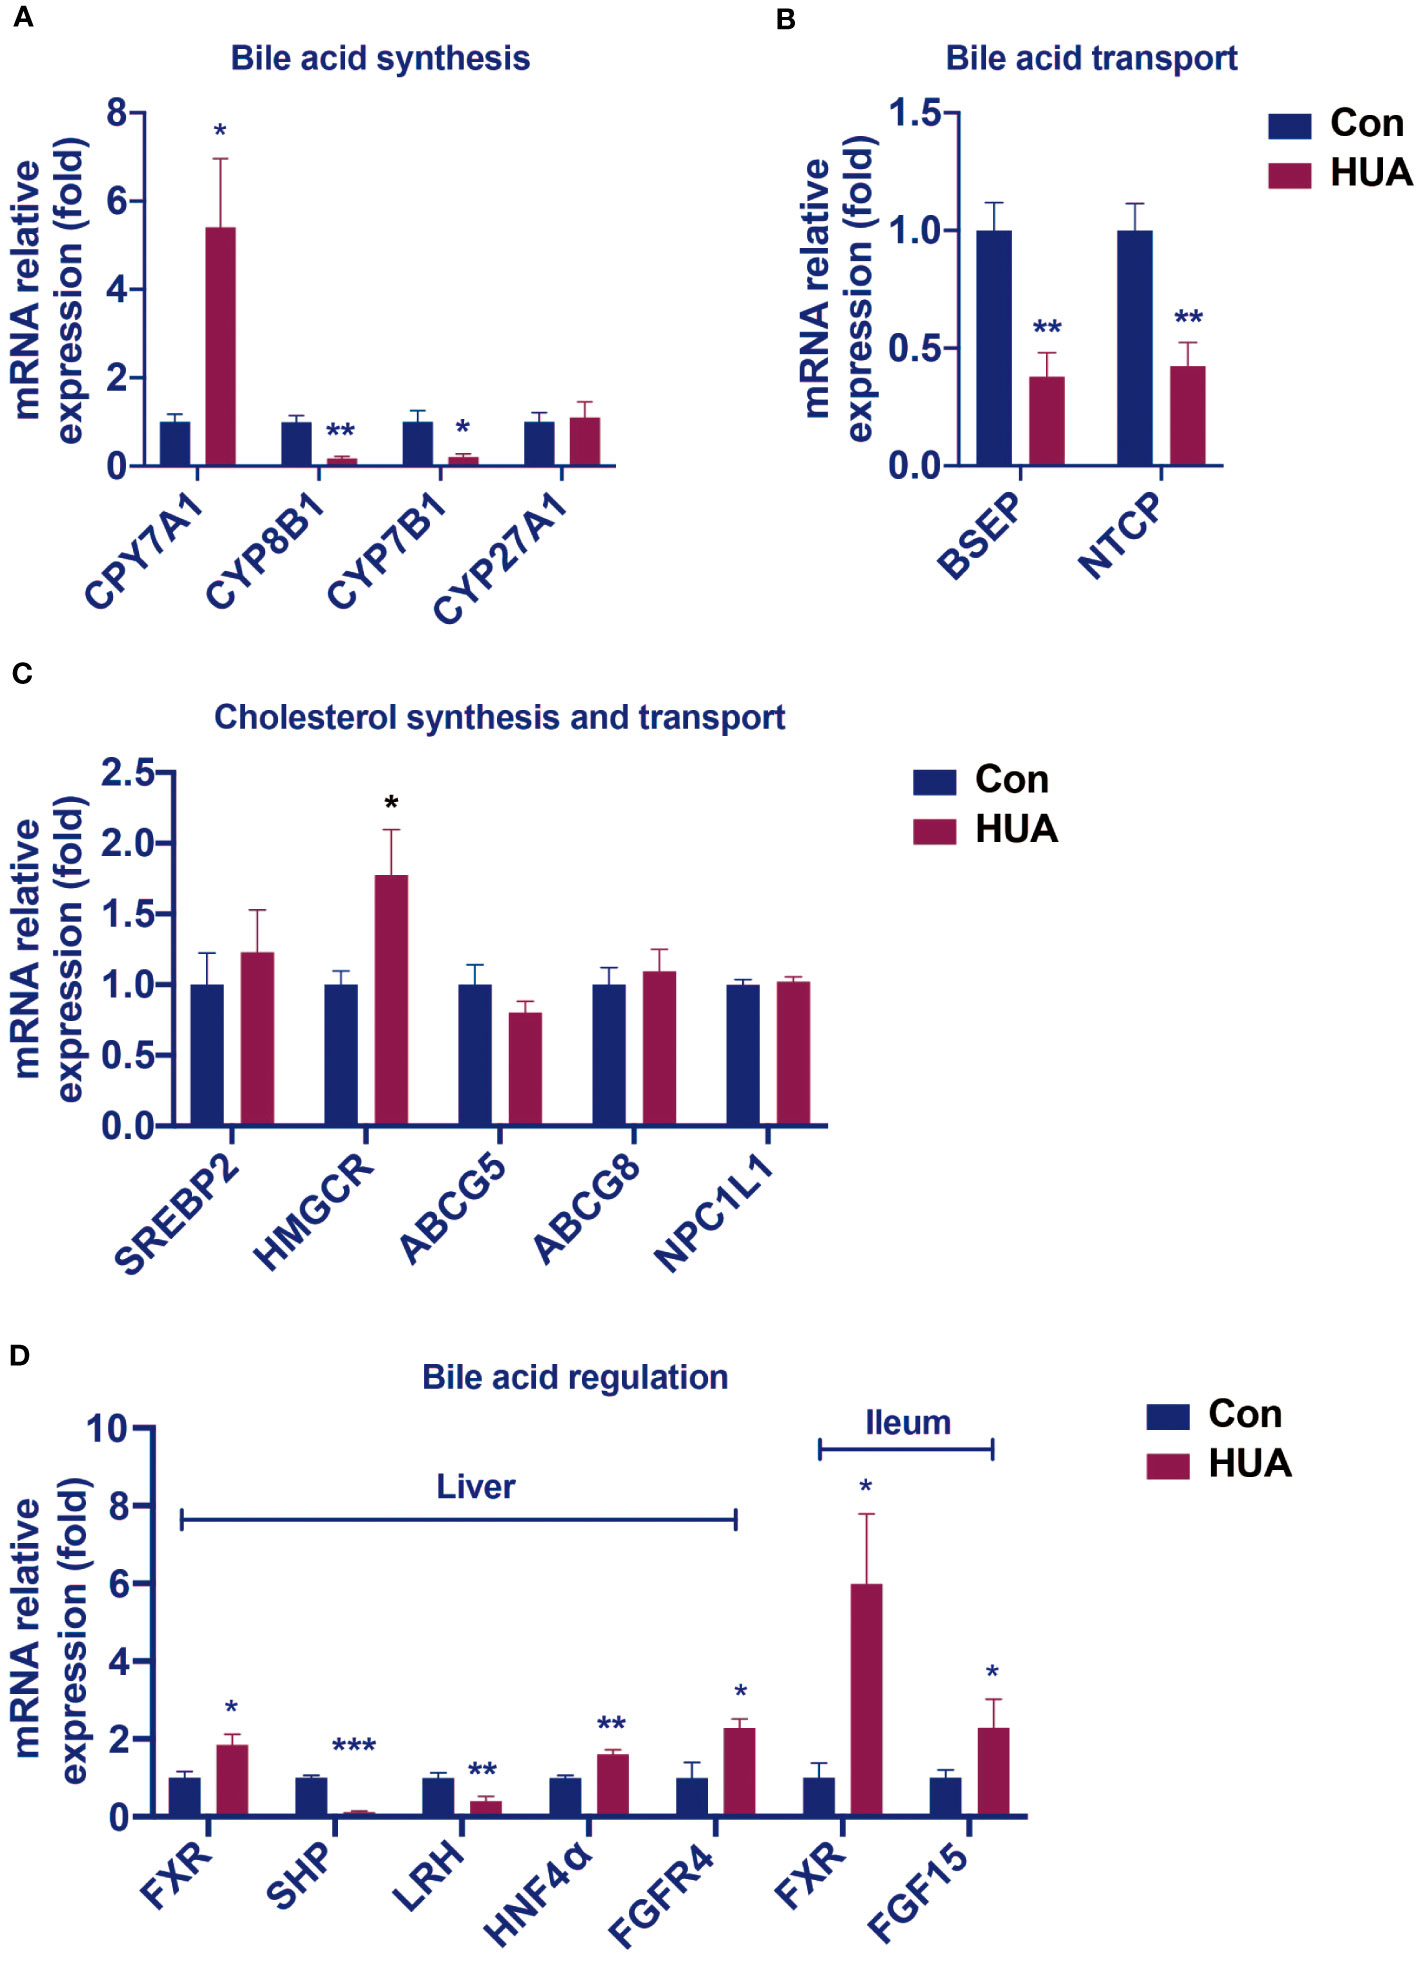
Figure 2 Changes in the hepatic mRNA levels of genes involved in BA and cholesterol homeostasis in hyperuricemia mice. Normal control C57BL/6J mice group (Con), PO and adenine induced hyperuricemia mice group (HUA). (A) The mRNA levels of genes involved in bile acid synthesis. (B) The mRNA levels of genes involved in bile acid transport. (C) The mRNA levels of genes involved in cholesterol synthesis and transport. (D) The mRNA levels of genes involved in bile acid regulation. Data are presented as mean ± S.E.M. *p < 0.05, **p < 0.01, ***p < 0.001 vs control mice group.
In the liver of the hyperuricemia mice, CYP7A1 expression (Figure 2A) was significantly higher than the control by 441%. These data indicated that hyperuricemia related impairment of bile acid homeostasis was similar to cholestasis.
Compared with the control group, the hyperuricemia mice showed increased mRNA levels of hepatic FXR and FGFR4, as well as the ileal FXR and FGF15 (Figure 2D), which were different from those in cholestasis.
We found that the relative mRNA levels of hepatic FGF21 was lower by 31% in the hyperuricemia mice than that in the control (Figure 3A), demonstrating that the over-expression of CYP7A1 in the liver was linked to a glucocorticoid disorder. Further studies revealed that serum cortisol level was lower (Figures 3B, C) both in hyperuricemia human and hyperuricemia mice, and 24-h urine cortisol was higher (Figure 3E) in hyperuricemia mice with normal corticosteroid-binding globulin (CBG) level (Figure 3F). Serum corticosterone level and 24 h urine corticosterone in hyperuricemia mice showed no significant difference compared with control group (Figures 3D, G). The results suggested an abnormal cortisol metabolism pattern occurred in the hyperuricemia subjects. We denominated it as PHAL.
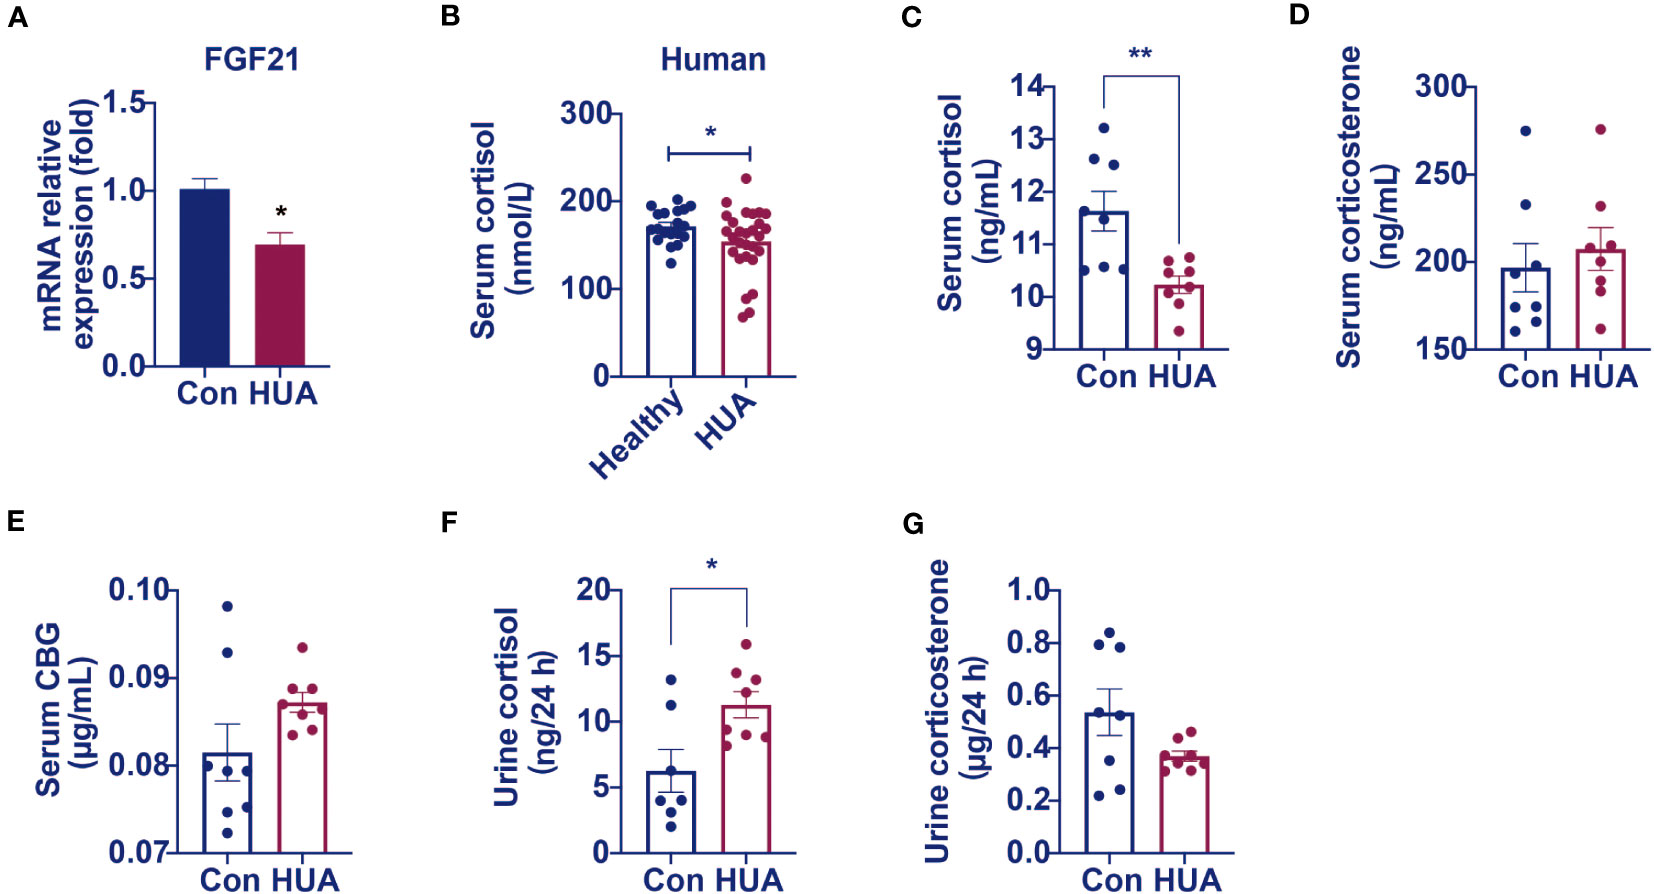
Figure 3 Circulating cortisol levels decreased and 24 h urine free cortisol levels increased in hyperuricemia mice. Normal control C57BL/6J mice group (Con), PO and adenine induced hyperuricemia mice group (HUA). (A) The mRNA level of hepatic FGF21. (B) Serum cortisol level in hyperuricemia subjects. (C) Serum cortisol level in control and hyperuricemia mice. (D) Serum corticosterone level in control and hyperuricemia mice. (E) Serum CBG level in control and hyperuricemia mice. (F) 24 h urine free cortisol in control and hyperuricemia mice. (G) 24 h urine corticosterone in control and hyperuricemia mice. Data are presented as mean ± S.E.M. *p < 0.05, **p < 0.01, ***p < 0.001 vs control mice group.
The cells of the adrenal cortex were arranged in a regular pattern, with rich cytoplasm, round or oval nuclei, and uniform cell size in both the hyperuricemia mice and the control. However, the zona fasciculata cells were enlarged and irregularly arranged in the hyperuricemia mice (Figure 4A). The number of cells per unit area was not significantly different between the hyperuricemia mice and the control (Figure 4B). Considering the insufficient cortisol levels in the hyperuricemia mice, we performed ACTH stimulation test to examine the adrenocortical function. The serum cortisol levels increased in the control mice after ACTH administration, but not in the hyperuricemia mice, indicating that the adrenal glands of the hyperuricemia mice were not responsive to ACTH (Figure 4C). Furthermore, considering the increased 24h urine cortisol, a dexamethasone suppression test was used to evaluate the negative feedback control of the HPA axis. ACTH and cortisol levels were suppressed in the control mice in response to dexamethasone, indicating that the HPA axis was intact (Figure 4D). However, in the hyperuricemia mice, although the ACTH level was suppressed, the cortisol level showed no response to dexamethasone (Figures 4D, E). Taken together, these data demonstrated that the HPA axis of the hyperuricemia mice was partially resistant to feedback inhibition by exogenous steroids, which is different from those in hypercortisolism and adrenal insufficiency.
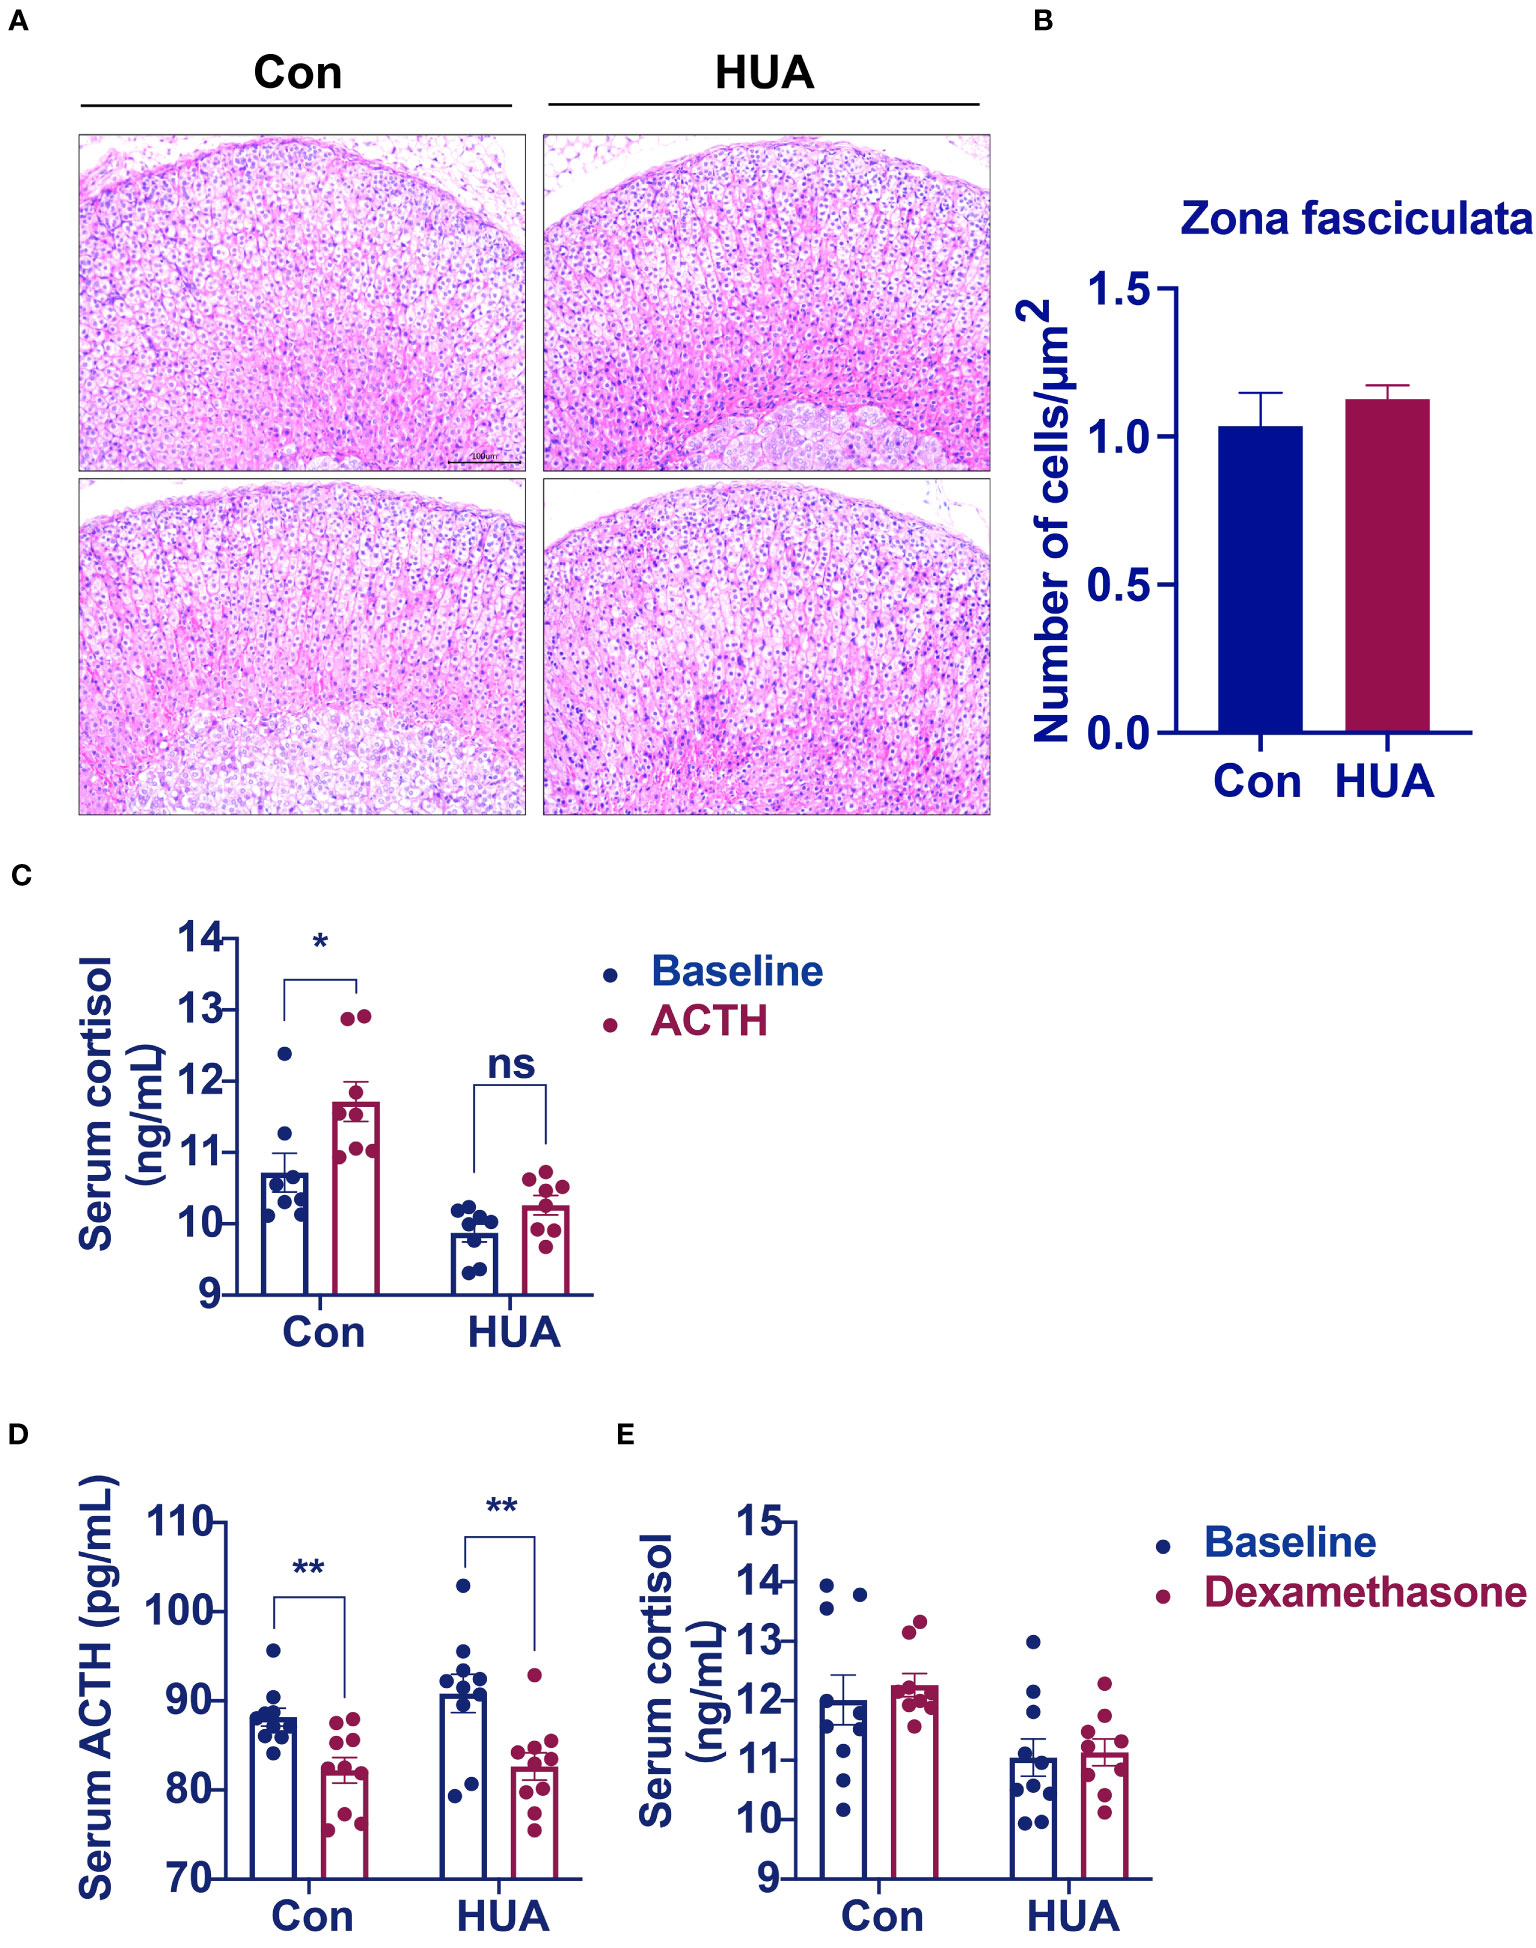
Figure 4 Morphological analysis of the adrenal glands. Normal control C57BL/6J mice group (Con), PO and adenine induced hyperuricemia mice group (HUA). (A) Adrenal glands for H&E staining (20x). (B) The number of cells zona fasciculata of the adrenal gland. (C) Serum cortisol level of mice in ACTH stimulation test. (D, E) Serum ACTH and cortisol levels of mice in dexamethasone suppression test. Data are presented as mean ± S.E.M. ns, no significance *p < 0.05, **p < 0.01 vs control mice group.
We hypothesized that damage of the liver cells impaired the clearance of cortisol and reduced cortisol production by suppressing the HPA axis. It is well known that the principal cortisol clearance occurs in the liver (5α, β-reductase) and the kidney (11β-hydroxysteroid dehydrogenase 2, 11β-HSD2), through which cortisol is eventually converted to cortisone, and excreted in urine (10, 11). Compared to the control, the hyperuricemia mice had a reduced mRNA level of hepatic 5α-reductase (Figure 5A) and increased hepatic 5β-reductase (Figure 5B), with no difference in the mRNA level of hepatic 11β-HSD1 (Figure 5C). In the kidney, 11β-HSD2 expression was down-regulated by 66% compared to the control (Figure 5D). It was reported that 5α-reductase plays a more important role than 5β-reductase in cortisol clearance (11). The above results indicated that cortisol clearance was impaired in a hyperuricemia state. Further gene expression studies revealed that glucocorticoid receptor α (GRα), but not GRβ was significantly up-regulated in the liver of the hyperuricemia mice, which confirmed the increased exposure of cortisol in the liver (Figures 5E, F).
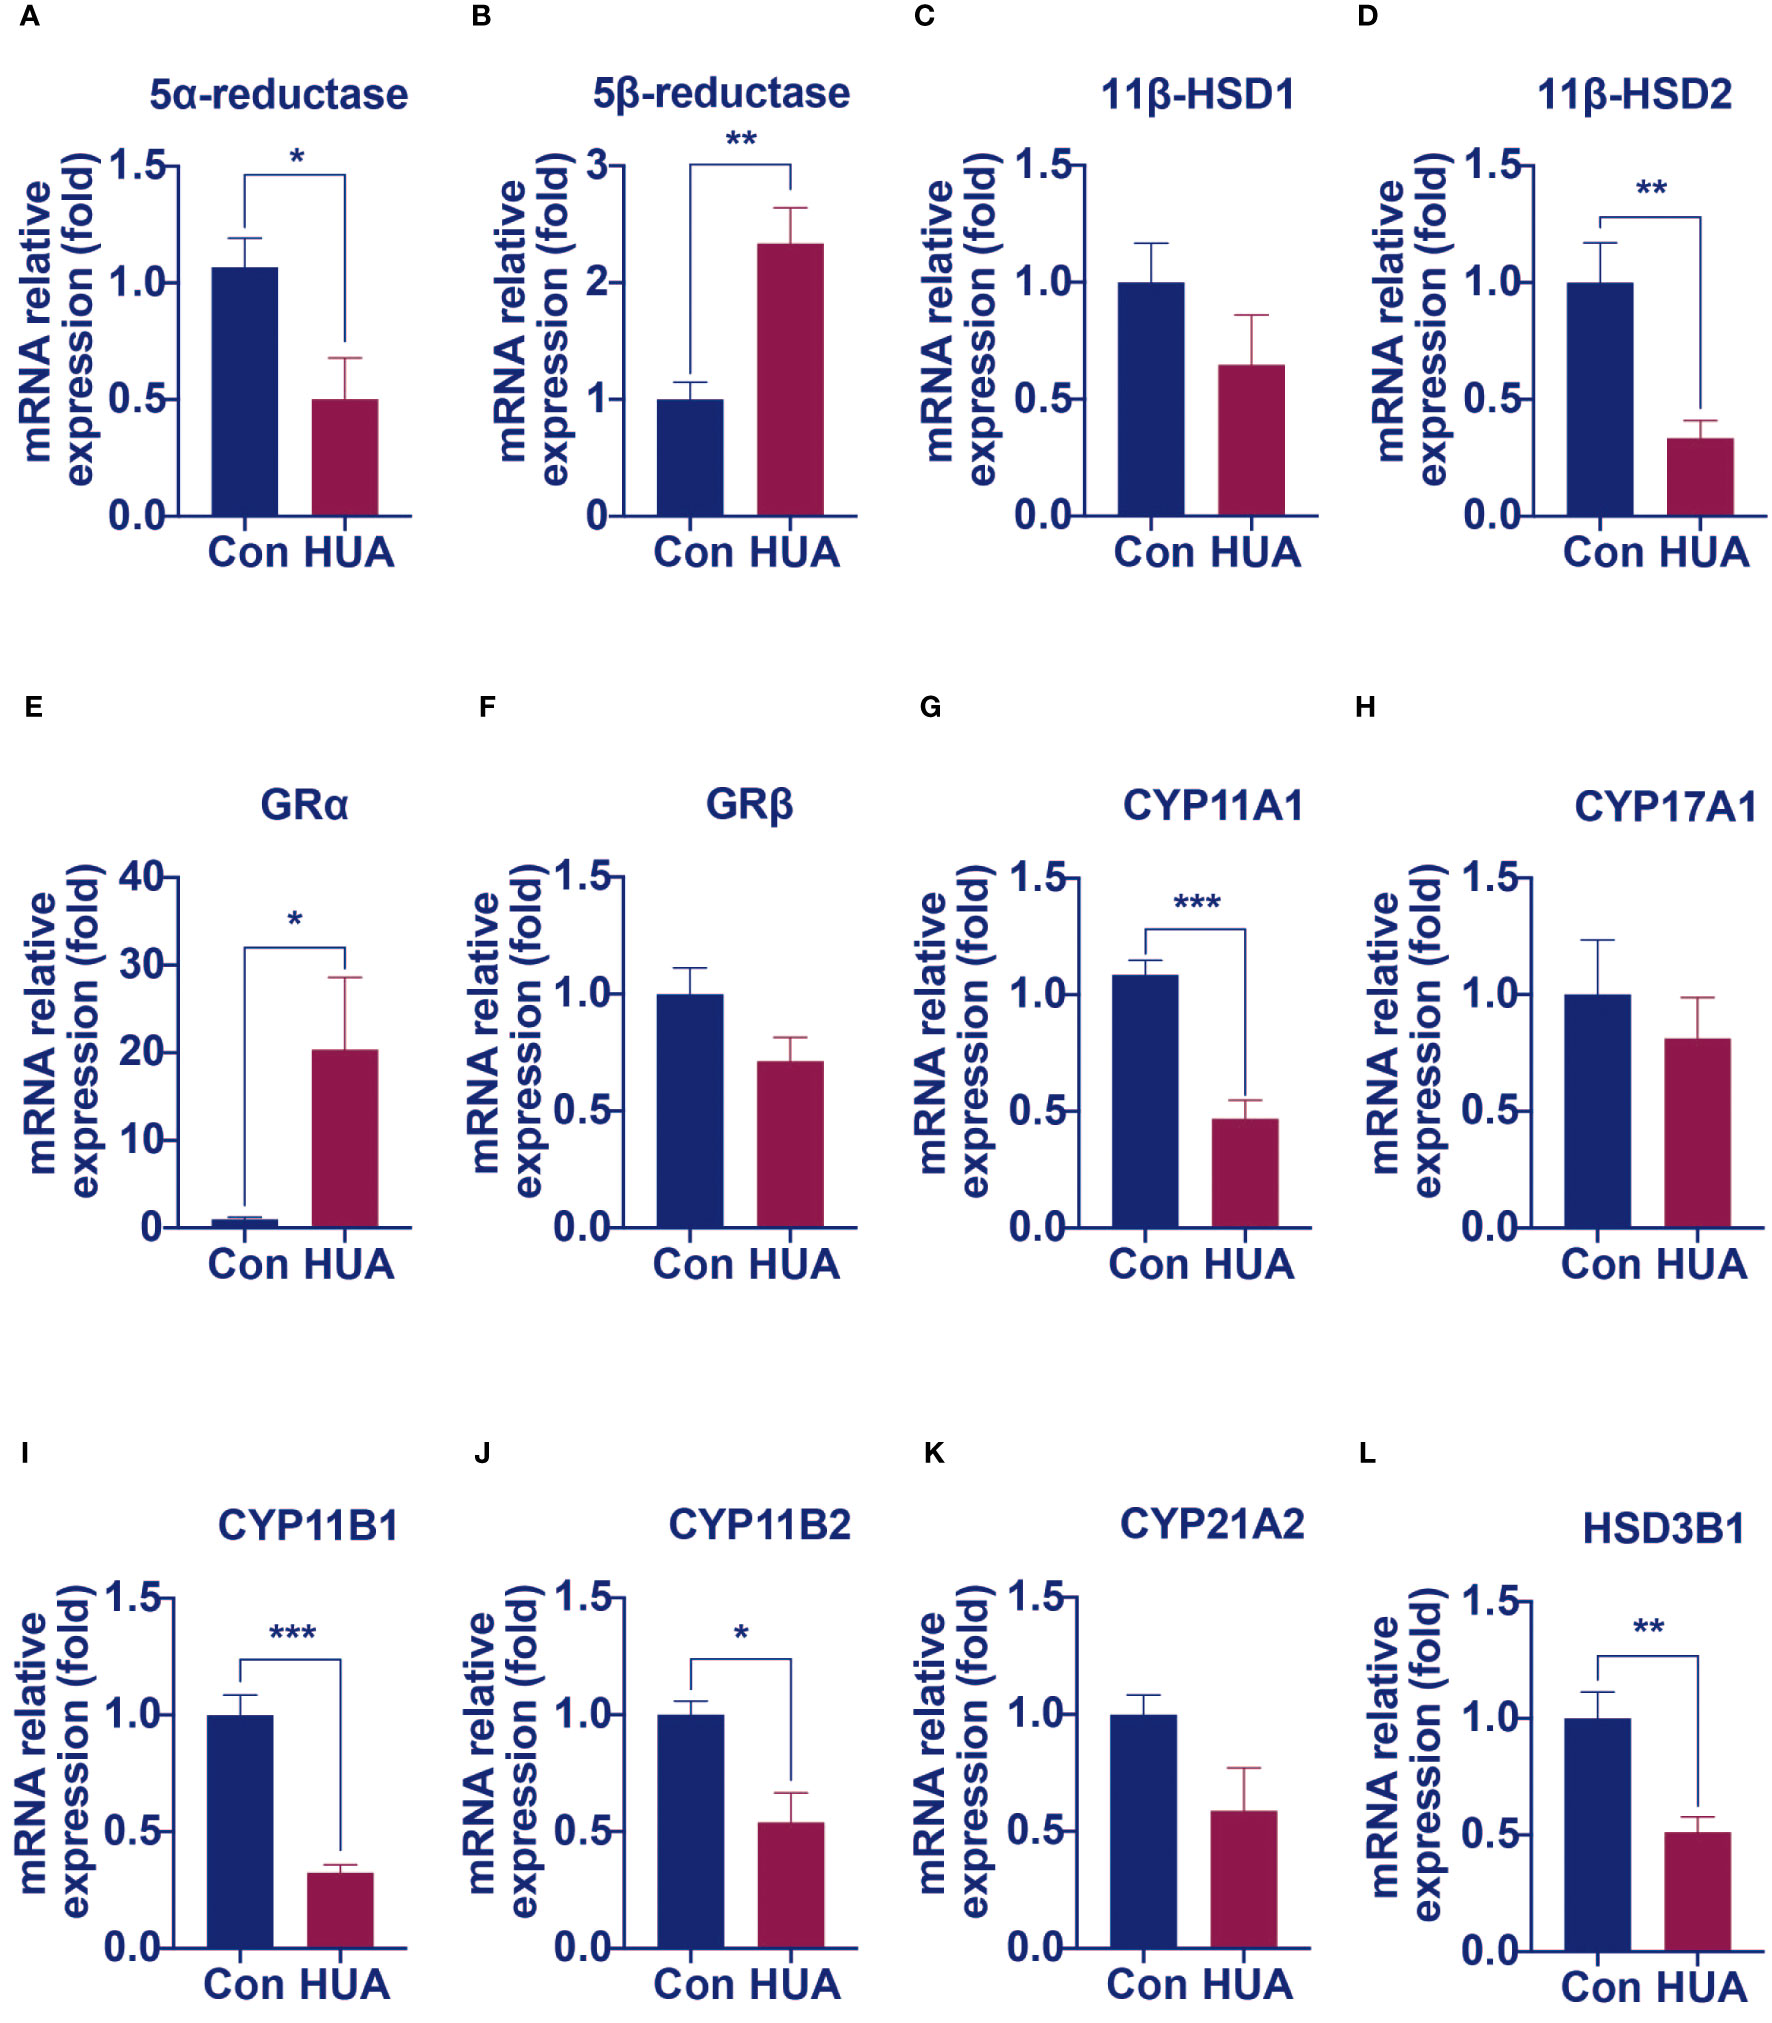
Figure 5 The mRNA levels of genes involved in cortisol clearance and steroidogenesis decreased in hyperuricemia mice. Normal control C57BL/6J mice group (Con), PO and adenine induced hyperuricemia mice group (HUA). (A, B) The hepatic mRNA levels of 5α-reductase and 5β-reductase. (C, D) The mRNA levels of genes involved in regenerating cortisol from inactive cortisone. (E, F) The hepatic mRNA levels of glucocorticoid receptor α and β. (G–L) The mRNA levels of steroidogenesis‐related genes in mouse adrenals. Data are presented as mean ± S.E.M. *p < 0.05, **p < 0.01, ***p < 0.001 vs control mice group.
Cortisol synthesis is a tightly controlled pathway, with over 10 enzymes involved. We next examined the mRNA levels of these enzymes. Compared with the control mice, the mRNA levels of enzymes such as cytochrome P450 family 11 Subfamily a member 1 (CYP11A1), 11β-hydroxylase (CYP11B1), aldosterone synthase (CYP11B2) and 3β-hydroxysteroid dehydrogenase 1 (HSD3B1) were significantly lower in the adrenal of hyperuricemia mice. Other enzymes, such as cytochrome P450 family 17 subfamily A member 1 (CYP17A1) and 21-hydroxylase (CYP21A1), showed no significant changes under hyperuricemia conditions (Figures 5G–L). These results were consistent with our previous findings of lower total cortisol levels in the hyperuricemia mice.
Long-term high serum uric acid level is a risk factor of hyperlipidemia, and cardiovascular disease. However, the underlying mechanism is unclear. By analyzing hyperuricemia patients’ blood samples, we found that approximately half of the hyperuricemia patients had elevated GGT levels, indicating that hyperuricemia caused hepatic injury and mild cholestasis. To date, the mechanism of this pathophysiological process has not yet been clarified.
Both imbalanced cortisol metabolism and extrinsic glucocorticoids can cause hepatic injury, dysmetabolism of cholesterols, depression, and hypertension etc. (12–14). It had been reported that abnormal cortisol metabolism induced cholestatic liver injury (6). In the cholestasis mice with single-sided adrenalectomy, the hepatic injury was alleviated along with decreased serum glucocorticoid levels. Meanwhile, the expression of HMGCR was reduced, and serum cholesterol levels declined. Similar effect was observed when using glucocorticoid receptor antagonists (6).
In this study, we discovered the hyperuricemia induced dysmetabolism of cortisol for the first time. Based on the clinical and experimental data, we found that hyperuricemia was associated with lower total cortisol levels, higher urine free cortisol levels, and slower cortisol clearance when compared with the controls. We designated this condition as “PHAL”.
Low total cortisol level is usually due to decreased adrenal production. We found in this study that in PHAL, the ACTH levels were within normal limit. However, the adrenal glands failed to respond to ACTH properly, leading to low cortisol production, and decreased expression levels of CYP11A1, CYP11B1/2, and HSD3B1, three key enzymes for cortisol synthesis.
The degradation of corticosteroids starts as soon as the hormones are released into blood. The amount of bioavailable cortisol is determined by the hepatic and renal clearance (15). The steroid 5α and 5β-reductases in the liver metabolize cortisol to tetrahydrocortisone, where the 5α-reductase is the major enzyme. The 11β-HSD2 in the kidneys converts cortisol to cortisone (10). In this study, we found that hyperuricemia significantly reduced the expression of both hepatic 5α-reductase and renal 11β-HSD2, which led to low cortisol clearance.
More than 90% of the metabolites of corticosteroid hormones are excreted in urine. In PHAL, the excretion of corticosteroids through the kidneys was 70% higher than that under normal condition, further indicating that low hepatic and renal clearance led to more undegraded free cortisol excreted in urine.
Based on the above results, we postulated a possible pathogenic mechanism of PHAL induced cholesterol metabolism disorder under hyperuricemia conditions. PHAL increases exposure to the bioavailable cortisol in organs such as the liver, leading to local amplification of the biological action of corticosteroids. This causes over-activation of the corticosteroid receptors locally. If this condition persists, it may lead to inhibition of the HPA axis via negative feedback, downregulate the production of cortisol compensatorily, and cause adrenal atrophy, which further exacerbates cortisol dysmetabolism.
PHAL is different from Cushing’s syndrome and adrenal insufficiency (Table 4). In Cushing’s syndrome, both serum cortisol and ACTH levels are higher than normal, which is not suppressed by low dose dexamethasone. Urine cortisol levels are high in Cushing’s syndrome. In PHAL, total cortisol levels are lower than normal, with ACTH in the normal range. Low dose dexamethasone only suppresses ACTH, but does not reduce cortisol levels. Urine cortisol levels are also high in PHAL. In adrenal insufficiency, total cortisol levels are low, with high or low ACTH levels in primary or secondary adrenal insufficiency, respectively. Urine cortisol levels are usually low in adrenal insufficiency. In addition, relative adrenal insufficiency had been observed in other chronic disease, such as cholestasis (insufficient in cortisol clearance) (31, 32), and functional hypercortisolism in metabolic syndrome (11β-HSD1 and the pre-receptor regulation) (33, 34). Serum cortisol level was either increased or normal in relative adrenal insufficiency, different from that in hyperuricemia induced PHAL. Intestinal and hepatic FXR were commonly suppressed in cholestasis, and contrarily activated in PHAL. This difference may come from metabolites of purine, which induced hepatic cell injury from different pathological way. The mechanisms need to be further investigated.
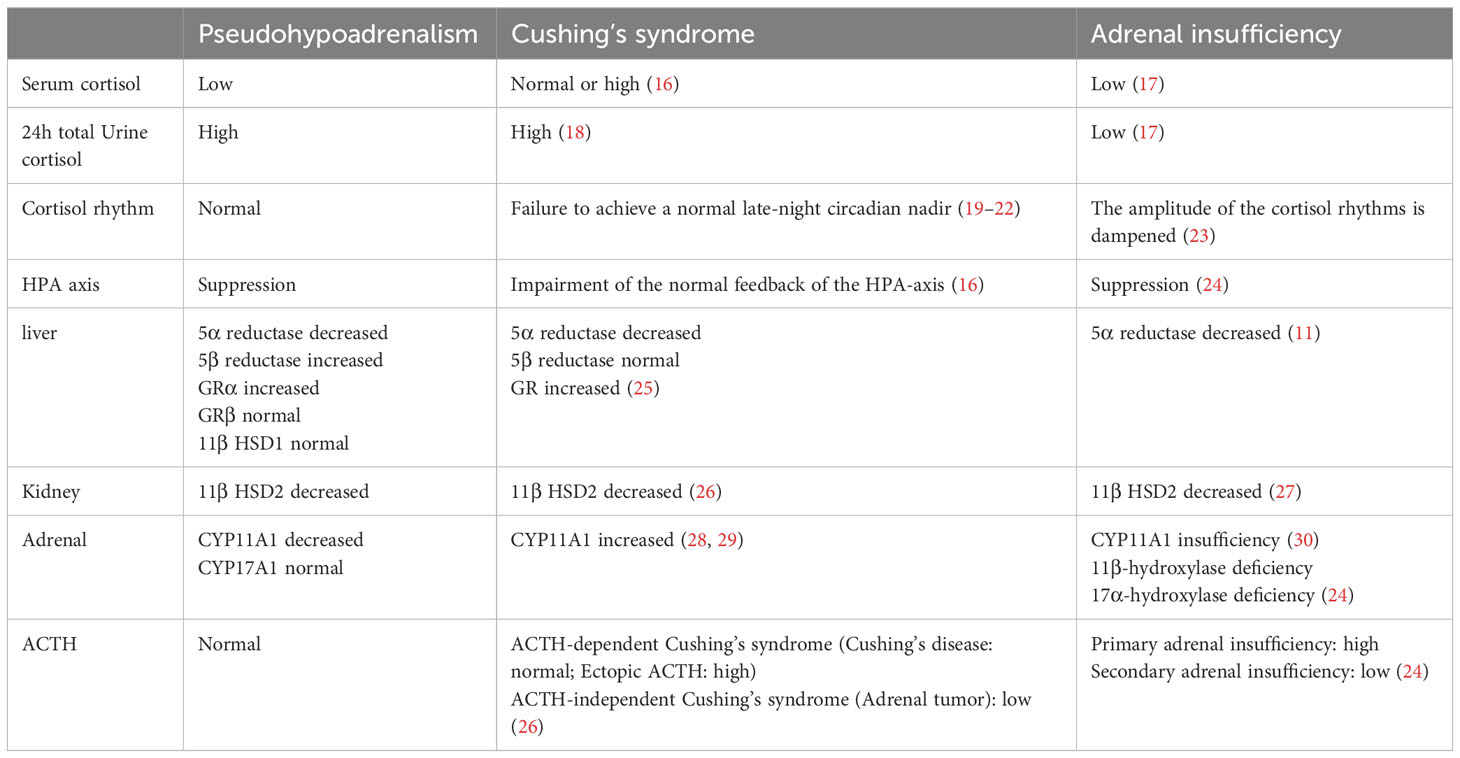
Table 4 Altered cortisol in Pseudohypoadrenalism, Cushing’s syndrome and Adrenal insufficiency.
Our group had focused on the effect of PHAL on metabolic diseases. Imbalanced corticosteroid hormones are known to cause not only hypercholesterolemia, but also hyperlipidemia, non-alcoholic fatty liver disease, cardiovascular diseases, and diabetes (35, 14). These metabolic diseases are common comorbidities in a large percentage of people with hyperuricemia. In the future, we will further our work on the relationship between PHAL and metabolic diseases.
In summary, cortisol is involved in hyperuricemia associated dysmetabolism of cholesterols. Clinically, attention should be paid to the cortisol levels while managing hyperuricemia. PHAL is a mild form of cortisol dysmetabolism, with nearly intact adrenal function. Hormone replacement is not necessary for PHAL. Maintaining homeostasis of cortisol metabolism in PHAL could be achieved by adjusting circadian rhythm, exercise, or amino acid supplementation, in order to subsequently ameliorate dysmetabolism of cholesterols related to hyperuricemia. More studies are needed to further clarify the mechanism of PHAL, which may offer new therapeutic strategies for hyperuricemia and its complications.
The original contributions presented in the study are included in the article/supplementary material. Further inquiries can be directed to the corresponding authors.
The studies involving humans were approved by the Second teaching hospital of Tianjin University of Traditional Chinese Medicine. The studies were conducted in accordance with the local legislation and institutional requirements. The participants provided their written informed consent to participate in this study. The animal study was approved by the Science and Technological Committee and the Animal Use and Care Committee of TJUTCM. The study was conducted in accordance with the local legislation and institutional requirements.
RB: Conceptualization, Methodology, Writing — original draft, Investigation. BC: Formal analysis, Methodology, Writing — original draft. JP: Investigation, Methodology, Writing- review & editing. AW: Investigation, Writing — review & editing. HY: Data curation, Formal analysis, Writing — review & editing. QC: Data curation, Formal analysis, Writing — review & editing. YZ: Conceptualization, Investigation, Writing — review & editing. TW: Conceptualization, Project administration, Resources, Writing — review & editing.
The author(s) declare financial support was received for the research, authorship, and/or publication of this article. This work was supported by Important Drug Development Fund, Ministry of Science and Technology of China (2018ZX09735-002); Innovation Team and Talents Cultivation Program of National Administration of Traditional Chinese Medicine ( ZYYCXTD-C-202009).
The authors declare that the research was conducted in the absence of any commercial or financial relationships that could be construed as a potential conflict of interest.
All claims expressed in this article are solely those of the authors and do not necessarily represent those of their affiliated organizations, or those of the publisher, the editors and the reviewers. Any product that may be evaluated in this article, or claim that may be made by its manufacturer, is not guaranteed or endorsed by the publisher.
1. So A, Thorens B. Uric acid transport and disease. J Clin Invest (2010) 120:1791–9. doi: 10.1172/JCI42344
2. Whitfield J. Gamma glutamyl transferase. Crit Rev Clin Lab Sci (2001) 38:263–355. doi: 10.1080/20014091084227
3. Soleimanpour H, Safari S, Rahmani F, Nejabatian A, Alavian S. Hepatic shock differential diagnosis and risk factors: A review article. Hepat Mon (2015) 15:e27063. doi: 10.5812/hepatmon.27063
4. Sansoè G, Aragno M, Wong F. Pathways of hepatic and renal damage through non-classical activation of the renin-angiotensin system in chronic liver disease. Liver Int (2020) 40:18–31. doi: 10.1111/liv.14272
5. Theiler-Schwetz V, Schlager H, Obermayer-Pietsch B, Stojakovic T, Fauler G, Fickert P, et al. Hypercortisolism in patients with cholestasis is associated with disease severity. BMC Gastroenterol (2021) 21:460. doi: 10.1186/s12876-021-02045-4
6. van der Geest R, Ouweneel A, van der Sluis R, Groen A, Van Eck M, Hoekstra M. Endogenous glucocorticoids exacerbate cholestasis-associated liver injury and hypercholesterolemia in mice. Toxicol Appl Pharmacol (2016) 306:1–7. doi: 10.1016/j.taap.2016.06.031
7. Wen S, Zhang Z, Chen X, Liu J, Yu H, Han L, et al. An improved UPLC method for determining uric acid in rat serum and comparison study with commercial colorimetric kits. Acta Chromatogr (2019) 31:201–5. doi: 10.1556/1326.2018.00449
8. Bao R, Liu M, Wang D, Wen S, Yu H, Zhong Y, et al. Eurycoma longifoliaEffect of stem extract on uric acid excretion in hyperuricemia mice. Front Pharmacol (2019) 10:1464. doi: 10.3389/fphar.2019.01464
9. Longo M, Crosignani A, Podda M. Hyperlipidemia in chronic cholestatic liver disease. Curr Treat Options Gastroenterol (2001) 4:111–4. doi: 10.1007/s11938-001-0022-6
10. Kosicka K, Cymerys M, Majchrzak-Celińska A, Chuchracki M, Główka FK. 11β-Hydroxysteroid dehydrogenase type 2 in hypertension: comparison of phenotype and genotype analysis. J Hum Hypertens (2013) 27:510–5. doi: 10.1038/jhh.2012.67
11. Livingstone D, Di Rollo E, Yang C, Codrington L, Mathews J, Kara M, et al. Relative adrenal insufficiency in mice deficient in 5α-reductase 1. J Endocrinol (2014) 222:257–66. doi: 10.1530/JOE-13-0563
12. Jain F, Connolly C, Reus V, Meyerhoff D, Yang T, Mellon S, et al. Cortisol, moderated by age, is associated with antidepressant treatment outcome and memory improvement in Major Depressive Disorder: A retrospective analysis. Psychoneuroendocrinology (2019) 109:104386. doi: 10.1016/j.psyneuen.2019.104386
13. Ortiz R, Kluwe B, Lazarus S, Teruel M, Joseph J. Cortisol and cardiometabolic disease: a target for advancing health equity. Trends Endocrinol Metab (2022) 33:786–97. doi: 10.1016/j.tem.2022.08.002
14. Vega-Beyhart A, Iruarrizaga M, Pané A, García-Eguren G, Giró O, Boswell L, et al. Endogenous cortisol excess confers a unique lipid signature and metabolic network. J Mol Med (Berlin Germany) (2021) 99:1085–99. doi: 10.1007/s00109-021-02076-0
15. Perogamvros I, Ray DW, Trainer PJ. Regulation of cortisol bioavailability–effects on hormone measurement and action. Nat Rev Endocrinol (2012) 8:717–27. doi: 10.1038/nrendo.2012.134
16. Makras P, Toloumis G, Papadogias D, Kaltsas G, Besser M. The diagnosis and differential diagnosis of endogenous Cushing's syndrome. Hormones (Athens Greece) (2006) 5:231–50. doi: 10.14310/horm.2002.11189
17. Husebye E, Pearce S, Krone N, Kämpe O. Adrenal insufficiency. Lancet (London England) (2021) 397:613–29. doi: 10.1016/S0140-6736(21)00136-7
18. Putignano P, Toja P, Dubini A, Pecori Giraldi F, Corsello S, Cavagnini F. Midnight salivary cortisol versus urinary free and midnight serum cortisol as screening tests for Cushing's syndrome. J Clin Endocrinol Metab (2003) 88:4153–7. doi: 10.1210/jc.2003-030312
19. Doe RP, Vennes JA, Flink EB. Diurnal variation of 17-hydroxycorticosteroids, sodium, potassium, magnesium and creatinine in normal subjects and in cases of treated adrenal insufficiency and Cushing's syndrome. J Clin Endocrinol Metab (1960) 20:253–65. doi: 10.1210/jcem-20-2-253
20. Glass AR, Zavadil AP 3rd, Halberg F, Cornelissen G, Schaaf M. Circadian rhythm of serum cortisol in Cushing's disease. J Clin Endocrinol Metab (1984) 59:161–5. doi: 10.1210/jcem-59-1-161
21. Lacroix A, Bourdeau I. Bilateral adrenal Cushing's syndrome: macronodular adrenal hyperplasia and primary pigmented nodular adrenocortical disease. Endocrinol Metab Clin North Am (2005) 34:441–458, x. doi: 10.1016/j.ecl.2005.01.004
22. Van Cauter E, Refetoff S. Evidence for two subtypes of Cushing's disease based on the analysis of episodic cortisol secretion. N Engl J Med (1985) 312:1343–9. doi: 10.1056/NEJM198505233122102
23. Chung S, Son G, Kim K. Circadian rhythm of adrenal glucocorticoid: its regulation and clinical implications. Biochim Biophys Acta (2011) 1812:581–91. doi: 10.1016/j.bbadis.2011.02.003
24. Hahner S, Ross R, Arlt W, Bancos I, Burger-Stritt S, Torpy D, et al. Adrenal insufficiency. Nat Rev Dis Primers (2021) 7:19. doi: 10.1038/s41572-021-00252-7
25. Molitch M. Glucocorticoid receptor blockers. Pituitary (2022) 25:733–6. doi: 10.1007/s11102-022-01227-x
26. Raff H, Sharma S, Nieman L. Physiological basis for the etiology, diagnosis, and treatment of adrenal disorders: Cushing's syndrome, adrenal insufficiency, and congenital adrenal hyperplasia. Compr Physiol (2014) 4:739–69. doi: 10.1002/cphy.c130035
27. Espiard S, McQueen J, Sherlock M, Ragnarsson O, Bergthorsdottir R, Burman P, et al. Improved urinary cortisol metabolome in addison disease: A prospective trial of dual-release hydrocortisone. J Clin Endocrinol Metab (2021) 106:814–25. doi: 10.1210/clinem/dgaa862
28. Antonini S, Baldacchino V, Tremblay J, Hamet P, Lacroix A. Expression of ACTH receptor pathway genes in glucose-dependent insulinotrophic peptide (GIP)-dependent Cushing's syndrome. Clin Endocrinol (2006) 64:29–36. doi: 10.1111/j.1365-2265.2005.02411.x
29. Baba R, Oki K, Gomez-Sanchez C, Otagaki Y, Itcho K, Kobuke K, et al. Genotype-specific cortisol production associated with Cushing's syndrome adenoma with PRKACA mutations. Mol Cell Endocrinol (2021) 538:111456. doi: 10.1016/j.mce.2021.111456
30. Buonocore F, Achermann J. Primary adrenal insufficiency: New genetic causes and their long-term consequences. Clin Endocrinol (2020) 92:11–20. doi: 10.1111/cen.14109
31. Jang JY, Kim TY, Sohn JH, Lee TH, Jeong SW, Park EJ, et al. Relative adrenal insufficiency in chronic liver disease: its prevalence and effects on long-term mortality. Aliment Pharmacol Ther (2014) 40:819–26. doi: 10.1111/apt.12891
32. Loriaux DL, Fleseriu M. Relative adrenal insufficiency. Curr Opin Endocrinol Diabetes Obes (2009) 16:392–400. doi: 10.1097/MED.0b013e3283307d53
33. Anagnostis P, Athyros VG, Tziomalos K, Karagiannis A, Mikhailidis DP. Clinical review: The pathogenetic role of cortisol in the metabolic syndrome: a. J Clin Endocrinol Metab (2009) 94:2692–701:hypothesis. doi: 10.1210/jc.2009-0370
34. Draper N, Stewart PM. 11β-Hydroxysteroid dehydrogenase and the pre-receptor regulation of corticosteroid hormone action. J Endocrinol (2005) 186:251–71. doi: 10.1677/joe.1.06019
Keywords: hyperuricemia, liver injury, lipid metabolism disorder, cortisol, pseudohypoadrenalism
Citation: Bao R, Chen B, Pan J, Wang A, Yu H, Chen Q, Zhang Y and Wang T (2023) Pseudohypoadrenalism, a subclinical cortisol metabolism disorder in hyperuricemia. Front. Endocrinol. 14:1279205. doi: 10.3389/fendo.2023.1279205
Received: 17 August 2023; Accepted: 31 October 2023;
Published: 16 November 2023.
Edited by:
Toshio Morikawa, Kindai University, JapanReviewed by:
Hiraku Kameda, Cedars Sinai Medical Center, United StatesCopyright © 2023 Bao, Chen, Pan, Wang, Yu, Chen, Zhang and Wang. This is an open-access article distributed under the terms of the Creative Commons Attribution License (CC BY). The use, distribution or reproduction in other forums is permitted, provided the original author(s) and the copyright owner(s) are credited and that the original publication in this journal is cited, in accordance with accepted academic practice. No use, distribution or reproduction is permitted which does not comply with these terms.
*Correspondence: Tao Wang, d2FuZ3Rhb0B0anV0Y20uZWR1LmNu; Yi Zhang, emh3d3h6aEB0anV0Y20uZWR1LmNu
Disclaimer: All claims expressed in this article are solely those of the authors and do not necessarily represent those of their affiliated organizations, or those of the publisher, the editors and the reviewers. Any product that may be evaluated in this article or claim that may be made by its manufacturer is not guaranteed or endorsed by the publisher.
Research integrity at Frontiers
Learn more about the work of our research integrity team to safeguard the quality of each article we publish.