 Ai-jiao Yi1†
 Xin-Wu Cui
 Christoph F. Dietrich
 Bin Wang
- 1Department of medical ultrasound, Yueyang Central Hospital, Yueyang, China
- 2Department of Medical Ultrasound, Tongji Hospital, Tongji Medical College, Huazhong University of Science and Technology, Wuhan, China
- 3Department Allgemeine Innere Medizin, Kliniken Hirslanden Beau Site, Salem und Permanence, Bern, Switzerland
Objective: This study aims to evaluate the diagnostic performance of quantitative shear wave elastography (SWE) and a new qualitative color pattern SWE for the differentiation of benign and malignant American College of Radiology Thyroid Imaging, Reporting, and Data System (ACR TI-RADS) 4 or 5 category thyroid nodules measuring ≤10 mm.
Materials and methods: From May 2020 to July 2022, a total of 237 patients with 270 thyroid nodules were enrolled, and conventional ultrasound and SWE examinations were performed for each patient. Each ACR TI-RADS 4 or 5 category thyroid nodule measuring ≤10 mm was evaluated by quantitative SWE and a new qualitative color pattern SWE. The diagnostic performance of quantitative SWE parameters, the new qualitative color pattern SWE, and the combination of SWE with ACR TI-RADS, respectively, for the differentiation of benign and malignant ACR TI-RADS 4 or 5 category thyroid nodules measuring ≤10 mm was evaluated and compared.
Results: Among 270 thyroid nodules in 237 patients, 72 (26.67%) thyroid nodules were benign and 198 (73.33%) thyroid nodules were malignant. The qualitative color pattern SWE showed better diagnostic performance than the quantitative SWE parameters. When combining the qualitative color pattern SWE with ACR TI-RADS scores, with the optimal cutoff value of the total points ≥8, the thyroid nodules were considered malignant. The sensitivity, specificity, accuracy, and AUC were 89.90%, 56.94%, 81.11%, and 0.820 (95% CI: 0.768–0.864), respectively. Compared with using qualitative color pattern SWE alone, the combination of qualitative color pattern SWE and ACR TI-RADS had better diagnostic performance, which was significantly different (p < 0.05).
Conclusion: The combination of qualitative SWE color patterns and ACR TI-RADS had high sensitivity and accuracy, which might be a convenient and useful method to differentiate benign and malignant ACR TI-RADS 4 or 5 category thyroid nodules measuring ≤10 mm. It would be helpful for the management of thyroid nodules and improving prognosis.
1 Introduction
Thyroid nodules are a common clinical disease with a prevalence of 19%–68% in the population, and 7%–15% of these nodules are thyroid cancers (1). Ultrasound is the first-line modality to screen thyroid nodules. Based on the features of conventional ultrasound including composition, echogenicity, shape, margin, or echogenic foci, the American College of Radiology Thyroid Imaging, Reporting, and Data System (ACR TI-RADS) is widely used for risk stratification and fine-needle aspiration (FNA) recommendation (2). However, there were overlaps in conventional ultrasound features between benign and malignant thyroid nodules, and thyroid nodules measuring ≤10 mm were not routinely recommended for FNA according to the ACR TI-RADS. Thus, it is important to find a non-invasive and useful method to differentiate benign from malignant ACR TI-RADS 4 or 5 thyroid nodules measuring ≤10 mm.
In recent years, shear wave elastography (SWE) has been used to evaluate the stiffness of thyroid nodules (3, 4). Some studies have reported that the elastography index of thyroid cancer is higher than that of benign thyroid nodules (3, 5, 6), which makes SWE a promising method to differentiate benign from malignant thyroid nodules. However, several characteristics of thyroid nodules may affect the results of the quantitative SWE parameters (7–9), including nodule size or calcification. Li et al. (7) found that nodule size affected the optimal Emax cutoff value of SWE. Chen et al. (8) reported that the mean and maximum shear wave speed (SWS), respectively, of thyroid nodules increases progressively from non-calcification to micro-calcification and macro-calcification groups. Moreover, the optimal quantitative SWE parameters to differentiate benign and malignant thyroid nodules in different studies were varied.
Qualitative color pattern SWE could evaluate the stiffness of the whole thyroid nodule, which might be an effective, convenient, and supplementary method to differentiate thyroid nodules (10). Moreover, some studies had reported that qualitative color pattern SWE presents good repeatability and diagnostic performance in the diagnosis of breast masses (11, 12). To the best of our knowledge, the use of qualitative color pattern SWE to differentiate benign and malignant ACR TI-RADS 4 or 5 category thyroid nodules measuring ≤10 mm has rarely been reported.
The differentiation of ACR TI-RADS 4 or 5 category thyroid nodules measuring ≤10 mm is difficult, and quantitative and qualitative SWE could provide the stiffness information of thyroid nodules, which might be useful to differentiate benign and malignant thyroid nodules. This study aims to evaluate the diagnostic performance of quantitative SWE and a new qualitative color pattern SWE for the differentiation between benign and malignant ACR TI-RADS 4 or 5 category thyroid nodules measuring ≤10 mm and to find a non-invasive and useful method to improve diagnostic performance, which might be helpful for thyroid nodule management.
2 Materials and methods
This prospective study was approved by the ethics committee of Yueyang Central Hospital, and all patients signed informed consent before surgery.
2.1 Patients
From May 2020 to July 2022, a total of 237 patients with 270 thyroid nodules were enrolled (Figure 1). The inclusion criteria were as follows: (a) the pathology of all thyroid nodules were confirmed via surgery, (b) all patients underwent thyroid surgery within 1 month after SWE examination, (c) their age was 18 years or older, and (d) the greatest dimension of all thyroid nodules was ≤10 mm. The exclusion criteria were as follows: (a) patients had a previous biopsy, (b) patients had previous ablation, and (c) thyroid nodules without satisfied SWE images.
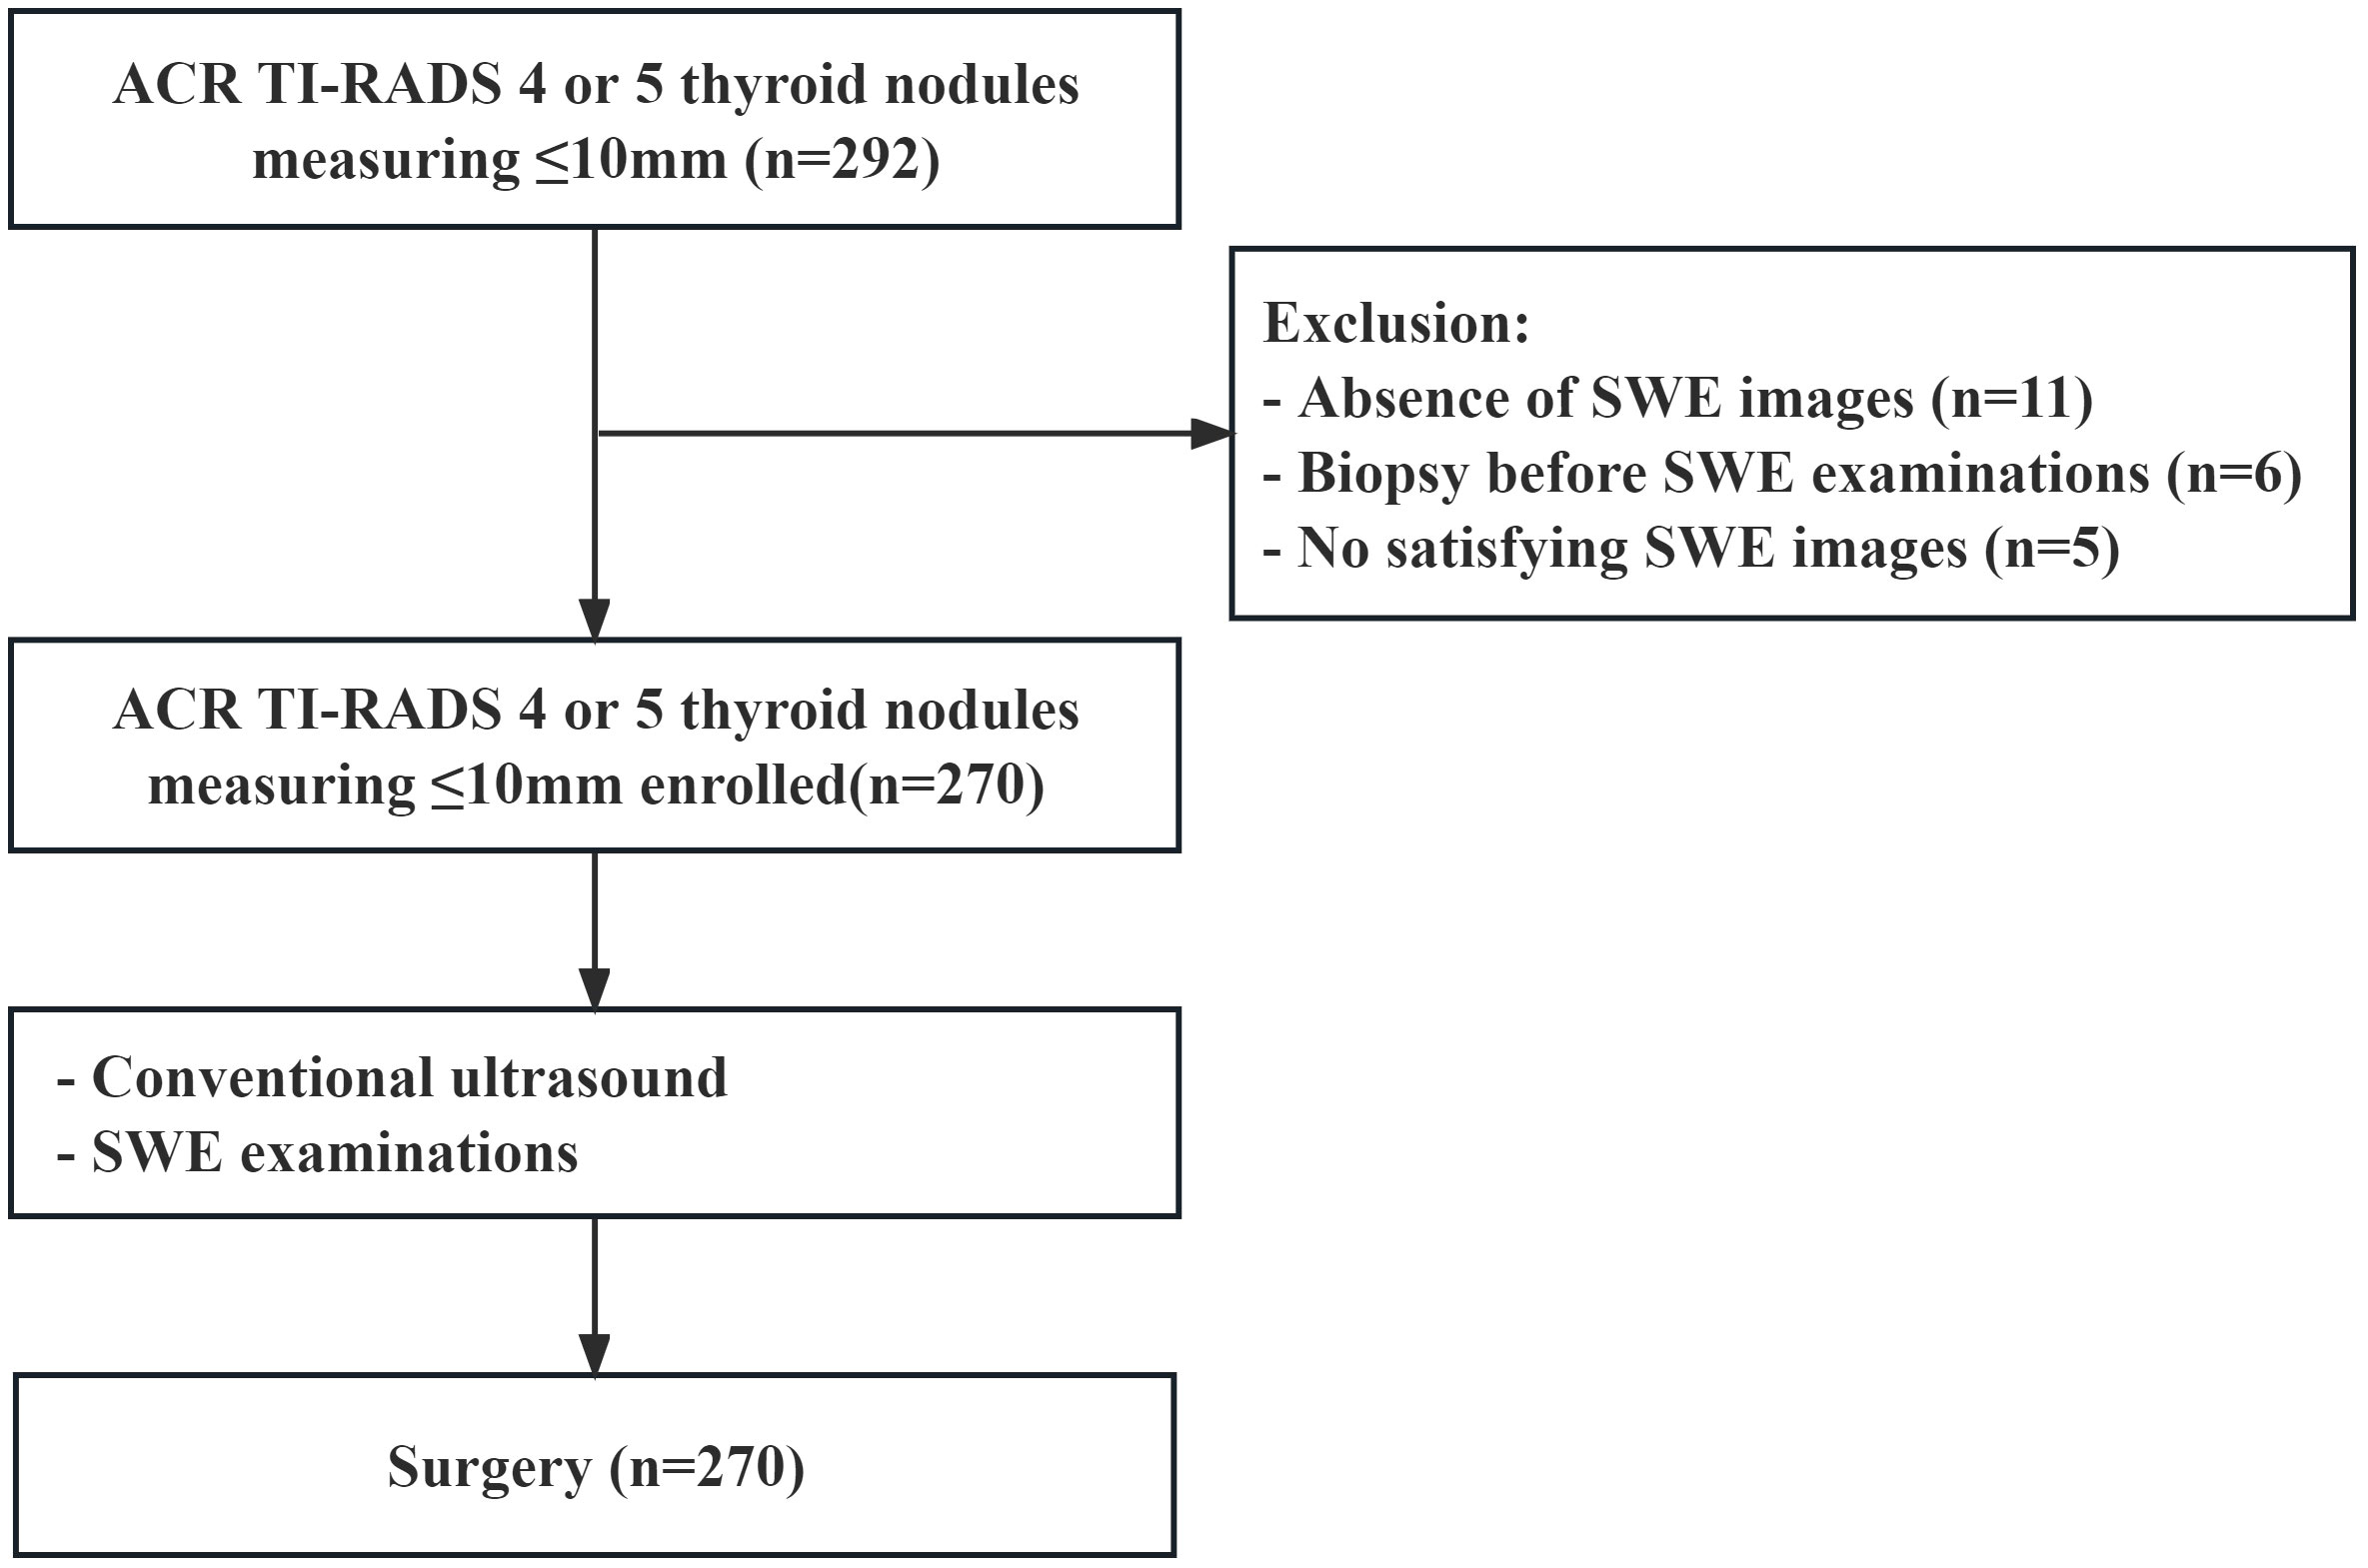
Figure 1 Flowchart of the patients enrolled.
2.2 Research method
An Aixplorer ultrasound system (Supersonic Imaging, France) was used in this study. All thyroid nodules were screened by the same investigator with more than 10 years of experience in thyroid conventional ultrasound and 5 years of experience in SWE examination.
During conventional ultrasound, the patients were asked to maintain in the supine position with full exposure of the neck region. We used L15-4 or L10-5 linear array transducer to perform conventional ultrasound. The general characteristics of the thyroid nodules, such as location, nodule size, composition, echogenicity, shape, margin, and echogenic foci, were recorded in detail.
For the SWE examination, after conventional ultrasound examination, SWE was performed with L10-5 linear array transducer, while the patients were asked to hold their breath for several seconds until satisfied and stable SWE images were obtained. Quantification box (Q-box) was used for obtaining elasticity parameters, including Emax, Emean, Emin, Eratio, and standard deviation (SD). The diameter of Q-box was 2 mm. The first Q-box should be placed in the hardest region of the thyroid nodules, obtaining Emax, Emean, Emin, and standard deviation (SD). The second Q-box should be placed in the surrounding normal thyroid tissue, and Eratio was obtained by calculating the ratio of the two Q-boxes. We have taken the median elasticity parameters of five measurements.
2.3 SWE image analysis
We proposed a new qualitative color pattern SWE classification (Figure 2) in this study, which was classified into five patterns: (1) pattern 1: the SWE color is homogeneously blue at the margin and inside the nodule; (2) pattern 2: the hardest color inside the nodule is green and the main color inside the nodule is blue; (3) pattern 3: the hardest color inside the nodule is green and the main color inside the nodule is also green; (4) pattern 4: the hardest color inside the nodule is yellow or red; and (5) pattern 5: a localized colored rim appears at the margin of nodule, and the color of the rim is mainly yellow and red, which is called stiff rim sign.
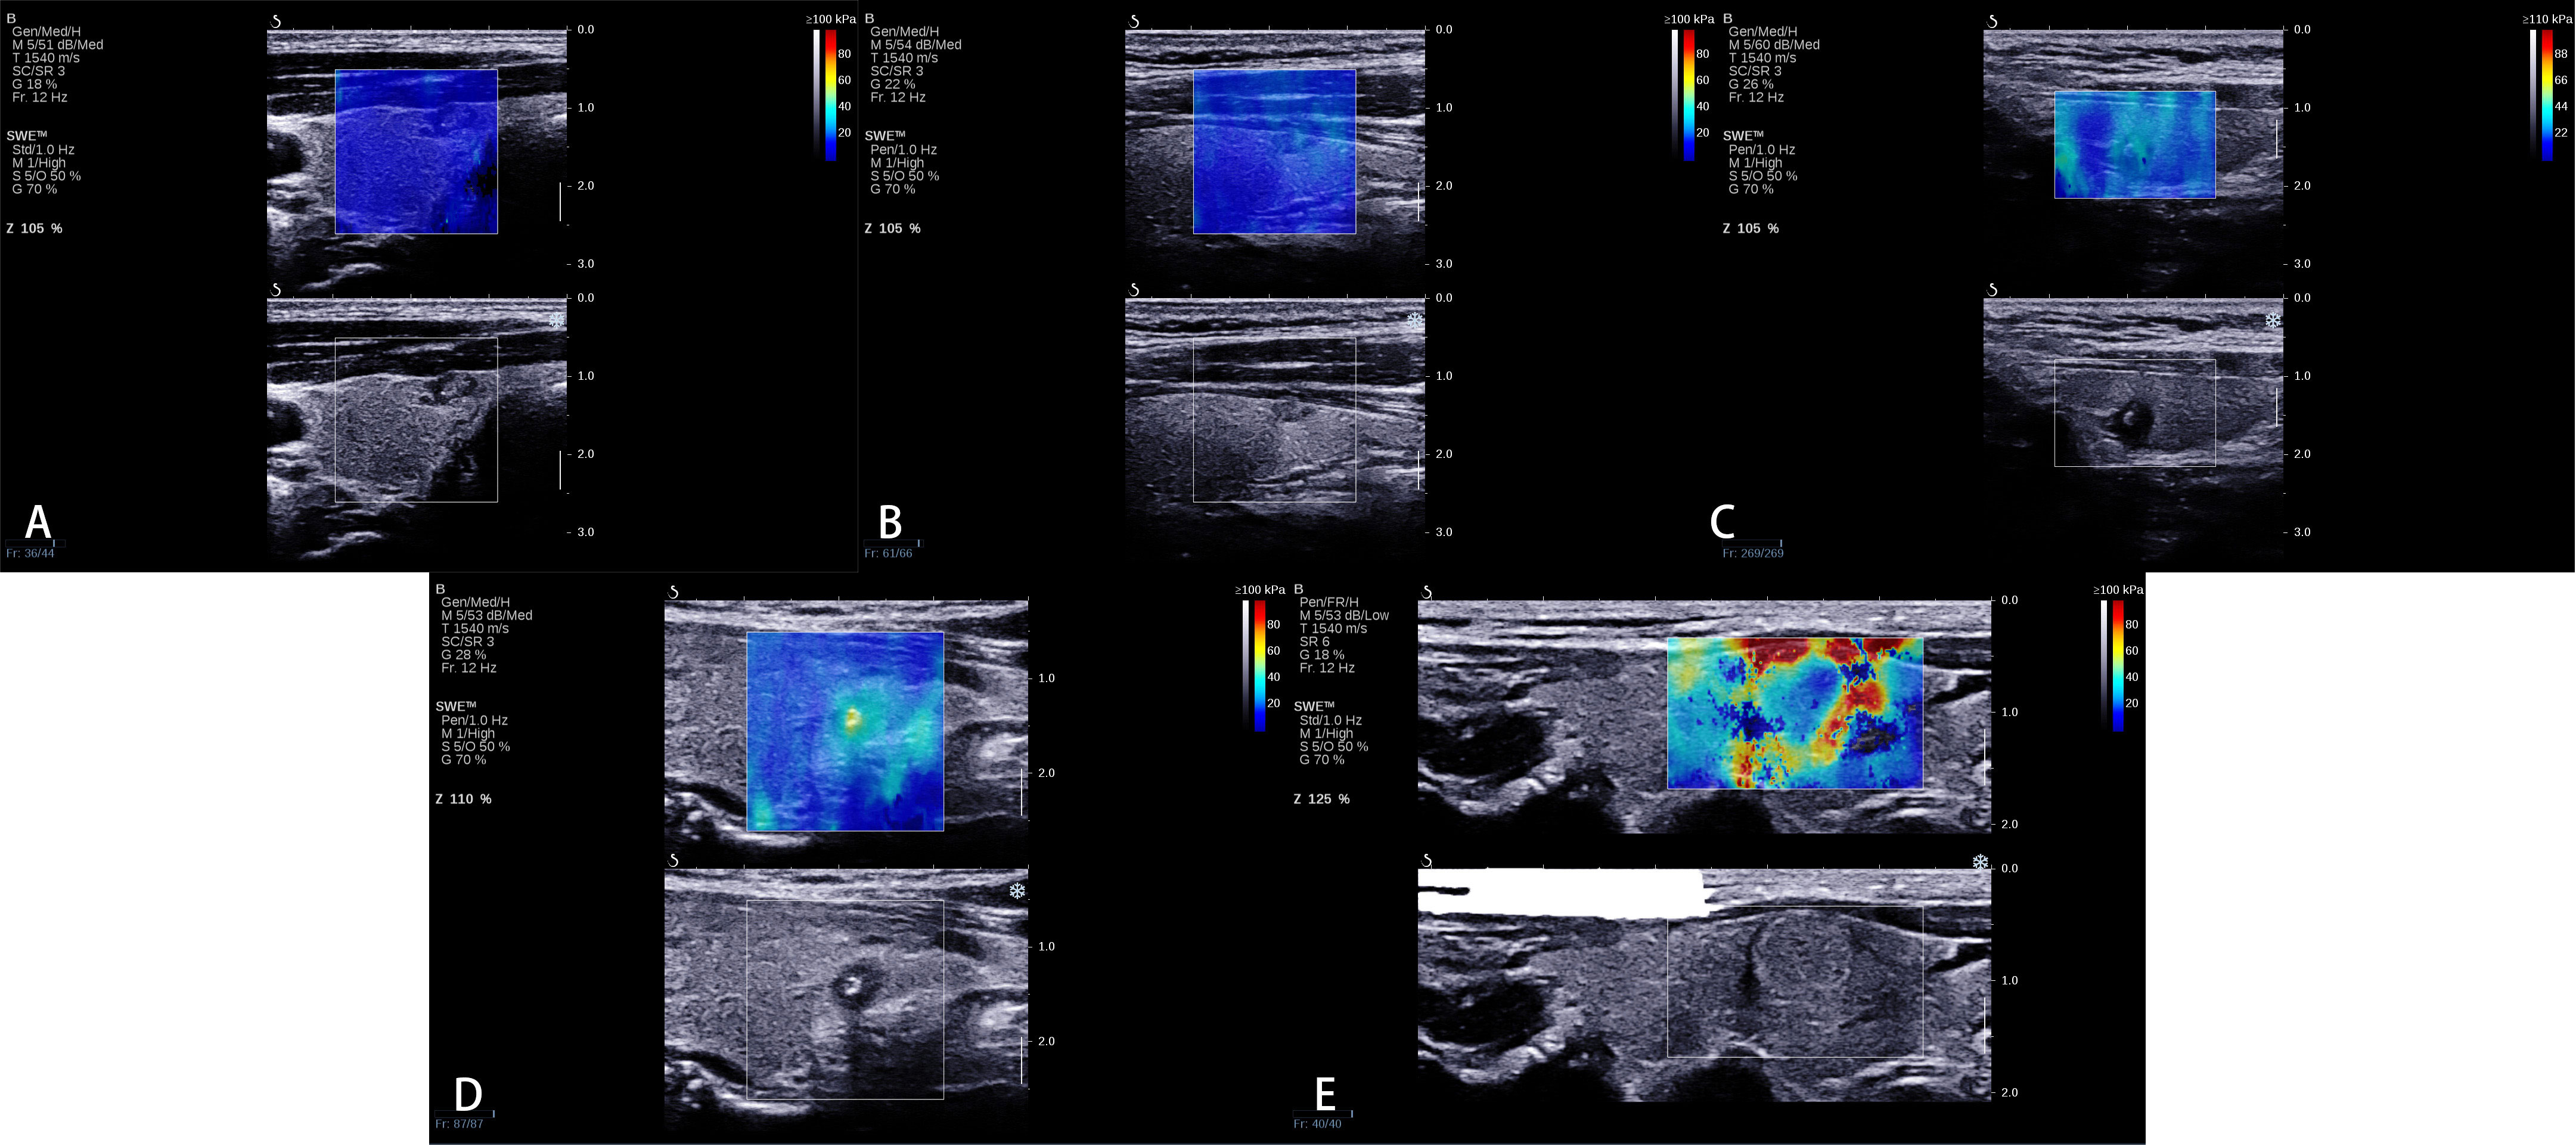
Figure 2 A new qualitative color pattern shear wave elastography (SWE) classification. (A) Pattern 1: the SWE color is homogeneously blue at the margin and inside the nodule, (B) pattern 2: the hardest color inside the nodule is green and the main color inside the nodule is blue, (C) pattern 3: the hardest color inside the nodule is green and the main color inside the nodule is also green, (D) pattern 4: the hardest color inside the nodule is yellow or red, and (E) pattern 5: a localized colored rim appears at the margin of the nodule, and the color of the rim is mainly yellow and red, which is called stiff rim sign.
24 Statistical analysis
SPSS 23.0 (SPSS, Chicago, IL, USA) and MedCalc 19.0 (MedCalc Software, Mariakerke, Belgium) were used to perform the statistical analyses. Univariate analysis was performed with independent t-test for continuous variables and chi-square test for categorical variables. Receiver operating characteristic (ROC) curves to differentiate benign and malignant thyroid nodules were drawn based on Young’s modulus of each thyroid nodule. The best cutoff value of Young’s modulus and area under curve (AUC) were calculated. The sensitivity, specificity, positive predictive value (PPV), negative predictive value (NPV), accuracy, and AUC of SWE and the combination of ACR TI-RADS and SWE were calculated and compared, respectively. A P-value <0.05 was considered to be statistically different.
3 Results
3.1 General information and pathological results
Among 270 nodules in 237 patients, 72 (26.67%) thyroid nodules were benign and 198 (73.33%) thyroid nodules were malignant. The general information and conventional ultrasound features are listed in Table 1. Age, shape, margin, echogenic foci, and ACR TI-RADS category were significantly different between benign and malignant thyroid nodules. Other general and conventional ultrasound features between benign and malignant thyroid nodules were not statistically different.
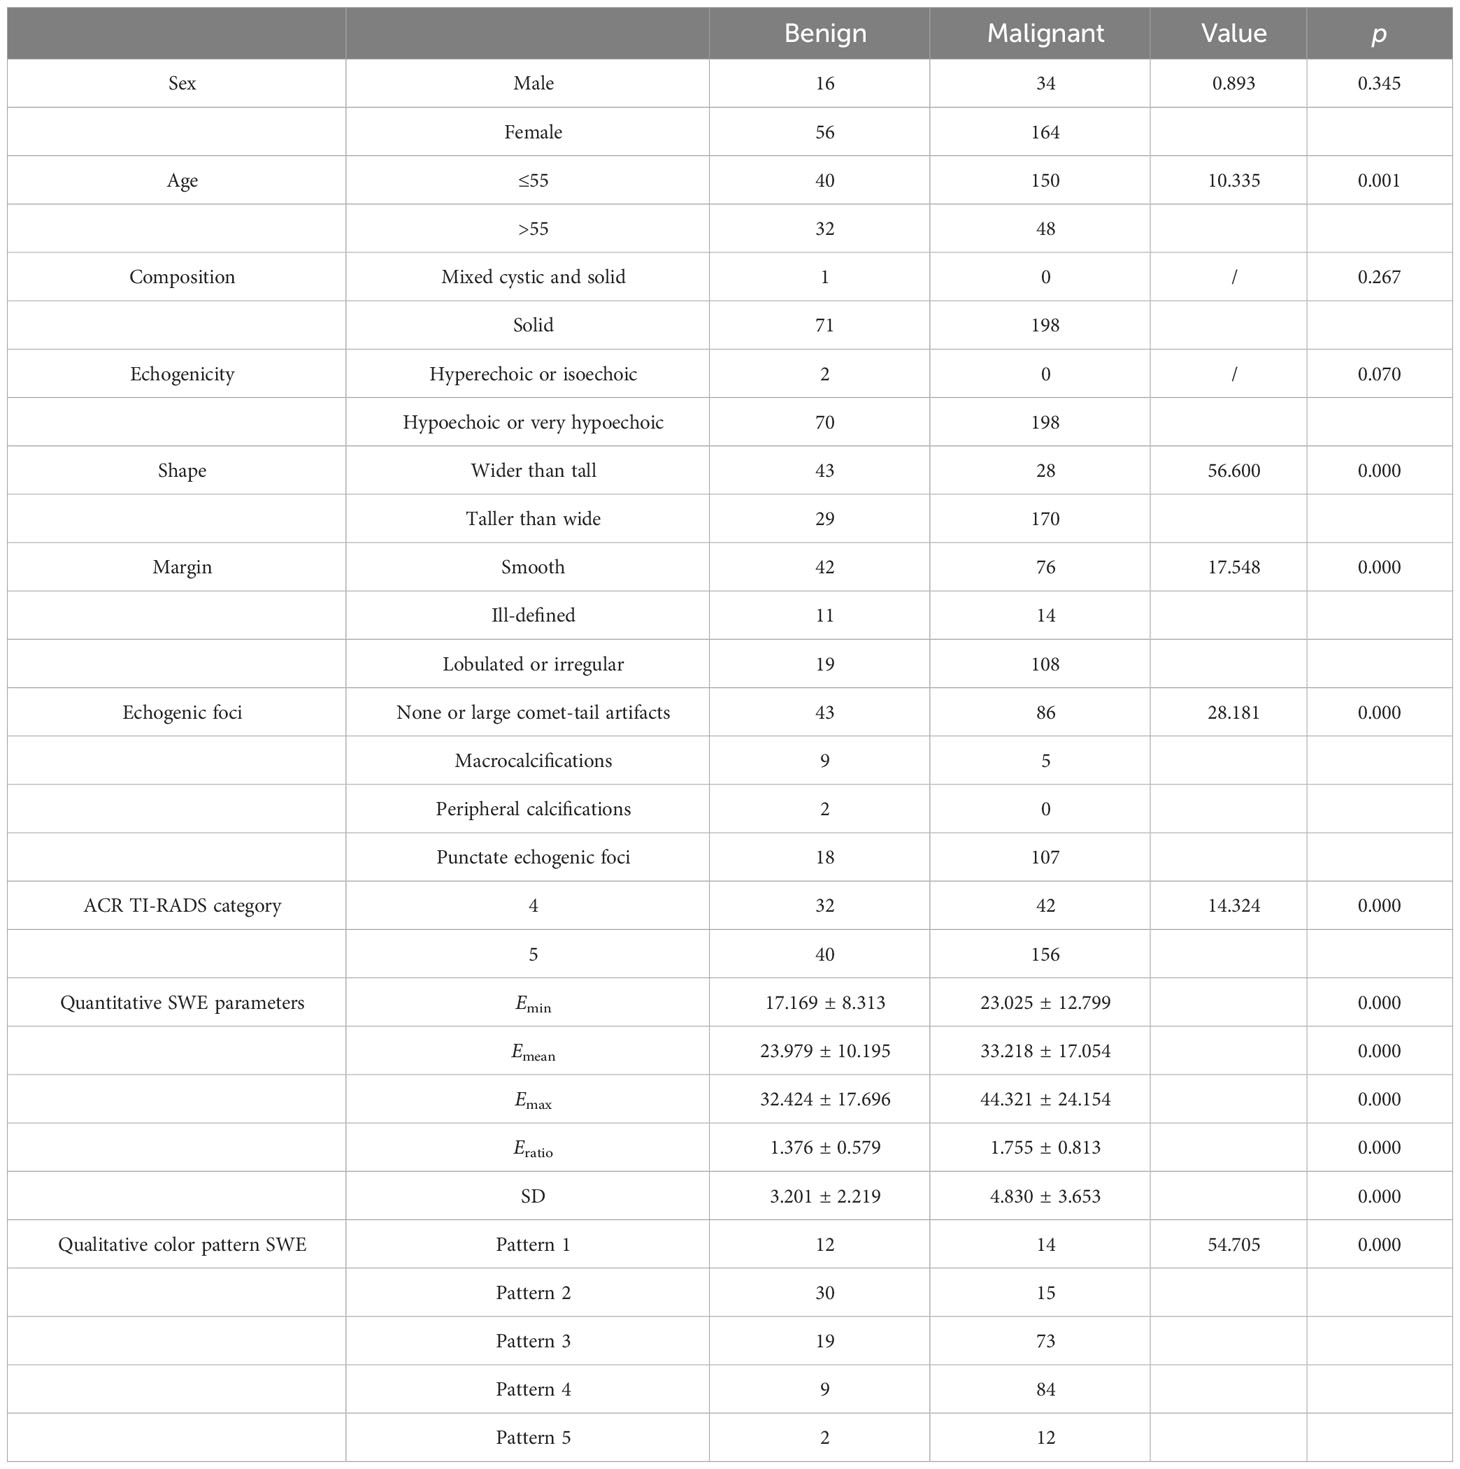
Table 1 General information, quantitative shear wave elastography (SWE) parameters, and qualitative SWE color patterns between benign and malignant thyroid nodules.
3.2 Quantitative SWE parameters between benign and malignant ACR TI-RADS 4 or 5 category thyroid nodules measuring ≤10 mm
There were significant differences for all quantitative SWE parameters between benign and malignant ACR TI-RADS 4 or 5 category thyroid nodules measuring ≤10 mm. The best cutoff values for the differentiation of benign and malignant thyroid nodules were 18.25 kPa for Emin, 28.15 kPa for Emean, 40.40 kPa for Emax, 1.75 for Eratio, and 4.25 kPa for SD, respectively. The diagnostic performance of Emin, Emean, Emax, Eratio, and SD, respectively, is listed in Table 2. There was no significant difference among all quantitative SWE parameters.
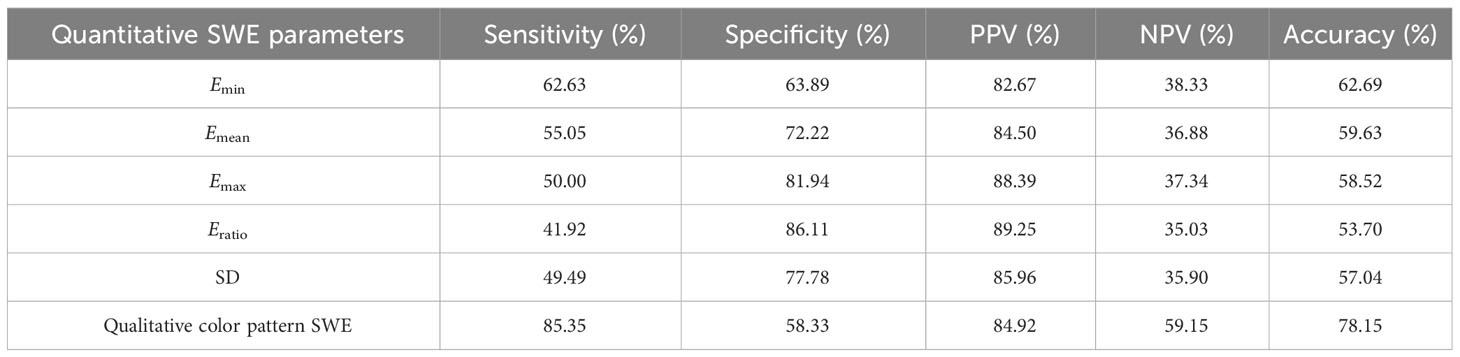
Table 2 The diagnostic performance of quantitative shear wave elastography (SWE) parameters and qualitative color pattern SWE to differentiate benign and malignant American College of Radiology Thyroid Imaging, Reporting, and Data System 4 or 5 thyroid nodules measuring ≤10 mm.
3.3 Qualitative color pattern SWE between benign and malignant ACR TI-RADS 4 or 5 category thyroid nodules measuring ≤10 mm
There were significant differences in different qualitative color pattern SWE between benign and malignant ACR TI-RADS 4 or 5 category thyroid nodules measuring ≤1 cm. Benign thyroid nodules mainly present pattern 1 and 2, while malignant thyroid nodules always present patterns 3, 4, and 5. The sensitivity, specificity, PPV, NPV, accuracy, and AUC were 85.35%, 60.00%, 84.92%, 59.15%, 78.15%, and 0.740 (95% CI: 0.683–0.791), respectively. Compared with quantitative SWE parameters, qualitative color pattern SWE had better diagnostic performance with high sensitivity, which was significantly different.
3.4 Combination of qualitative color pattern SWE and ACR TI-RADS for the differentiation of ACR TI-RADS 4 or 5 category thyroid nodules measuring ≤10 mm
The criteria of combining qualitative color pattern SWE with ACR TI-RADS were as follows: Zero point was assigned for thyroid nodules presenting patterns 1 and 2 in qualitative color pattern SWE, while thyroid nodules presenting patterns 3, 4, and 5 were assigned three points. When assessing a thyroid nodule with combination of qualitative color pattern SWE and ACR TI-RADS, conventional ultrasound features and qualitative color pattern SWE were evaluated and summed up for the corresponding final point. With the optimal cutoff value of the total points ≥8, thyroid nodules were considered malignant. The sensitivity, specificity, accuracy, and AUC were 89.90%, 56.94%, 81.11%, and 0.820 (95% CI: 0.768–0.864), respectively (Table 3). Compared with using qualitative color pattern SWE alone, the combination of qualitative color pattern SWE and ACR TI-RADS had better diagnostic performance, which was significantly different (Figure 3).
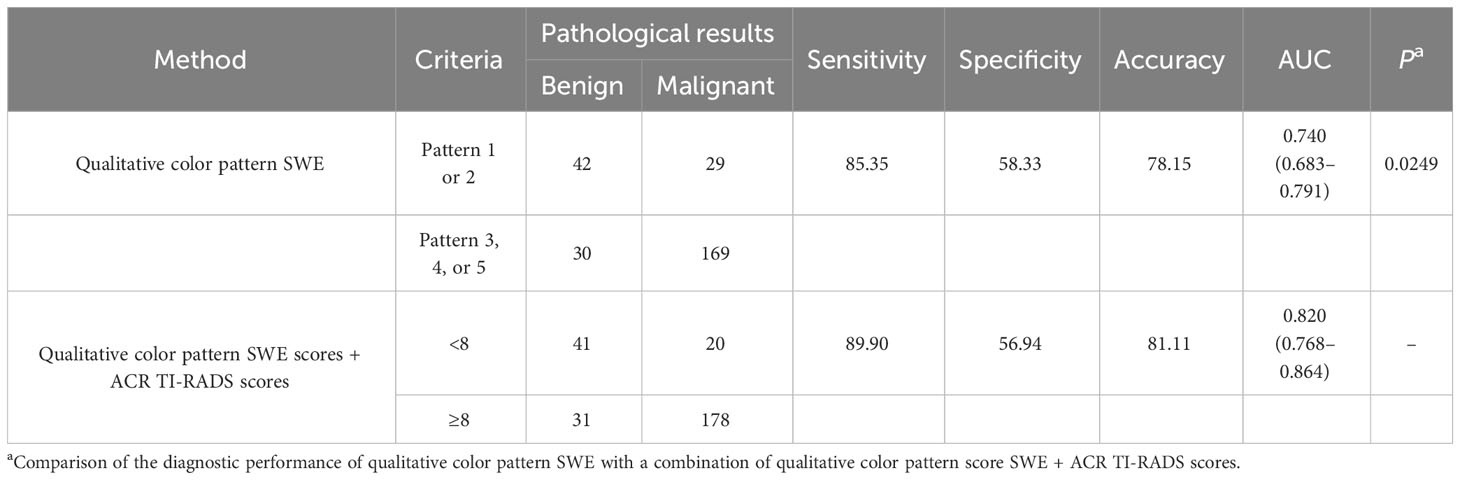
Table 3 Combination of qualitative color pattern shear wave elastography (SWE) scores and American College of Radiology Thyroid Imaging, Reporting, and Data System (ACR TI-RADS) scores for the differentiation of ACR TI-RADS 4 or 5 category thyroid nodules measuring ≤10 mm.
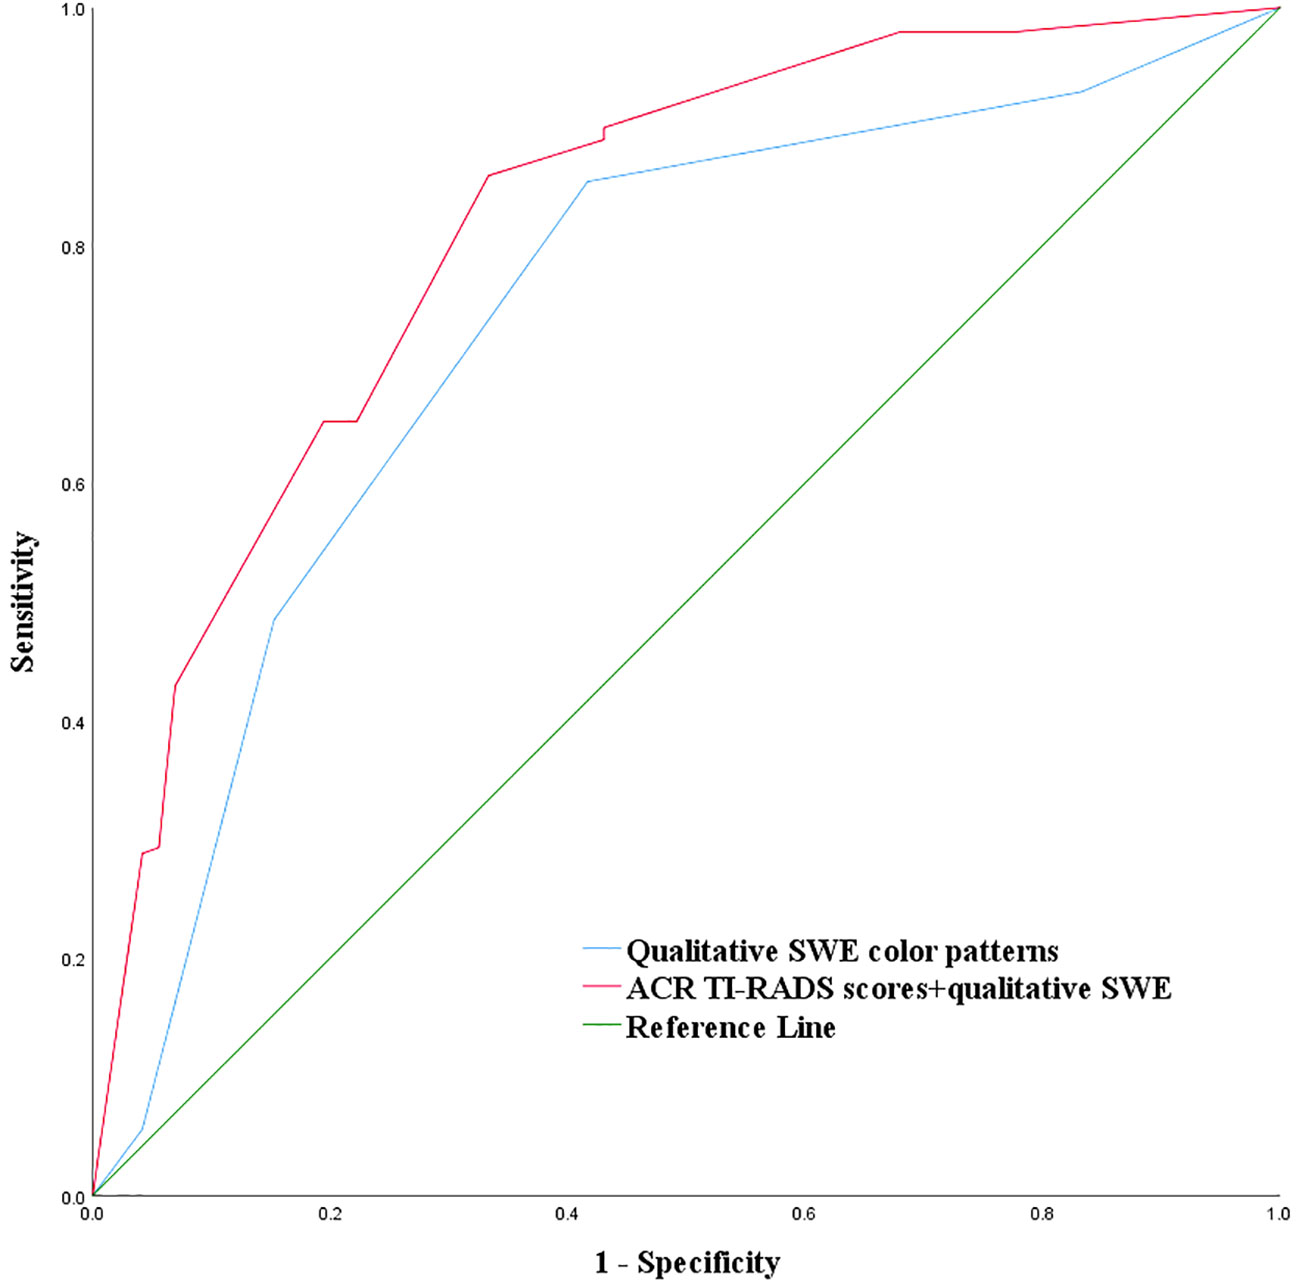
Figure 3 Combination of qualitative color pattern shear wave elastography and American College of Radiology Thyroid Imaging, Reporting, and Data System (ACR TI-RADS) for the differentiation of ACR TI-RADS 4 or 5 category thyroid nodules measuring ≤10 mm.
4 Discussion
In this study, we proposed a new qualitative color pattern SWE classification, which was useful to differentiate ACR TI-RADS 4 or 5 category thyroid nodules measuring ≤10 mm. Compared with quantitative SWE parameters, qualitative color pattern SWE had better diagnostic performance. Moreover, combining qualitative color pattern SWE with ACR TI-RADS could improve the sensitivity and accuracy compared with using qualitative SWE color patterns alone.
Currently, FNA is the most practical and useful method to get a definitive diagnosis before surgery. The diagnosis of FNA is based on the Bethesda System for Reporting Thyroid Cytopathology (TBSRTC). The third edition of TBSRTC in 2023 (13) is built on the success of the first two editions of TBSRTC in 2010 and 2017. The risk of malignancy (ROC) in the 2023 edition TBSRTC for Bethesda III, IV, and V category thyroid nodules are 13%–30%, 23%–34%, and 67%–83%, respectively. Thus, the diagnosis of Bethesda III and IV category thyroid nodules might be ambiguous. Moreover, small thyroid carcinoma ≤10 mm might mainly cause the “epidemic” of thyroid cancers (14), and thyroid nodules ≤10 mm were not routinely recommended for FNA according to ACR TI-RADS in 2017 (2), which was a challenge for the management of suspicious thyroid nodules ≤10 mm.
ACR TI-RADS 4 or 5 category thyroid nodules measuring ≤10 mm were difficult to distinguish. There were overlaps between benign and malignant thyroid nodules, which increased the difficulty in thyroid nodule diagnosis and management. Some studies found that the 2017 edition of ACR TI-RADS category had high diagnostic performance, and the ACR TI-RADS 5 category had higher sensitivity and lower specificity in the differentiation of benign and malignant thyroid nodules (15, 16). In this study, the overall malignant rate of thyroid nodules in ACR TI-RADS 4 and 5 category was 73.34%, while the sensitivity and specificity of ACR TI-RADS 5 category for distinguishing benign and malignant thyroid nodules were 78.79% and 44.44%, respectively, which was consistent with a previous study.
Quantitative SWE parameters had been proven useful in the differentiation of benign and malignant thyroid nodules (9, 17, 18). However, there were still some controversial problems, such as the lack of a consensus on optimal quantitative parameters and best cutoff values for the optimal quantitative parameters, the influence of nodule size on quantitative SWE parameters for the differentiation of benign and malignant thyroid nodules, and the discrepancy of quantitative measurement method in different studies. Previous studies had reported the value of quantitative SWE parameters in the differentiation of benign and malignant thyroid nodules measuring ≤10 mm. Gao et al. (18) reported that there was no statistical difference with Emax ≥51 kPa to differentiate thyroid nodules between thyroid nodules measuring ≤10 and >10 mm, and Emax had better diagnostic performance compared with Emean and Eratio. Chambara et al. (19) found that no quantitative SWE parameter was significantly different between benign and malignant thyroid nodules. In this study, all quantitative SWE parameters were significantly different between benign and malignant ACR TI-RADS 4 or 5 category thyroid nodules; however, the diagnostic performance of all quantitative SWE parameters was unsatisfying. There was no statistical difference between all quantitative SWE parameters.
Compared with quantitative SWE parameters, qualitative elastography was less studied for the differentiation of benign and malignant thyroid nodules. Sengul et al. found that high SE scores might have high diagnostic performance in thyroid nodules with the cutoff over 15 mm compared with the cutoff over 10 mm (20). Moreover, several studies found that qualitative color pattern SWE was useful to distinguish benign and malignant thyroid nodules (10, 17). Tan et al. (17) found that the stiff rim sign was more likely to occur in malignant nodules. Zhang et al. (10) reported that qualitative SWE color scores could assist in differentiating thyroid nodules. In this study, we proposed a new qualitative color pattern SWE classification for the differentiation of benign and malignant ACR TI-RADS 4 or 5 category thyroid nodules measuring ≤10 mm. Using this classification, benign thyroid nodules mainly present patterns 1 and 2, while malignant thyroid nodules always present patterns 3, 4, and 5, which showed higher sensitivity and accuracy compared with quantitative SWE parameters.
There were 29/198 (14.65%) malignant thyroid nodules presenting patterns 1 and 2, and 51.72% (15/29) of these nodules measured ≤5 mm. The fiber components were relatively little in these small nodules, which caused less hardening. However, as the thyroid nodules grow larger, there is an increase of fibrous composition and calcification, and the nodules might be harder. Moreover, when ACR TI-RADS 4 or 5 category thyroid nodules measuring ≤1 cm present patterns 3, 4, and 5, it indicated that these thyroid nodules were hard, even if these thyroid nodules were small. Using this criterion, it had high sensitivity (85.35%) for predicting malignant nodules, which could be useful in clinical application based on high sensitivity.
The stiff rim sign of qualitative color pattern SWE was firstly proposed by Zhou et al. (21) for the differentiation of benign and malignant breast lesions, which indicated that the surrounding tissue of lesions had greater hardness, and it might be related to tumor infiltration and desmoplastic reaction into the surrounding tissue of lesions. Several studies used this sign in the differentiation of benign and malignant thyroid nodules (10, 17). Tan et al. (17) found that the stiff rim in thyroid nodules was more likely to occur in malignant thyroid nodules, and the malignant rate of thyroid nodules that present a stiff rim sign was 93.10%. Zhang et al. (10) reported that the malignant rate of thyroid nodules with a stiff rim sign was 92.9%, which also showed that the stiff rim sign was an important indicator for predicting malignant thyroid nodules. In this study, 85.71% (12/14) of the thyroid nodules with a stiff rim sign were malignant, which was consistent with previous studies. The reason why the malignant rate was slightly lower than previous studies might be because the thyroid nodules enrolled in this study measured ≤10 mm in size.
There are a few studies (22, 23) which reported the additional value of SWE on TI-RADS classification. Zhang et al. (22) found that the combination of Emax and ACR TI-RADS could improve diagnostic efficiency, especially for ACR TI-RADS 3 and 4 category thyroid nodules. Yang et al. (23) reported that the TI-RADS classification system modified by Emean was more significant in the differentiation of benign and malignant thyroid nodules. In this study, we found that the qualitative color pattern SWE was significantly different between benign and malignant ACR TI-RADS 4 or 5 category thyroid nodules measuring ≤10 mm, which indicates that the qualitative color pattern SWE could reflect the stiffness information of thyroid nodules. Thus, we assigned the qualitative color pattern SWE point like the conventional ultrasound features in ACR TI-RADS: 0 point was assigned for pattern 1 or 2, and 3 points were assigned for pattern 3, 4, or 5. Adding together the qualitative color pattern SWE scores and ACR TI-RADS scores and using the optimal cutoff value of the total points ≥8, the combination of qualitative color pattern SWE and ACR TI-RADS had a higher AUC than using qualitative color pattern SWE alone for the differentiation of benign and malignant ACR TI-RADS 4 or 5 category thyroid nodules measuring ≤10 mm.
Moreover, the combination of qualitative color pattern SWE and ACR TI-RADS might be helpful for the management of thyroid nodules. FNA or further treatment might be suitable for patients with huge psychological pressure when the total point is ≥8 combining qualitative color pattern SWE and ACR TI-RADS.
There were several limitations in this study. First, this is a single-center study; a multi-center study with a large sample size should be conducted in the future. Second, all thyroid nodules were sequentially enrolled; however, only partial thyroid nodules were confirmed by surgery, which might cause inevitable sampling bias. Third, the time span of this study was short, and the pathological types of thyroid cancer were limited.
5 Conclusion
In conclusion, the combination of the new qualitative color pattern SWE and ACR TI-RADS had high sensitivity and accuracy, which might be a convenient and useful method to differentiate benign and malignant ACR TI-RADS 4 or 5 category thyroid nodules measuring ≤10 mm. It would be helpful for the management of thyroid nodules.
Data availability statement
The raw data supporting the conclusions of this article will be made available by the authors, without undue reservation.
Ethics statement
The studies involving humans were approved by the ethics committee of Yueyang Central Hospital. The studies were conducted in accordance with the local legislation and institutional requirements. The participants provided their written informed consent to participate in this study.
Author contributions
AY: Formal analysis, Methodology, Writing – original draft, Writing – review & editing. WY: Data curation, Visualization, Writing – original draft. XC: Conceptualization, Data curation, Validation, Writing – review & editing. CD: Conceptualization, Formal analysis, Methodology, Writing – review & editing. BW: Conceptualization, Funding acquisition, Methodology, Supervision, Writing – review & editing.
Funding
The author(s) declare financial support was received for the research, authorship, and/or publication of this article. This work was supported by the general funding project of Hunan Provincial Health Commission (no. B202309029532) and the Natural Science Foundation of Hunan Province (no. 2023JJ50304).
Conflict of interest
The authors declare that the research was conducted in the absence of any commercial or financial relationships that could be construed as a potential conflict of interest.
Publisher’s note
All claims expressed in this article are solely those of the authors and do not necessarily represent those of their affiliated organizations, or those of the publisher, the editors and the reviewers. Any product that may be evaluated in this article, or claim that may be made by its manufacturer, is not guaranteed or endorsed by the publisher.
Abbreviations
SWE, shear wave elastography; ACR TI-RADS, American College of Radiology Thyroid Imaging, Reporting, and Data System; FNA, fine-needle aspiration; SWS, shear wave speed; Q-box, Quantification box; SD, standard deviation; ROC, receiver operating characteristic curves; AUC, area under curve; PPV, positive predictive value; NPV, negative predictive value; ROC, risk of malignancy; TBSRTC, The Bethesda System for Reporting Thyroid Cytopathology.
References
1. Haugen BR, Alexander EK, Bible KC, Doherty GM, Mandel SJ, Nikiforov YE, et al. 2015 American thyroid association management guidelines for adult patients with thyroid nodules and differentiated thyroid cancer: the american thyroid association guidelines task force on thyroid nodules and differentiated thyroid cancer. Thyroid (2016) 26(1):1–133. doi: 10.1089/thy.2015.0020
2. Tessler FN, Middleton WD, Grant EG, Hoang JK, Berland LL, Teefey SA, et al. ACR thyroid imaging, reporting and data system (TI-RADS): white paper of the ACR TI-RADS committee. J Am Coll Radiol (2017) 14(5):587–95. doi: 10.1016/j.jacr.2017.01.046
3. Xu HX, Yan K, Liu BJ, Liu WY, Tang LN, Zhou Q, et al. Guidelines and recommendations on the clinical use of shear wave elastography for evaluating thyroid nodule1. Clin Hemorheol Microcirc (2019) 72(1):39–60. doi: 10.3233/CH-180452
4. Cosgrove D, Barr R, Bojunga J, Cantisani V, Chammas MC, Dighe M, et al. and recommendations on the clinical use of ultrasound elastography: part 4. Thyroid Ultrasound Med Biol (2017) 43(1):4–26. doi: 10.1016/j.ultrasmedbio.2016.06.022
5. Sebag F, Vaillant-Lombard J, Berbis J, Griset V, Henry JF, Petit P, et al. Shear wave elastography: a new ultrasound imaging mode for the differential diagnosis of benign and Malignant thyroid nodules. J Clin Endocrinol Metab (2010) 95(12):5281–8. doi: 10.1210/jc.2010-0766
6. Liu B, Liang J, Zheng Y, Xie X, Huang G, Zhou L, et al. Two-dimensional shear wave elastography as promising diagnostic tool for predicting Malignant thyroid nodules: a prospective single-centre experience. Eur Radiol (2015) 25(3):624–34. doi: 10.1007/s00330-014-3455-8
7. Li H, Kang C, Xue J, Jing L, Miao J. Influence of lesion size on shear wave elastography in the diagnosis of benign and Malignant thyroid nodules. Sci Rep (2021) 11(1):21616. doi: 10.1038/s41598-021-01114-8
8. Chen BD, Xu HX, Zhang YF, Liu BJ, Guo LH, Li DD, et al. Calcification of thyroid nodules increases shear-wave speed (SWS) measurement: using multiple calcification-specific SWS cutoff values outperforms a single uniform cutoff value in diagnosing Malignant thyroid nodules. Oncotarget (2016) 7(40):66149–59. doi: 10.18632/oncotarget.11710
9. Xue JP, Kang XY, Miao JW, Zhang YX, Li HZ, Yao FC, et al. Analysis of the influence of thyroid nodule characteristics on the results of shear wave elastography. Front Endocrinol (Lausanne) (2022) 13:858565. doi: 10.3389/fendo.2022.858565
10. Zhang YX, Xue JP, Li HZ, Miao JW, Kang CS. Clinical value of shear wave elastography color scores in classifying thyroid nodules. Int J Gen Med (2021) 14:8007–18. doi: 10.2147/IJGM.S331406
11. Park J, Woo OH, Shin HS, Cho KR, Seo BK, Kang EY. Diagnostic performance and color overlay pattern in shear wave elastography (SWE) for palpable breast mass. Eur J Radiol (2015) 84(10):1943–8. doi: 10.1016/j.ejrad.2015.06.020
12. Cong R, Li J, Guo S. A new qualitative pattern classification of shear wave elastograghy for solid breast mass evaluation. Eur J Radiol (2017) 87:111–9. doi: 10.1016/j.ejrad.2016.12.021
13. Ali SZ, Baloch ZW, Cochand-Priollet B, Schmitt FC, Vielh P, VanderLaan PA. The 2023 bethesda system for reporting thyroid cytopathology. Thyroid (2023) 33(9):1039–44. doi: 10.1089/thy.2023.0141
14. Sengul I, Sengul D. Hermeneutics for evaluation of the diagnostic value of ultrasound elastography in TIRADS 4 categories of thyroid nodules. Am J Med Case Rep (2021) 9(11):538–9. doi: 10.12691/ajmcr-9-11-5
15. Lauria Pantano A, Maddaloni E, Briganti SI, Beretta Anguissola G, Perrella E, Taffon C, et al. AACE/ACE/AME and ACR TI-RADS ultrasound classifications performance in identifying cytological high-risk thyroid nodules. Eur J Endocrinol (2018) 178(6):595–603. doi: 10.1530/EJE-18-0083
16. Li X, Gao F, Li F, Han XX, Shao SH, Yao MH, et al. Qualitative analysis of contrast-enhanced ultrasound in the diagnosis of small, TR3-5 benign and Malignant thyroid nodules measuring ≤1 cm. Br J Radiol (2020) 93(1111):20190923. doi: 10.1259/bjr.20190923
17. Tan S, Sun PF, Xue H, Fu S, Zhang ZP, Mei F, et al. Evaluation of thyroid micro-carcinoma using shear wave elastography: Initial experience with qualitative and quantitative analysis. Eur J Radiol (2021) 137:109571. doi: 10.1016/j.ejrad.2021.109571
18. Gao XQ, Ma Y, Peng XS, Wang LL, Li HX, Zheng XL, et al. Diagnostic performance of C-TIRADS combined with SWE for the diagnosis of thyroid nodules. Front Endocrinol (Lausanne) (2022) 13:939303. doi: 10.3389/fendo.2022.939303
19. Chambara N, Lo X, Chow TCM, Lai CMS, Liu SYW, Ying M. Combined shear wave elastography and EU TIRADS in differentiating Malignant and benign thyroid nodules. Cancers (Basel) (2022) 14(22):5521. doi: 10.3390/cancers14225521
20. Sengul D, Sengul I, Egrioglu E, Ozturk T, Aydin I, Kesicioglu T, et al. Can cut-off points of 10 and 15 mm of thyroid nodule predict Malignancy on the basis of three diagnostic tools: i) strain elastography, ii) the Bethesda system for reporting thyroid cytology with 27-gauge fine-needle, and iii) histopathology? J BUON (2020) 25(2):1122–9.
21. Zhou J, Zhan W, Chang C, Zhang X, Jia Y, Dong Y, et al. Breast lesions: evaluation with shear wave elastography, with special emphasis on the “stiff rim” sign. Radiology (2014) 272(1):63–72. doi: 10.1148/radiol.14130818
22. Zhang WB, Xu W, Fu WJ, He BL, Liu H, Deng WF. Comparison of ACR TI-RADS, Kwak TI-RADS, ATA guidelines and KTA/KSThR guidelines in combination with SWE in the diagnosis of thyroid nodules. Clin Hemorheol Microcirc (2021) 78(2):163–74. doi: 10.3233/CH-201021
Keywords: thyroid nodule, ultrasonography, shear wave elastography, ACR TI-RADS, color pattern
Citation: Yi A-j, Yang W-W, Cui X-W, Dietrich CF and Wang B (2024) The value of quantitative and a new qualitative color pattern shear wave elastography for the differentiation of ACR TI-RADS 4 or 5 category thyroid nodules measuring ≤10 mm. Front. Endocrinol. 14:1275256. doi: 10.3389/fendo.2023.1275256
Received: 10 August 2023; Accepted: 12 December 2023;
Published: 08 January 2024.
Edited by:
Terry Francis Davies, Icahn School of Medicine at Mount Sinai, United StatesReviewed by:
Ilker Sengul, Giresun University, TürkiyeEvren Üstüner, Ankara University School of Medicine, Türkiye
Copyright © 2024 Yi, Yang, Cui, Dietrich and Wang. This is an open-access article distributed under the terms of the Creative Commons Attribution License (CC BY). The use, distribution or reproduction in other forums is permitted, provided the original author(s) and the copyright owner(s) are credited and that the original publication in this journal is cited, in accordance with accepted academic practice. No use, distribution or reproduction is permitted which does not comply with these terms.
*Correspondence: Xin-Wu Cui, Y3VpeGlud3VAbGl2ZS5jbg==; Bin Wang, d2FuZ2I1OEBtYWlsMy5zeXN1LmVkdS5jbg==
†These authors have contributed equally to this work