
94% of researchers rate our articles as excellent or good
Learn more about the work of our research integrity team to safeguard the quality of each article we publish.
Find out more
ORIGINAL RESEARCH article
Front. Endocrinol. , 15 November 2023
Sec. Obesity
Volume 14 - 2023 | https://doi.org/10.3389/fendo.2023.1254778
This article is part of the Research Topic Genetic Obesity View all 7 articles
 Devis Pascut1*†
 Pablo J. Giraudi2†
 Cristina Banfi3Stefania Ghilardi3
 Claudio Tiribelli1,2Adele Bondesan4Diana Caroli4Alessandro Minocci5
 Graziano Grugni4,6
 Alessandro Sartorio4
Introduction: Prader-Willi syndrome (PWS) is a rare genetic disorder characterized by loss of expression of paternal chromosome 15q11.2-q13 genes. Individuals with PWS exhibit unique physical, endocrine, and metabolic traits associated with severe obesity. Identifying liver steatosis in PWS is challenging, despite its lower prevalence compared to non-syndromic obesity. Reliable biomarkers are crucial for the early detection and management of this condition associated with the complex metabolic profile and cardiovascular risks in PWS.
Methods: Circulating proteome profiling was conducted in 29 individuals with PWS (15 with steatosis, 14 without) using the Olink Target 96 metabolism and cardiometabolic panels. Correlation analysis was performed to identify the association between protein biomarkes and clinical variables, while the gene enrichment analysis was conducted to identify pathways linked to deregulated proteins. Receiver operating characteristic (ROC) curves assessed the discriminatory power of circulating protein while a logistic regression model evaluated the potential of a combination of protein biomarkers.
Results: CDH2, CTSO, QDPR, CANT1, ALDH1A1, TYMP, ADGRE, KYAT1, MCFD, SEMA3F, THOP1, TXND5, SSC4D, FBP1, and CES1 exhibited a significant differential expression in liver steatosis, with a progressive increase from grade 1 to grade 3. FBP1, CES1, and QDPR showed predominant liver expression. The logistic regression model, -34.19 + 0.85 * QDPR*QDPR + 0.75 * CANT1*TYMP - 0.46 * THOP1*ALDH1A, achieved an AUC of 0.93 (95% CI: 0.63-0.99), with a sensitivity of 93% and specificity of 80% for detecting steatosis in individuals with PWS. These biomarkers showed strong correlations among themselves and were involved in an interconnected network of 62 nodes, related to seven metabolic pathways. They were also significantly associated with cholesterol, LDL, triglycerides, transaminases, HbA1c, FLI, APRI, and HOMA, and showed a negative correlation with HDL levels.
Conclusion: The biomarkers identified in this study offer the potential for improved patient stratification and personalized therapeutic protocols.
Prader-Willi syndrome (PWS) is a rare genetic disorder characterized by various physical, cognitive, and behavioral symptoms. It is caused by the lack of expression of genes located on the paternal chromosome 15q11.2-q13, resulting in various metabolic abnormalities and hormonal dysregulation (1, 2). PWS is associated with severe obesity and is considered the most common syndromic form of life-threatening obesity (3). The excessive weight gain in individuals with PWS is primarily driven by hyperphagic behavior and a dysregulated appetite control mechanism (4, 5).
While obesity is a prominent feature of PWS, the metabolic profile and cardiovascular complications associated with the syndrome differ from those observed in individuals with non-syndromic obesity (6, 7). Individuals with PWS exhibit distinctive fat distribution patterns, with a higher fat mass percentage, particularly in the abdominal, buttocks, and thigh regions, despite having reduced fat-free mass (4, 8). Individuals with PWS often have reduced visceral fat deposits and a predominant accumulation of subcutaneous adipose tissue compared to individuals with common obesity (9). These unique metabolic characteristics contribute to a distinct metabolic phenotype in PWS, with lower insulin levels and higher insulin sensitivity relative to obese individuals without PWS (10). Despite the metabolic advantages associated with PWS, individuals with this syndrome are still at risk for developing various comorbidities, including type 2 diabetes mellitus, metabolic syndrome, hepatobiliary complications, and cardiovascular and respiratory problems (6, 11). Of particular concern is the presence of metabolic-associated fatty liver disease (MAFLD), commonly associated with obesity. Although individuals with PWS have a lower prevalence of severe MAFLD (12, 13), of MAFLD PWS remains challenging. Given the complex metabolic profile and the risk of cardiovascular complications in individuals with PWS, there is a need for reliable biomarkers for the e arly detection and management of these conditions. Protein biomarkers have emerged as potential candidates for detecting and characterizing liver steatosis and more advanced stages of the disease. These proteins are involved in pathways related to lipid transport, storage, and metabolism. They include the fatty acid binding protein 4 (FABP4) (14–16), retinol-binding protein 4 (RBP4) (15, 17), and adiponectin (18, 19), which have been associated with liver steatosis and insulin resistance. Elevated ALT and AST levels are often observed in individuals with liver steatosis (20, 21). Recently, several proteomics studies have identified novel plasma protein candidates, including a panel of five proteins (PIGR, DPP4, ANPEP, TGFB1, and APOE) correlating with the liver injury (22). Additional candidates have also been combined in diagnostic models, such as the logistic regression model comprising four proteins (ADAMTSL2, AKR1B10, CFHR4, and TREM2), BMI, and/or type 2 diabetes mellitus status, to identify individuals at-risk of steatohepatitis (23) and/or advanced fibrosis (24). However, the applicability of these markers for MAFLD and advanced stages of the disease in PWS subjects requires further validation. Multiple omics approaches may expand the pool of biomarker candidates for different stages of MAFLD and metabolic complications in this rare disease, supporting clinicians and researchers in understanding the cardio-metabolic status and hepatic health of individuals with PWS, facilitating early detection, monitoring, and management of liver-related complications. Ultimately, this knowledge can lead to improved therapeutic strategies and outcomes for individuals with PWS.
Thirty-one individuals with PWS (15 females, 16 males, mean age ± SD: 31.94 ± 12.2 years), hospitalized for a three-week multidisciplinary body weight reduction program at the Division of Auxology, Istituto Auxologico Italiano, IRCCS, Piancavallo-Verbania, Italy, were recruited for the present study. All subjects with PWS showed the typical clinical phenotype (2). Twenty-seven subjects had an interstitial deletion of the long proximal arm of chromosome 15 (del15q11-q13), while 4 patients had uniparental maternal disomy for chromosome 15. Twenty-two patients were classified as obese (Body mass index (BMI) > 30 kg/m2), while the remaining 9 had a BMI lower than 30. BMI ranged between 20 and 55.2 kg/m2 (mean ± SD: 37.0 ± 9.1 kg/m2). Ten patients were treated with recombinant human growth hormone (rhGH) at the time of the study and 4 were previously treated during adulthood. Nine of these and 9 other patients had been treated at pediatric age. Eight patients had never received GH therapy. Patients received rhGH treatment for a period ranging between 2 and 17 years. Liver steatosis was assessed through liver ultrasonography by an experienced echographist (AM) according to standardized criteria (25, 26), as previously described (27). The Ethics Committee of Istituto Auxologico Italiano Milan, Italy (ethical committee code: CE: 2022_03_15_07; research code: 01C216; acronym: PROTEOMARKER) approved the study. All procedures in the study complied with the Helsinki Declaration of 1975, as revised in 2008. The research procedure was explained to each participant and written informed consent was obtained by subjects and their parents, when it was appropriate.
After an overnight fast, blood samples were obtained through standard venipuncture using BD Vacutainer® serum separating tubes (BD - Plymouth PL6 7BP, UK). The tubes were then centrifuged at 1900 x g for 10 minutes at 4°C. Following the initial centrifugation, the resulting supernatants were carefully transferred into new tubes. Subsequently, samples were centrifug ed at 16000 x g for 10 minutes at 4°C. Finally, the supernatants were aliquoted into new tubes and promptly frozen at -80°C to ensure long-term storage until further analysis.
Blood samples were analyzed using the proximity extension assay (PEA) on Olink Target 96 metabolism and cardiometabolic panels (Olink Proteomics, Uppsala, Sweden). In this process, the target proteins specifically bind to double oligonucleotide-labeled antibody probes. Subsequently, microfluidic real-time PCR amplifies the oligonucleotide sequence for quantitative DNA sequence detection (28). Threshold cycle (Ct) data resulting from internal and external controls were subjected to quality control and normalization. Protein levels were measured on a relative scale and presented as a normalized protein expression (NPX) unit, represented on a log2 scale. Higher NPX values correspond to a high protein concentration. A list of proteins included in the analysis is shown in Table S1. Data visualization, exploration, and initial statistical analysis were conducted using the Olink Statistical Analysis web-based app. The NPX dataset was uploaded into the application, and samples that did not meet quality controls were excluded from the analysis. The samples were then categorized based on the grade of steatosis, and an analysis of variance (ANOVA) was performed on each assay. The results were presented as NPX median values and the inter-quartile range (IQR) for each marker within the sample group, unless differently specified. The reported p-values from the ANOVA analysis were adjusted for multiple testing using the Benjamini-Hochberg method.
To identify relevant pathways and perform enrichment analyses, we utilized various databases including Gene Ontology (GO) (http://geneontology.org/), Kyoto Encyclopedia of Genes and Genomes (KEGG) (https://www.genome.jp/kegg/pathway.html), Reactome (https://reactome.org/), and GeneCards (https://www.genecards.org/). During the enrichment analyses, we associated all the significantly expressed proteins with their respective terms or pathways in the GO or KEGG database. The analysis was carried out using the hypergeometric test or Fisher’s exact test with default settings. This process allowed us to gain insights into the functional implications of the identified proteins in the context of liver steatosis. In addition, the expression data of the proteins of interest were investigated in the GTEx data portal (http://gtexportal.org). By querying the selected tissue expression database, a heatmap with pseudocolor representation was generated. This is to visualize the expression patterns of these proteins across different tissues. STRING Version 11.5 (https://string-db.org) was employed to construct a protein-protein interaction network. The network was generated by using a query of five proteins, as described in the results section.
Correlations between variables were investigated using the Spearman rank correlation test (considering the low sample size). Correlation matrices were generated with R 4.2.2 (29) by using the Hmisc version 5.0-1 (30, 31), Performance Analytics version 2.0.4 (32), and Corrplot version 0.92 (33) packages.
We assessed the robustness of the logistic regression model using a non-parametric bootstrap simulation with out-of-bag prediction over 10,000 iterations. The corresponding R script can be found in Supplementary File 1.
T-test was used to determine significant differences among normally distributed continuous variables, while the Mann-Whitney was used for non-normally distributed variables. The Chi-Squares test was used for categorical variables. The Kruskal-Wallis test in the One-Way ANOVA procedure with Benjamini Hochberg correction was used for multiple comparisons. The receiver operating characteristic (ROC) curves were plotted to estimate the discriminatory potential of the circulating protein biomarkers. A hierarchical forward selection with switching one-way logistic analysis was used to estimate the discriminatory potential of the protein biomarker combination. Analyses were performed using NCSS 11 Software (2016) (NCSS, LLC. Kaysville, Utah, USA, ncss.com/software/ncss).
Olink proteomic analysis of individuals with PWS was performed to identify circulating biomarkers associated with the presence of steatosis. The studied population was grouped according to absence (S0) or presence (S1-S2-S3) of steatosis. Table 1 shows the clinical characteristics of the participants. Significant differences (p < 0.05) between groups were observed for BMI, diastolic pressure, insulin, HOMA index, glycated hemoglobin (HbA1c), C-reactive protein, triglycerides, fatty liver index – FLI, and the presence of metabolic syndrome. All these parameters were higher in the group with steatosis.
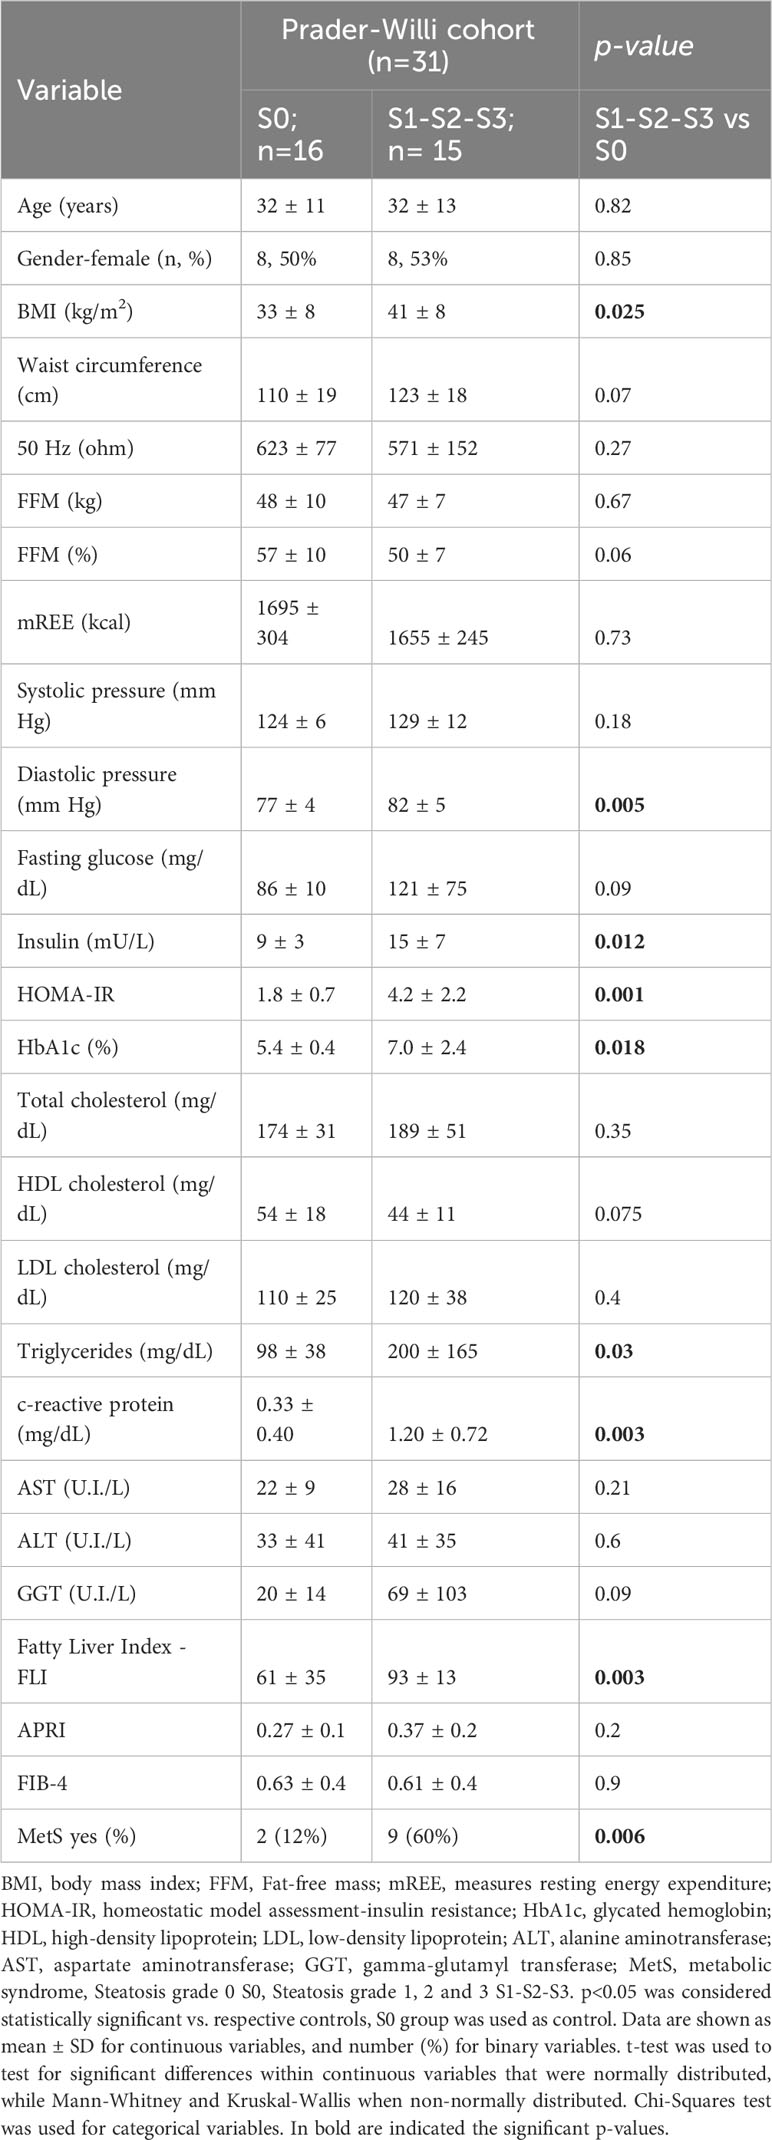
Table 1 Clinical characteristics of the studied population.
The circulating proteome was investigated using the Olink metabolism and cardiometabolic panels, each consisting of 92 different human protein biomarkers (Table S1). Two samples were removed from subsequent analysis due to alterations identified in the Olink internal quality control test. Two proteins, Leukocyte Immunoglobulin Like Receptor A5 (LILRA5) and CXADR Like Membrane Protein (CLMP) (from the metabolic panel), exhibited differential expression between males (n=15) and females (n=14) (p=0.046 and p=0.049, respectively). Notably, both biomarkers showed downregulation in males, with a median expression of 5.28 compared to 6.1 for LILRA5 and 2.4 compared to 2.8 for CLMP (Figure 1).
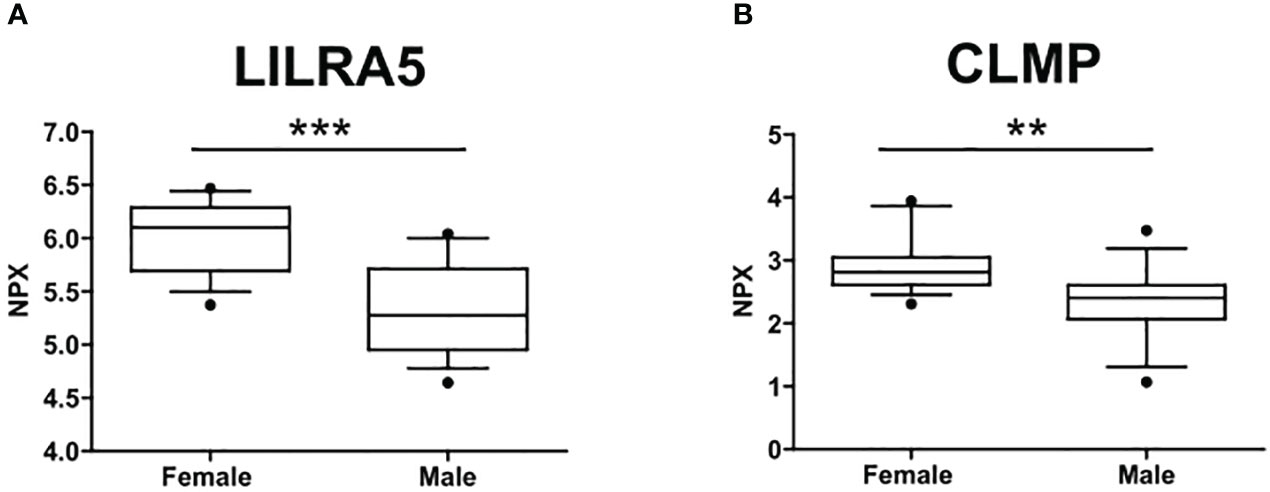
Figure 1 Sex differences in the circulating protein biomarkers. (A) LILRA5 showed a median NPX expression of 6.1 (5.7-6.29) in females and a median NPX expression of 5.28 (4.95-5.71) in males. (B) CLMP showed a median NPX expression of 2.8 (2.61-3.05) in females and a median NPX expression of 2.4 (2.07-2.61) in males. Values are presented as median with their respective interquartile ranges [IQR, 25th-75th percentile]. Statistical significance levels are denoted as follows: **, p<0.01; ***, p<0.001.
A comprehensive analysis revealed that a total of 15 proteins exhibited significant differential expression according to the presence of liver steatosis (Figure 2, Table 2). These include Cadherin 2 (CDH2), Cathepsin O (CTSO), Quinoid Dihydropteridine Reductase (QDPR), Calcium Activated Nucleotidase 1 (CANT1), Aldehyde Dehydrogenase 1 Family Member A1 (ALDH1A1), Thymidine Phosphorylase (TYMP), Adhesion G Protein-Coupled Receptor E2 (ADGRE), Kynurenine Aminotransferase 1 (KYAT1), Multiple Coagulation Factor Deficiency 2, ER Cargo Receptor Complex Subunit (MCFD2), Semaphorin 3F (SEMA3F), Thimet Oligopeptidase 1 (THOP1), Thioredoxin Domain Containing 5 (TXND5), Scavenger Receptor Cysteine Rich Family Member With 4 Domains (SSC4D), Fructose-Bisphosphatase 1 (FBP1), and Carboxylesterase 1 (CES1). Fourteen biomarkers belong to the OLINK metabolism panel, while only CES1 belongs to the OLINK cardiometabolic panel. All these circulating proteins showed higher expression levels in subjects with steatosis. Upon investigation in the GTEx portal (https://gtexportal.org/home/), we found that the liver exhibited the highest mRNA expression levels of FBP1, CES1, and QDPR among the analyzed organs (Figure S1) suggesting their role in liver function. Indeed, those candidates map on several liver-related pathways (Table S2). FBP1 is involved in several pathways including the Angiopoietin-like protein 8 regulatory pathway, disorders of the fructose metabolism pathway, and glycolysis and gluconeogenesis pathways. CES1 is implicated in cholesterol and sphingolipid transport-related pathways, as well as in the transport of molecules from the Golgi apparatus and endoplasmic reticulum to the apical membrane. CES1 also participates in lipid metabolic processes, including cholesterol biosynthesis and the detoxification response to toxic substances. QDPR is associated with pathways involved in folate metabolism, L-phenylalanine degradation I (aerobic), and phenylalanine degradation/tyrosine biosynthesis. These pathways are relevant for the breakdown of specific amino acids and the utilization of folate in various metabolic processes.
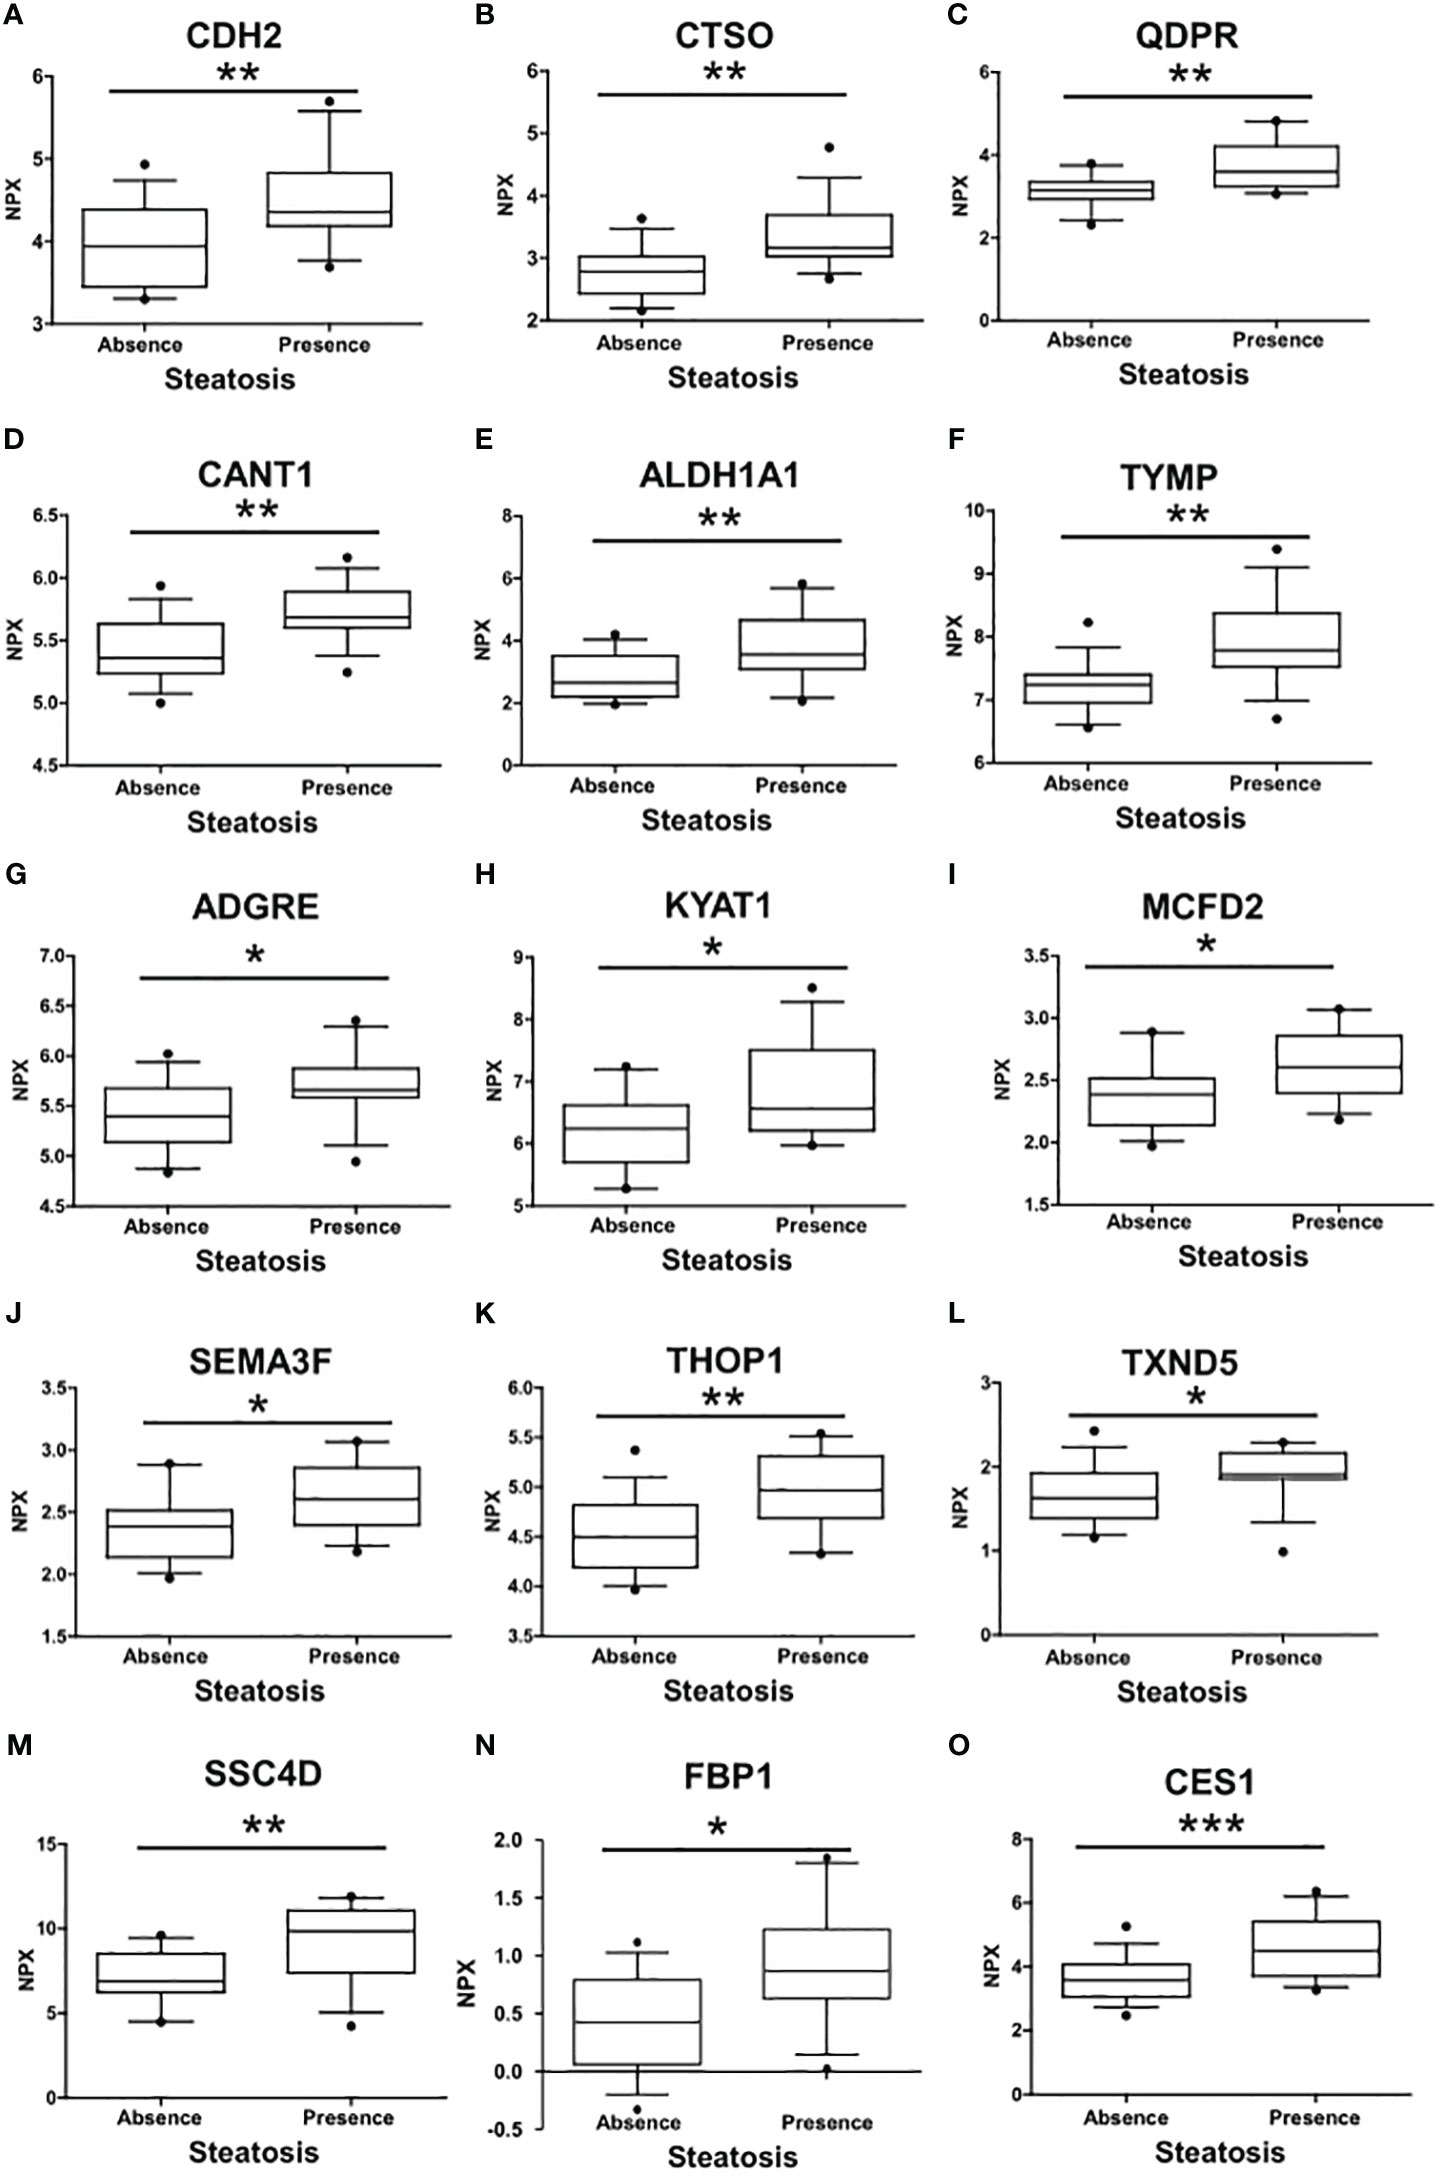
Figure 2 Differences in the circulating protein biomarkers according to the presence of liver steatosis. The analysis was performed by comparing individuals with PWS without steatosis and individuals with PWS with steatosis (including steatosis grade 1, grade 2, and 3). Values are presented as median with their respective interquartile ranges [IQR, 25th-75th percentile]. Statistical significance levels are denoted as follows: *, p<0.05; **, p<0.01; ***, p<0.001.
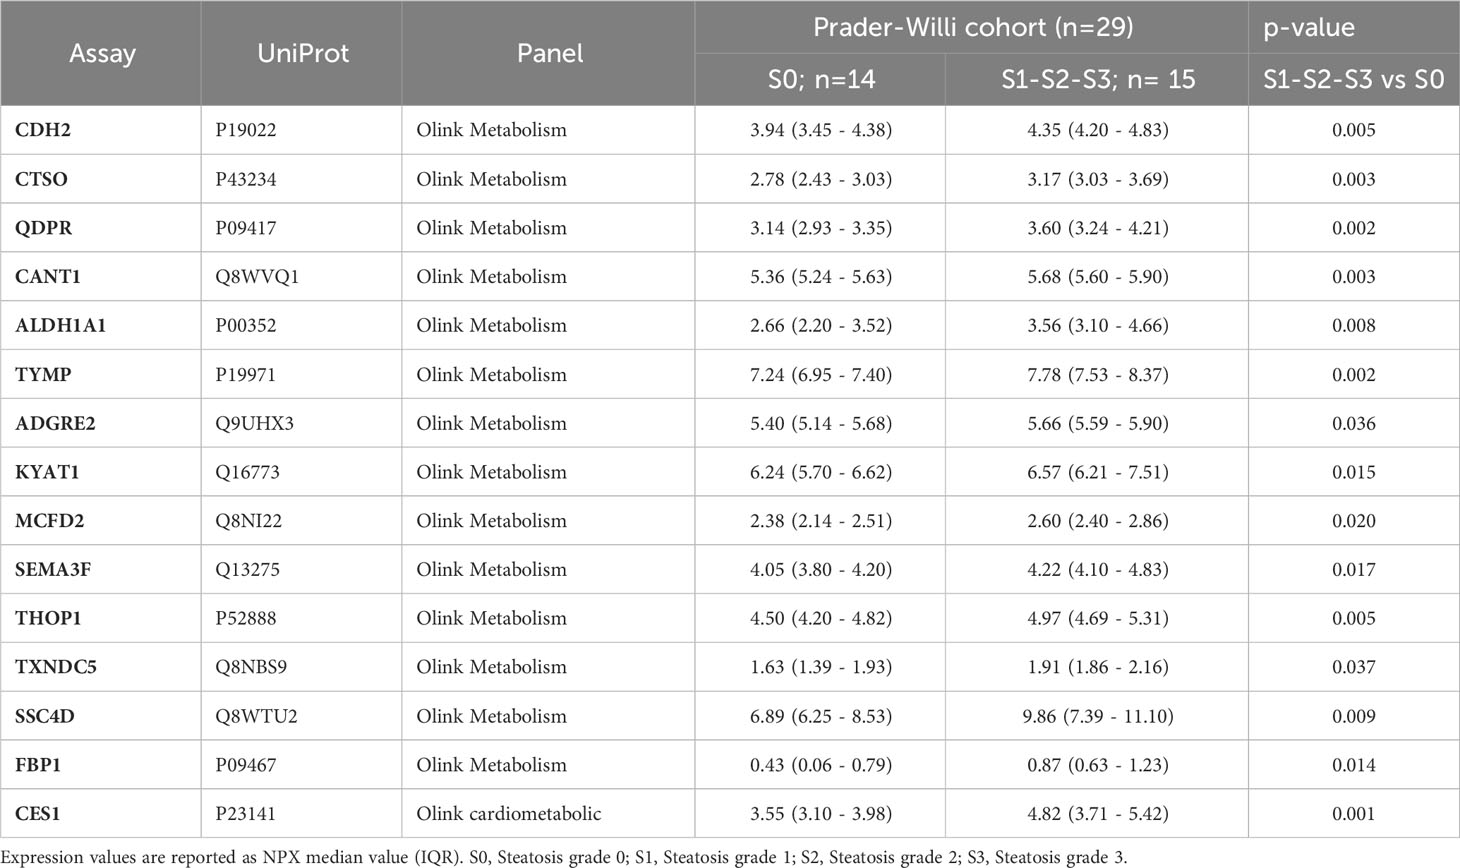
Table 2 Protein biomarkers associated with the presence of liver steatosis.
The association of circulating protein biomarkers from the two selected OLINK panels was explored is subjects with different stages of steatosis. The analysis confirmed the association of the 15 candidates with the presence of steatosis and showed a progressive increase with the degree of steatosis (Table 3, Figure 3). Two circulating proteins Sialic Acid Binding Ig-Like Lectin 7 (SIGLETC7) and Dipeptidyl Peptidase 7 (DPP7), also showed significant differences according to the degree of steatosis (Table 3, Figures 3P, Q). In particular, SIGLEC7 was higher in the S2-S3 groups compared to the S0-S1 groups (Table 3). On the contrary, ALDH1A and TYMP demonstrated different patterns (Figures 3E, F) as they initially increased from S0 to S1, followed by a slight decrease at S2, and then increase again at S3. The SSC4D exhibited a progressive increase from S0 to S2, indicating a correlation with the severity of liver steatosis. The expression level remained higher at S3 than that observed at S0 and S2 (Figure 3M).
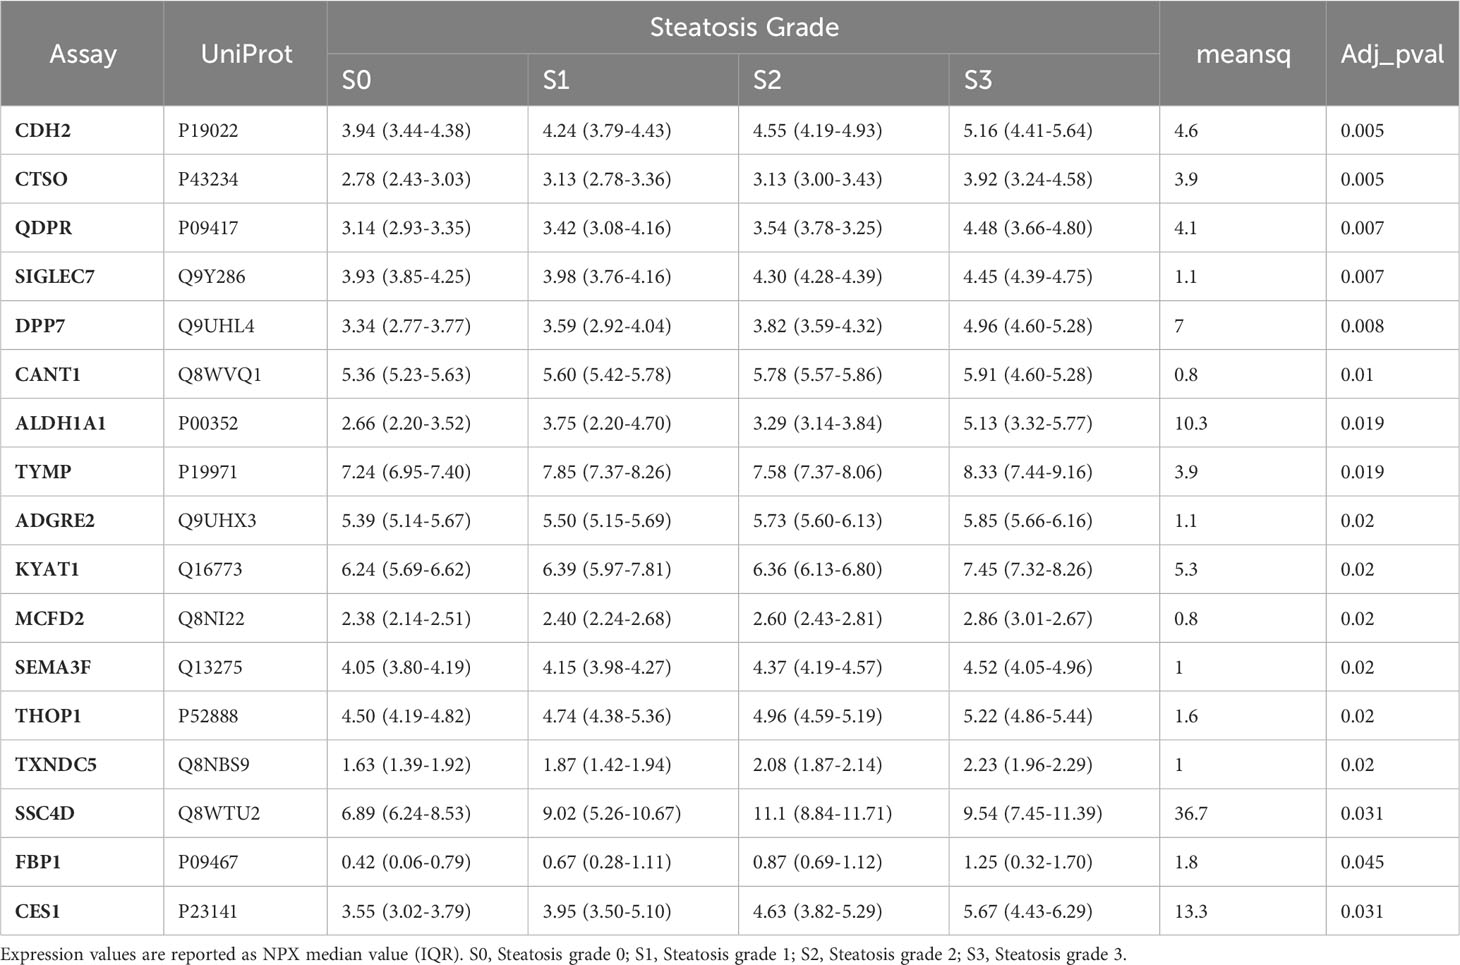
Table 3 Protein biomarkers significantly associated with the different grades of liver steatosis.
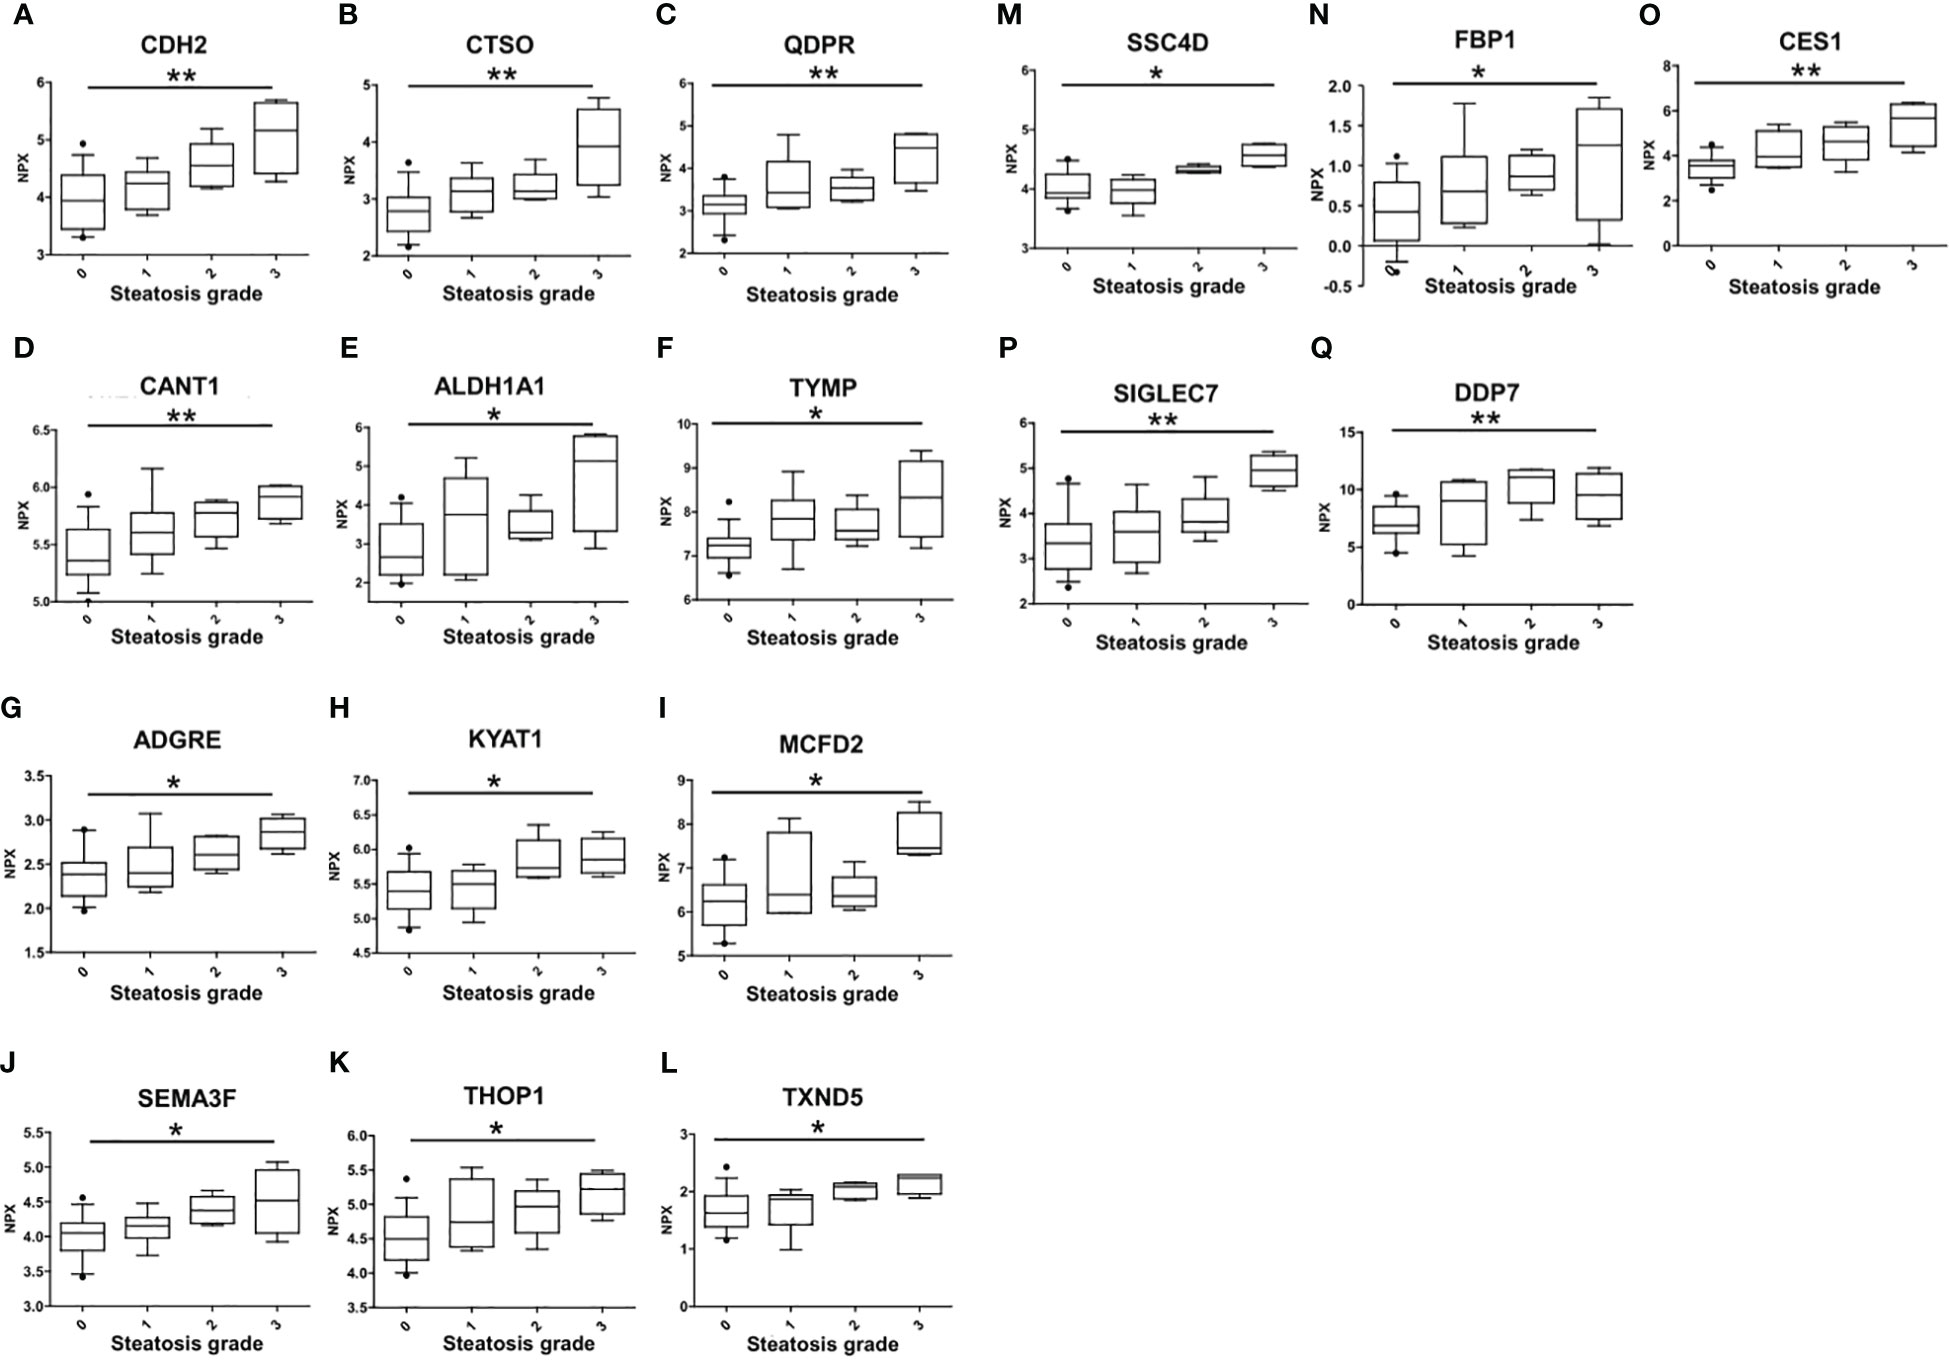
Figure 3 Differences in the circulating protein biomarkers according to the different grades of liver steatosis. The comparison was performed by considering separately the groups with different grades of liver steatosis (S0 = 14, S1 = 6, S2 = 5, S3 = 4). Values are presented as median with their respective interquartile ranges [IQR, 25th-75th percentile]. Statistical significance levels are denoted as follows: *, p<0.05; **, p<0.01.
To assess the potential of the significant biomarkers in distinguishing between subjects with or without steatosis, a ROC curve analysis was conducted on the 15 identified biomarkers. The analysis involved determining the AUC (Area Under the Curve) and cut-off values based on the Youden index, which maximizes sensitivity and specificity for each candidate. The results, including the AUC values and cut-off values, are presented in Table 4 and Figure 4. p-values, sensitivity, and specificity values were considered to rank the performance in distinguishing the two groups. The top five candidates were selected for further analysis using logistic regression with forward selection with switching. The resulting model, -34.19 + 0.85 * QDPR*QDPR + 0.75 * CANT1*TYMP - 0.46 * THOP1*ALDH1A1, demonstrated an AUC of 0.93 (95% CI: 0.63-0.99), with a sensitivity of 93% and specificity of 80% at a cut-off value determined at 0.4 (Figure 5).
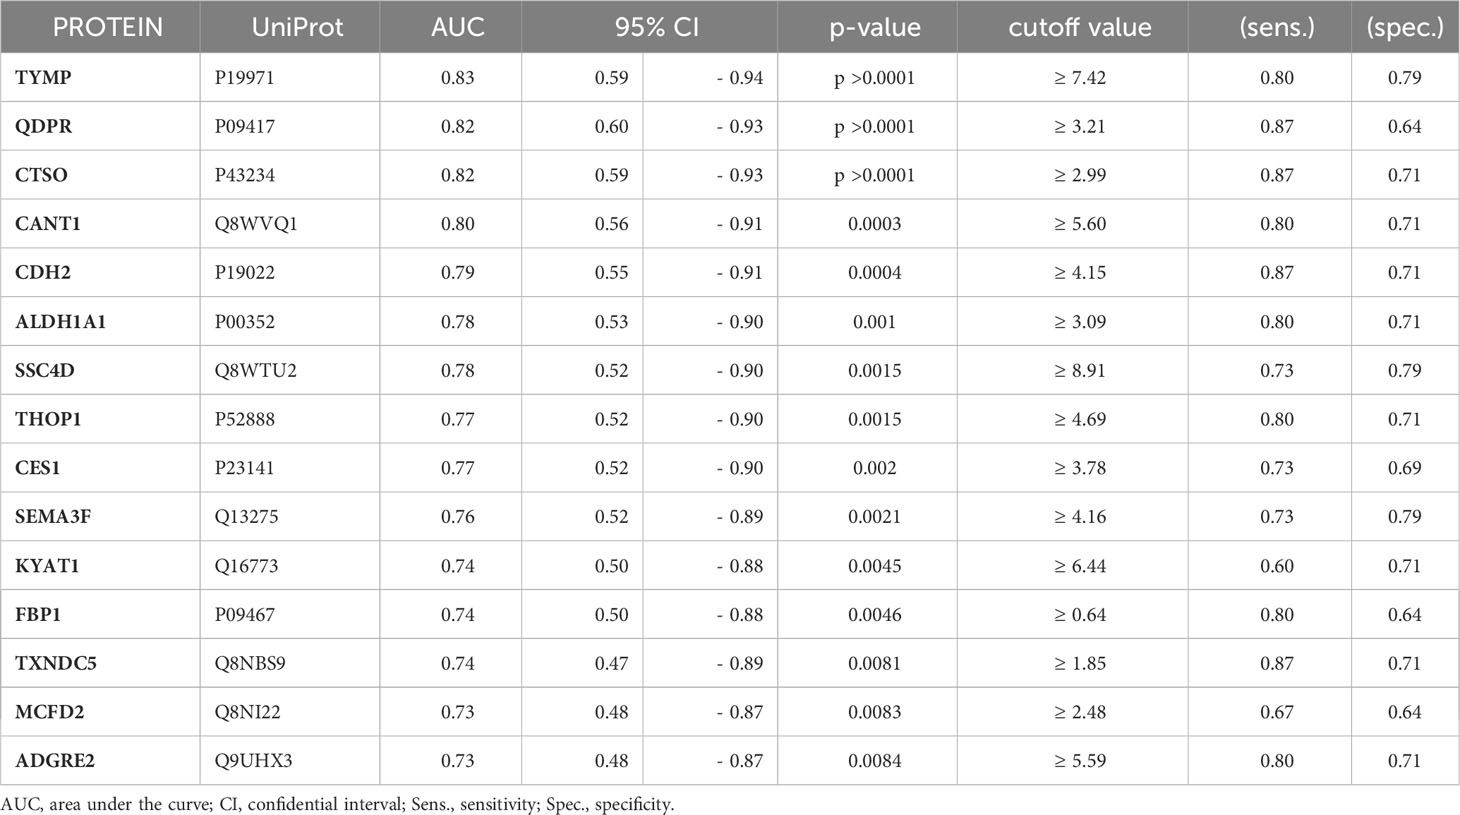
Table 4 Ranked list of the AUC values calculated for each of the biomarker candidates.
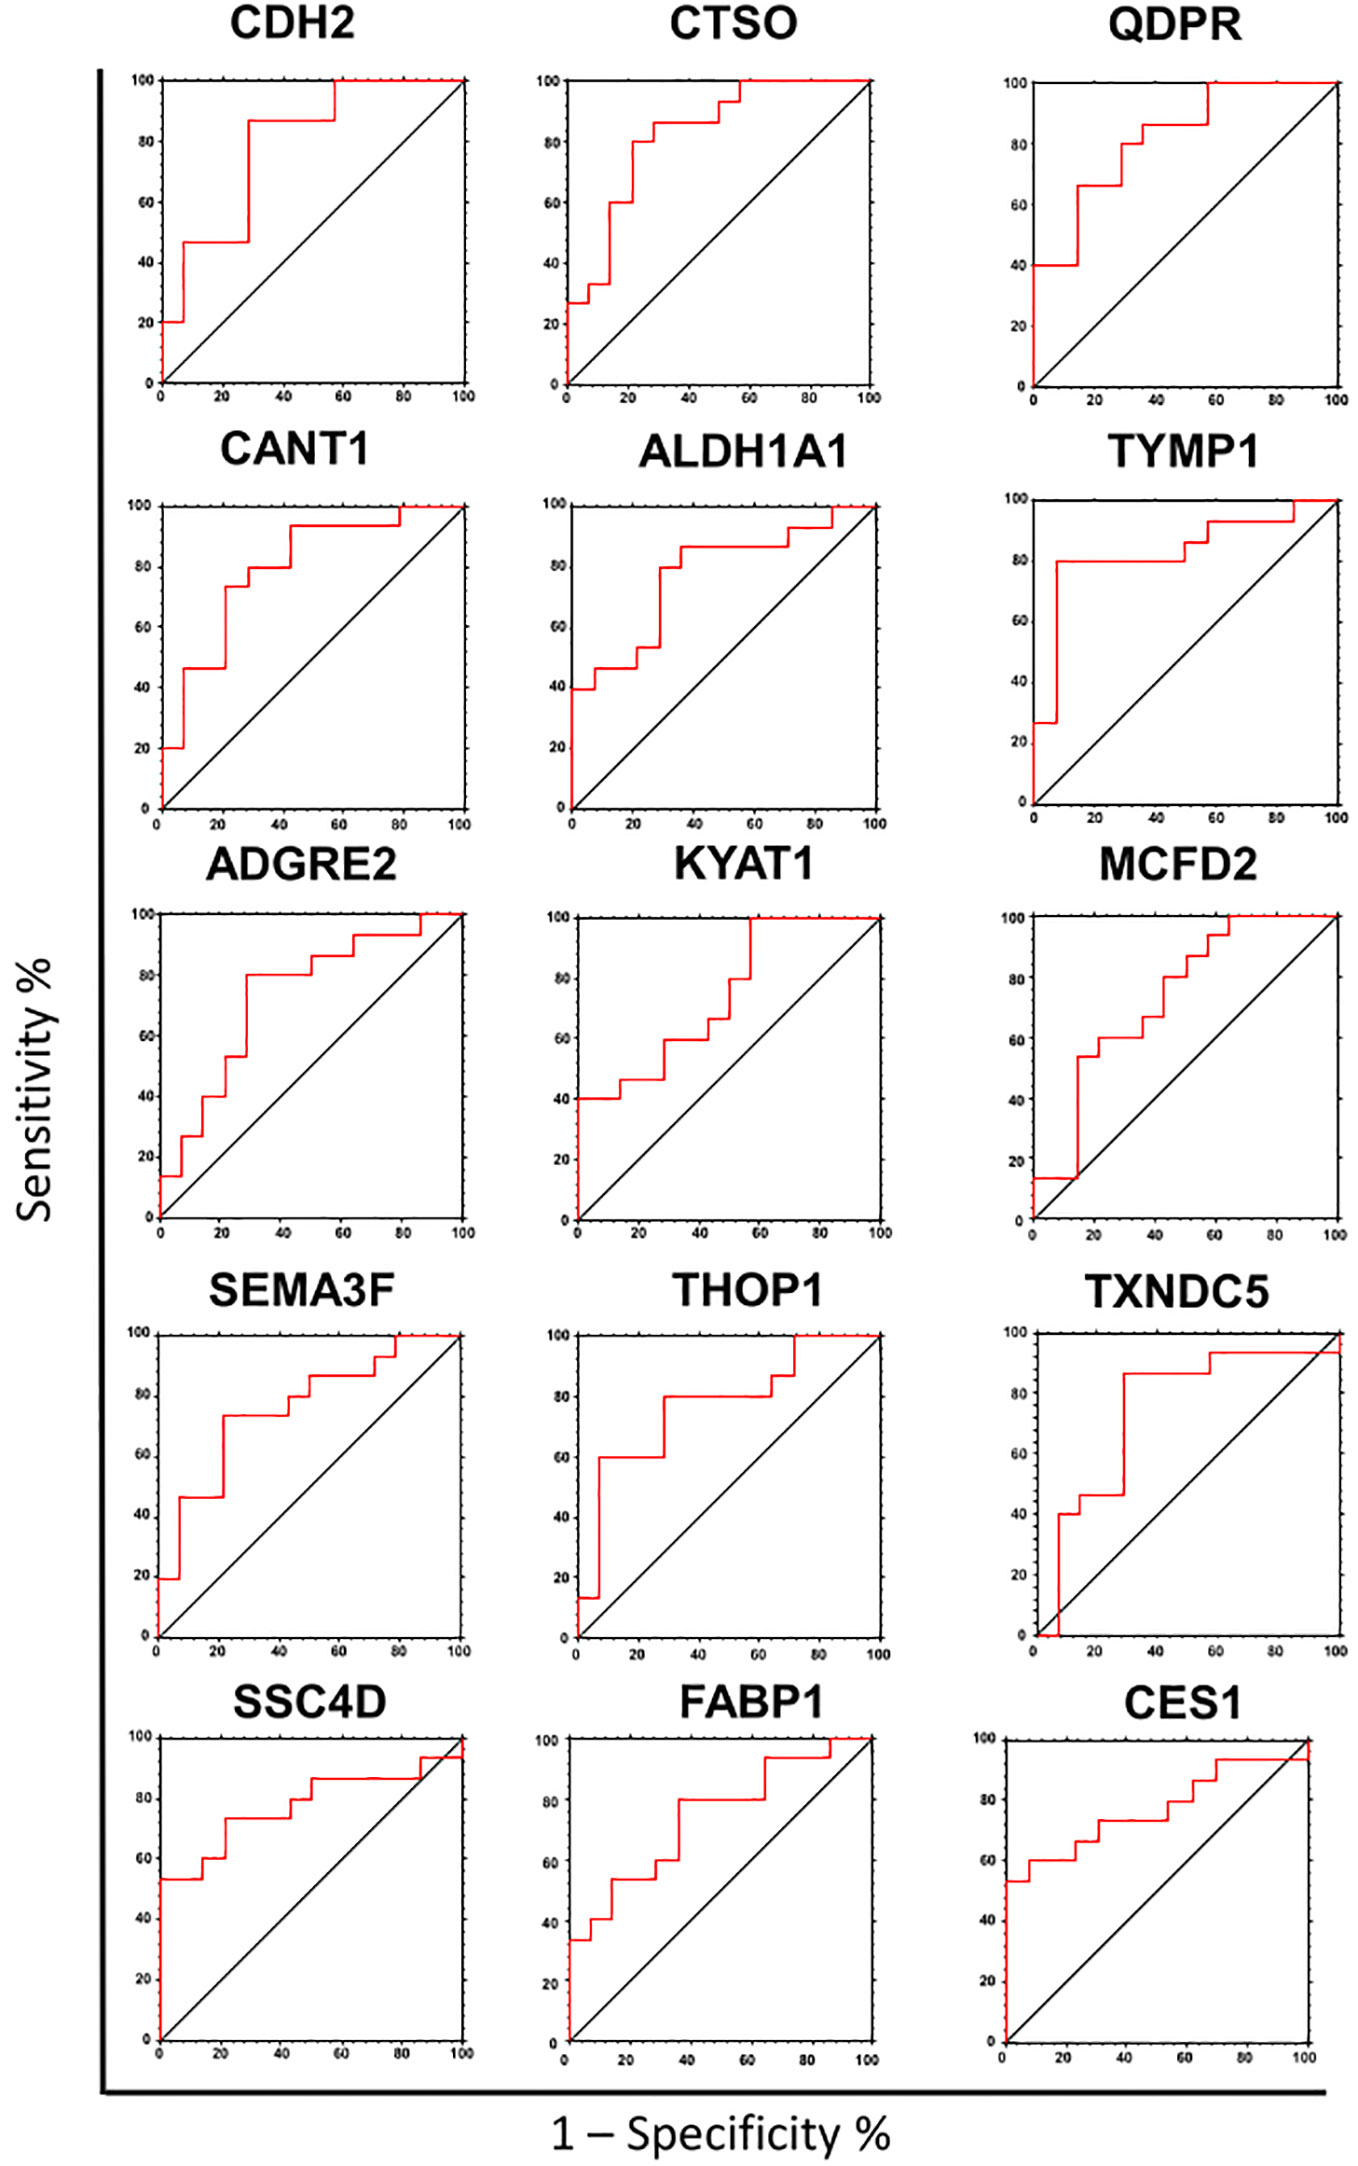
Figure 4 Receiver operating characteristic (ROC) analysis of the biomarker candidates. ROC curve analysis was used to determine the discriminatory potential of candidates according to the presence of liver steatosis.
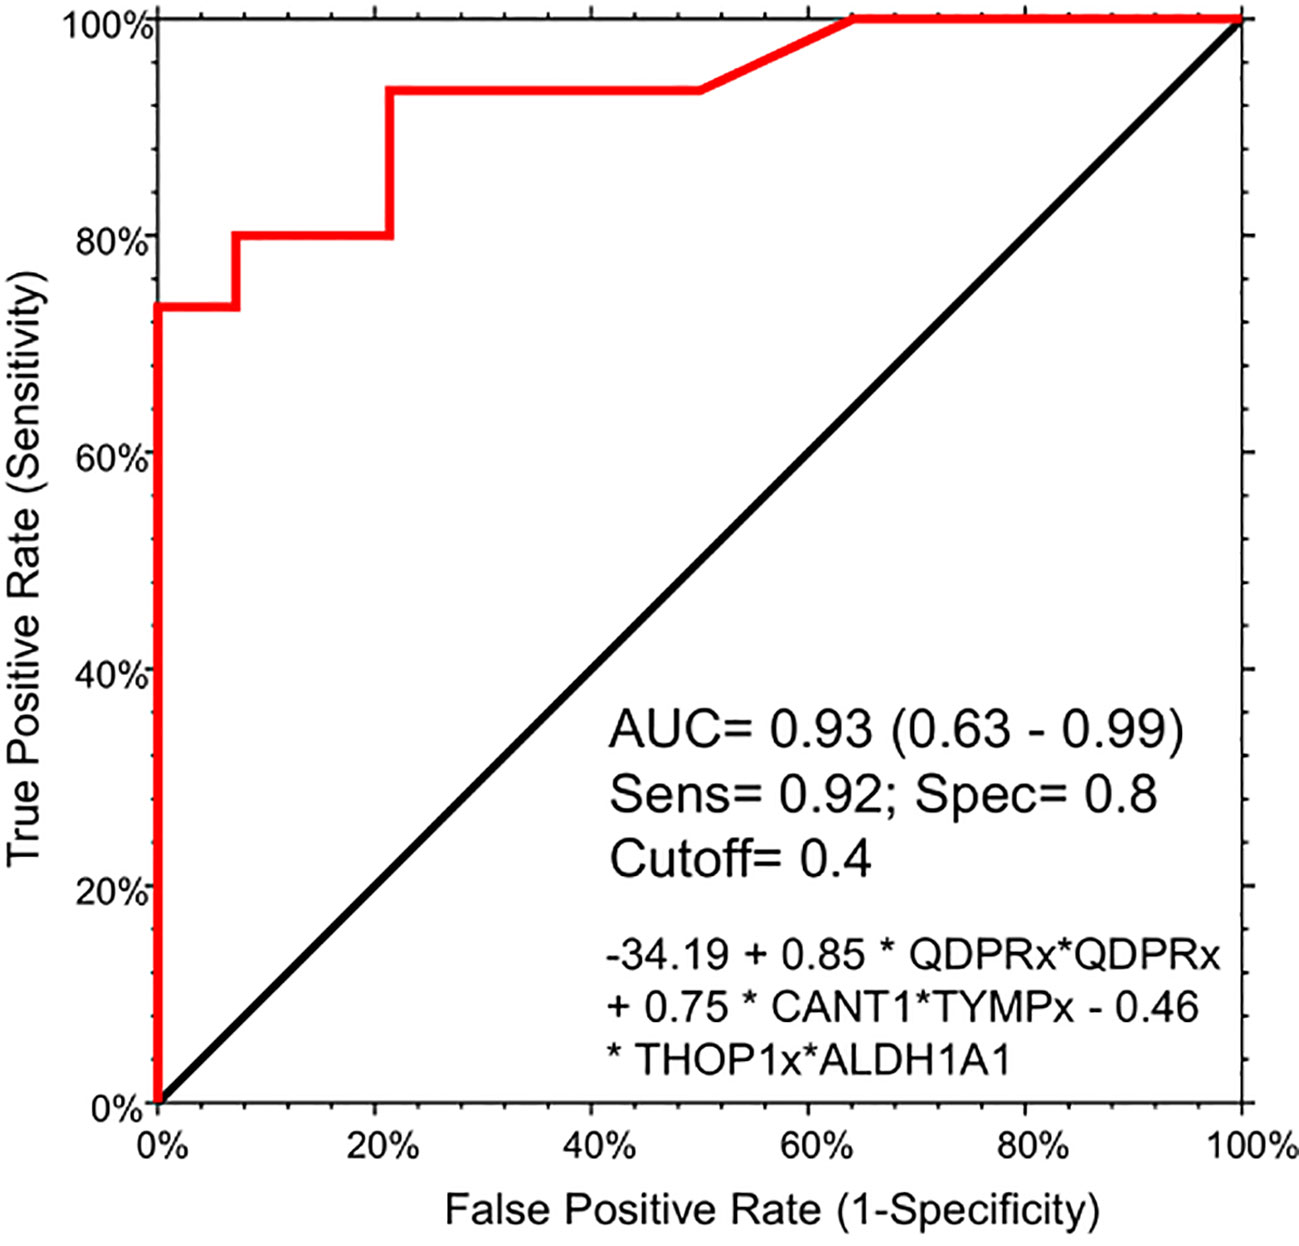
Figure 5 Logistic regression model for the detection of liver steatosis in individuals with PWS. The combination of the five circulating protein biomarkers in the logistic regression model demonstrated an AUC of 0.93 (95% CI: 0.63-0.99), with a sensitivity of 93% and specificity of 80%, at a cut-off value determined at 0.4. The logistic model is the following: -34.19 + 0.85 * QDPR*QDPR + 0.75 * CANT1*TYMP - 0.46 * THOP1*ALDH1A1.
Due to the rarity of the disease and the general scarcity of sufficient biological samples for validating the logistic model, we assessed the model’s robustness through a bootstrapping analysis with out-of-bag prediction over 10,000 iterations. This in silico simulation provided additional validation for our model. We evaluated the logistic regression model using observations from the bootstrap sample, resulting in an AUC of 0.83, a sensitivity of 0.81 and aspecificity of 0.87 at a determined cut-off of 0.554 (Figure S2). Interestingly, the correlation analysis evidenced a high degree of association (r >0.8 and p < 0.001) among the protein biomarkers included in the logistic regression model. Indeed, QDPR highly correlates with KYAT1 (r = 0.89, p < 0.001), ALDH1A1 (r = 0.86, p < 0.001), and THOP1 (r = 0.82, p < 0.001).
ALDH1A1 correlated with TYMP (r = 0.83, p < 0.001) and KYAT1 (r = 0.82, p < 0.001), also known as CCBL1, which in turn correlated with THOP1 (R2 = 0.83, p>0.001) (Figure 6). Consistently, these candidates demonstrated interconnections at different levels of interaction, forming a network of 62 nodes (Figure 7) primarily involved in 7 metabolic pathways listed in Table 5.
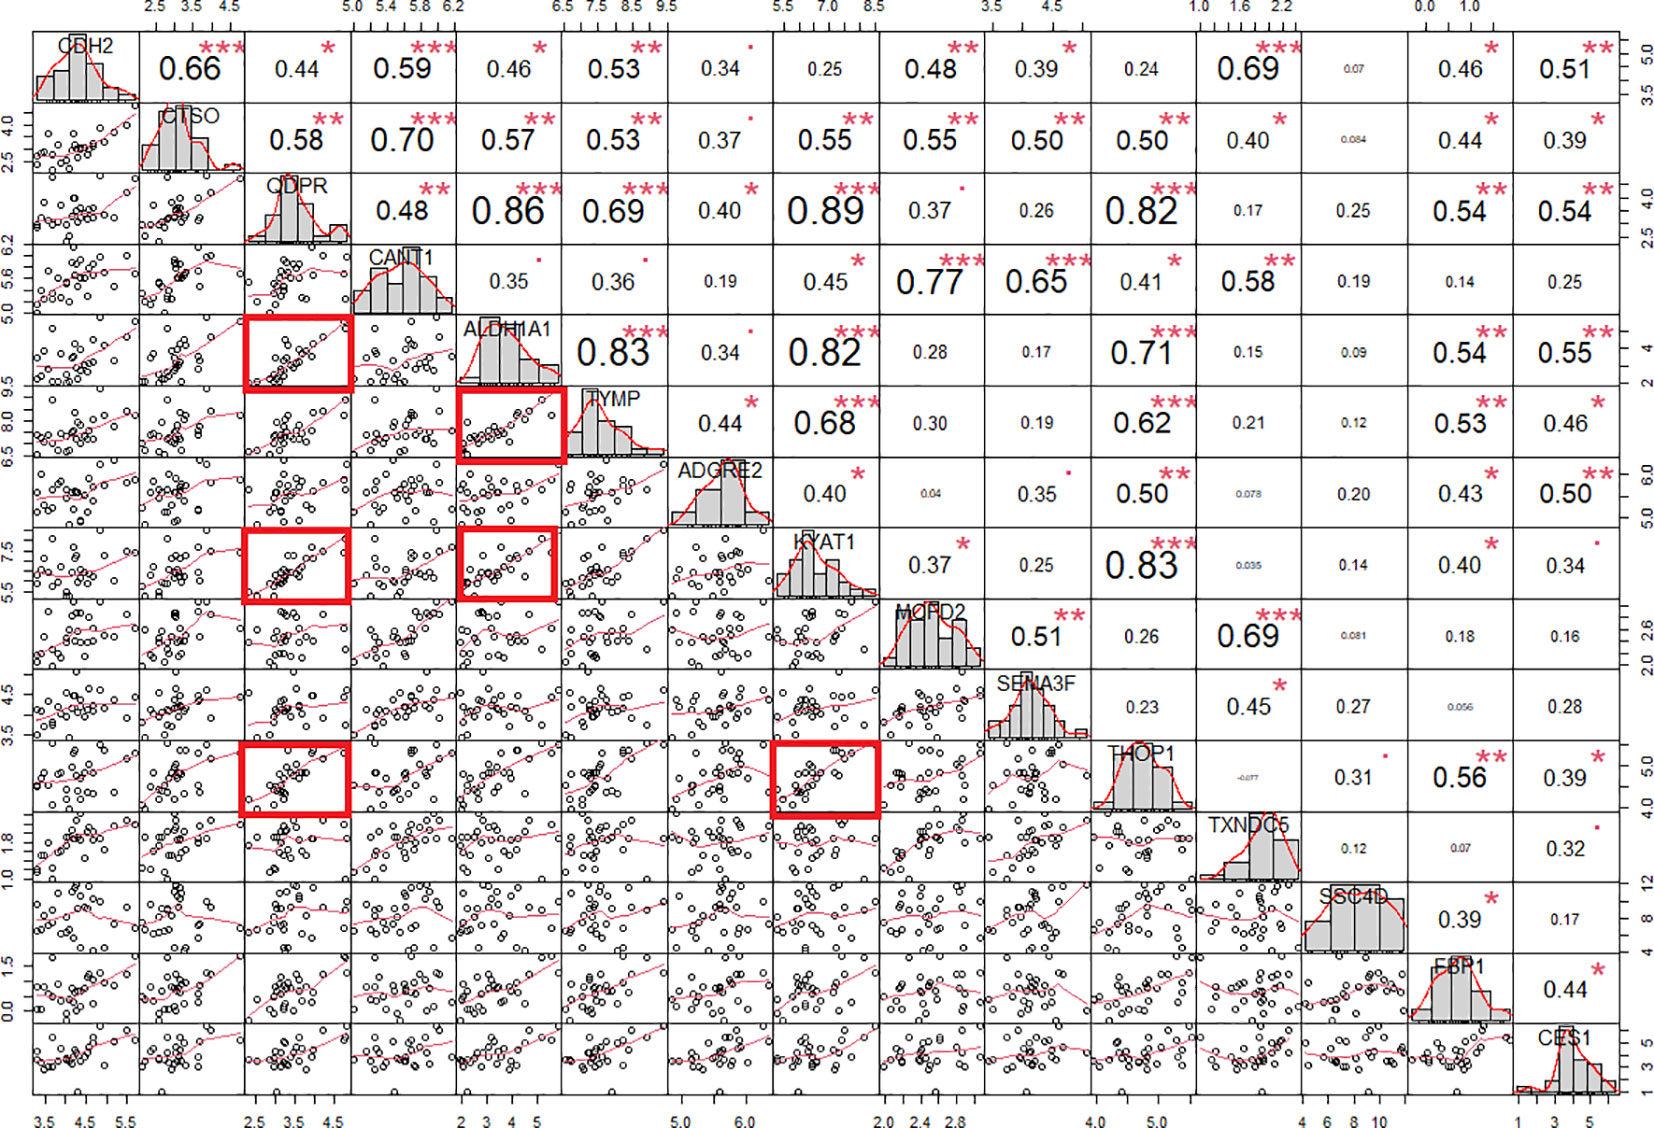
Figure 6 Protein correlation chart in individuals with PWS. The upper-right section displays the correlation coefficient and corresponding p-value for each pairwise correlation, while the lower-left section presents the plots illustrating these correlations. We calculated the correlation coefficient using Spearman’s method. Notably, correlation coefficients exceeding 0.80 with a p-value of less than 0.001 are denoted by red squares. Statistical significance levels are denoted as follows: *, p<0.05; **, p<0.01; ***, p<0.001.
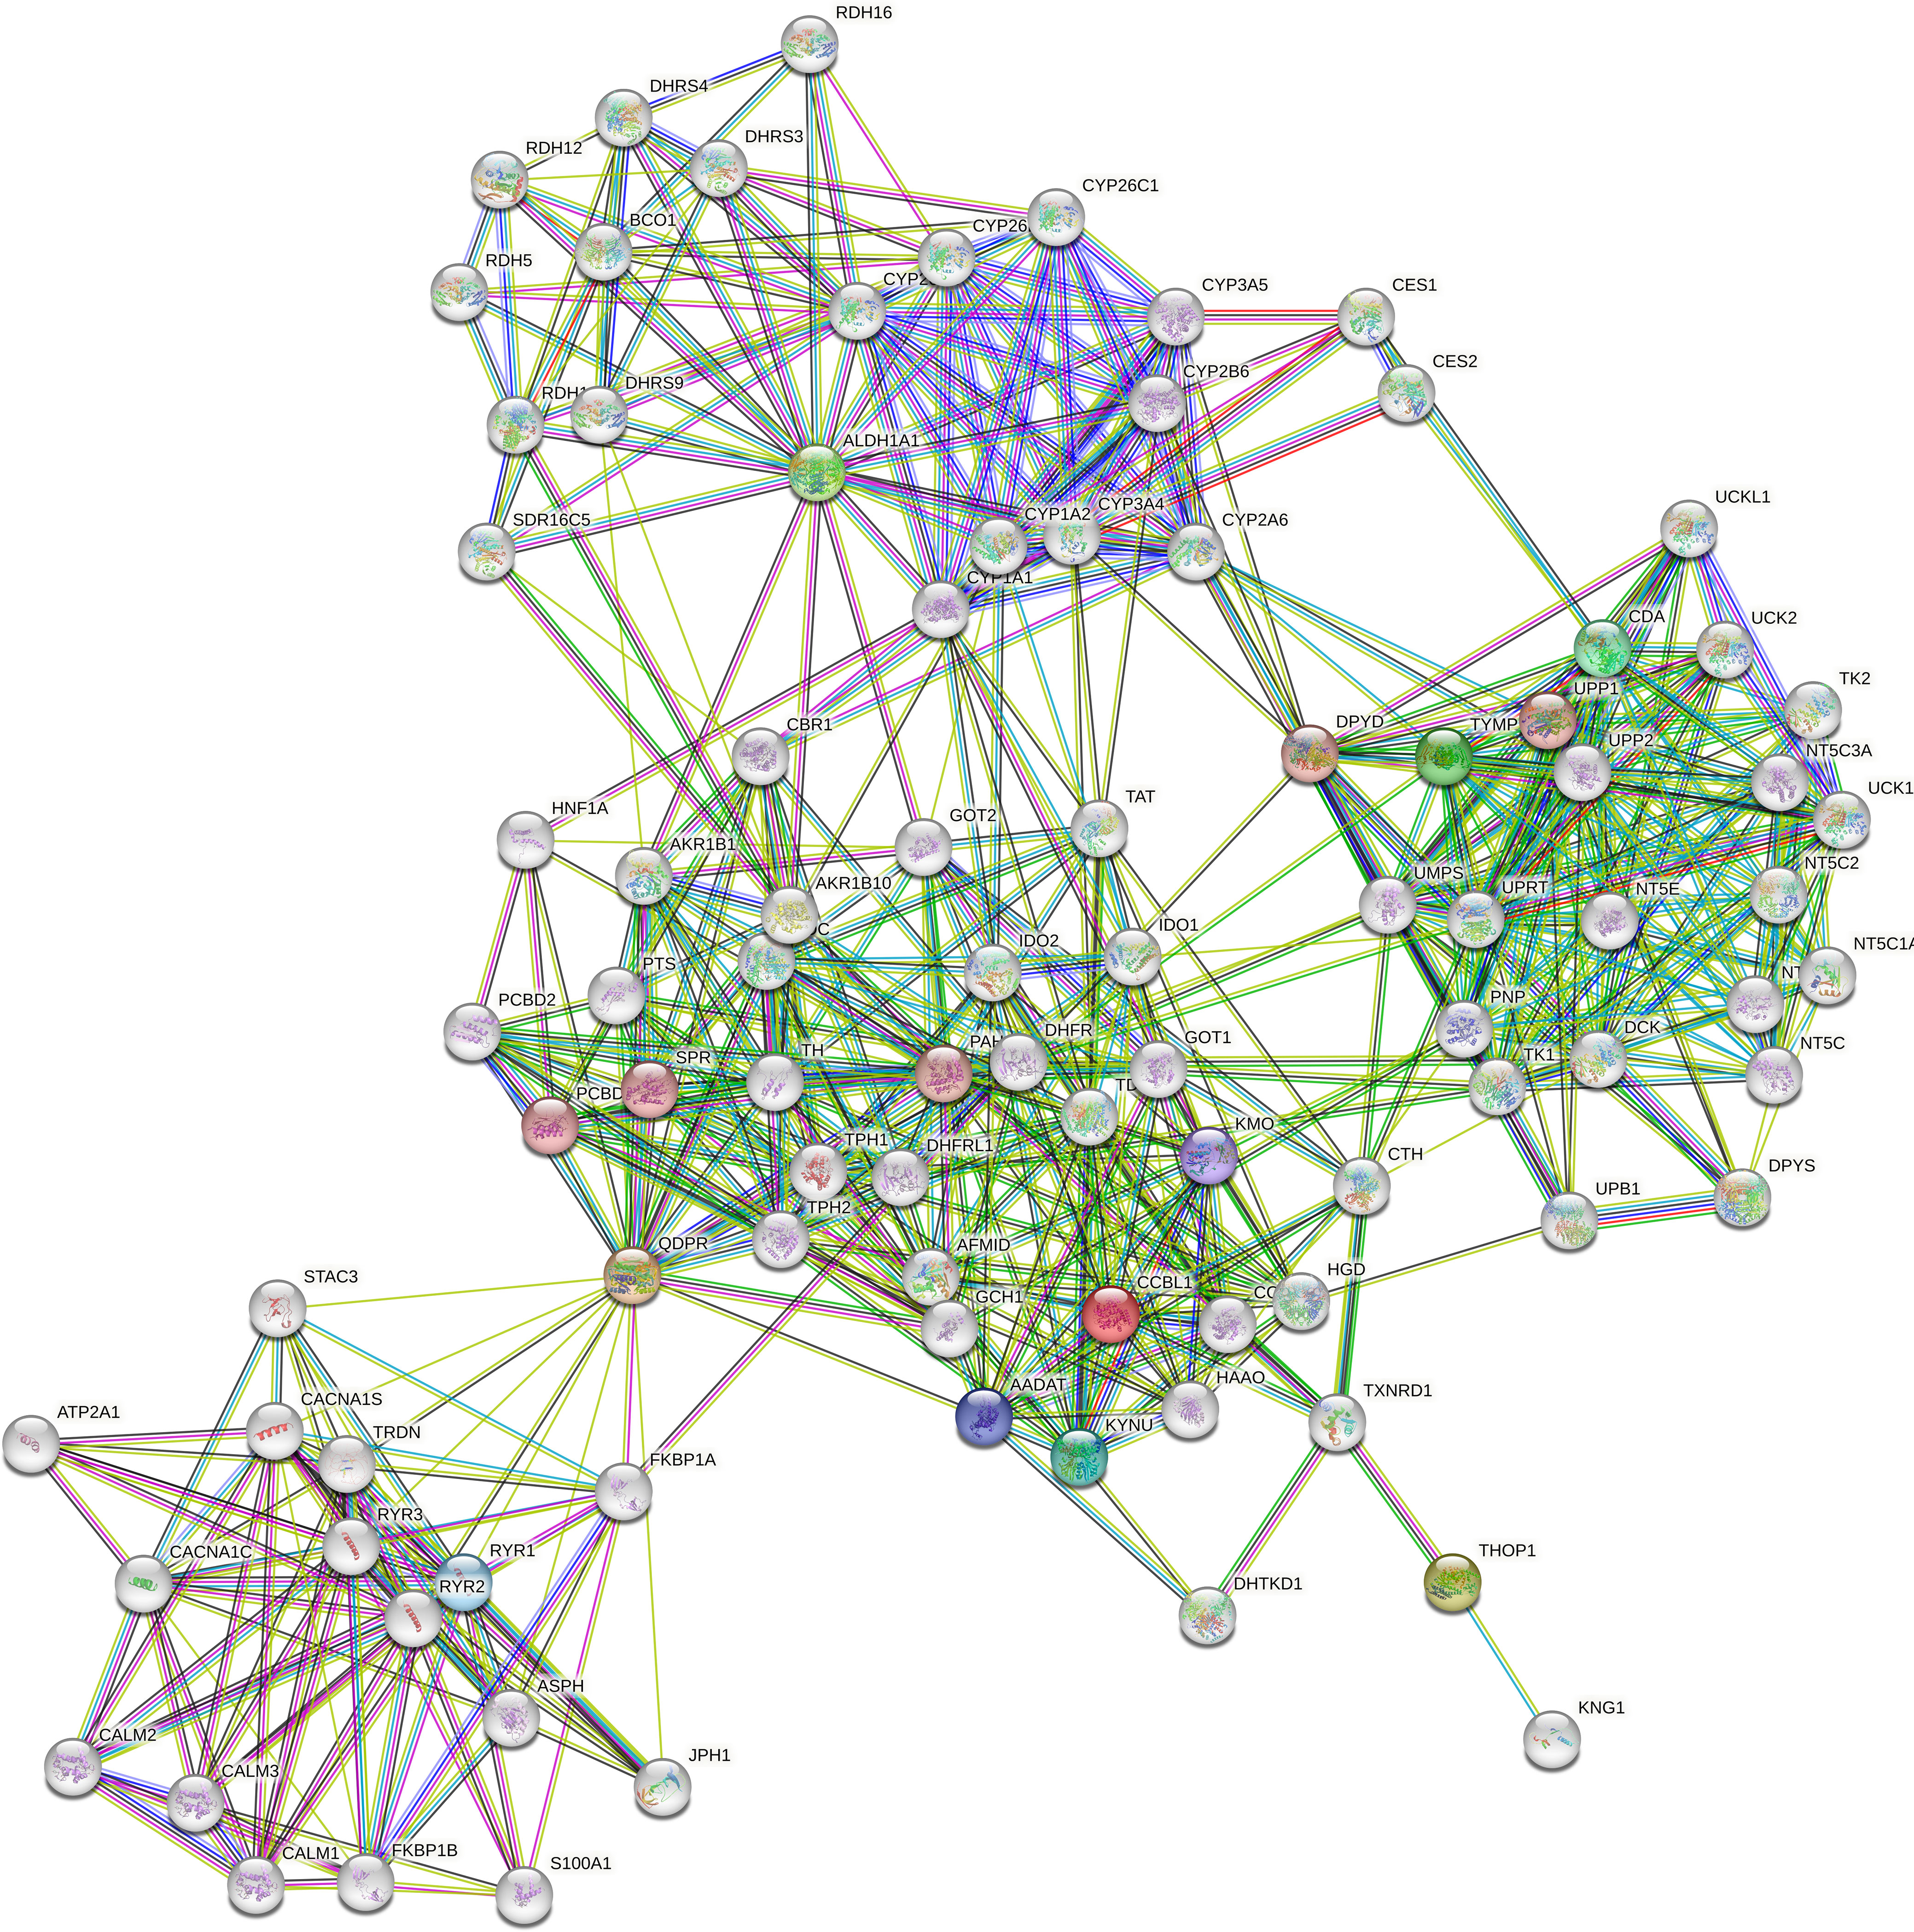
Figure 7 Protein-protein interaction network. The network was constructed in STRING Version 11.5 by using a 5-gene list consisting of QDPR, KYAT1 (also known as CCBL1), ALDH1A1, THOP1 and TYMP. The network consists of 62 nodes encompassing 7 main enriched pathways.
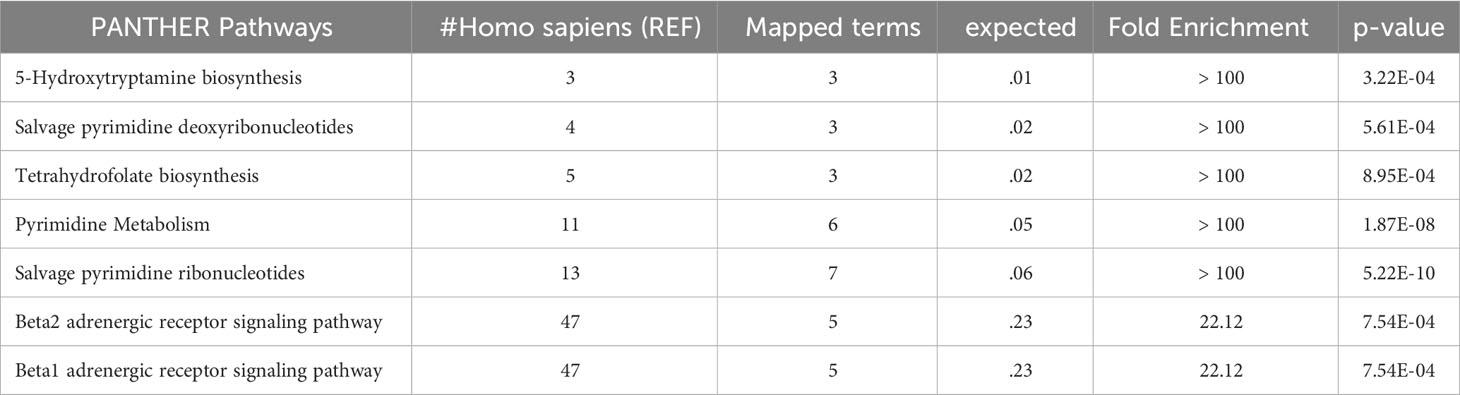
Table 5 Enriched panther pathways.
The role of those candidates was confirmed by the corrplot matrix, which showed a significant positive correlation of QDPR, ALDH1A1, TYMP, and THOP1 with several clinical variables associated with liver disease, such as cholesterol level, LDL, triglycerides, transaminases levels, and HbA1c, as well as with disease-associated scores such as FLI, APRI, and HOMA (Figure 8). A negative correlation was observed between HDL levels and QDPR, ALDH1A1, THOP1, and CANT1. When clustering in the correlation matrix was performed, we identified two interesting clusters, one grouping the protein candidates associated with fat metabolisms-related clinical variables, and the other grouping protein candidates associated with liver injury and risk of diabetes. These clusters, besides the five-protein signature, included also CES1, FBP1, KYAT1, CDH2, and CTSO (Figure 9).
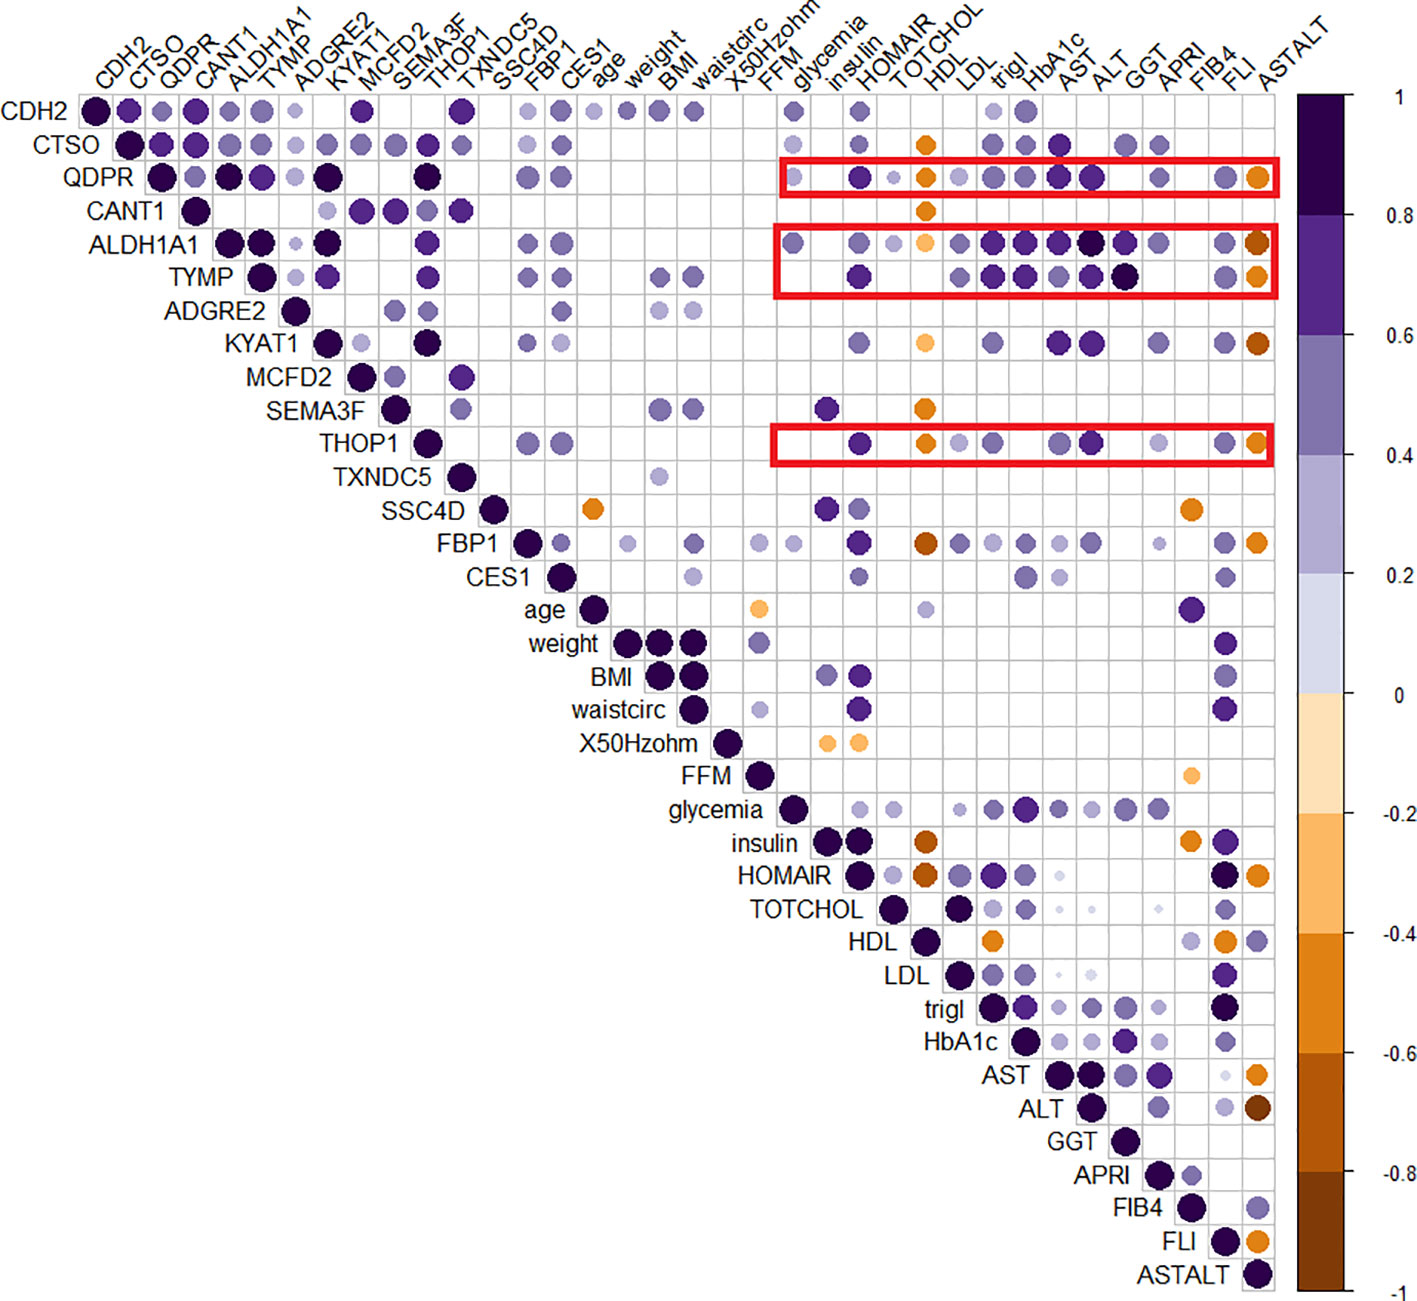
Figure 8 Correlogram of circulating protein candidates and clinical variables. Spearman’s correlation was used to determine the correlation coefficients. The size and color depth of the dots are proportional to the correlation coefficient. Purple colors indicate a positive correlation while brown colors indicate a negative one. Only significant correlations were reported. Red squares highlight the cluster of clinical variables that exhibit correlations with the genes included in the logistic regression model (QDPR, KYAT1, ALDH1A1, THOP1 and TYMP).
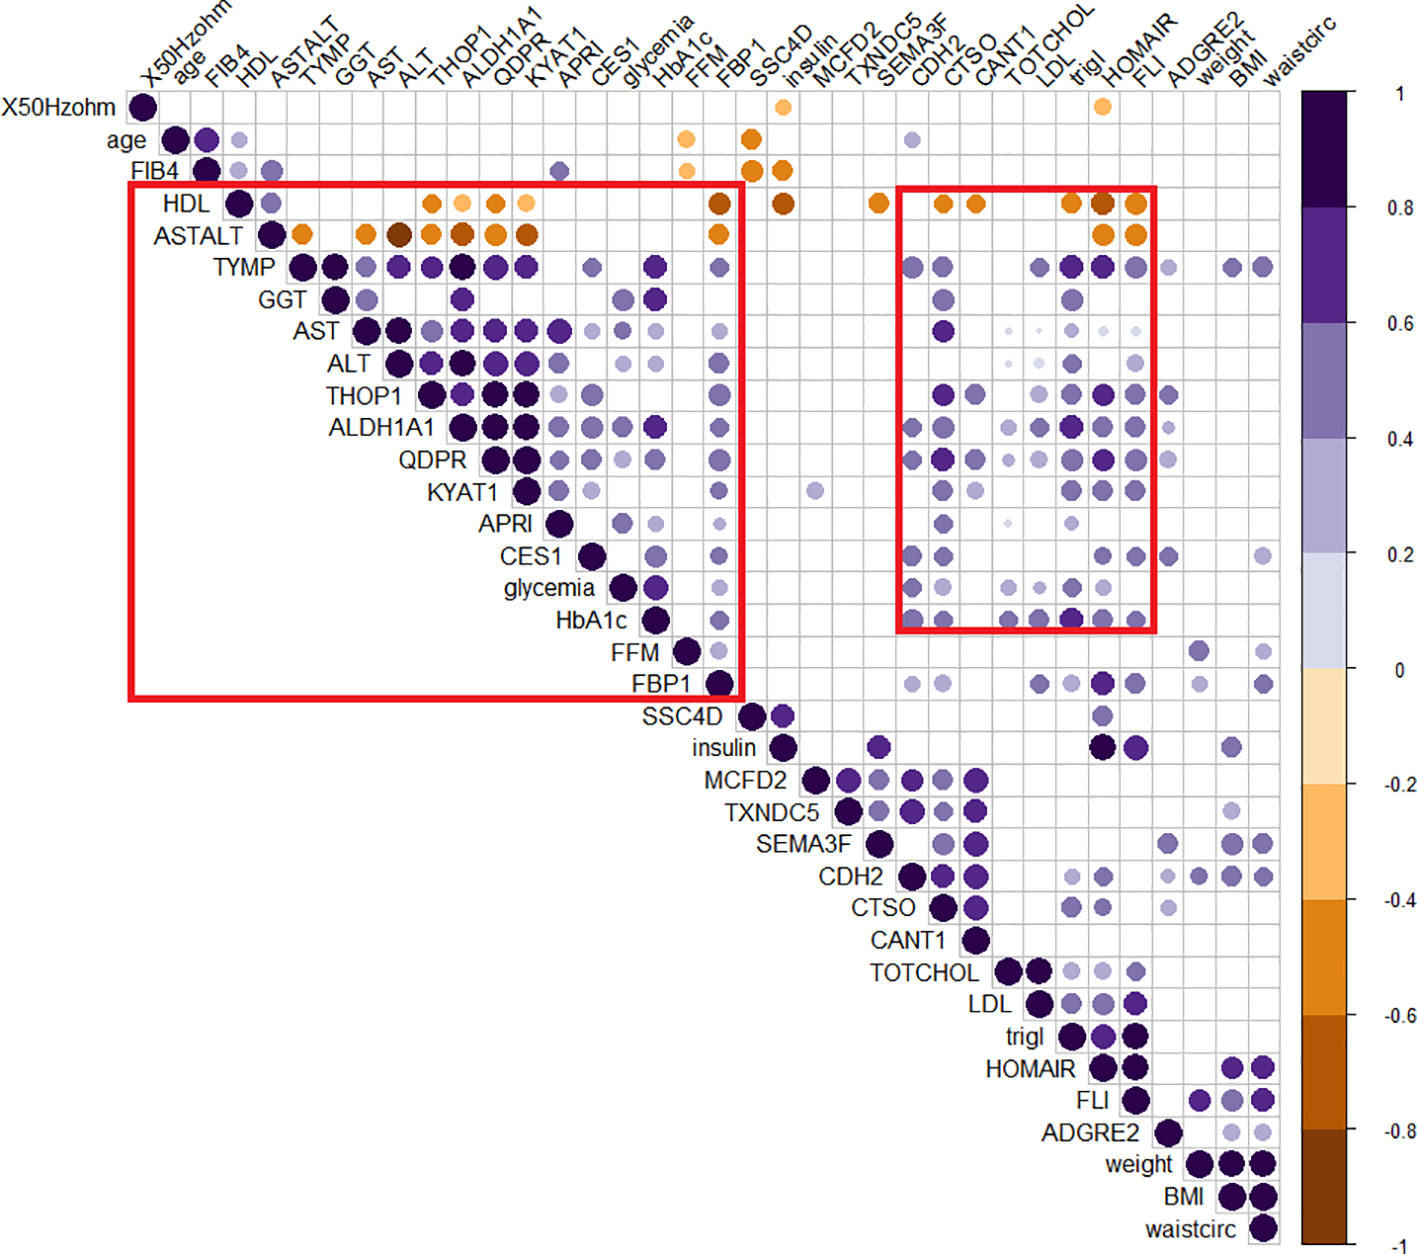
Figure 9 Clusterized correlogram of circulating protein candidates and clinical variables. Spearman’s correlation was used to determine the correlation coefficients. Unsupervised hierarchical clusterization was used to identify similar groups of correlating variables. The size and color depth of the dots are proportional to the correlation coefficient. Purple colors indicate a positive correlation while brown colors are a negative one. Only significant correlations were reported. Red squares highlight clusters of variables associated either with lipid metabolism or liver damage.
The use of biomarkers for detecting and monitoring liver steatosis holds significant potential in individuals with PWS. Liver steatosis, characterized by fat accumulation in the liver cells, is a common complication in PWS and is associated with various metabolic abnormalities and an increased risk of liver-related complications (12, 13, 34).
Circulating biomarkers provide a minimally invasive approach easily obtained from individuals with PWS. This minimally invasive nature of biomarkers not only improves patient comfort and compliance but also allows for repeated measurements, facilitating longitudinal monitoring of liver health and response to therapy. For these reasons, the present study aimed to identify circulating protein biomarkers associated with liver steatosis in individuals with PWS.
Patients with liver steatosis showed a significant increase in BMI, diastolic pressure, insulin, HOMA index, glycated hemoglobin (HbA1c), C-reactive protein, triglycerides, fatty liver index (FLI), and the presence of metabolic syndrome. As for non-syndromic obesity, these findings are consistent with previous studies linking these factors to the development and progression of liver steatosis (35–37).
To further characterize the disease, a circulating proteome analysis was performed.
To the best of our knowledge, our study represents the first attempt to comprehensively investigate the circulating proteome profile in individuals with PWS and its association with steatosis. We identified 15 circulating proteins that exhibited higher expression levels in individuals with PWS and steatosis as compared with those without. These proteins include CDH2, CTSO, QDPR, CANT1, ALDH1A1, TYMP, ADGRE, KYAT1, MCFD2, SEMA3F, THOP1, TXND5, SSC4D, FBP1, and CES1. These proteins have been implicated in various biological processes and metabolic pathways, including those related to liver function.
Upon examining mRNA expression profiles in different organs within the GTEx database, it became evident that the liver exhibited the highest mRNA expression levels of FBP1, CES1, and QDPR, suggesting that these proteins play crucial roles in liver functions. They may be specifically involved in the angiopoietin-like protein 8 regulatory pathway, disorders of fructose metabolism, glycolysis and gluconeogenesis, cholesterol, and sphingolipid transport. Interestingly, the circulating angiopoietin Like 8 (ANGPTL8) has already been associated with liver steatosis in PWS (34).
In particular, serum ANGPTL8 inversely correlated with the severity of liver steatosis and was reported to be usually lower in individuals with PWS than in obese controls (34). Previous reports have highlighted the key role of CES1 in liver lipid metabolism and associated its alterations with obesity, hepatic steatosis, hyperlipidemia, and an increased risk of cardiovascular disease (38–40). CES1 was positively correlated with increased lipid storage and plasma lipid concentration. Furthermore, mutations in CES1, that reduce its lipolytic activity by 80% in vivo, have been shown to prevent high-fat diet-induced lipid accumulation in the liver and reduce plasma triacylglycerol levels (41). We did not detect any association between CES1 expression and LDL or triglycerides, however, there was a positive correlation with the FLI index. To further describe the association with the disease, the expression of the circulating proteome was also evaluated in a group of patients with different grades of liver steatosis.
The relevance of 15 biomarkers was highlighted by their distribution according to the extent of fat accumulation, with a progressive increase in the expression of all candidates with steatosis. In addition to those 15 candidates, SIGLEC7 was associated with the progression of steatosis from grade 1 to grade 3 (p< 0.01). It is noteworthy that SIGLEC7 expression in subjects with steatosis grades 2 and 3 was higher compared to subjects without steatosis or with steatosis grade 1. In parallel, DDP7 was higher in the group with grade 3 steatosis suggesting that these candidates perform better in discriminating subjects with more severe steatosis. Both proteins participate in immune system-related pathways. SIGLEC 7 has a sialic acid binding activity involved in cell adhesion and it is expressed in immune cells, while DPP7 is involved in the maintenance of quiescent lymphocytes (42, 43). A recent report showed that SIGLEC7, released in serum from macrophages, was associated with liver fibrosis and was used as a diagnostic biomarker in patients with MAFLD/MASH (44). This can explain why SIGLEC7 level was higher in advanced steatosis where fibrosis is more frequent (45). Similarly, in a proteomic study conducted in a mouse model of Niemann-Pick type C disease (NPCD), an alteration in proteins involved in pathways of liver damage, lipid metabolism, and inflammation was observed, including DPP7 (46, 47), suggesting a possible role of this protein in more advanced stages of liver damage.
In this study, we evaluated the discriminatory potential of the 15 protein candidates in the detection of liver steatosis in individuals with PWS. When a logistic regression model including QDPR, CANT1, TYMP, THOP1, and ALDH1A1 was constructed the model exhibited an AUC of 0.93 (95% CI: 0.63-0.99), with a sensitivity of 93% and specificity of 80%, highlighting the potential of these proteins as biomarkers for the detection of liver steatosis in PWS. Interestingly, these biomarkers well correlated in the serum of individuals with PWS and they are part of a cellular network connecting several metabolic pathways, including 5-Hydroxytryptamine biosynthesis, Salvage pyrimidine deoxyribonucleotides, Tetrahydrofolate biosynthesis, Pyrimidine Metabolism, Salvage pyrimidine ribonucleotides, Beta2 adrenergic receptor signaling pathway, and Beta1 adrenergic receptor signaling pathway.
Consistently, 5-Hydroxytryptamine (5-HT) has been demonstrated to regulate lipid metabolism in the liver through the activation of the mTOR pathway (48, 49). In rats with a high-fat diet or exposed to 5-HT was observed an overproduction of hepatic triglycerides and VLDL determining liver steatosis and hyperlipidemia (50). In our study, we observed a significant positive correlation between the selected 5 protein biomarkers included in the logistic model and various clinical variables associated with liver diseases, such as cholesterol levels, LDL, triglycerides, transaminase levels, and HbA1c. Important to considered is the possible alteration of the 5-HT pathway in individuals with PWS.
By using an imprinting center deletion mouse model for PWS (PWSICdel), Davies and colleagues (2019) demonstrated the abnormal serotonin 2C receptor (5-HT2CR) function in this genetic syndrome (51, 52). Since alterations in the 5-HT pathway may have a role in both neuro-behavioral and lipid metabolism alterations, it would be of particular interest to compare individuals with PWS with a group of non-syndromic patients with obesity to further decipher the role of the selected biomarkers in this particular disease.
Disruption of pyrimidine metabolism was associated with lipid accumulation in the liver (53) and the role of β-adrenergic receptors activation was shown in the increased hepatic lipid accumulation, due to new synthesis or lipogenesis (54, 55). This evidence strengthens our results and sustains the potential role of the selected biomarkers in detecting liver steatosis in these patients.
Our study has some limitations. Firstly, histological confirmation of hepatic steatosis was not performed, as a liver biopsy is invasive, scarcely acceptable by these individuals, and has potential complications. Instead, we relied on non-invasive imaging and blood biomarker assessments as screening tools (56). Secondly, the sample size of our PWS group was relatively small, reflecting the rarity of the syndrome and the challenges in recruiting a larger number of patients. Additionally, our study design was cross-sectional, lacking longitudinal data or follow-up information on the patients. Despite these limitations, our study highlights the significance of circulating proteome profiling in PWS and underscores the potential utility of these identified proteins as valuable biomarkers for the diagnosis and management of steatosis in this patient population. Further validation and replication of our findings are warranted in larger and independent cohorts of individuals with PWS. Additionally, longitudinal-associated studies are needed to investigate the potential of these biomarkers in predicting disease progression and treatment response. Early diagnosis and intervention can help to prevent or slow down the progression of liver disease and associated complications, leading to better clinical outcomes. By regularly monitoring the levels of these biomarkers, healthcare professionals can detect the presence of liver steatosis at an early stage, even before the manifestation of overt symptoms or significant liver damage. Early intervention, such as lifestyle modifications and targeted therapeutic interventions, can then be implemented to mitigate the progression of liver steatosis and associated complications in individuals with PWS.
The original contributions presented in the study are included in the article/Supplementary Material. Further inquiries can be directed to the corresponding author.
The studies involving humans were approved by ethics Committee of Istituto Auxologico Italiano Milan, Italy (ethical committee code: CE: 2022_03_15_07; research code: 01C216; acronym: PROTEOMARKER. The studies were conducted in accordance with the local legislation and institutional requirements. The participants provided their written informed consent to participate in this study.
DP: Conceptualization, Data curation, Formal Analysis, Investigation, Methodology, Supervision, Writing – original draft, Writing – review & editing. PG: Conceptualization, Data curation, Formal Analysis, Investigation, Methodology, Supervision, Writing – original draft, Writing – review & editing. CB: Conceptualization, Investigation, Methodology, Writing – original draft, Writing – review & editing. SG: Conceptualization, Investigation, Methodology, Writing – review & editing. CT: Conceptualization, Supervision, Writing – original draft, Writing – review & editing. AB: Data curation, Investigation, Methodology, Writing – review & editing. DC: Data curation, Investigation, Methodology, Writing – review & editing. AM: Investigation, Methodology, Writing – review & editing. GG: Data curation, Investigation, Methodology, Writing – review & editing. AS: Conceptualization, Funding acquisition, Investigation, Project administration, Resources, Supervision, Writing – original draft, Writing – review & editing.
This work was supported by the Italian Ministry of Health – ricerca corrente. DP was supported from Programma di Cooperazione Interreg V-A Italia-Slovenia 2014-2020 - Bando mirato per progetti standard n. 07/2019 - Progetto “C3B” CUP J95F19000490006, and an intramural grant from the Italian Liver Foundation. PJG was sponsored by a fellowship from Area Science Park concerning the project QuB – Quantum Behavior in Biological Function funded by MUR (CUP J95F21002820001).
The authors declare that the research was conducted in the absence of any commercial or financial relationships that could be construed as a potential conflict of interest.
All claims expressed in this article are solely those of the authors and do not necessarily represent those of their affiliated organizations, or those of the publisher, the editors and the reviewers. Any product that may be evaluated in this article, or claim that may be made by its manufacturer, is not guaranteed or endorsed by the publisher.
The Supplementary Material for this article can be found online at: https://www.frontiersin.org/articles/10.3389/fendo.2023.1254778/full#supplementary-material
Supplementary Figure 1 | Expression of circulating biomarkers in different human tissues. The heatmap was generated in the GTEx data portal reporting the expression levels of the biomarker candidates in different tissues. Deep blue colors indicate higher mRNA expression levels. While light yellow colors indicate lower mRNA expression levels. Unsupervised hierarchical clustering was used to order genes and tissues.
Supplementary Figure 2 | Receiver operating characteristic (ROC) analysis for the selected logistic model. The bootstrap analysis with out of bag prediction was used to validate the logistic regression model (-34.19 + 0.85 * QDPR*QDPR + 0.75 * CANT1*TYMP - 0.46 * THOP1*ALDH1A1.) in a synthetic dataset. The logistic model was able to discriminate the presence of steatosis with an AUC of 0.83, with a sensitivity of 0.81 and a specificity of 0.87.
1. Butler MG, Hartin SN, Hossain WA, Manzardo AM, Kimonis V, Dykens E, et al. Molecular genetic classification in Prader-Willi syndrome: a multisite cohort study. J Med Genet (2019) 56:149–53. doi: 10.1136/jmedgenet-2018-105301
2. Angulo MA, Butler MG, Cataletto ME. Prader-Willi syndrome: a review of clinical, genetic, and endocrine findings. J Endocrinol Invest (2015) 38:1249–63. doi: 10.1007/s40618-015-0312-9
3. Pacoricona Alfaro DL, Lemoine P, Ehlinger V, Molinas C, Diene G, Valette M, et al. Causes of death in Prader-Willi syndrome: lessons from 11 years’ experience of a national reference center. Orphanet J Rare Dis (2019) 14:238. doi: 10.1186/s13023-019-1214-2
4. Cassidy SB, Schwartz S, Miller JL, Driscoll DJ. Prader-willi syndrome. Genet Med (2012) 14:10–26. doi: 10.1038/gim.0b013e31822bead0
5. Tauber M, Hoybye C. Endocrine disorders in Prader-Willi syndrome: a model to understand and treat hypothalamic dysfunction. Lancet Diabetes Endocrinol (2021) 9:235–46. doi: 10.1016/S2213-8587(21)00002-4
6. Grugni G, Crinò A, Bedogni G, Cappa M, Sartorio A, Corrias A, et al. Metabolic syndrome in adult patients with Prader-Willi syndrome. Nutr Metab Cardiovasc Dis (2013) 23:1134–40. doi: 10.1016/j.numecd.2012.11.006
7. Marzullo P, Marcassa C, Campini R, Eleuteri E, Minocci A, Priano L, et al. The impact of growth hormone/insulin-like growth factor-I axis and nocturnal breathing disorders on cardiovascular features of adult patients with Prader-Willi syndrome. J Clin Endocrinol Metab (2005) 90:5639–46. doi: 10.1210/jc.2005-0829
8. Theodoro MF, Talebizadeh Z, Butler MG. Body composition and fatness patterns in Prader-Willi syndrome: comparison with simple obesity. Obes (Silver Spring) (2006) 14:1685–90. doi: 10.1038/oby.2006.193
9. Goldstone AP, Thomas EL, Brynes AE, Bell JD, Frost G, Saeed N, et al. Visceral adipose tissue and metabolic complications of obesity are reduced in Prader-Willi syndrome female adults: evidence for novel influences on body fat distribution. J Clin Endocrinol Metab (2001) 86:4330–8. doi: 10.1210/jcem.86.9.7814
10. Talebizadeh Z, Butler MG. Insulin resistance and obesity-related factors in Prader-Willi syndrome: comparison with obese subjects. Clin Genet (2005) 67:230–9. doi: 10.1111/j.1399-0004.2004.00392.x
11. Fintini D, Grugni G, Bocchini S, Brufani C, Di Candia S, Corrias A, et al. Disorders of glucose metabolism in Prader-Willi syndrome: Results of a multicenter Italian cohort study. Nutr Metab Cardiovasc Dis (2016) 26:842–7. doi: 10.1016/j.numecd.2016.05.010
12. Fintini D, Inzaghi E, Colajacomo M, Bocchini S, Grugni G, Brufani C, et al. Non-Alcoholic Fatty Liver Disease (NAFLD) in children and adolescents with Prader-Willi Syndrome (PWS). Pediatr Obes (2016) 11:235–8. doi: 10.1111/ijpo.12052
13. Bedogni G, Grugni G, Nobili V, Agosti F, Saezza A, Sartorio A. Is non-alcoholic fatty liver disease less frequent among women with Prader-Willi syndrome? Obes Facts (2014) 7:71–6. doi: 10.1159/000358570
14. Tanaka M, Takahashi S, Higashiura Y, Sakai A, Koyama M, Saitoh S, et al. Circulating level of fatty acid-binding protein 4 is an independent predictor of metabolic dysfunction-associated fatty liver disease in middle-aged and elderly individuals. J Diabetes Investig (2022) 13:878–88. doi: 10.1111/jdi.13735
15. Suh J-B, Kim SM, Cho G-J, Choi KM. Serum AFBP levels are elevated in patients with nonalcoholic fatty liver disease. Scand J Gastroenterol (2014) 49:979–85. doi: 10.3109/00365521.2013.836754
16. Furuhashi M, Saitoh S, Shimamoto K, Miura T. Fatty acid-binding protein 4 (FABP4): pathophysiological insights and potent clinical biomarker of metabolic and cardiovascular diseases. Clin Med Insights Cardiol (2015) 8:23–33. doi: 10.4137/CMC.S17067
17. Graham TE, Yang Q, Blüher M, Hammarstedt A, Ciaraldi TP, Henry RR, et al. Retinol-binding protein 4 and insulin resistance in lean, obese, and diabetic subjects. N Engl J Med (2006) 354:2552–63. doi: 10.1056/NEJMoa054862
18. Kishida K, Funahashi T, Shimomura I. Adiponectin as a routine clinical biomarker. Best Pract Res Clin Endocrinol Metab (2014) 28:119–30. doi: 10.1016/j.beem.2013.08.006
19. Lu C-W, Yang K-C, Chi Y-C, Wu T-Y, Chiang C-H, Chang H-H, et al. Adiponectin-leptin ratio for the early detection of lean non-alcoholic fatty liver disease independent of insulin resistance. Ann Med (2023) 55:634–42. doi: 10.1080/07853890.2023.2179106
20. Anstee QM, Lawitz EJ, Alkhouri N, Wong VW-S, Romero-Gomez M, Okanoue T, et al. Noninvasive tests accurately identify advanced fibrosis due to NASH: baseline data from the STELLAR trials. Hepatology (2019) 70:1521–30. doi: 10.1002/hep.30842
21. Sattar N, Forrest E, Preiss D. Non-alcoholic fatty liver disease. BMJ (2014) 349:g4596. doi: 10.1136/bmj.g4596
22. Niu L, Geyer PE, Wewer Albrechtsen NJ, Gluud LL, Santos A, Doll S, et al. Plasma proteome profiling discovers novel proteins associated with non-alcoholic fatty liver disease. Mol Syst Biol (2019) 15:e8793. doi: 10.15252/msb.20188793
23. Govaere O, Hasoon M, Alexander L, Cockell S, Tiniakos D, Ekstedt M, et al. A proteo-transcriptomic map of non-alcoholic fatty liver disease signatures. Nat Metab (2023) 5:572–8. doi: 10.1038/s42255-023-00775-1
24. Luo Y, Wadhawan S, Greenfield A, Decato BE, Oseini AM, Collen R, et al. SOMAscan proteomics identifies serum biomarkers associated with liver fibrosis in patients with NASH. Hepatol Commun (2021) 5:760–73. doi: 10.1002/hep4.1670
25. Saadeh S, Younossi ZM, Remer EM, Gramlich T, Ong JP, Hurley M, et al. The utility of radiological imaging in nonalcoholic fatty liver disease. Gastroenterology (2002) 123:745–50. doi: 10.1053/gast.2002.35354
26. Palmentieri B, de Sio I, La Mura V, Masarone M, Vecchione R, Bruno S, et al. The role of bright liver echo pattern on ultrasound B-mode examination in the diagnosis of liver steatosis. Dig Liver Dis (2006) 38:485–9. doi: 10.1016/j.dld.2006.03.021
27. Bellarosa C, Bedogni G, Bianco A, Cicolini S, Caroli D, Tiribelli C, et al. Association of serum bilirubin level with metabolic syndrome and non-alcoholic fatty liver disease: A cross-sectional study of 1672 obese children. J Clin Med (2021) 10:2812. doi: 10.3390/jcm10132812
28. Lundberg M, Eriksson A, Tran B, Assarsson E, Fredriksson S. Homogeneous antibody-based proximity extension assays provide sensitive and specific detection of low-abundant proteins in human blood. Nucleic Acids Res (2011) 39:e102. doi: 10.1093/nar/gkr424
29. R Core Team. R Foundation for Statistical Computing. Vienna: R: A Language and Environment for Statistical Computing (2021). Available at: https://wwwR-project.org.
30. Schemper M. Predictive accuracy and explained variation. Stat Med (2003) 22:2299–308. doi: 10.1002/sim.1486
31. Tian L, Cai T. Model evaluation based on the sampling distribution of estimated absolute prediction error. Biometrika (2007) 94:297–311. doi: 10.1093/biomet/asm036
32. Carl R. Bacon. In: Practical Portfolio Performance Measurement and Attribution, 2nd ed (2008). Toronto, Canada: John Wiley & Sons Ltd.
34. Mele C, Grugni G, Mai S, Vietti R, Aimaretti G, Scacchi M, et al. Circulating angiopoietin-like 8 (ANGPTL8) is a marker of liver steatosis and is negatively regulated by Prader-Willi Syndrome. Sci Rep (2017) 7:3186. doi: 10.1038/s41598-017-03538-7
35. Xie Y, Kong W, Wang X, Wu Z. Association of glycated hemoglobin with non-alcoholic fatty liver disease patients and the severity of liver steatosis and fibrosis measured by transient elastography in adults without diabetes. BMC Endocr Disord (2022) 22:220. doi: 10.1186/s12902-022-01134-z
36. Jung C-H, Lee B, Choi D-H, Jung S-H, Kim B-Y, Kim C-H, et al. Association of grade of non-alcoholic fatty liver disease and glycated albumin to glycated hemoglobin ratio in patients with type 2 diabetes mellitus. Diabetes Res Clin Pract (2017) 125:53–61. doi: 10.1016/j.diabres.2016.12.017
37. Zupo R, Castellana F, Panza F, Castellana M, Lampignano L, Cincione RI, et al. Non alcoholic fatty liver disease is positively associated with increased glycated haemoglobin levels in subjects without diabetes. J Clin Med (2021) 10:1695. doi: 10.3390/jcm10081695
38. Marrades MP, González-Muniesa P, Martínez JA, Moreno-Aliaga MJ. A dysregulation in CES1, APOE and other lipid metabolism-related genes is associated to cardiovascular risk factors linked to obesity. Obes Facts (2010) 3:312–8. doi: 10.1159/000321451
39. Nagashima S, Yagyu H, Takahashi N, Kurashina T, Takahashi M, Tsuchita T, et al. Depot-specific expression of lipolytic genes in human adipose tissues–association among CES1 expression, triglyceride lipase activity and adiposity. J Atheroscler Thromb (2011) 18:190–9. doi: 10.5551/jat.6478
40. Chen Bb, Yan Jh, Zheng J, Peng Hw, Cai Xl, Pan Xt, et al. Copy number variation in the CES1 gene and the risk of non-alcoholic fatty liver in a Chinese Han population. Sci Rep (2021) 11:13984. doi: 10.1038/s41598-021-93549-2
41. Lian J, Bahitham W, Panigrahi R, Nelson R, Li L, Watts R, et al. Genetic variation in human carboxylesterase CES1 confers resistance to hepatic steatosis. Biochim Biophys Acta Mol Cell Biol Lipids (2018) 1863:688–99. doi: 10.1016/j.bbalip.2018.04.002
42. Nicoll G, Ni J, Liu D, Klenerman P, Munday J, Dubock S, et al. Identification and characterization of a novel siglec, siglec-7, expressed by human natural killer cells and monocytes. J Biol Chem (1999) 274:34089–95. doi: 10.1074/jbc.274.48.34089
43. Chiravuri M, Schmitz T, Yardley K, Underwood R, Dayal Y, Huber BT. A novel apoptotic pathway in quiescent lymphocytes identified by inhibition of a post-proline cleaving aminodipeptidase: a candidate target protease, quiescent cell proline dipeptidase. J Immunol (1999) 163:3092–9. doi: 10.4049/jimmunol.163.6.3092
44. Yoshio S, Kanto T. Macrophages as a source of fibrosis biomarkers for non-alcoholic fatty liver disease. Immunol Med (2021) 44:175–86. doi: 10.1080/25785826.2020.1868664
45. Hardy T, McPherson S. Imaging-based assessment of steatosis, inflammation and fibrosis in NAFLD. Curr Hepatol Rep (2017) 16:298–307. doi: 10.1007/s11901-017-0368-4
46. Balboa E, Marín T, Oyarzún JE, Contreras PS, Hardt R, van den Bosch T, et al. Proteomic analysis of niemann-pick type C hepatocytes reveals potential therapeutic targets for liver damage. Cells (2021) 10:2159. doi: 10.3390/cells10082159
47. Hu X, Jiang J, Ni C, Xu Q, Ye S, Wu J, et al. HBV integration-mediated cell apoptosis in hepG2.2.15. J Cancer (2019) 10:4142–50. doi: 10.7150/jca.30493
48. Nocito A, Dahm F, Jochum W, Jang JH, Georgiev P, Bader M, et al. Serotonin mediates oxidative stress and mitochondrial toxicity in a murine model of nonalcoholic steatohepatitis. Gastroenterology (2007) 133:608–18. doi: 10.1053/j.gastro.2007.05.019
49. Osawa Y, Kanamori H, Seki E, Hoshi M, Ohtaki H, Yasuda Y, et al. l-tryptophan-mediated enhancement of susceptibility to nonalcoholic fatty liver disease is dependent on the mammalian target of rapamycin*. J Biol Chem (2011) 286:34800–8. doi: 10.1074/jbc.M111.235473
50. Li X, Guo K, Li T, Ma S, An S, Wang S, et al. 5-HT 2 receptor mediates high-fat diet-induced hepatic steatosis and very low density lipoprotein overproduction in rats. Obes Res Clin Pract (2018) 12:16–28. doi: 10.1016/j.orcp.2016.03.015
51. Davies JR, Wilkinson LS, Isles AR, Humby T. Prader-Willi syndrome imprinting centre deletion mice have impaired baseline and 5-HT2CR-mediated response inhibition. Hum Mol Genet (2019) 28:3013–23. doi: 10.1093/hmg/ddz100
52. Morabito MV, Abbas AI, Hood JL, Kesterson RA, Jacobs MM, Kump DS, et al. Mice with altered serotonin 2C receptor RNA editing display characteristics of Prader-Willi syndrome. Neurobiol Dis (2010) 39:169–80. doi: 10.1016/j.nbd.2010.04.004
53. Le TT, Ziemba A, Urasaki Y, Hayes E, Brotman S, Pizzorno G. Disruption of uridine homeostasis links liver pyrimidine metabolism to lipid accumulation. J Lipid Res (2013) 54:1044–57. doi: 10.1194/jlr.M034249
54. Ghosh PM, Shu Z-J, Zhu B, Lu Z, Ikeno Y, Barnes JL, et al. Role of β-adrenergic receptors in regulation of hepatic fat accumulation during aging. J Endocrinol (2012) 213:251–61. doi: 10.1530/JOE-11-0406
55. Shi Y, Pizzini J, Wang H, Das F, Abdul Azees PA, Ghosh Choudhury G, et al. β2-Adrenergic receptor agonist induced hepatic steatosis in mice: modeling nonalcoholic fatty liver disease in hyperadrenergic states. Am J Physiol Endocrinol Metab (2021) 321:E90–E104. doi: 10.1152/ajpendo.00651.2020
Keywords: proteomics, proteome, circulating biomarkers, PWS, steatosis, cardiovascular, metabolic, MAFLD CDH2
Citation: Pascut D, Giraudi PJ, Banfi C, Ghilardi S, Tiribelli C, Bondesan A, Caroli D, Minocci A, Grugni G and Sartorio A (2023) Proteome profiling identifies circulating biomarkers associated with hepatic steatosis in subjects with Prader-Willi syndrome. Front. Endocrinol. 14:1254778. doi: 10.3389/fendo.2023.1254778
Received: 07 July 2023; Accepted: 13 October 2023;
Published: 15 November 2023.
Edited by:
Amanda Brandon, The University of Sydney, AustraliaReviewed by:
Zeming Wu, iPhenome Biotechnology (Dalian) Inc., ChinaCopyright © 2023 Pascut, Giraudi, Banfi, Ghilardi, Tiribelli, Bondesan, Caroli, Minocci, Grugni and Sartorio. This is an open-access article distributed under the terms of the Creative Commons Attribution License (CC BY). The use, distribution or reproduction in other forums is permitted, provided the original author(s) and the copyright owner(s) are credited and that the original publication in this journal is cited, in accordance with accepted academic practice. No use, distribution or reproduction is permitted which does not comply with these terms.
*Correspondence: Devis Pascut, ZGV2aXMucGFzY3V0QGZlZ2F0by5pdA==
†These authors have contributed equally to this work and share first authorship
Disclaimer: All claims expressed in this article are solely those of the authors and do not necessarily represent those of their affiliated organizations, or those of the publisher, the editors and the reviewers. Any product that may be evaluated in this article or claim that may be made by its manufacturer is not guaranteed or endorsed by the publisher.
Research integrity at Frontiers
Learn more about the work of our research integrity team to safeguard the quality of each article we publish.